 Open Access Article
Creative Commons Attribution 3.0 Unported Licence
Synthesis of CrOx/C catalysts for low temperature NH3-SCR with enhanced regeneration ability in the presence of SO2†
Shuohan Yuab,
Sheng Xuc,
Bowen Sunab,
Yiyang Luab,
Lulu Liab,
Weixin Zouab,
Peng Wangc,
Fei Gao *ab,
Changjin Tangab and
Lin Dong
 *ab
*ab
aKey Laboratory of Mesoscopic Chemistry of MOE, School of Chemistry and Chemical Engineering, Nanjing University, Nanjing 210093, PR China. E-mail: donglin@nju.edu.cn; gaofei@nju.edu.cn
bJiangsu Key Laboratory of Vehicle Emissions Control, Center of Modern Analysis, Nanjing University, Nanjing 210093, PR China
cNational Laboratory of Solid State Microstructures, College of Engineering and Applied Sciences, Collaborative Innovation Center of Advanced Microstructures, Nanjing University, Nanjing 210093, China
First published on 22nd January 2018
Abstract
Chromium oxide nano-particles with an average diameter of 3 nm covered by amorphous carbon (CrOx/C) were successfully synthesized. The synthesized CrOx/C materials were used for the selective catalytic reduction of NOx by NH3 (NH3-SCR), which shows superb NH3-SCR activity and in particular, satisfactory regeneration ability in the presence of SO2 compared with Mn-based catalysts. The as-prepared catalysts were characterized by XRD, HRTEM, Raman, FTIR, BET, TPD, TPR, XPS and in situ FTIR techniques. The results indicated presence of certain amounts of unstable lattice oxygen exposed on the surface of CrOx nano-particles with an average size of 3 nm in the CrOx/C samples, which led to NO being conveniently oxidized to NO2. The formed NO2 participated in NH3-SCR activity, reacting with catalysts via a “fast NH3-SCR” pathway, which enhanced th NH3-SCR performance of the CrOx/C catalysts. Furthermore, the stable lattice of the CrOx species made the catalyst immune to the sulfation process, which was inferred to be the cause of its superior regeneration ability in the presence of SO2. This study provides a simple way to synthesize stable CrOx nano-particles with active oxygen, and sheds light on designing NH3-SCR catalysts with highly efficient low temperature activity, SO2 tolerance, and regeneration ability.
1. Introduction
Low-temperature NH3-SCR (<200 °C), which can be located downstream of electrostatic precipitators and even desulfurizers, where most of SO2 and dust have been removed, has been paid increasing attention in the past few decades.1–4 Various transition metal oxides exhibit satisfactory activity for low-temperature NH3-SCR, such as Mn, Fe, Cu, and Co.2,5–9 Among them, Mn-based catalysts have become a focus for their excellent low-temperature activity and inherent environment-friendly nature.4,10–12 According to literature, Mn-based catalysts have a unique advantage for low-temperature SCR (<200 °C) in contrast with other competitors. For example, Hu et al. reported a Co–Mn/TiO2 catalyst with superior NH3-SCR activity at 200 °C.11 Mn–Ce–Ti mix-oxide catalysts were recorded to exhibit an operating temperature window from 150 °C to 200 °C.12 We also reported Mn–Fe–Ti mix-oxide catalysts with satisfactory NH3-SCR activity from 100 °C to 350 °C.5 However, the poor SO2 resistance performance of Mn-based catalysts limits their practical application.According to the previous reports,4,13–15 the tolerance of metal oxide based catalysts to SO2 depends on the type and oxidation state of the deposited metal, the nature of the support, and the type of reducing agent. In general, the rapid deactivation of NH3-SCR catalysts involves two main mechanisms. One is the formation of ammonium salts.14,16–22 The SO2 in the feed gas can be oxidized to SO3 on the surface of the catalysts, and the formed SO3 would respond to NH3 and water in feed gas transforming to NH4HSO4. The formed NH4HSO4 would deposit on the surface of the catalysts, cover active sites, block pores of the catalysts, and result in the deactivation of the catalysts. The other fact is the irreversible sulfation of the active phase.14,16,18–23 For most transition metal oxides usually reported as NH3-SCR catalysts, such as Mn, Fe, Cu, and Co, all sulfating processes are spontaneous according to their Gibbs free energy values (Table S1†). In the sulfation process, formation of a metal sulfate requires breaking the metal oxide lattice. It is reasonable to predict that the more stable the metal oxides, the more difficult it is to break the metal oxide lattice and thus, harder is the sulfation of metal oxide. In general, the metal oxide with a high melting point has a stable crystal lattice. Thus, the melting point can be an indicator of the stability of the crystal lattice of metal oxides.24 In the case of Mn-based catalysts, MnO2 has a low melting point (Table S1†), indicating its unstable structure, which is the cause of the severe irreversible sulfation of MnO2 in the NH3-SCR process, particularly in the low temperature range (<200 °C).13,14,25–28 Cr2O3, which has the highest melting point among the transition metal oxides with NH3-SCR activity (listed in Table S1†), was expected to have resistance to the sulfation process. Although the low NH3-SCR activity of crystalline Cr2O3 is unsatisfactory, amorphous Cr2O3 exhibits superb low temperature NH3-SCR activity, according to literature.29–33 Thus, it appears to be a promising strategy to design a SCR catalyst with both low temperature activity and SO2 tolerance via enhancing the catalytic activity of crystalline Cr2O3.
Compared with traditional metal oxide catalysts with a large particle size, nano-sized catalysts often have significant amounts of unsaturated-coordinated atoms exposed on their surfaces. Unsaturated-coordinated atoms are usually active; thus, nano-sized catalysts exhibit unique redox ability and enhanced catalytic activity.34–36 Therefore, decreasing the size of catalysts appears to be a promising strategy to enhance low temperature NH3-SCR performance of crystalline Cr2O3. However, nano-particle materials have the disadvantage of instability and tend to aggregate due to their high surface energy and their abundant surface unsaturated atoms. Recently, metal oxide nano-particles catalysts derived from MOFs material were reported.37–39 Through a thermal decomposition process under controlled atmosphere, MOFs built from metal ions or nodes and polyfunctional organic ligands can transform into nano-materials, including nano-particles, single atoms, and metal oxide clusters. Wu et al.40 synthesized Co nano-particles and single atoms from Co MOF and Co/Zn bimetallic MOF. Similar results were also reported by Li et al.37 and Sun's group.41 The carbon from the organic ligands of MOFs remains in materials and can protect metal oxide nano-particles from aggregation.
Herein, novel CrOx nano-particles covered by amorphous carbon (CrOx/C) have been synthesized by a MOFs assisted process for low temperature NH3-SCR. MIL-101, with a metal node of 3 Cr atoms,42,43 was employed as a precursor. The results of the catalytic tests for NH3-SCR showed that the prepared CrOx catalyst exhibited satisfactory activity and superior regeneration ability. According to a series of characterizations, the CrOx/C catalyst was observed to be composed of CrOx nano-particles with an eskolaite phase and activated lattice oxygen. It was deduced that the activated lattice oxygen was closely related to the enhanced NH3-SCR activity of the CrOx/C catalyst. The stable lattice of the eskolaite phase-CrOx inhibited the sulfating process, thus causing the SO2 tolerance and regeneration ability. To the best of our knowledge, it is the first time that a non-Mn catalyst with excellent low temperature NH3-SCR activity and remarkable regeneration ability has been reported. This study provides a simple route to synthesize stable CrOx nano-particles with active oxygen and shed light on designing low temperature NH3-SCR catalysts with SO2 tolerance and regeneration ability.
2. Experimental details
2.1. Preparation of catalysts
Typically, MIL-101(Cr) was prepared by reacting terephthalic acid (332 mg, 2.0 mmol) with Cr(NO3)3·9H2O (800 mg, 2.0 mmol) and de-ionized water (9.5 mL) at 220 °C for 8 h. Microcrystalline green powders of MIL-101(Cr) were produced during the reaction. The obtained powders were washed by ammonium hydroxide, water, and ethanol, in sequence, 3 times each. The powders were dried and calcined at a certain temperature for 4 h under N2 flow, and the heating rate was set at 1 °C min−1. Finally, the cooled sample was exposed to air and denoted as Cr2O3/C-X, in which X represents the calcining temperature.As reported in ref. 44, a Cr2O3 sample was obtained by calcining Cr(NO3)3·9H2O at 450 °C for 4 h. MnO2 was purchased from Aladdin and was used without further purification. An active carbon supported Cr2O3 catalyst was synthesized through a wetness impregnation process. Active carbon (1.00 g) was dispersed into de-ionized water (50 mL) containing Cr(NO3)3·9H2O (9.92 g). The turbid solution was oil-bath heated at 110 °C until the water was totally evaporated. The dried powders were calcined at 450 °C for 4 h under a N2 flow and the obtained sample was noted as Cr2O3/C-WI.
2.2. Characterizations
The X-ray diffraction (XRD) patterns of the catalysts were studied using an XRD-6000 X-ray diffractometer (Shimadzu). X-ray fluorescence (XRF) analysis was performed on an ARL-900 X-ray fluorescence analyzer. FTIR analysis was carried out using a NEXUS870 spectrometer (NICOLET, America). Raman spectra were measured at a resolution of <1 cm−1 using a JY Labram HR 800 spectrophotometer equipped with an argon-ion laser source and an air-cooled CCD detector. N2 adsorption/desorption isotherms of the catalysts were obtained at −196 °C using an ASAP2020 physical adsorption instrument (Micromeritics) to calculate the BET surface area of the catalysts. TEM analysis was performed on a double-aberration corrected Titan™ cubed G2 60-300 S/TEM equipped with Super-X™ technology. X-ray energy dispersive spectroscopy (EDS) mappings were acquired using the Super-X EDS system, which is composed of four silicon drift detectors covering 0.7 s rad collection.NH3-temperature programmed desorption (NH3-TPD) experiments were performed using a multifunction chemisorption analyzer, equipped with a thermal conductivity detector (TCD). Samples were pretreated under a NH3–N2 flow (NH3 1%) at 150 °C for 1 h and were heated under N2 flow; the heating rate was set at 10 °C min−1.
O2-temperature programmed desorption (O2-TPD) experiments were performed using a multifunction chemisorption analyzer, equipped with a thermal conductivity detector (TCD). Samples were pretreated under O2–He flow (O2 25%) at 25 °C for 1 h and were heated under a He flow; the heating rate was set at 10 °C min−1.
H2-temperature programmed reduction (H2-TPR) of the catalysts was recorded using a chemisorption analyzer. Samples were pretreated under a N2 flow at 200 °C for 1 h, and were heated under a H2–Ar flow (H2, 7%); the heating rate was set at 10 °C min−1.
X-ray photoelectron spectroscopy (XPS) measurements were performed using a PHI 5000 VersaProbe spectrophotometer. The contents of the metal ions were measured via an inductive coupled plasma emission spectrometer (Optima 5300DV, PE). Energy referencing was accomplished by setting the adventitious carbon peak to 284.6 eV. The ex situ XPS details are described below. The sample was treated under a certain atmosphere for a certain time in a reaction chamber connected with the intro chamber of the XPS instrument. Following this, the reaction chamber was vacuumized and the treated sample was transferred to the XPS instrument without exposure to air.
The in situ DRIFT experiments were performed on a Nicolet Nexus 5700 FTIR spectrometer using a diffuse reflectance attachment (HARRICK) equipped with a reaction cell (ZnSe windows). The number of scans was 32 at a resolution of 4 cm−1 and the spectra were presented as Kubelka–Munk function, referred to the background spectra of the recorded catalyst in N2.
2.3. NO oxidation tests
The NO oxidation tests were performed in a fixed-bed reactor with 0.2 g catalyst. The feed gas contained 500 ppm NO and 5 vol% O2 with N2 as the balance gas. The total flow rate of the feed gas was 100 mL min−1, corresponding to a space velocity of approximately 30![[thin space (1/6-em)]](https://www.rsc.org/images/entities/char_2009.gif) 000 h−1. Including NO and NO2, the effluent gases were continuously analyzed at 150 °C by an online Thermofisher IS10 FTIR spectrometer equipped with a 2 m path-length gas cell (250 mL volume).
000 h−1. Including NO and NO2, the effluent gases were continuously analyzed at 150 °C by an online Thermofisher IS10 FTIR spectrometer equipped with a 2 m path-length gas cell (250 mL volume).
2.4. NH3-SCR activity, SO2 poisoning, and regeneration tests
The NH3-SCR activity tests were performed in a fixed-bed reactor with 0.2 g catalyst. The feed gas contained 500 ppm NO, 500 ppm NH3, 5 vol% O2, 50 ppm SO2 (when used), 5 vol% H2O (when used) and N2 as the balance gas. The total flow rate of the feed gas was 100 mL min−1, corresponding to a space velocity of approximately 30![[thin space (1/6-em)]](https://www.rsc.org/images/entities/char_2009.gif) 000 h−1. SO2 poisoning and regeneration tests of catalysts were carried out at 150 °C. Including NO, NH3, NO2, and N2O, the effluent gases were continuously analyzed at 150 °C using an online Thermofisher IS10 FTIR spectrometer equipped with a 2 m path-length gas cell (250 mL volume).
000 h−1. SO2 poisoning and regeneration tests of catalysts were carried out at 150 °C. Including NO, NH3, NO2, and N2O, the effluent gases were continuously analyzed at 150 °C using an online Thermofisher IS10 FTIR spectrometer equipped with a 2 m path-length gas cell (250 mL volume).
2.5. Regeneration of SO2 poisoned catalysts
SO2 poisoned catalysts were regenerated at 300 °C for 30 min, and then were cooled down to room temperature. All the heat treatments were carried out under N2 atmosphere.The sulfating of metal oxide catalysts during SO2 poisoning was investigated by inductively coupled plasma-emission spectroscopy (ICP).
The SO2-poisoned catalyst (0.2 g) was washed with deionized water for 5 times. The eluate was collected and diluted to 50 mL. The diluted eluate was investigated by ICP analysis. The contents of metal sulfate mMSO4 were calculated using the equation below.
For Cr oxide, mCr2(SO4)3 = mCr3+ × 0.188
For Mn oxide, mMnSO4 = mMn2+ × 0.137
3. Results and discussion
3.1. NH3-SCR performance, SO2 tolerance, and regeneration
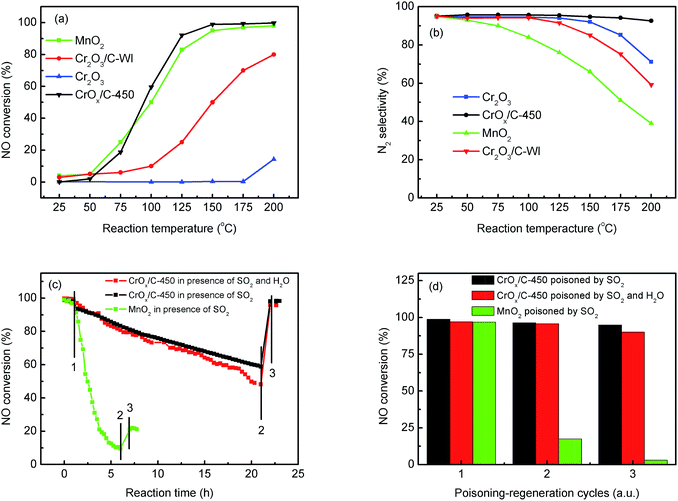
The NH3-SCR activities of the CrOx samples derived from various precursors and MnO2 are shown in Fig. 1 and S1†. As it was anticipated, all the catalysts derived from MIL-101 exhibited superior activities than pure Cr2O3. Remarkably, CrOx/C-450, parallel to MnO2, exhibited a wide operation temperature window from 125 °C to 200 °C. The activity of Cr2O3/C-WI was enhanced compared with pure Cr2O3, while it was much lower than CrOx/C-450. This extraordinarily low temperature NH3-SCR performance makes CrOx/C-450 the best catalyst among all the samples derived from MIL-101. To evaluate the NH3-SCR performances on the catalysts more precisely, the normalized rates per mole transition metal were calculated and the results are displayed in Fig. 2a. The catalytic activity order is CrOx/C-450 > Mn2O3 > Cr2O3/C-WI > Cr2O3. In addition, the apparent active energies of CrOx/C-450 and Cr2O3 based catalysts were obtained when NO conversions were limited to low conversion (Fig. 2b and Table S2†). The apparent active energy of NH3-SCR on the CrOx/C-450 catalyst was lower than those of SCR on Cr2O3/C-WI and Cr2O3, which further confirms the superb catalytic activity of the CrOx/C-450 sample. Based on the kinetics data listed in Tables S3 and S4,† apparent kinetics equations of NH3-SCR on CrOx/C-450 and Cr2O3/C-WI catalysts were obtained (Fig. S2†). For CrOx/C-450, r = [NH3]0.586[NO]0.964 at 150 °C, while for Cr2O3/C-WI, r = [NH3]0.433[NO]0.092. The different reaction rate equations of NH3-SCR on CrOx/C-450 and Cr2O3/C-WI catalysts indicated their different reaction mechanisms, which may result in different NH3-SCR performance of CrOx/C-450 and Cr2O3/C-WI catalysts. The N2 selectivity of CrOx/C-450 remained at a high level (over 90%) in its operation temperature window, while those of Cr2O3 and MnO2 were very poor. This indicated that side reactions such as the formation of N2O hardly occurred on the CrOx/C-450 catalyst. SO2- and H2O-tolerance of CrOx/C-450 was further tested and the results are presented in Fig. 1c and S1c.† CrOx/C-450 exhibited over 80% NO conversion within 24 h in the presence of H2O, indicating its satisfactory water tolerance. When SO2 was introduced into the feed gas, the activity of CrOx/C-450 gradually dropped to 60% within 20 h, while it dropped to 50% in 20 h when SO2 and H2O co-existed in the feed gas. The activity of CrOx/C-450 could be recovered after a heat treatment at a temperature as low as 300 °C. This indicated that the poisoning effect of SO2 on CrOx/C-450 could be accelerated by H2O, while H2O hardly influenced the regeneration ability of CrOx/C-450. In contrast, the MnO2 catalyst deactivated rapidly upon SO2 introduction in 6 h, and this process was irreversible. It was demonstrated that the CrOx/C-450 catalyst has satisfactory SO2-tolerance. The regeneration ability of CrOx/C-450 was further studied. As shown in Fig. 1d, over 90% of the catalytic activity of CrOx/C-450 could be recovered as compared to that of the fresh catalyst after 3 poisoning–regeneration cycles irrespective of whether H2O was introduced by regeneration at 300 °C in flowing N2, while that of MnO2 catalyst dropped dramatically through only 1 poisoning–regeneration cycle, which indicated the remarkable regeneration ability of the CrOx/C-450 sample.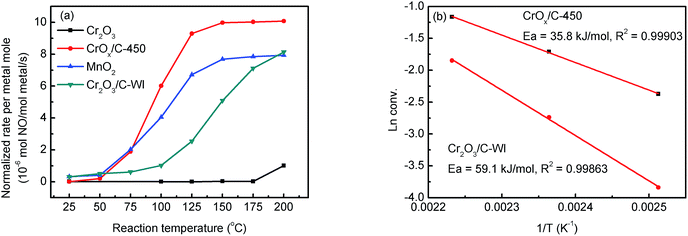 | ||
| Fig. 2 (a) Normalized rates per metal mole of catalysts, (b) apparent active energy of CrOx/C-450 and Cr2O3/C-WI catalysts. | ||
3.2. Structural information
To investigate the NH3-SCR on the catalysts, the structural information of catalysts was necessary. XRD, XRF, FTIR, Raman, and TEM analyses were carried out to investigate the structural properties of the catalysts synthesized from MIL-101(Cr). The XRD patterns of all samples are shown in Fig. S3.† In the XRD pattern of the precursor, sharp and distinct peaks attributed to the MIL-101 phase were detected, which is in agreement with the data reported by Jhung et al.43 When MIL-101 was heated in N2-flow, the XRD peaks of MIL-101 became weak and gradually disappeared with an increase in temperature. When the calcining temperature reached 450 °C, the peaks of the MIL-101 phase disappeared completely and replaced with wide and weak peaks at 24.5°, 33.5°, and 36.1°, which belonged to the (012), (104), and (110) plane, respectively, of the eskolaite phase (PDF#38-1479) as well as Cr2O3/C-WI.45 This indicated that the MIL-101 structure could be destroyed through the calcining process, accompanied with the formation of the eskolaite phase. Furthermore, the CrOx/C-450 sample was found to have a small particle size based on its broad XRD peaks.FTIR and Raman analyses were carried out to study the carbon species in the catalysts. As shown in Fig. S4a,† the bands at 3300 cm−1, 1600 cm−1, and 1400 cm−1 were identified in the FTIR spectra of MIL-101. The broad band at 3300 cm−1 arises due to the stretching vibration of the surface –OH groups. The two bands at 1600 and 1400 cm−1 could be attributed to the stretching vibration of the –COO group of the organic linkers of MIL-101. However, the intensity of bands at 1600 cm−1 and 1400 cm−1 decreased on increasing the calcination temperature. This indicates that the organic linker begins to decompose and carbonize when the calcining temperature increases. The carbonization process was further investigated by Raman analysis (Fig. S4b†). Wide bands at 1360 and 1590 cm−1, corresponding to the D-band and G-band of MIL-101, were detected in the samples calcined at low temperatures, such as 350 and 400 °C. When the calcining temperature increased, the G-band gradually disappeared and the D-band still remained, which indicated the loss of the ordered structure of MOFs and the formation of amorphous carbon. In the spectrum of Cr-550, the G-band disappeared absolutely and only a wide D-band was observed. This illustrates that the organic linker carbonized and transformed to amorphous carbon during the calcining process, which accompanied with the destruction of the MOFs structure.
The elemental contents of catalysts were studied via XRF analysis. Since the organic species in MIL-101 completely transformed to amorphous carbon in CrOx/C-450, as mentioned before, the ignition loss in XRF analysis of CrOx/C-450 was believed to be the result of carbon species burning. Thus, the elemental contents of the catalysts could be calculated from the XPF data and the results are shown in Table 1. The CrOx/C-450 catalyst consisted of 19.2% Cr, 28.7% O, and 52.0% C. As it was designed, the elemental contents of Cr2O3/C-WI were similar to those of CrOx/C-450.
| Sample | Contentsa (wt%) | Elements contents (at%) | Surface areab (m2 g−1 catalyst) | |||||
|---|---|---|---|---|---|---|---|---|
| Cr2O3 | Ignition loss | Cr | O | C | Sample | Carbon supportc | Active material | |
| a Contents of catalysts were obtained from XRF analyses.b Surface areas of catalysts were obtained from N2 adsorption/desorption analyses.c Carbon support of CrOx/C-450 catalyst was obtained by washing CrOx/C-450 using hydrochloric acid. Carbon support of Cr2O3/C-WI is active carbon. | ||||||||
| CrOx/C-450 | 70.2 | 29.8 | 19.2 | 28.7 | 52.0 | 256 | 784 | 20.8 |
| Cr2O3/C-WI | 69.5 | 30.5 | 18.9 | 28.4 | 52.7 | 279 | 897 | 9.9 |
| Cr2O3 | 99.9 | 0.1 | 40.0 | 60.0 | — | 28 | — | — |
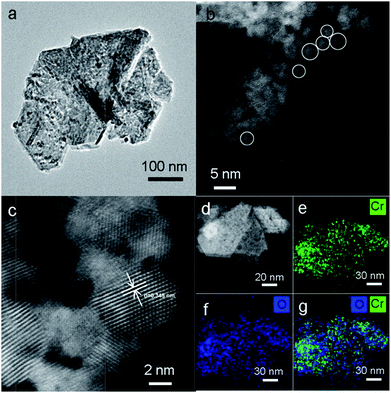
TEM analysis was performed to investigate the structure of MIL-101, CrOx/C-450, and Cr2O3/C-WI. As shown in Fig. S5a,† the MIL-101 with octahedron morphology can be observed distinctly, while it transformed to a hexagonal sheet after calcination (Fig. 3a). Further structural information was obtained via high-angle annual dark field (HAADF) imaging (Fig. 3b). The hexagonal-like sample observed in Fig. 3a was actually an aggregation of nano-particles with an average size of 3 nm. In addition, lattice fringes of d = 0.345 nm were observed (Fig. 3c), corresponding to the eskolaite Cr2O3 (012) crystal plane, which further confirmed that the Cr oxide in the CrOx/C-450 catalyst has the eskolaite phase. From the EDX element mapping analysis (Fig. 3e–g), Cr element and O element were observed to be highly dispersed in the CrOx/C-450 sample and the superimposed image of Cr and O matches the HAADF image. It was estimated that the CrOx/C-450 catalyst was primarily formed by CrOx nano-particles with eskolaite phase as designed in this study. The CrOx/C-450 sample after 3 poisoning–regeneration cycles was also imaged to investigate the stability of the catalyst (Fig. S5b†). The used sample was primarily composed of CrOx nano-particles, similar to the fresh sample, and no major difference in the particle size of Cr2O3 could be observed after 5 deactivation–regeneration circles, which evidently proved the stability of the sample CrOx/C-450. Cr2O3 and Cr2O3/C-WI, however, had a bulk-like shape (Fig. S5c and d†) with average particle sizes of over 100 nm. In the structure of the MIL-101 precursor, metal nodes containing 3 Cr atoms were covered by organic linkers. Therefore, it is reasonable to suggest that CrOx nano-particles in the CrOx/C-450 catalyst stabilized by covering carbon species transformed from organic linkers of MIL-101 after the calcining process.
The feasible mechanism of catalyst synthesis is displayed in Fig. 4. During the calcination process, organic linkers covering Cr nodes carbonized and the structure of MIL-101 gradually destroyed. The amorphous carbon from organic linkers limited the growth of Cr nodes. Finally, when the calcined sample was exposed to air, the remaining Cr nano-particles were oxidized to CrOx nano-particles with eskolaite phase, forming the structure of amorphous carbon covered CrOx nano-particles (CrOx/C).
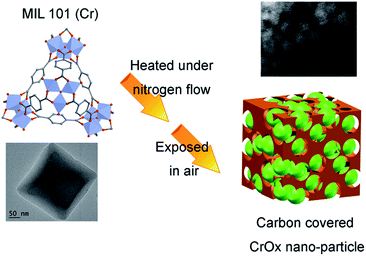 | ||
| Fig. 4 Possible mechanism of catalyst synthesis (green spheres present CrOx nano-particles, brown skolen present amorphous carbon). | ||
3.3. Textural properties of catalysts
As mentioned before, the CrOx/C-450 catalyst was primarily formed by CrOx nano-particles with eskolaite phase and exhibited enhanced NH3-SCR activity and satisfying regeneration ability. To explore the relationship between the structure of CrOx/C-450 and the NH3-SCR performance, the properties of the catalysts were characterized by BET, XPS, H2-TPR, O2-TPD, and NH3-TPD analyses.The surface areas of the catalysts can influence the number of active sites on the catalyst surface, which is considered as an important fact affecting the catalytic activity of NH3-SCR catalysts. The surface areas of CrOx/C-450, Cr2O3, and Cr2O3/C-WI obtained from BET analysis are listed in Table 1. The BET surface areas of CrOx/C-450 and Cr2O3/C-WI are similar and larger than that of Cr2O3. Due to the enhanced NH3-SCR performances of CrOx/C-450 and Cr2O3/C-WI (Fig. 1), it is believed that the enlarged surface area increased the activity of the Cr oxide catalyst. According to the reaction rates normalized by the surface areas of the active material of the catalysts, CrOx/C-450 exhibited comparatively superior NO conversion than Cr2O3/C-WI at 125 °C and 150 °C. This infers that a large surface area is not the only reason for the excellent NH3-SCR activity of CrOx/C-450.
The acidity of the catalysts, which can influence the absorption of reaction agents, is an important factor affecting the NH3-SCR performance of catalysts. This property of catalysts was investigated by NH3-TPD analysis. As displayed in Fig. S6a,† the NH3 desorption behaviours of Cr2O3 and CrOx/C-450 were similar. No distinct NH3 desorption peak was observed from 150 to 400 °C in the profiles of both Cr2O3 and CrOx/C-450 samples, which indicated the weak acidity of these two samples. Therefore, the giant NH3-SCR performance difference between Cr2O3 and CrOx/C is not the result of acidity.
The redox ability of materials is another significant factor influencing the catalytic activity of the NH3-SCR catalyst. H2-TPR method was utilized to discuss this property of the synthesized catalysts. As illustrated in Fig. 5b, Cr2O3 exhibited a single-peak profile. The H2 consumption peak at 343 °C was a result of one-step reduction from Cr6+ to Cr3+, accompanied by the loss of lattice oxygen atoms connected with Cr6+ ions.46 For the CrOx/C-450 sample, the H2 consumption peak shifted to a low temperature, which indicated that CrOx/C-450 exhibited stronger oxidation ability and a higher amount of active lattice oxygen than Cr2O3. In addition, O2-TPD analysis was carried out to investigate the stability of the oxygen atoms of the catalyst; the results are shown in Fig. S6b.† In the profile of Cr2O3, no O2 desorption peak was discovered in the temperature range from 50 °C to 450 °C, which indicates that the oxygen on the surface of Cr2O3 is stable and inert. However, the curve of CrOx/C-450 exhibited an O2 desorption peak from 200 to 350 °C, which was much higher than the desorption temperature of absorbed O2 species recorded earlier.47 Hence, the desorption peak from 200 to 350 °C was believed to correspond to the dissociation of lattice oxygen from CrOx/C-450. This demonstrates that the lattice oxygen of CrOx/C becomes more active and unstable than that of Cr2O3. Remarkably, the CrOx/C catalyst has high surface atom/lattice atom rate for its ultrasmall size as mentioned before. It is reasonable to conclude that the unsaturated surface atoms of CrOx/C cause the unique redox ability exhibited in H2-TPR analysis and the instability of the lattice oxygen atom detected in O2-TPD analysis. Unstable and activated oxygen atoms are inferred to enhance the activity of CrOx/C catalyst.
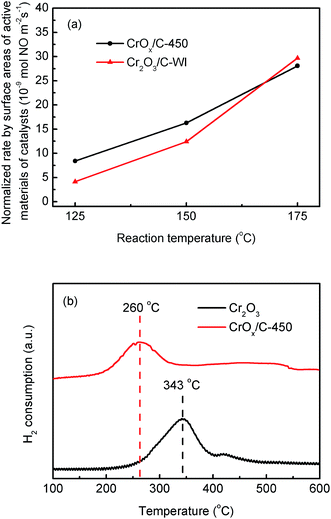 | ||
| Fig. 5 (a) Normalized rates per surface areas of active material of CrOx/C-450 and Cr2O3/C-WI catalysts, (b) H2-TPR result of CrOx/C-450 and bulk Cr2O3. | ||
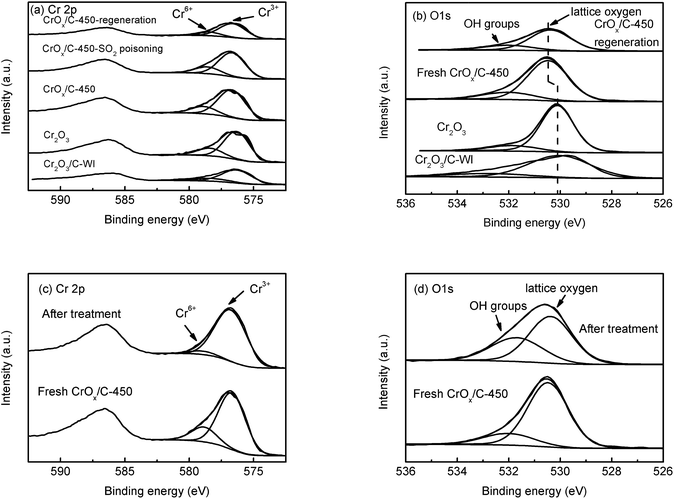
In XPS analysis, Cr 2p spectra (Fig. 6a) of all the samples were comparable. The Cr 2p3/2 peak could be divided into two peaks at 576.7 eV and 578.6 eV, belonging to Cr3+ and Cr6+, respectively.48 The relative contents of Cr3+ and Cr6+ ions were analogous (Table 2), indicating their similar Cr state. The O 1s peak (Fig. 6b) could be separated into two peaks at 530.1 eV and 531.9 eV, attributed to the lattice oxygen and surface –OH groups, respectively.49,50 The relative contents of these two types of oxygen species are also listed in Table 2. The CrOx/C-450 sample exhibited more surface –OH groups than Cr2O3. Notably, the peak belonging to the lattice oxygen of CrOx/C-450 shifts to the high binding energy side, contrasting with that of Cr2O3 and Cr2O3/C-WI. It is evident that the lattice oxygen of CrOx/C-450 carries less negative charge than Cr2O3 and Cr2O3/C-WI. Materials with an ultrasmall size are deemed to have abundant dangling bands and their surface atoms are usually unsaturated-coordinated. In case of CrOx/C-450, some surface oxygen atoms are inferred to be unsaturated coordinated for ultrasmall size of CrOx nano-particles. This unsaturated oxygen is considered to have less negative charge and is expected to be more active than the saturated coordinated oxygen of bulk Cr2O3.
| Sample | Cr 2p | O 1s | ||
|---|---|---|---|---|
| Cr3+a (%) | Cr6+a (%) | OH groupsa (%) | Lattice oxygena (%) | |
| a Relative contents of Cr and O species were calculated from peak areas ratio of divided peaks in XPS spectra. | ||||
| Cr2O3 | 76.74 | 23.26 | 13.39 | 86.61 |
| CrOx/C-450 | 78.86 | 21.14 | 18.36 | 81.64 |
| CrOx/C-450-regeneration | 79.37 | 20.63 | 18.7 | 81.3 |
| CrOx/C-450 ex situ treatment | 94.87 | 5.13 | 36.76 | 63.24 |
| CrOx/C-450-SO2 poisoning | 77.06 | 22.94 | — | — |
Furthermore, to determine whether the lattice oxygen participates in the NH3-SCR reaction, ex situ XPS analysis was carried out. The CrOx/C-450 catalyst was heated under NH3 + NO flow at 150 °C for 1 h; the XPS spectra of CrOx/C-450 before and after treatment are displayed in Fig. 6c and d. In the Cr 2p spectra (Fig. 6c), the peak of Cr6+ at 578.6 eV disappeared after NH3 + NO treatment, while the peak of Cr3+ at 576.7 eV enhanced. This infers that Cr6+ species on the surface of CrOx/C can react with the reagent molecules and eventually get consumed. Moreover, in the O 1s spectra (Fig. 6d), the peak intensity of lattice oxygen at 530.4 eV decreased after treatment, while the intensity of the peak attributed to the surface –OH group at 531.7 eV increased, which indicates the loss of surface lattice oxygen. Therefore, lattice oxygen was believed to take part in the NH3-SCR on the CrOx/C catalyst. Thus, CrOx/C-450, which has more active lattice oxygen, can exhibit enhanced NH3-SCR activity than Cr2O3.
3.4. Mechanism of NH3-SCR on CrOx/C catalyst
In “fast NH3-SCR”, NO catalytically reduced NH3 in assistance of NO2, which was reported to have lower activation energy and enhanced catalytic activity compared with the typical NH3-SCR. Herein, the CrOx/C catalyst was proved to have activated lattice oxygen. It is reasonable to deduce that NO can be oxidized to NO2 by the activated oxygen on the CrOx/C surface, making the NH3-SCR on CrOx/C proceed as the “fast NH3-SCR” pathway. To verify this conjecture, NO oxidation on CrOx/C-450 and Cr2O3/C-WI catalysts was carried out. As displayed in Fig. 7a, NO could be oxidized to NO2 on both CrOx/C-450 and Cr2O3/C-WI. However, the mass of formed NO2 on CrOx/C-450 exceeded as compared to that on Cr2O3/C-WI. Moreover, the normalized rate by surface area of NO oxidation on CrOx/C-450 clearly surpassed that on Cr2O3/C-WI (Fig. 7b). This indicated that NO is more easily oxidized to NO2 on CrOx/C-450 catalyst with activated oxygen, which probably resulted in the superb NH3-SCR performance of CrOx/C-450.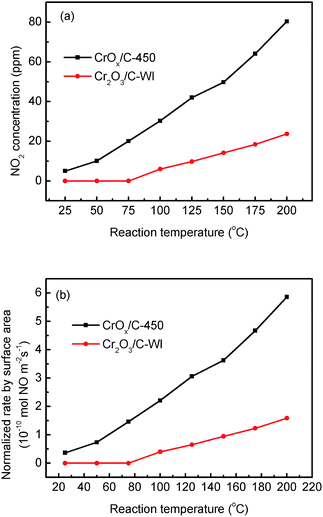 | ||
| Fig. 7 (a) NO oxidation performances and (b) normalized NO oxidation rate by surface area on CrOx/C-450 and C–Cr2O3 catalysts. | ||
In order to confirm whether the formed NO2 participated in NH3-SCR on the CrOx/C catalyst, further information about the reaction mechanism was obtained using DRIFTS. In the spectra of the absorption NO + O2 saturated CrOx/C-450 sample (Fig. 8a), the bands centered at 1280, 1335, and 1520 cm−1, and a wide band divided into bands at 1730, 1690, and 1660 cm−1 were detected. As reported elsewhere,51 these IR bands were attributed to weakly bound NO2 (1730 cm−1), nitrite anion (1335 cm−1), νs(N![[double bond, length as m-dash]](https://www.rsc.org/images/entities/char_e001.gif) O) and νas(N
O) and νas(N![[double bond, length as m-dash]](https://www.rsc.org/images/entities/char_e001.gif) O) of symmetric N2O3 (1690 and 1660 cm−1), bidentate nitrates (1520 cm−1), and monodentate nitrates (1280 cm−1). When the feed gas was switched to NH3, the bands belonging to NO2 and bidentate nitrates gradually disappeared, replacing with the bands of NH3 absorbed on Lewis acid sites (1620 and 1217 cm−1),52,53 while the bands corresponding to symmetric N2O3, nitrite anion, and monodentate nitrates were still present. Indeed, it is apparent that NO2 and bidentate nitrates participated in the surface reaction on CrOx/C-450 and were consumed by NH3, which is a typical “fast NH3-SCR” pathway.54 To determine the role of NH3, co-absorption of NO + O2 on CrOx/C-450 after pre-absorption of NH3 was investigated (Fig. 8b). In the spectra of the absorption NH3 saturated CrOx/C-450 sample, only a weak band at 1620 cm−1 corresponding to NH3 on Lewis acid sites was detected, indicating the low acidity of CrOx/C-450 as mentioned in NH3-TPD analysis. With the addition of NO and O2, this band gradually disappeared, accompanied by the appearance of bands belonging to weakly bound NO2 (1732 cm−1), nitrite anion (1333 cm−1), νs(N
O) of symmetric N2O3 (1690 and 1660 cm−1), bidentate nitrates (1520 cm−1), and monodentate nitrates (1280 cm−1). When the feed gas was switched to NH3, the bands belonging to NO2 and bidentate nitrates gradually disappeared, replacing with the bands of NH3 absorbed on Lewis acid sites (1620 and 1217 cm−1),52,53 while the bands corresponding to symmetric N2O3, nitrite anion, and monodentate nitrates were still present. Indeed, it is apparent that NO2 and bidentate nitrates participated in the surface reaction on CrOx/C-450 and were consumed by NH3, which is a typical “fast NH3-SCR” pathway.54 To determine the role of NH3, co-absorption of NO + O2 on CrOx/C-450 after pre-absorption of NH3 was investigated (Fig. 8b). In the spectra of the absorption NH3 saturated CrOx/C-450 sample, only a weak band at 1620 cm−1 corresponding to NH3 on Lewis acid sites was detected, indicating the low acidity of CrOx/C-450 as mentioned in NH3-TPD analysis. With the addition of NO and O2, this band gradually disappeared, accompanied by the appearance of bands belonging to weakly bound NO2 (1732 cm−1), nitrite anion (1333 cm−1), νs(N![[double bond, length as m-dash]](https://www.rsc.org/images/entities/char_e001.gif) O) and νas(N
O) and νas(N![[double bond, length as m-dash]](https://www.rsc.org/images/entities/char_e001.gif) O) of symmetric N2O3 (1691 and 1657 cm−1), and bidentate nitrates (1515 cm−1).51 This indicated that NH3 on Lewis sites was reacted and consumed. Therefore, the entire NH3-SCR on CrOx/C-450 followed a L–H mechanism, in which NO was oxidized by the unsaturated oxygen of CrOx/C-450 catalyst and transformed to NO2. The formed NO2 further absorbed on the surface of CrOx/C-450 as bidentate nitrates, and reacted with NH3 on Lewis sites, forming N2 and H2O at last. Due to the formation of NO2, the reaction proceeded as a “fast NH3-SCR” pathway, causing the decrease in reaction activation energy, thus enhancing the low-temperature activity.
O) of symmetric N2O3 (1691 and 1657 cm−1), and bidentate nitrates (1515 cm−1).51 This indicated that NH3 on Lewis sites was reacted and consumed. Therefore, the entire NH3-SCR on CrOx/C-450 followed a L–H mechanism, in which NO was oxidized by the unsaturated oxygen of CrOx/C-450 catalyst and transformed to NO2. The formed NO2 further absorbed on the surface of CrOx/C-450 as bidentate nitrates, and reacted with NH3 on Lewis sites, forming N2 and H2O at last. Due to the formation of NO2, the reaction proceeded as a “fast NH3-SCR” pathway, causing the decrease in reaction activation energy, thus enhancing the low-temperature activity.
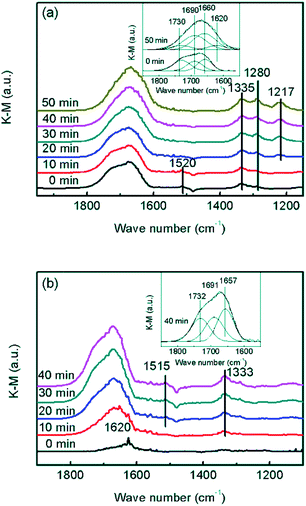 | ||
| Fig. 8 In situ DRIFT spectra of CrOx/C-450: (a) NH3 reacted with pre-absorbed NO + O2, (b) NO + O2 reacted with pre-absorbed NH3. | ||
3.5. Reasons of excellent SO2 tolerance of regeneration ability
Sulfation process is a transition from metal oxide to metal sulfate. Irrespective of which type of intermediate exists in the sulfation process, the metal–oxygen band must be broken. It is reasonable to deduce that a metal oxide with a strong metal–oxygen band is difficult to be sulfated. The Cr–O band energy of the eskolaite phase Cr2O3 was calculated (see the ESI†). As displayed in Table S5,† the band energy of the Cr–O band in the eskolaite phase Cr2O3 exceeds that of Mn–O band in MnO2, indicating that the sulfation process of Cr2O3 proceeds with more difficulty as compare that of MnO2. This is considered to be the result of the various NH3-SCR performances of MnO2 and CrOx/C-450 catalyst in the presence of SO2. Moreover, MnO2 and CrOx/C-450 catalysts deactivated by SO2 were washed with deionized water and the metal-ion contents in the eluate were measured by ICP analysis. As presented in Table S6,† Mn2+ was detected in the eluate of the deactivated MnO2 sample, while no Cr3+ was detected in the eluate of the deactivated CrOx/C-450 sample. It is evident that the CrOx/C-450 sample was protected from sulfation.To further understand the SO2 poisoning and regeneration processes, the XPS spectra of the fresh CrOx/C-450 catalyst, SO2-poisoned sample, and regenerated sample were studied. As displayed in Fig. 6a and Table 2, the Cr state and relative content of Cr6+ and Cr3+ of each sample were similar, which indicated that, as it is designed, CrOx/C-450 catalyst was difficult to be sulfated for the high lattice energy of Cr2O3. Comparing the O 1s peak of the fresh CrOx/C-450 sample and the regenerated sample (Fig. 6b), their peaks of lattice oxygen were similar and both shifted to the high binding energy side than that of bulk Cr2O3. Since activated lattice oxygen still remained on the surface, the regenerated catalyst exhibited high NH3-SCR activity, similar to the fresh catalyst.
In XPS spectra of the SO2 poisoned sample, the peaks of S 2p and N 1s were detected. The S 2p peak (Fig. S7a†) consists of two peaks at 168.5 eV (S 2p1/2) and 169.7 eV (S 2p3/2), which belonged to SO42−. The N 1s spectra (Fig. S7b†) can be divided into two peaks at 399.5 eV and 400.5 eV, contributed to NH3 and NH4+, respectively. According to the relative atom contents listed in Table S7,† atoms-ratio of SO42− and NH4+ was nearly 1![[thin space (1/6-em)]](https://www.rsc.org/images/entities/char_2009.gif) :
:![[thin space (1/6-em)]](https://www.rsc.org/images/entities/char_2009.gif) 1 on the surface of the SO2-poisoned sample. This indicated that NH4HSO4 deposited on the surface of CrOx/C-450 during the SO2 poisoning process, which causes the deactivation of the catalyst. After heat treatment, the deposited NH4HSO4 could easily decompose and the CrOx/C-450 catalyst with exposed activated lattice oxygen regains the superior activity.
1 on the surface of the SO2-poisoned sample. This indicated that NH4HSO4 deposited on the surface of CrOx/C-450 during the SO2 poisoning process, which causes the deactivation of the catalyst. After heat treatment, the deposited NH4HSO4 could easily decompose and the CrOx/C-450 catalyst with exposed activated lattice oxygen regains the superior activity.
4. Conclusions
In this study, we successfully designed and synthesized a novel chromium oxide nano-particles catalyst with excellent NH3-SCR activity at 150 °C and remarkable SO2 regenerative ability. The obtained CrOx/C-450 catalyst was composed of CrOx nano-particles covered by amorphous carbon. A carbon species, which was derived from the organic linkers of the MOFs precursor, protected the CrOx nano-particles from aggregation. CrOx/C catalysts primarily have Eskolaite phase Cr2O3 with average size of 3 nm and exhibit a large surface area. Due to the small size of CrOx nano-particles in CrOx/C catalysts, the lattice oxygen atoms of CrOx/C were activated, so that NO could be oxidized to NO2 on the catalyst surface. The formed NO2 participated in reaction and made NH3-SCR on CrOx/C proceed through a “fast NH3-SCR” pathway. The large surface area and activated lattice oxygen of CrOx/C catalysts caused the enhanced NH3-SCR activities. Due to the stable lattice of Cr2O3, CrOx/C catalyst could hardly be sulfated in the SO2 poisoning process. Therefore, the regenerated catalyst still retained prominent activity when NH4HSO4 deposited on the surface of the catalyst was removed during the regeneration process.Conflicts of interest
There are no conflicts to declare.Acknowledgements
The financial supports of National High-tech Research and Development (863) Program of China (2015AA03A401), National Natural Science Foundation of China (No. 21573105), Natural Science Foundation of Jiangsu Province (BK20161392), and Jiangsu Province Science and Technology Support Program (Industrial, BE2014130) are gratefully acknowledged.References
- C. Liu, J. W. Shi, C. Gao and C. M. Niu, Appl. Catal., A, 2016, 522, 54–69 CrossRef CAS.
- T. H. Vuong, J. Radnik, E. Kondratenko, M. Schneider, U. Armbruster and A. Bruckner, Appl. Catal., B, 2016, 197, 159–167 CrossRef CAS.
- T. H. Vuong, J. Radnik, M. Schneider, H. Atia, U. Armbruster and A. Bruckner, Catal. Commun., 2016, 84, 171–174 CrossRef CAS.
- C. J. Tang, H. L. Zhang and L. Dong, Catal. Sci. Technol., 2016, 6, 1248–1264 CAS.
- S. Wu, X. Yao, L. Zhang, Y. Cao, W. Zou, L. Li, K. Ma, C. Tang, F. Gao and L. Dong, Chem. Commun., 2015, 51, 3470–3473 RSC.
- K. Wijayanti, S. Andonova, A. Kumar, J. Li, K. Kamasamudram, N. W. Currier, A. Yezerets and L. Olsson, Appl. Catal., B, 2015, 166, 568–579 CrossRef.
- J. H. Lee, Y. J. Kim, T. Ryu, P. S. Kim, C. H. Kim and S. B. Hong, Appl. Catal., B, 2017, 200, 428–438 CrossRef CAS.
- P. Chen, R. Moos and U. Simon, J. Phys. Chem. C, 2016, 120, 25361–25370 CAS.
- J. Liu, X. Li, Q. Zhao, J. Ke, H. Xiao, X. Lv, S. Liu, M. Tade and S. Wang, Appl. Catal., B, 2017, 200, 297–308 CrossRef CAS.
- T. Boningari, P. R. Ettireddy, A. Somogyvari, Y. Liu, A. Vorontsov, C. A. McDonald and P. G. Smirniotis, J. Catal., 2015, 325, 145–155 CrossRef CAS.
- H. Hu, S. X. Cai, H. R. Li, L. Huang, L. Y. Shi and D. S. Zhang, ACS Catal., 2015, 5, 6069–6077 CrossRef CAS.
- Z. M. Liu, J. Z. Zhu, J. H. Li, L. L. Ma and S. I. Woo, ACS Appl. Mater. Interfaces, 2014, 6, 14500–14508 CAS.
- H. Chang, X. Chen, J. Li, L. Ma, C. Wang, C. Liu, J. W. Schwank and J. Hao, Environ. Sci. Technol., 2013, 47, 5294–5301 CrossRef CAS PubMed.
- J. Li, H. Chang, L. Ma, J. Hao and R. T. Yang, Catal. Today, 2011, 175, 147–156 CrossRef CAS.
- C. Liu, L. Chen, J. Li, L. Ma, H. Arandiyan, Y. Du, J. Xu and J. Hao, Environ. Sci. Technol., 2012, 46, 6182–6189 CrossRef CAS PubMed.
- L. Zhang, L. L. Li, Y. Cao, X. J. Yao, C. Y. Ge, F. Gao, Y. Deng, C. J. Tang and L. Dong, Appl. Catal., B, 2015, 165, 589–598 CrossRef CAS.
- D. W. Kwon, K. B. Nam and S. C. Hong, Appl. Catal., B, 2015, 166, 37–44 CrossRef.
- G. Qi and R. T. Yang, Appl. Catal., B, 2003, 44, 217–225 CrossRef CAS.
- C. Liu, J.-W. Shi, C. Gao and C. Niu, Appl. Catal., A, 2016, 522, 54–69 CrossRef CAS.
- M. Colombo, I. Nova, E. Tronconi, V. Schmeißer, B. Bandl-Konrad and L. Zimmermann, Appl. Catal., B, 2012, 111–112, 106–118 CrossRef CAS.
- S. Roy, M. S. Hegde and G. Madras, Appl. Energy, 2009, 86, 2283–2297 CrossRef CAS.
- B. Guan, R. Zhan, H. Lin and Z. Huang, Appl. Therm. Eng., 2014, 66, 395–414 CrossRef CAS.
- S. X. Cai, H. Hu, H. R. Li, L. Y. Shi and D. S. Zhang, Nanoscale, 2016, 8, 3588–3598 RSC.
- E. Rhodes and A. R. Ubbelohde, Proc. R. Soc. A, 1959, 251, 156–171 CrossRef CAS.
- M. Kang, E. D. Park, J. M. Kim and J. E. Yie, Catal. Today, 2006, 111, 236–241 CrossRef CAS.
- A. Zhou, D. Yu, L. Yang and Z. Sheng, Appl. Surf. Sci., 2016, 378, 167–173 CrossRef CAS.
- S. Xiong, X. Xiao, N. Huang, H. Dang, Y. Liao, S. Zou and S. Yang, Environ. Sci. Technol., 2017, 51, 531–539 CrossRef CAS PubMed.
- Q.-l. Chen, R.-t. Guo, Q.-s. Wang, W.-g. Pan, W.-h. Wang, N.-z. Yang, C.-z. Lu and S.-x. Wang, Fuel, 2016, 181, 852–858 CrossRef CAS.
- H. E. Curry-Hyde, H. Musch and A. Baiker, Appl. Catal., 1990, 65, 211–223 CrossRef CAS.
- B. L. Duffy, H. E. Curry-Hyde, N. W. Cant and P. F. Nelson, J. Catal., 1994, 149, 11–22 CrossRef CAS.
- G. Busca, L. Lietti, G. Ramis and F. Berti, Appl. Catal., B, 1998, 18, 1–36 CrossRef CAS.
- G. Marban, R. Antuna and A. B. Fuertes, Appl. Catal., B, 2003, 41, 323–338 CrossRef CAS.
- E. Curry-Hyde and A. Baiker, Ind. Eng. Chem. Res., 1990, 29, 1985–1989 CrossRef CAS.
- S. Alayoglu, A. U. Nilekar, M. Mavrikakis and B. Eichhorn, Nat. Mater., 2008, 7, 333–338 CrossRef CAS PubMed.
- K. Yamamoto, T. Imaoka, W. J. Chun, O. Enoki, H. Katoh, M. Takenaga and A. Sonoi, Nat. Chem., 2009, 1, 397–402 CrossRef CAS PubMed.
- C. T. Campbell and Z. Mao, ACS Catal., 2017, 7, 8460–8466 CrossRef CAS.
- K. Shen, X. Chen, J. Chen and Y. Li, ACS Catal., 2016, 6, 5887–5903 CrossRef CAS.
- P. Yin, T. Yao, Y. Wu, L. Zheng, Y. Lin, W. Liu, H. Ju, J. Zhu, X. Hong, Z. Deng, G. Zhou, S. Wei and Y. Li, Angew. Chem., Int. Ed. Engl., 2016, 55, 10800–10805 CrossRef CAS PubMed.
- P. Mahata, D. Sarma, C. Madhu, A. Sundaresen and S. Natarajan, Dalton Trans., 2011, 40, 1952–1960 RSC.
- P. Yin, T. Yao, Y. Wu, L. Zheng, Y. Lin, W. Liu, H. Ju, J. Zhu, X. Hong, Z. Deng, G. Zhou, S. Wei and Y. Li, Angew. Chem., Int. Ed., 2016, 55, 10800–10805 CrossRef CAS PubMed.
- B. You, N. Jiang, M. Sheng, W. S. Drisdell, J. Yano and Y. Sun, ACS Catal., 2015, 5, 7068–7076 CrossRef CAS.
- J. Yu, F. Guo, Y. Wang, J. Zhu, Y. Liu, F. Su, S. Gao and G. Xu, Appl. Catal., B, 2010, 95, 160–168 CrossRef CAS.
- S. H. Jhung, J. H. Lee, J. W. Yoon, C. Serre, G. Ferey and J. S. Chang, Adv. Mater., 2007, 19, 121–124 CrossRef CAS.
- A. Henschel, K. Gedrich, R. Kraehnert and S. Kaskel, Chem. Commun., 2008, 4192–4194 RSC.
- O. Kouvo and Y. Vuorelainen, Am. Mineral., 1958, 43, 1098–1106 CAS.
- F. Ayari, M. Mhamdi, D. P. Debecker, E. M. Gaigneaux, J. Alvarez-Rodriguez, A. Guerrero-Ruiz, G. Delahay and A. Ghorbel, J. Mol. Catal. A: Chem., 2011, 339, 8–16 CrossRef CAS.
- M. A. Henderson and M. H. Engelhard, J. Phys. Chem. B, 2014, 118, 29058–29067 CAS.
- B. Wichterlova, L. Krajcikova, Z. Tvaruzkova and S. Beran, J. Chem. Soc., Faraday Trans. 1, 1984, 80, 2639–2645 RSC.
- D. Shuttleworth, J. Phys. Chem., 1980, 84, 1629–1634 CrossRef CAS.
- T. Dickinson, A. F. Povey and P. M. A. Sherwood, J. Chem. Soc., Faraday Trans., 1976, 72, 686–705 RSC.
- K. I. Hadjiivanov, Catal. Rev., 2000, 42, 71–144 CAS.
- X. Li, X. Li, J. Li and J. Hao, J. Hazard. Mater., 2016, 318, 615–622 CrossRef CAS PubMed.
- Z. Liu, S. Zhang, J. Li and L. Ma, Appl. Catal., B, 2014, 144, 90–95 CrossRef CAS.
- Y. An, Y. Liu, P. An, J. Dong, B. Xu, Y. Dai, X. Qin, X. Zhang, M.-H. Whangbo and B. Huang, Angew. Chem., Int. Ed. Engl., 2017, 56, 3036–3040 CrossRef CAS PubMed.
Footnote |
| † Electronic supplementary information (ESI) available: Band energy calculation, thermochemical data, band energy data, mass of metal sulfate formed on catalysts, surface atomic concentration of SO2 poisoned CrOx/C-450 sample, extra NH3-SCR and water tolerance tests, XRD patterns, FTIR data, Raman data, extra TEM image, NH3-TPD data, H2-TPR data, O2-TPD data, extra XPS spectra. See DOI: 10.1039/c7ra09680a |
| This journal is © The Royal Society of Chemistry 2018 |


