DOI:
10.1039/C7RA09346B
(Paper)
RSC Adv., 2018,
8, 5420-5432
The occurrence state of moisture in coal and its influence model on pore seepage†
Received
24th August 2017
, Accepted 10th January 2018
First published on 31st January 2018
Abstract
Moisture is one of the most important factors that influences coal seepage and coal-bed methane (CBM) extraction. To obtain the water occurrence state and dynamic processes of water change in coal, a series of microscopic observation experiments of Wei Jiagou coal by using field-emission environmental scanning-electron microscopy (ESEM) was conducted under the condition of a fixed point. Afterwards, a mathematical model to explain the influence of water on porosity and permeability was proposed based on the ESEM observations. It was found that there were three main types of water occurrence state: a crescent shape, a full filled shape and an annulus shape, which can provide powerful evidence to explain the influence of water on porosity and starting pressure gradient. As well as this, the box counting reached a minimum at a chamber pressure of 520 Pa and the box counting reduced after water wetting. Based on the mathematical model analysis, the water-occupied area of crescent shapes would reach a peak value with an increase of the contact angle, which has a critical impact on the effective porosity. The influence model that we built matched well with experimental data, which in turn demonstrated the validity of the mathematical model. The prominent combined effect of strain and water saturation appeared on the ridge of the permeability contour, while strains have little influence on permeability at a large initial porosity. Furthermore, a model for contact angle and wetting height was proposed and discussed, and contact angles with different improving fluids were tested. It also can be shown that using better wettability improving-fluid can save the cost of volume and have a good performance on the results of hydraulic technology based on model and experimental tests.
1 Introduction
Coalbed methane (CBM) is one of the most common unconventional natural gases that is generated by coal seams and is mainly stored in coal seams in an absorbed state, and its main component is CH4.1–4 Methane is not only a type of clean energy but also a potent greenhouse gas and has a critical influence factor on various disasters in the process of coal mining.5,6 Therefore, the development and utilization of coal-bed methane can alleviate the situation of energy shortage in our country and also can reduce or even eliminate gas explosions, coal and gas outburst and other disasters in coal mining. As well, it can avoid the greenhouse effect caused by the emission of gas into the atmosphere.7–12
Coal-seam seepage properties have a vital influence on the occurrence state, migration and extraction of coal-bed methane, coal and gas outburst, gas explosion, and so on.13,14 Therefore, researches on seepage characteristic are of significance to coal-seam gas extraction and mine-gas disaster management. While permeability is a significant parameter to assess flow characteristics and can be influenced by many factors such as the stress field, geothermal field, geoelectric field, acoustic field, pore pressure and coal moisture content.15–20 Numerous achievements about a seepage model have been obtained at home and abroad, such as the capillary-tube model,21–23 spherical-particle accumulation model,24 lattice model25–28 and tube network model.29,30 In recent years, with the rapid development of computer technology and image-scanning analysis technology, some researchers rebuilt pore network structures based on real core pore-structures.31,32 Seidle and Jeansonne33 constructed a matchstick model, and Shi and Durucan34 put forward an S&D permeability model based on a matchstick model considering the swell and shrink transformation of adsorption and desorption.35–37 At present, hydraulic fracturing, hydraulic cutting and hydraulic punching are commonly used as the primary methods to improve the permeability of coal for methane extraction and gas-disaster management.38–43 But the coal seams would be wetted at the same time, which can bring some negative effect, such as occupying the seepage channel, increasing the flow resistance and impacting the gas desorption.44–46 Moisture always coexists with gas in coal at all five stages of gas recovery, as shown in Fig. 1. Therefore, moisture is a non-ignorable factor when we study the seepage property. Moisture is also known to play a critical role in the methane adsorption capacity of coal,47,48 which will result in the change of desorption-induced strains.49 A pressure drop funnel will be easily formed from gas production in an effective extraction radius that contains gas desorption from the coal matrix, diffusion in the micropores and seepage in the macropores and crack system. In a gas migration processes, moisture permeability will decline with increased of gas as shown in Fig. 1. The adsorption capacity and strain can also be impacted by moisture, and moisture brings the effect on the gas flow resistance and seepage channel. Therefore, the prediction of the CBM output can be made much more difficult by the above moisture impacts.36,50–52 Although some permeability tests considering moisture have been conducted,53 there is still a lack of research on the occurrence state of moisture at the microscale. The occurrence state of moisture is the fundamental property to understand the influencing mechanism of moisture on gas flow. Therefore, it is necessary to analyse the status of moisture in coal at the microscale and improve the mathematical model of gas seepage with moisture for gas migration and production.
 |
| | Fig. 1 The production process of coal bed methane. | |
Accordingly, in this paper, a series of observational experiments was conducted to observe the dynamic process of moisture change in coal samples by using environmental scanning electron microscopy. The box counting of dynamic process was calculated to analysis the influence of wetting on coal. Afterwards, an influence model of moisture on pore seepage was proposed based on the observations.
2 Status of moisture in microstructure of coal
2.1. Experimental facilities
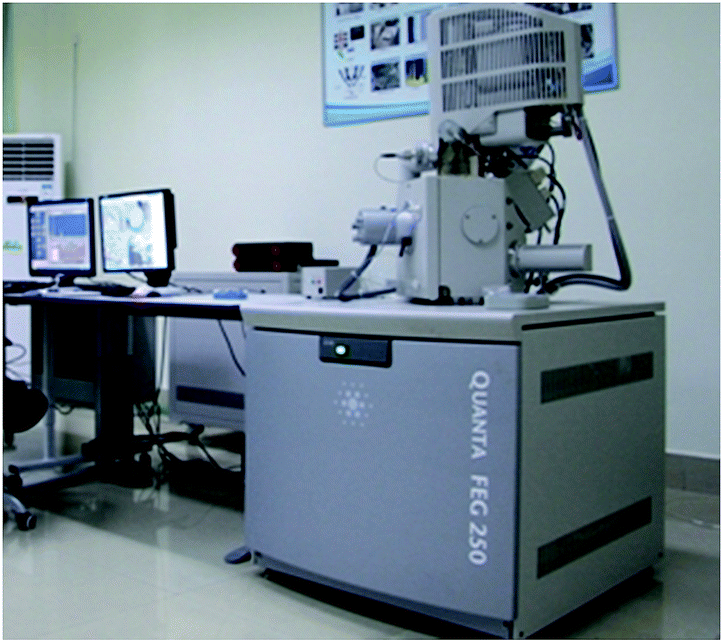
It is difficult to observe the water status in coal at the microscale by using a conventional scanning electron microscope. Therefore, the excellent facility of an FEI Quanta 250 FEG environmental scanning electron microscope (ESEM), as shown in Fig. 2, was used in the observation to obtain the microstructural information of wetting coal. This ESEM is a versatile, high-performance instrument with three modes (high vacuum, low vacuum and ESEM) to accommodate the widest range of samples of any SEM system, and especially to include aqueous samples and oil samples. The material can be magnified approximately 0.5–1 million times and the high-resolution morphology of the sample can be observed and analysed by using Quanta FEG 250. The dynamic processes of phase change of water in the sample caused by a chamber pressure change also can be recorded and observed.
 |
| | Fig. 2 The instrument used in the experiment. | |
2.2. Sample collection and preparation
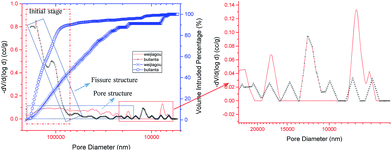
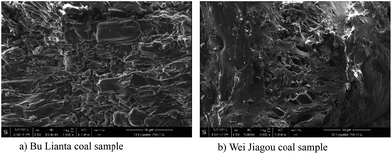
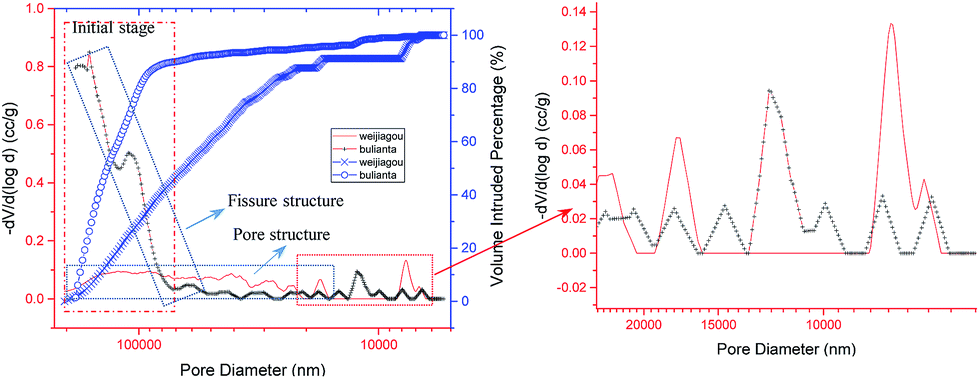
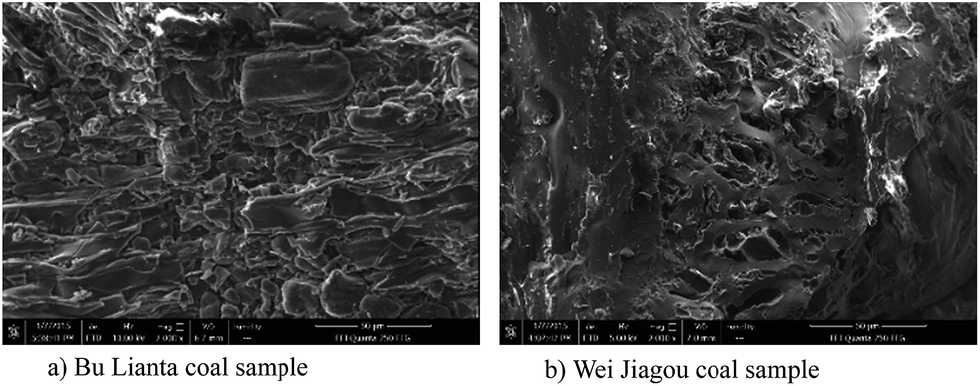
Coal samples were collected from Wei Jiagou Coal Mining, Chongqing Yong Rong Mining Co., LTD and Bu Lianta Coal mine, Shendong Coal Branch Company, Shenhua Group, and were first analysed by a Quantachrome Mercury Porosimetry Analyzer (PM-33-17). The percentage of intruded volume increase dramatically at the initial stage and then increased slowly until it reached 100% while the intruded volume exhibits a violent fluctuation tendency, as shown in Fig. 3. The main reason is that macro pore and crack can be intruded by mercury easily, which can make the intruded percentage rise sharply, and the fluctuation of the intruded volume curve is caused by the different distributions of the pore or crack structure in the coal. It is easy to find the difference between two kinds of coal sample from the percentage of intruded volume curve and the intruded volume curve. Bu Lianta coal mine samples have a larger increased rate of intruded volume percentage and bigger intruded volume compared to Wei Jiagou coal mine sample at the initial mercury-injection stage. Based on the differences of intruded volume and the intruded volume percentage, it can be obtained that the Bu Lianta coal mine samples have more macropore space and the differences of the curves comes from the coal structures. Therefore, it can be predicted that the Bu Lianta coal sample is dominated by a fissure structure and the Wei Jiagou coal sample is mainly composed of a pore structure. The prediction of the coal structure can be demonstrated by microcosmic images by using ESEM in the high vacuum mode, as shown in Fig. 4, which gives a clear cognition of coal structure.
 |
| | Fig. 3 The pore diameter distribution of two coal samples at a low pressure injection. | |
 |
| | Fig. 4 The structures of two types of coal sample. | |
2.3. Scan results of ESEM
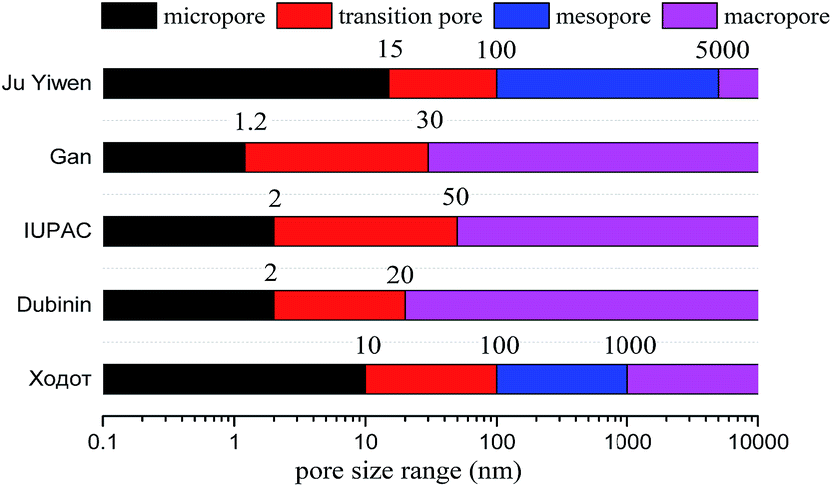
2.3.1 Pore structure of coal sample. Pores form the main storage space and migration pathway of gas, and their characteristics have a close connection with methane accumulation and gas flow. Considerable research on the classification of pores has been done based on the interaction between gas molecules and pores, and the occurrence state of methane, such as the  classification system, Dubinin classification system, IUPAC classification system, Gan classification system and Ju Yiwen classification system, as shown in Fig. 5.54–56 For the better description of pore size, the
  (Hodot) decimal classification system is adopted in this paper. Pores are classified into micropores (r ≤ 10 nm), transition pores (10 < r ≤ 100 nm), mesopores (100 < r ≤ 1000 nm) and macropores (r > 1000 nm). Micropores and transition pores are thought to be related with the capillary condensation effect and the diffusion of methane occurs, respectively. And mesopores are the seepage space of a slow laminar flow; the space of severe laminar-flow and the mixing infiltration space of laminar flow, and turbulent flow are composed by macropores and visible pores, respectively.
 |
| | Fig. 5 The classification of pore structures. | |
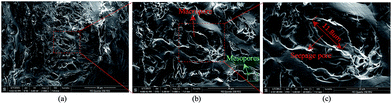
The observation tests were conducted on two kinds of coal samples. To better understand the moisture status in pore structure, Wei Jiagou coal samples are used as an example for analysis hereafter as shown in Fig. 6. The ESEM images of the coal's microscopic surface features were obtained under the experimental conditions of zero humidity and 5.00 kV of acceleration voltage. It is easy to find that the microcosmic structure of coal is mainly composed of pores, the main pore type is a corrosion pore and fully developed transfixion cracks are very few. As well as this, the structural form of the pores is extremely irregular and the pore sizes are heterogeneous. Fig. 6(a) shows a part of the surface characteristic image of a coal sample particle's micro-structure and shows the pore-distribution characteristics and morphological characteristics. Fig. 6(b) shows a local amplification of Fig. 6(a) and has been magnified approximately 5000 times. The macro pore and mesopores can be obviously distinguished from Fig. 6(b); and the macro pore morphology exhibits an irregular flat elliptical shape. Fig. 6(c), with a magnification of 10![[thin space (1/6-em)]](https://www.rsc.org/images/entities/char_2009.gif) 000 times, displays a macro pore with a maximum pore structure size of approximately 12 μm. According to the Hodot decimal classification system, the large pore can be classified as a macropore, which composes the main laminar flow space, plays a critical role in coal permeability and can be called a seepage pore.
000 times, displays a macro pore with a maximum pore structure size of approximately 12 μm. According to the Hodot decimal classification system, the large pore can be classified as a macropore, which composes the main laminar flow space, plays a critical role in coal permeability and can be called a seepage pore.
 |
| | Fig. 6 Pore structure of coal samples. | |
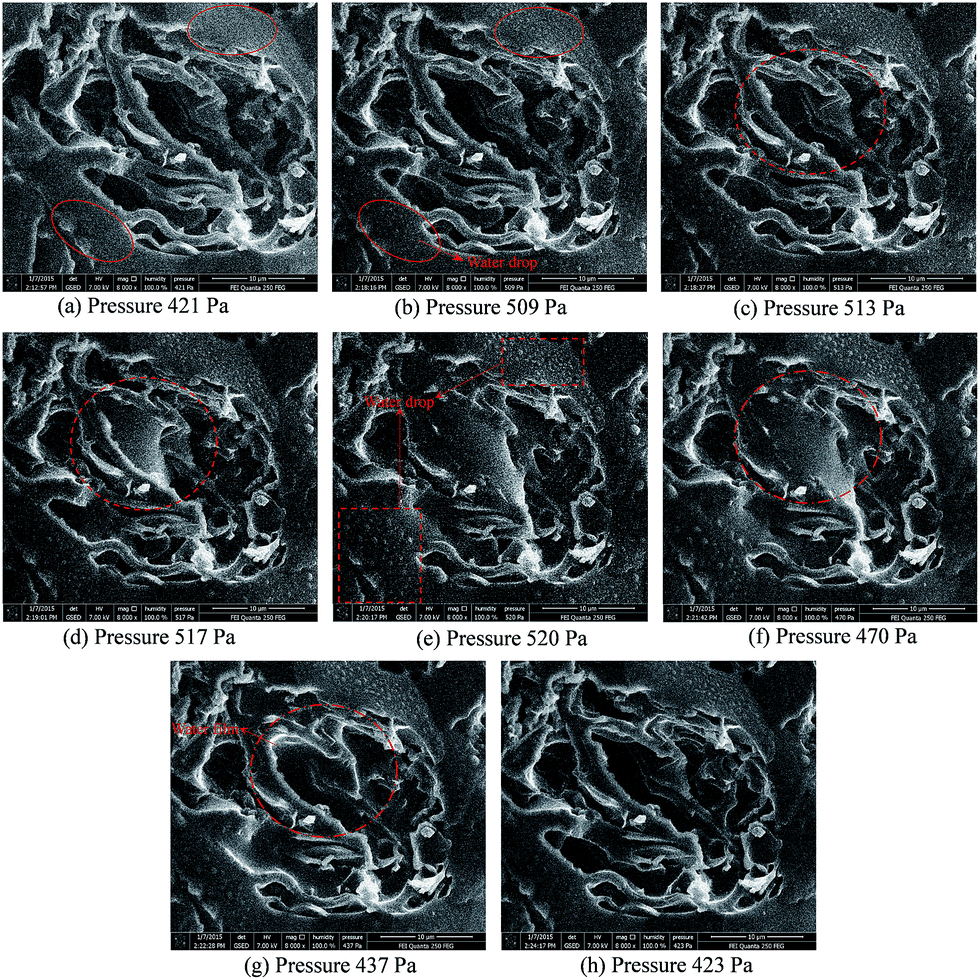
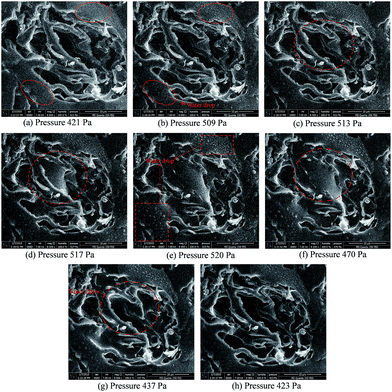
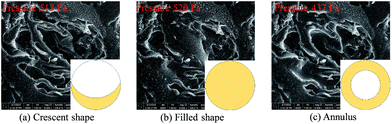
2.3.2 Dynamic process of moisture variation. According to the bonding state of water, moisture in coal can be classified into two major categories: free water and bound water. Free water combines with coal through the mechanical effect of adsorption and adhesion, while bound water combines with coal minerals through chemical bonding.57 Therefore, free water has a direct influence on porosity, gas adsorption and gas migration based on the bonding state, resulting in a change of coal permeability. Thus, it is necessary to study moisture occurrence and understand the influence of free water on CBM extraction. In order to observe the water occurrence state in coal pores, the environmental vacuum mode of ESEM is set in the observations. Moreover, the humidity of the observation chamber must be increased to 100% because free water cannot be observed when the humidity is less than 100%. To obtain the dynamic processes of free water formation and fade-away in seepage pores, the pressure of the observation chamber was increased from 421 Pa to 520 Pa and then gradually decreased to 422 Pa. The results were obtained in a video format (see attachment), and pictures were extracted for different stages of moisture formation and fade-away. Fig. 7 shows the overall processes of formation and fade of liquid water under fixed-point observation conditions. As the pressure of the observation chamber increased to the maximal value of 520 Pa, the pore space was quickly filled by liquid water in 6 seconds. When the pressure dropped, the water in the pore space rapidly gasified to vapour, causing the moisture-occupied volume to decrease quickly. Fig. 7(a) shows that there is no discernible liquid water in the pore wall at a humidity of 100% and pressure of 421 Pa. While a large amount of droplets was found around the macro pore, Fig. 7(b) compared with Fig. 7(a) in the red solid circle. A crescent shape of the moisture occupation in a pore is shown in Fig. 7(c). When the pressure of the observation chamber reached 517 Pa, the effective volume of the liquid water increased to half of the pore space, as shown in Fig. 7(d), and an outward convex surface shape of the occupied water was formed due to the surface tension of water and wettability of the coal wall. As the pressure of the observation chamber reached 520 Pa, the pore space was occupied quickly by moisture and the droplets on the coal-wall surface became several times larger than before, as shown in Fig. 7(e). In order to avoid the observation room being filled with liquid water, the chamber pressure was reduced immediately, and then the water faded quickly and gasified into vapour rapidly. The full filled shape of moisture-occupied pore space is shown in Fig. 7(e) and (f). A large concave surface of the occupied moisture is shown in Fig. 7(g) compared to Fig. 7(f) due to a sharp drop in the chamber pressure and the wettability of coal. Wetting is the ability of liquid water to maintain contact with a coal surface, resulting from intermolecular interactions when the two phases are brought together. The wetting degree is determined by a force balance between adhesive and cohesive forces.58 A contact angle of less than 90° usually indicates that wettability of the coal wall surface is very favourable, and liquid water will spread over a large area of the surface. Therefore, the residual water would form a water film on the surface of the coal wall after liquid water fade-away when the pressure decreases to 423 Pa as shown in Fig. 7(h). Based on the results of the observation processes, it can be found that the water occurrence state in coal pore can be classified into three main types: a crescent shape of the filling body, a fully filled shape by moisture in the pore that can block off gas flow, and an annulus shape around the pore wall surface. Moreover, each of the shapes of occupied moisture has different degrees of impact on gas flow. Moisture occupies the effective pore volume due to residual liquid–water adhered on the pore surface. However, the decreased space of the pore will have a direct influence on CBM migration because of the decrease in pore volume of the methane seepage channel and the increase in percolating resistance. The observations provide a straightforward process of the influence of moisture on coal pores.
 |
| | Fig. 7 Dynamic process of moisture change. | |
The process obtained by using ESEM is similar to the process of water injection and leak-off in a coal seam, which has a certain connection with hydraulic fracture, hydraulic cutting, hydraulic punching and other hydraulic techniques. Those techniques can improve the permeability to a great extent; however, it can bring a certain negative influence on gas migration and production. A high concentration methane also can be driven and replaced by water at the injection stage, which can reduce disasters caused by gas concentration. Furthermore, water can wet the coal matrix and occupy part of pore and crack space after the injected water flows back and leaks-off. The residual moisture can occupy the pore with different shapes, which can influence the effective porosity and block part of the seepage channel. In addition, the coal matrix can be wetted by the residual moisture, which also can influence the sorption capacity and then influence the sorption-induced strain of the coal. The change of porosity and sorption-induced strain will have a certain influence on CBM migration and production.
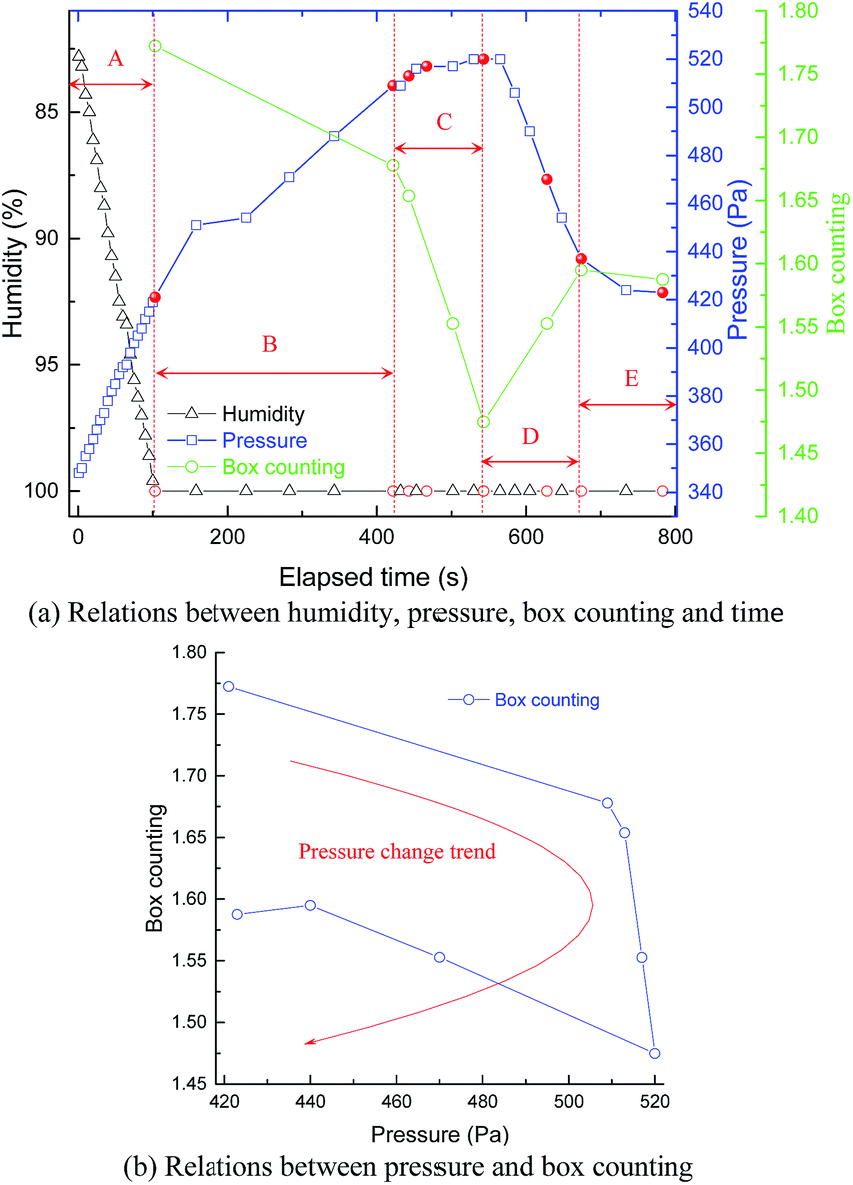
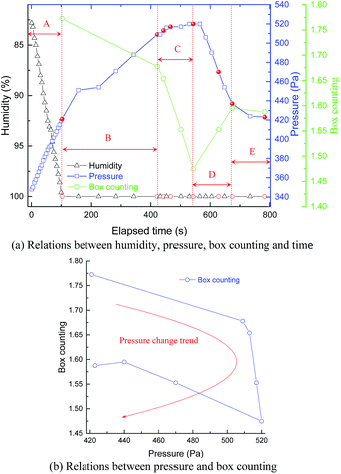
2.3.3 Change features of humidity, pressure and box counting. The observation experiment is a careful and precise test process, and some useful data can be recorded by the monitoring system. Therefore, the humidity and pressure have been obtained for the whole dynamic process to analyse the moisture dynamic change process. Fractal dimension provides a mathematical model to quantitatively analyse the surface characteristic for some complex images, and the box counting method is one of the frequently used techniques to determine the fractal dimension of a scanning image.59,60 Therefore, the box counting dimensions of the ESEM images were computed by MATLAB software to analyse the influence of moisture on the coal mesoscopic characteristics of the dynamic processes. The change tendency and relations of these parameters are plotted in Fig. 8. Fig. 8(a) shows the relations between humidity, pressure, box counting and elapsed time. Based on the relations among these parameters, the moisture dynamic change process can be divided into five parts, as shown in Fig. 8(a). Part A is the preparatory phase for humidity and pressure with a dramatic increase in humidity and pressure. Part B can be considered as the moisture initial formation stage with many droplets around the pore surface based on observation video, and the humidity reaches 100% and the chamber pressure still increases to reach water liquefying conditions, while box counting shows a decreasing trend due to the formed little droplets. Part C can be summarised as the moisture shape formation stage with the chamber pressure kept stable. Moisture filled the pore space and coal surface dramatically in this stage, which resulted in a sharp decrease of box counting because of the changed coal surface features influenced by water-occupation. Part D is the stage of moisture fade-away with a slow backflow rate based on observation video, while the box counting rebounds due to moisture fade-away. But the box counting did not reach the precious level that without moisture wetting. Part D is the moisture rapid fade-away stage with the pressure and box counting remaining stable. All five stages can be obviously distinguished in Fig. 8, and this dynamic process can be well described by the five stages. From the relations between box counting and pressure, as shown in Fig. 8(b), it can be found that the box counting dimension is relatively large without the influence of water wettability at a chamber pressure of 421 Pa, which indicates the complexity level is high. With an increase of chamber pressure, the moisture accumulates in the coal pore and moisture can apparently be found, which results in a decrease of the box counting dimension and increases the self-similarity of the pore structure. Then there is a big drop of the box counting dimension before the chamber pressure reaches 520 Pa, and then its value touches the minimum because moisture takes up the maximum volume of the coal pore and surface, which indicates the similarity of the pore structure reaches maximum. While the chamber pressure begins to decrease, the box counting dimension increases gradually and then reaches 1.58755, which is mainly due to the fade away of moisture. To be sure, the box counting dimension has been much reduced after the wetting effect of moisture on coal. Therefore, the effect of water not only occupies the effective seepage channel, but also influences the surface characteristics and self-similarity of coal.
 |
| | Fig. 8 Interrelations among dynamic process of moisture change. | |
3 Moisture influence model on pore-seepage
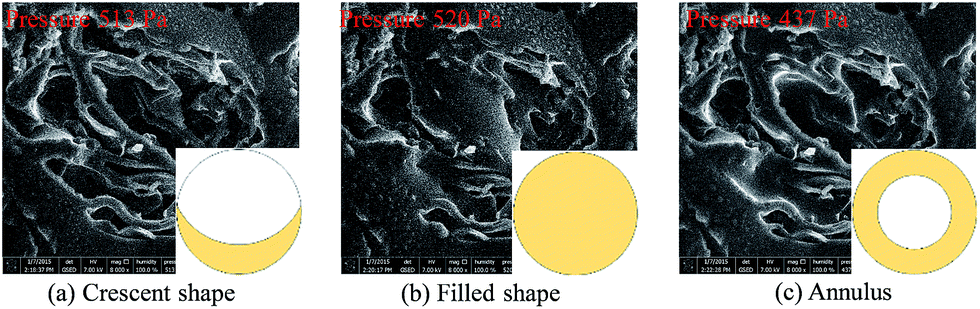
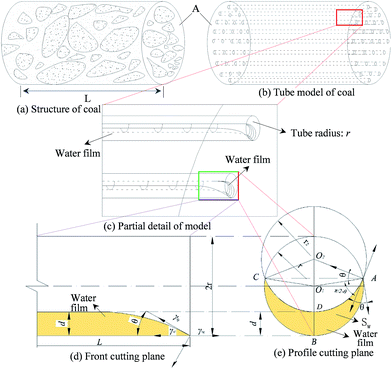
The occurrence of water may exhibit different states, but in this paper the occurrence state of moisture can be classified into three main types based on the ESEM observations of the dynamic process, as shown in Fig. 9. The crescent shape and annulus shape only take up part of the seepage space. While the fully-filled shapes occupy all the space of pore, which indicates that an initial gas pressure gradient is needed to break though the block of water. Moreover, the gas pressure gradient makes the gas flow follow a non-Darcy seepage.61 The crescent shape of the occupied water will first take into account a study of the influence of water on gas seepage, and a pore tube seepage model has been proposed based on the following assumptions, as shown in Fig. 10.
 |
| | Fig. 9 The mode of occurrence of moisture in coal pores. | |
 |
| | Fig. 10 Pore-seepage model with water film. | |
(1) The actual porous media structures of coal and rock are very complex and hard to predict. Therefore, the model can be equivalently simplified as a tube-bundle model that consists of a solid matrix and tube bundles with the same average diameter.
(2) The molecular forces of the internal liquid water can cancel each other out, but the molecular tensile force of the liquid moisture surface generated by bulk-phase molecules is larger than the tensile force generated by gas molecules because of the low density of the gas phase. Because water has a certain tension and wettability on coal and rock, there will exist a wetting contact angle between moisture and coal. The contact angle can be assumed as a constant for the same material with different contact planes or contact surfaces, that is to say, the contacts angles formed by the water in the pore are all the same.
(3) The pore structure is assumed to have an ideal shape and uniform radius, and the solid–gas contact surface is assumed to be a curved surface with ideal curvature.
(4) For the convenience of combining moisture content with pore-space volume, the water distribution in the tube-bundle wall is assumed to be continuous, and the water is assumed to be a homogeneous liquid fluid.
3.1 Mathematical porosity model with moisture
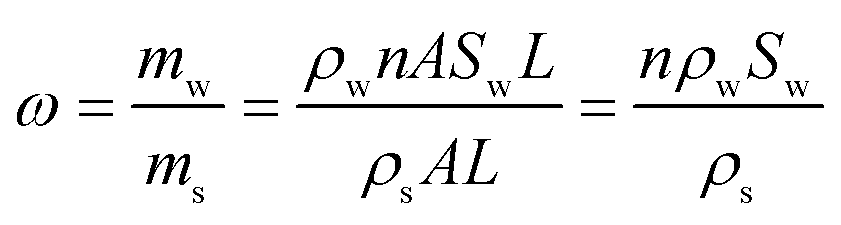
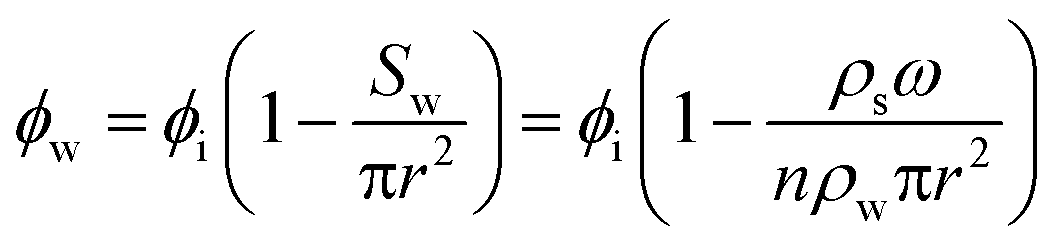
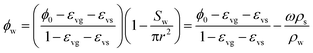
The moisture occurrence states in seepage pores have been analysed in the second section and the pore seepage model assumption is in Fig. 10. The moisture content can be defined as follows in the tube-bundle model.| |
 | (1) |
where ω is the moisture content, mw is the mass of free water, and ms is the mass of the specimen after drying at 105 degrees for twenty-four hours; A is the cross-sectional area of the ideal model, n is the density of the tube bundle in area A, ρw is the density of the moisture in the tube, Sw is the cross-sectional area of the water in a single capillary tube, L is the length of the seepage model, and ρs is the density of coal in the model.
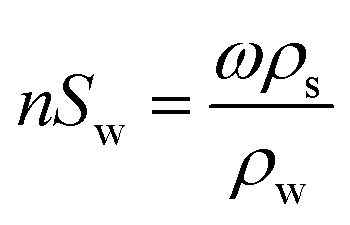
Eqn (1) can be rewritten as
| |
 | (2) |
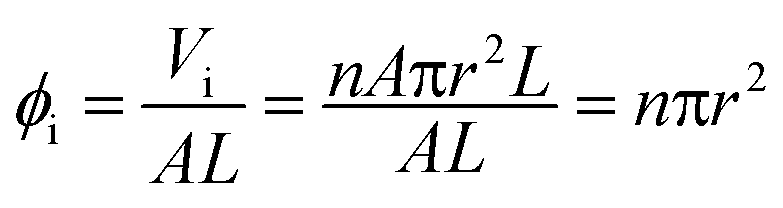
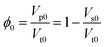
The initial porosity of the seepage model can be defined as follows without the moisture content in the tube bundle and can be affected by stress conditions and other external conditions.
| |
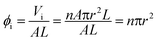 | (3) |
where
Vi is the tube-bundle volume under the influence of the stress conditions.
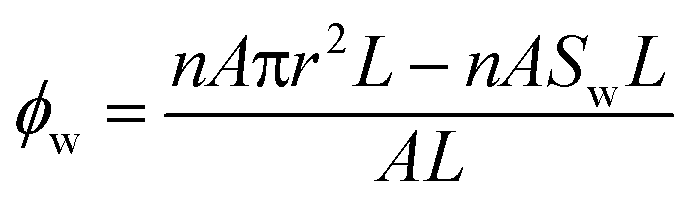
The pore-seepage volume is an effective channel of the tube bundle and is equal to the initial pore volume minus the moisture volume.
| |
 | (4) |
Substituting eqn (3) into eqn (4), we obtain
And substituting eqn (2) into eqn (5), we obtain
It is easy to see that the porosity ϕw is closely related to the moisture content ω. If the densities of water and the solid skeleton remain unchanged, the relationship between ϕw and ω shows a linear decrease.
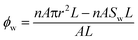
We introduce the variable α, which is the ratio of the cutting-plane area of the water film to the cross-sectional area of pore and is also defined as the water saturation.
| |
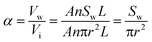 | (7) |
where
Vw and
Vi are the moisture volume and the tube bundle volume, respectively.
Substituting eqn (7) into eqn (4), we obtain
Substituting eqn (7) and (6) into eqn (8) yields
| |
 | (9) |
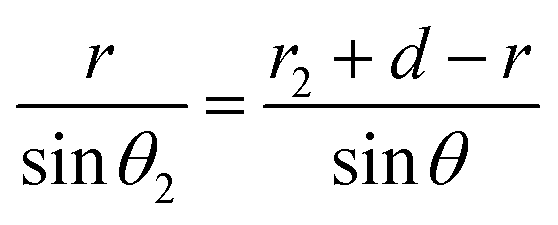
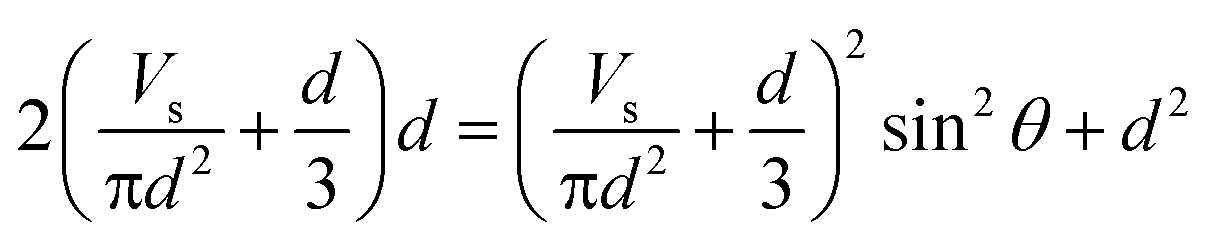
The crescent shape of the water-occupied area Sw is taken into account to calculate the effective porosity on gas seepage. In general, the wetting angle and the largest contact surface height of water on coal have been found to be key factors that determine the porosity. According to the assumptions listed above, we can obtain the angle ∠O1AO2 = θ (the unit of θ is radians) and O1O2 = r2 + d − r (see Fig. 10). Based on the cosine theorem of a triangle ΔO1AO2, we obtain
| | |
(r2 + d − r)2 = r2 + r22 − 2rr2cosθ
| (10) |
where
d is the highest wetting height, and
r2 is the radius of the circle formed by the wetting surface.
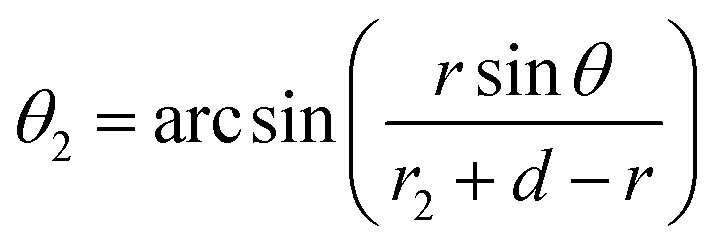
Solving eqn (10), we obtain
| |
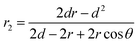 | (11) |
According to the sine rule of triangle O1AO2, and setting the angle ∠O1O2A = θ2, we obtain
| |
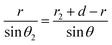 | (12) |
Solving eqn (12), we get
| |
 | (13) |
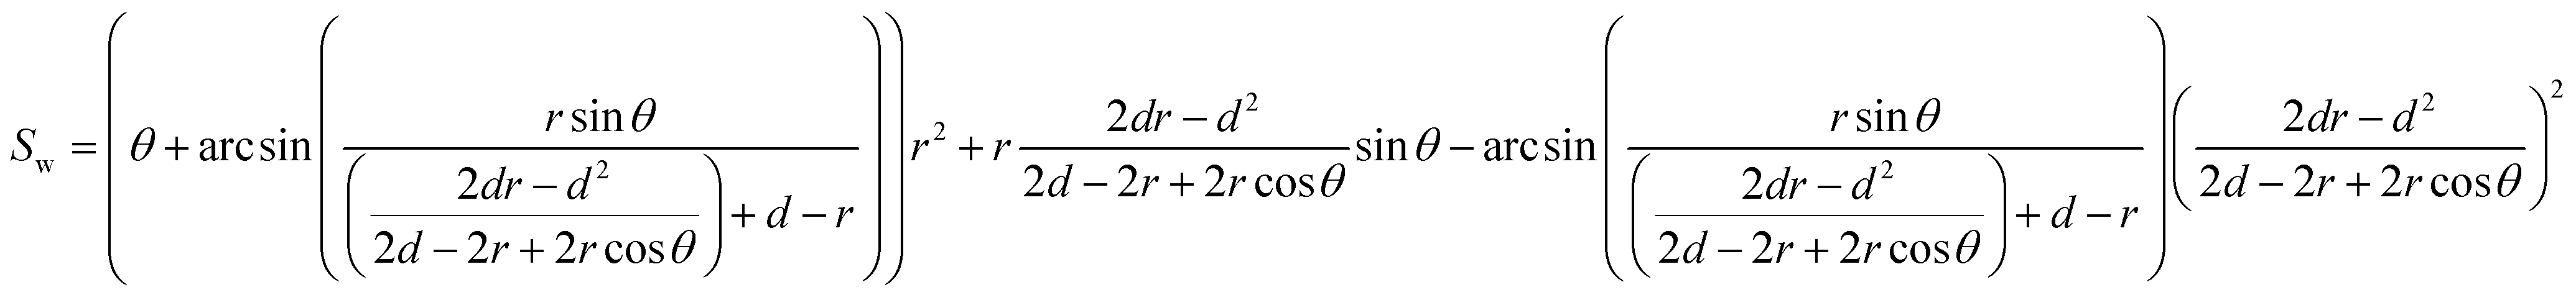
Through the analysis of the cutting plane of the water-film occurrence state, as shown in Fig. 10, the cutting-plane area of moisture can be defined as
| |
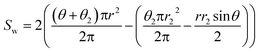 | (14) |
Substituting eqn (11) and (13) into eqn (14), we obtain
| |
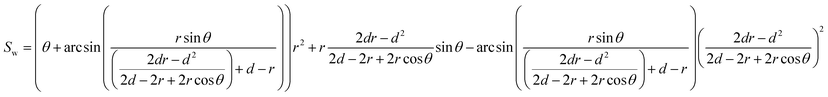 | (15) |
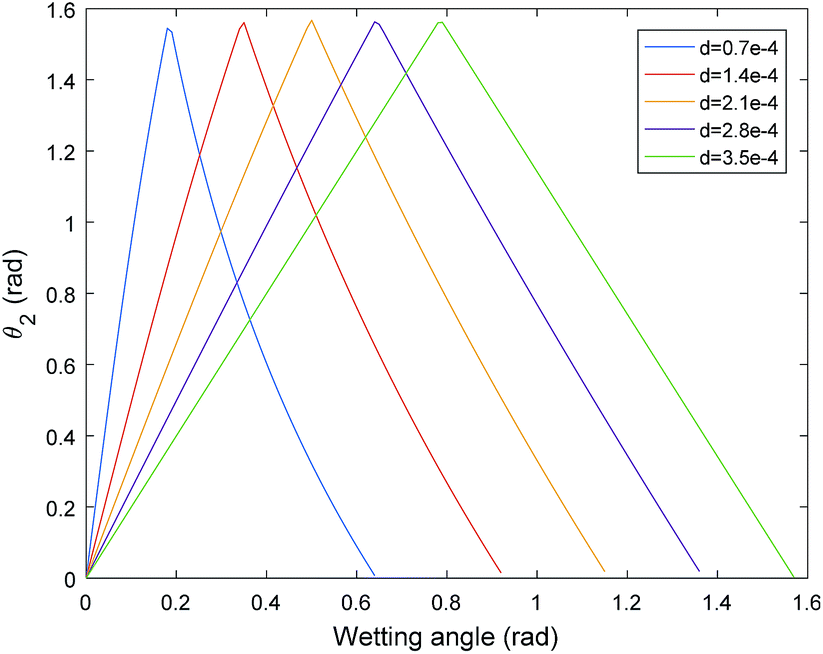
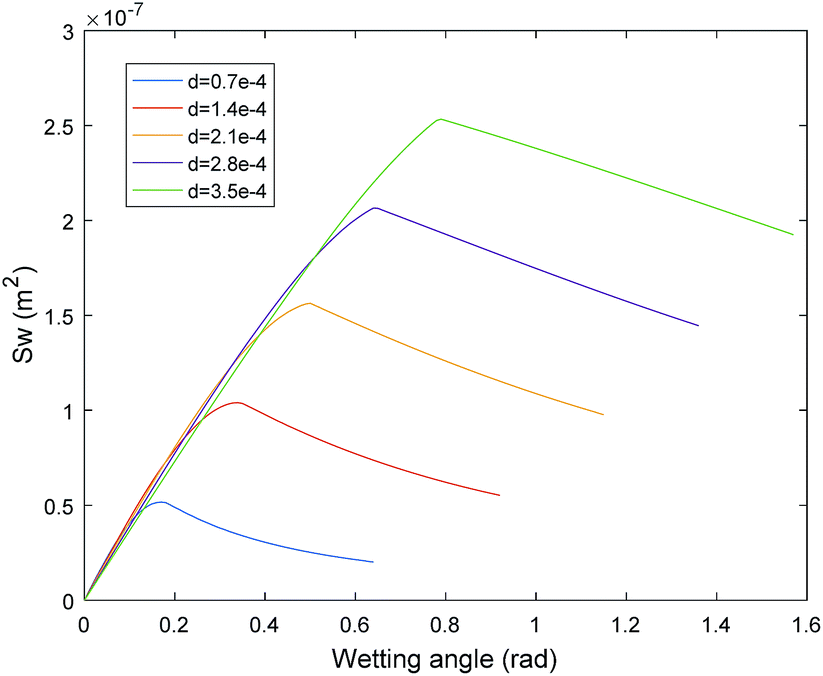
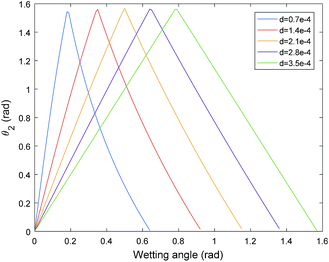
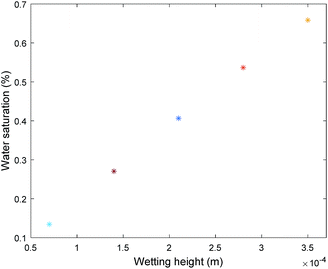
The cross-sectional area of the occupied water is closely related to the contact angle, the mean radius of the pores and the highest wetting height. r is a physical parameter of the coal. θ and d are related to physical and chemical properties of the surface of the injected water. While the porosity is directly influenced by the cross-sectional area of the occupied water. Therefore, the cross-sectional area occupied by water should be analysed. The mean radius of the pores is 3.5 × 10⁻⁴ m, obtained by a Mercury Porosimetry Analyzer. Therefore, the relation between wetting angle and θ2 and the relation between wetting angle and the moisture-occupied cross-sectional area Sw with different wetting height can be obtained as Fig. 11 and 12, respectively. With the increase of wetting angle, the θ2 increased sharply, then reached a peak of π/2, followed by a dramatically drop before it returned to zero. Although the different curves have the same change tendency, the curves with a lower wetting height reach the peak value first. However, the change in θ2 has a critical influence on the cross-sectional area of the occupied water based on eqn (14). Fig. 12 shows the change tendency of Sw along with the growth of wetting angle. The water-occupied cross-sectional area exhibited a linear-similar growth before it reached a peak value, and then declined slightly. However, the value of Sw represents the occupied area of moisture in the pore cross-section, which directly decreases the porosity based on eqn (9) and then influences coal permeability. For different wetting heights, the higher the wetting height is, the greater the peak value of Sw will be. The maximum value of Sw is the key point to force the porosity to the minimum, that is, the hardest point for gas flow. The maximum water saturation can be calculated by eqn (7) based on the maximum value of Sw with five different wetting heights, shown in Fig. 13. The maximum water saturation increased with increasing wetting height. When the wetting height is 3.5 × 10⁻⁴ m, the maximum water saturation reaches 65.83%, and the rest of percentage of 34.17% consists of the gas flow channel. Overall, the wettability of water has a critical impact on the gas seepage volume in coal.
 |
| | Fig. 11 The relation between wetting angle and θ2. | |
 |
| | Fig. 12 The relation between wetting angle and water-occupied sectional area. | |
 |
| | Fig. 13 The maximum water saturation with different wetting heights. | |
In the same way, the annular shape of the occupied water can be obtained by the definition
The cross sectional area of occupied water is closely related to wetting height, and the occupied water area will reach a maximum value of πr2 when the wetting height is equal to the pore radius of r. Furthermore, the influence of water on seepage will equal the result of the full filled shape, which will increase the initial starting pressure gradient.
3.2 Tube-seepage model
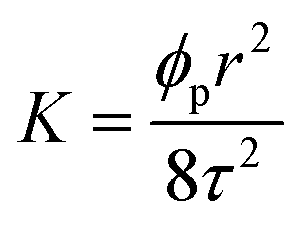
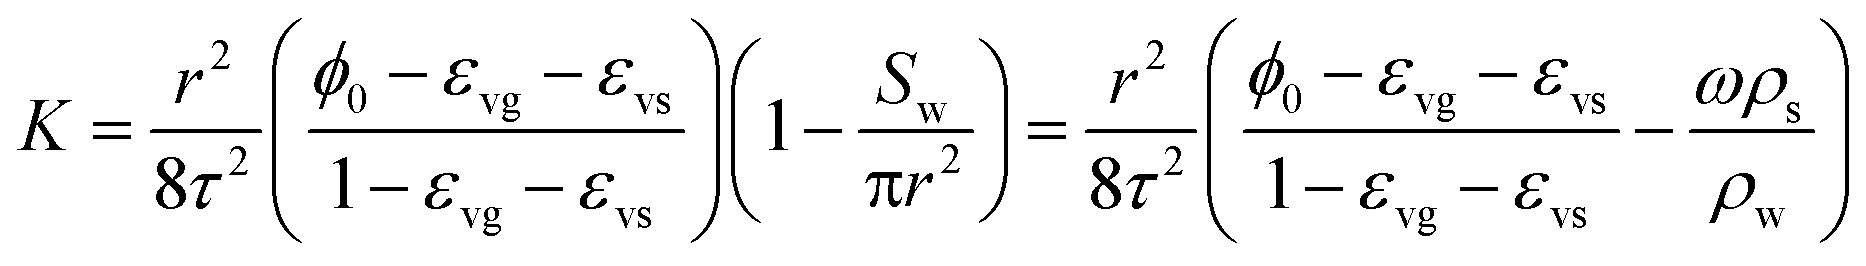
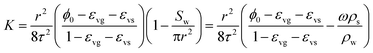
The relationships between permeability and porosity can be acquired based on Kozeny–Carman equation, as follows,62| |
 | (17) |
where ϕp is the porosity of the seepage model; r is the average pore diameter; τ is the tortuosity of the length of the capillary tube.
3.3 Mathematical model of porosity
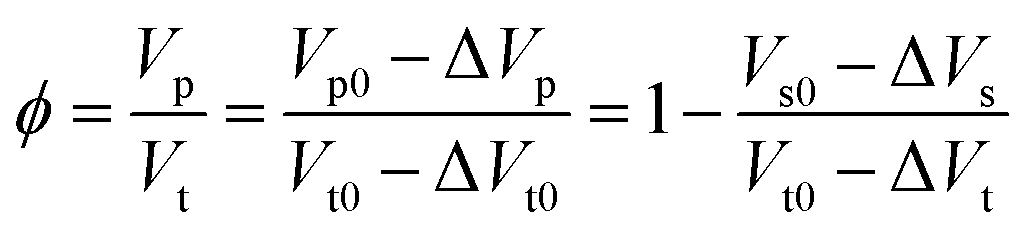
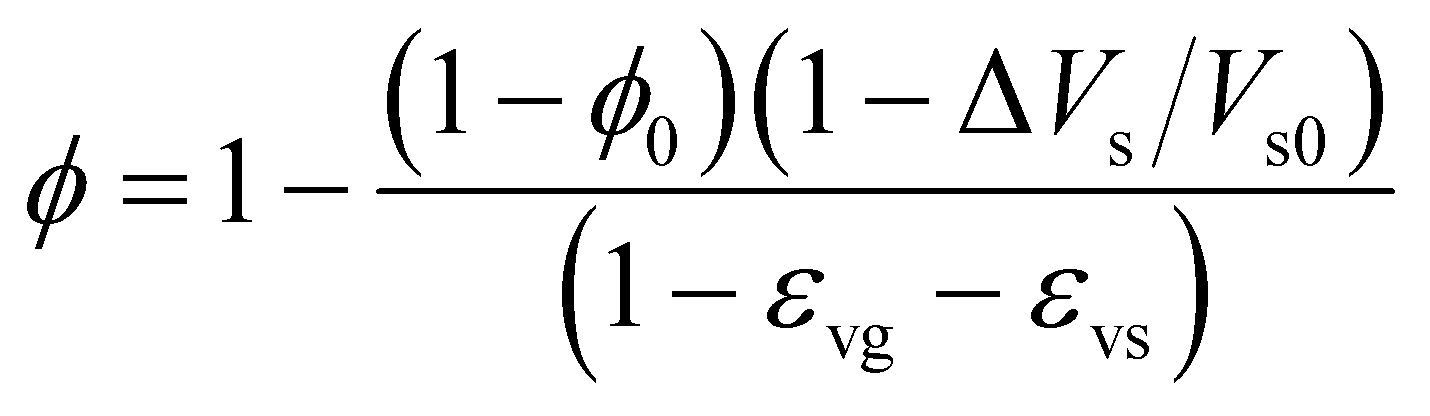
Porosity is an important physical parameter for describing the connectivity of the porous medium. It can be influenced by many factors, such as gas pressure, surrounding rock stress, temperature, and burial depth. Assuming the parameters are described as follows. The volume of the solid skeleton for the porous medium is Vs, and ΔVs is the variable quantity of the solid skeleton. The total volume of the porous medium is Vt, and ΔVt is the variable quantity of the total volume. The pore volume of the porous medium is Vp, and ΔVp is the variation of the pore volume. Based on the definition of porosity, the deformation formula can be written as| |
 | (18) |
where Vp0 is the initial pore volume, Vs0 is the initial solid skeleton volume, Vt0 is the initial total volume.
The volumetric strain εν and initial porosity ϕ0 are defined as
| |
 | (19) |
| | |
εv = ΔVt/Vt0 = εvg + εvs
| (20) |
where
ενs is volumetric strain induced stress condition;
ενg is volumetric strain induced gas adsorption, which can be obtained as follows.
49| |
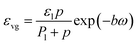 | (21) |
where
εl is the maximum gas sorption-induced strain;
Pl is the Langmuir pressure constant;
b is the adsorption decay coefficient;
w is the moisture content;
p is the gas pressure.
Substituting eqn (19) and (20) into eqn (18), we obtain
| |
 | (22) |
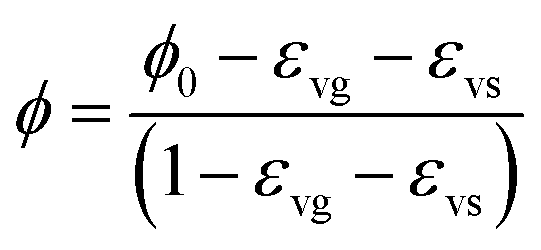
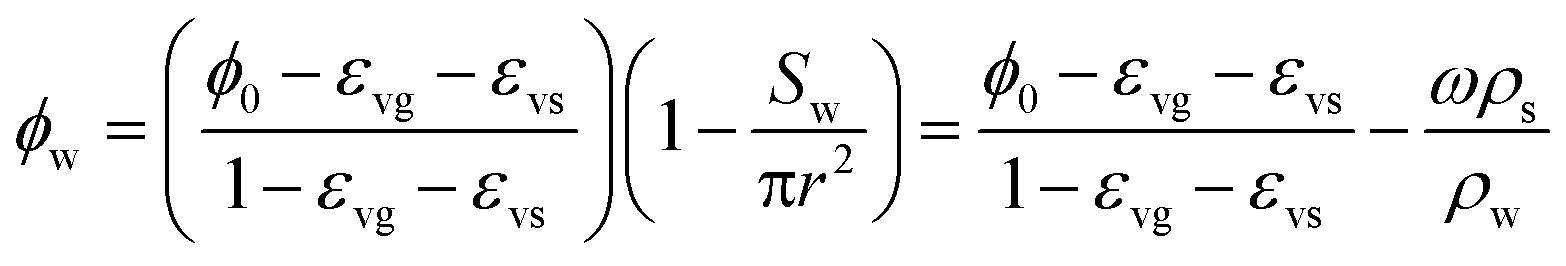
If the change in solid skeleton volume is ignored, eqn (22) can be simplified as follows.
| |
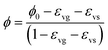 | (23) |
3.4 Permeability of the tube-bundle model with moisture
The permeability of coal or rock is one of the critical parameters, which can assess the ability of a porous material to allow fluids (gas or liquid) to pass through. Seepage capability not only closely relates to porosity, but also has an intimate manner with pore shapes and their level of connectedness in the medium. The coal porosity with moisture can be obtained from eqn (6) and (9). Eqn (23) can be regarded as the initial porosity without the influence of water, but it can be impacted by the stress conditions. Therefore, ϕ in eqn (23) can be considered as equating with ϕi in eqn (9). Substituting eqn (23) into eqn (9) or (6), we obtain| |
 | (24) |
Substituting eqn (24) into eqn (17) yields
| |
 | (25) |
Eqn (25) can be simplified to eqn (26).
where
where
a and
b are coefficients related to, for instance, density, porosity, pore tortuosity, pore radius and pore intensity; it can also be found that permeability is closely related to
Sw, which is directly related to contact angle and wetting height. That is to say, the reservoir permeability can be affected by the fluid wettability used to improve the reservoir gas recovery. Volumetric strain can be described as
εν =
ενs =
cσke without considering the sorption.
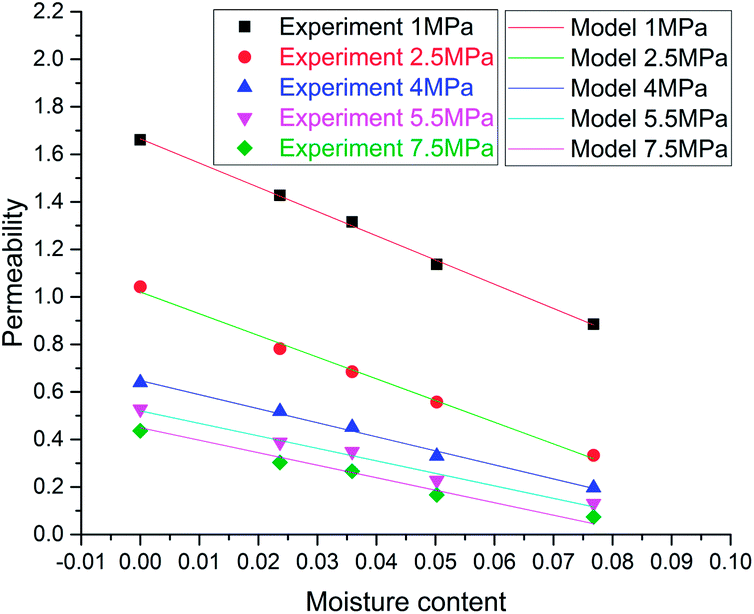
The model can match up well with53 experimental data, as shown in Fig. 14, and the fitting precisions are more than 96.89%. The experimental results can be well explained by the mathematic model, and, in return, the validity of the theoretical seepage model also can be demonstrated by experimental data. This theoretical model provides another compelling reason to explain the influence of moisture content on porosity and permeability in the process of CBM extraction.
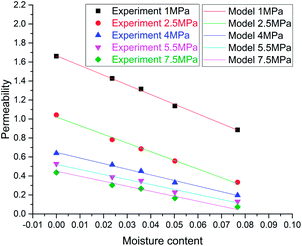 |
| | Fig. 14 Comparison between experiment data and the model.53 | |
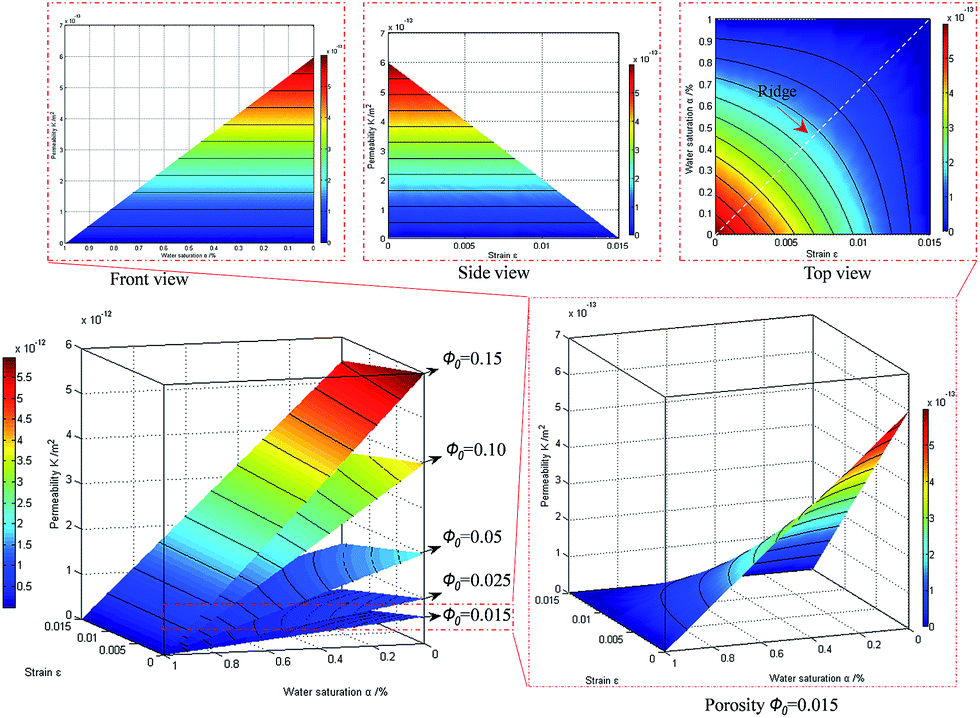
To investigate the influence of strain and water saturation, the coal parameters of Wei Jiagou were obtained by measurement: the mean radius r is 3.5 × 10⁻⁴ m, the water density is 1000 kg m−3, the coal density is 1275 kg m−3, and the pore tortuosity τ is 1.9595. The relations between permeability and other parameters under different initial porosities can be described as in Fig. 15. It is obviously found that permeability is influenced by the combined effect of water strain, initial porosity and water saturation. The permeability can be dominated by the initial porosity under the same conditions of water saturation and volumetric strain, and a large initial porosity has a better permeability, which demonstrates that the initial porosity is an important parameter to evaluate the initial seepage capability of coal. The maximal permeability can be obtained without the effect of water saturation and strains, as shown in Fig. 16, and it increases linearly with an increased initial porosity, which indicates that the initial porosity is a critical parameter to assess the permeability of reservoir. Moreover, the influence of volumetric strain on seepage can be decreased at a large initial porosity due to the limited impact of strains. The permeability contour at a porosity of 0.015 can be extracted to analyse the change tendency of permeability along with strains and water saturation, and it is found that the permeability will drop with one of the parameters increasing with the other parameter constant. In addition, the prominent field of the combined effect of water saturation and strains can be found at the ridge of the permeability contour at a porosity of 0.015. However, water saturation can be directly influenced by pore radius and the sectional area of the occupied water. Moreover, the sectional area of the occupied water is a complex parameter related to contact angle, wetting height and the mean radius. Therefore, permeability can be improved though these related parameters. The pore radius can be expanded and broken by advanced hydraulic technology to increase the permeability. For the contact angle and wetting height, a suitable improving fluid should be selected to reach the purpose that it can reduce the fluid-occupied area of the pores and can save the volume of improving fluid to reach the same effect of improving permeability.
 |
| | Fig. 15 The relation between water saturation, strain, porosity and permeability. | |
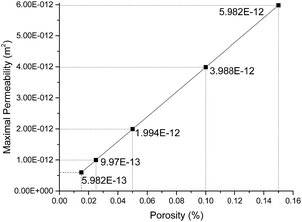 |
| | Fig. 16 The relation between maximal permeability and porosity. | |
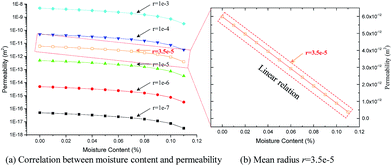
If the mean radius is considered as a variable, the relation between moisture content and permeability can be described as in Fig. 17(a) with a logarithm coordinate. Fig. 17(b) shows a linear relation between the permeability and moisture content at a mean radius r = 3.5 × 10⁻⁵ m. Therefore, it can be found that the magnitude of permeability can be dominated by the porosity and the moisture content has an obvious influence on permeability. In summary, the selection of improving fluid is very important to improving reservoir performance, and wettability is a non-ignored factor for considering on improving fluid selection.
 |
| | Fig. 17 The relation between moisture content and permeability. | |
4. Discussion
4.1 Relationship between contact angle and wetting height
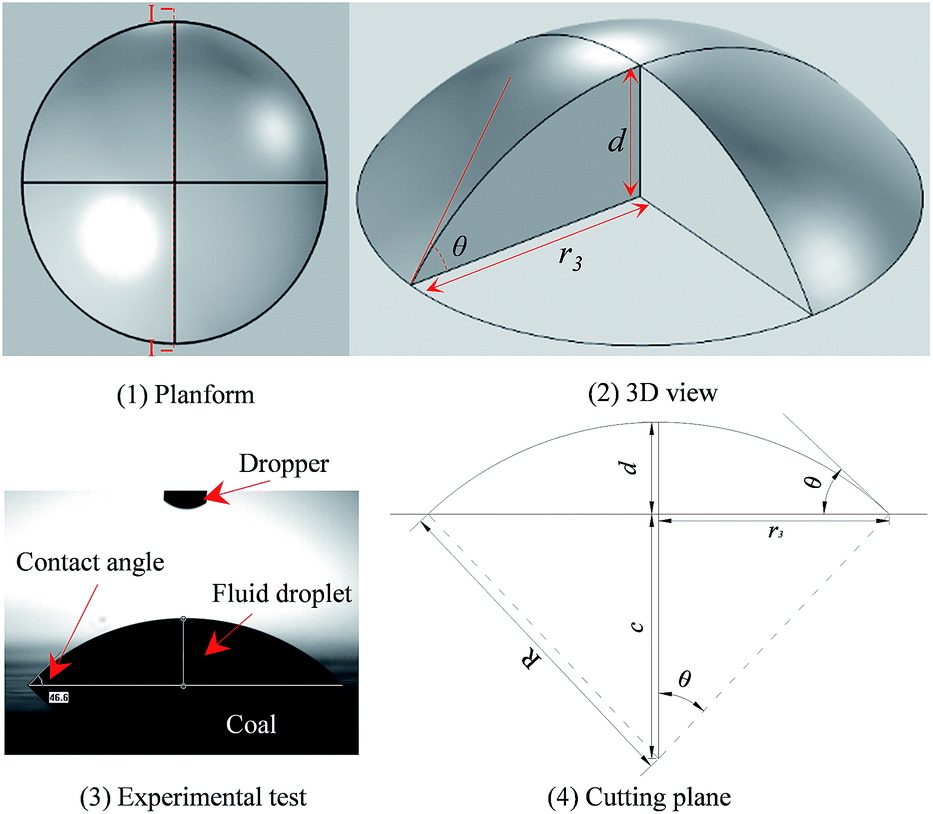
The wetting process is a spontaneous phenomenon in nature: when the contact between a fluid and solid occurs, the fluid will spread out along solid surface, which will lead to a lower surface free energy for the whole system.58 Liquid water will form a droplet of a certain volume on the flat surface of coal or rock under the action of tension and the wetting effect. Keeping the liquid–water wetting volume constant, the wetting angle of diverse liquid wettability will change, and its wetting height will also change as follows.
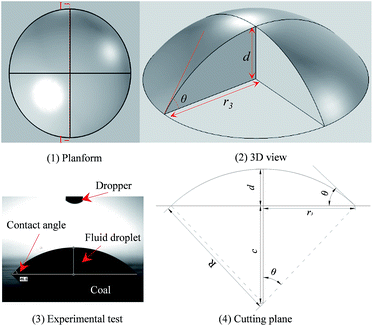
In order to obtain the relationships between the contact angle θ and wetting height d, a liquid-drop model is proposed as follows. The shapes formed by different wettability liquids are assumed to be parts of a sphere with the same liquid volume on the flat surface of coal or rock, as shown in Fig. 18.
 |
| | Fig. 18 Liquid-drop model. | |
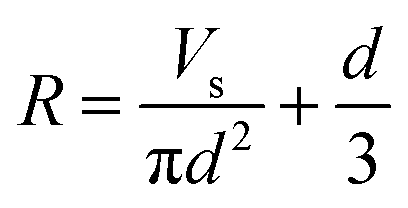
The formula for the ball-segment volume can be written as
| | |
Vs = (πd2(3R − d))/3
| (27) |
where
Vs is the volume of the ball segment,
d is the wetting height, and
R is the radius of the ball segment.
Eqn (27) can be converted to
| |
 | (28) |
According to the relationships inside the triangle of a sector, we obtain
| | |
r3 = Rsinθ
| (29) |
where
r3 is the radius of the cutting plane of the ball segment,
θ is the contact angle.
Substituting eqn (28) and (29) into eqn (30), we obtain
| |
 | (31) |
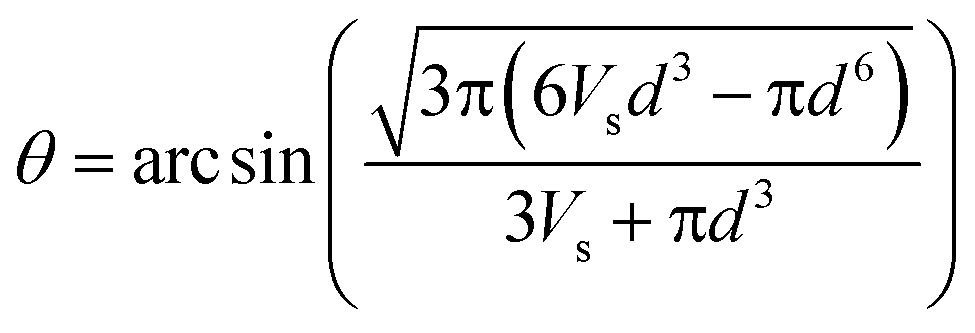
Defining the system variable parameters in MATLAB, solving eqn (31) and excluding inappropriate solutions, we obtain
| |
 | (32) |
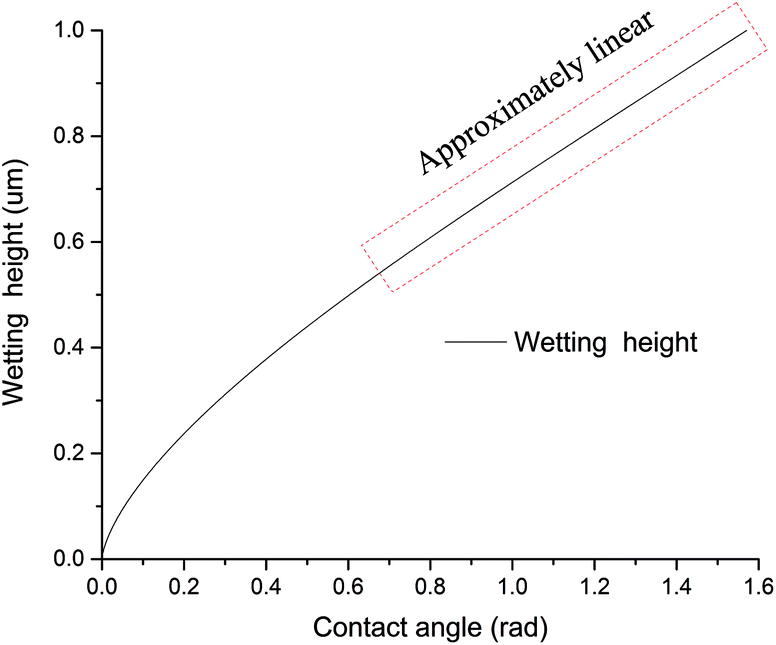
When the contact angle θ = π/2, the volume of the ball segment can be obtained: Vs = (2πR3)/3, and R = r3 can also be obtained. When R = 1 μm is set at the contact angle θ = π/2, the relationships between the contact angle and wetting height under the condition of a constant volume can be obtained as in Fig. 18. It is easily found that the shape of the droplet relates to the wettability of the liquid: the stronger the water wettability is, the smaller the contact angle and wetting height will be. Wetting height increases with increased contact angle, while its increasing rate decreased gradually and then reached a steady state, which exhibited an approximately linear relationship with contact angle, as shown in Fig. 19.
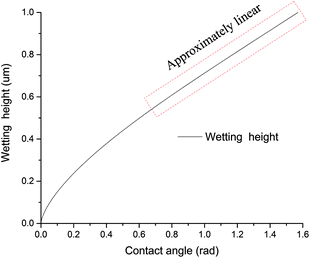 |
| | Fig. 19 Relationship between contact angle and wetting height. | |
4.2 Contact angle of different improving fluids
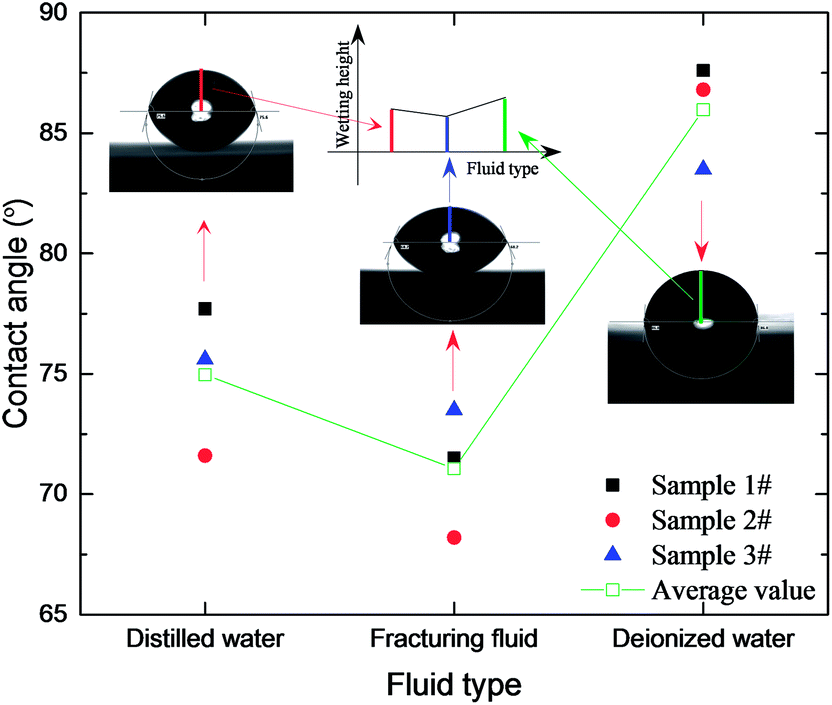
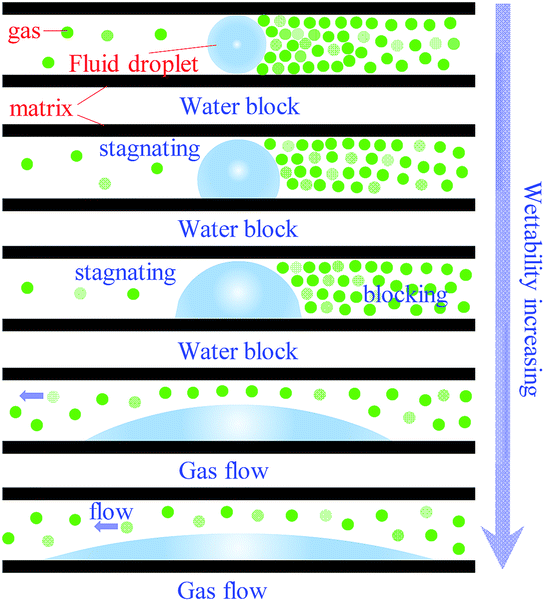
To obtain the contact angle of different improving fluids, the contact angle test machine of JY-PHa was used for this experimental test with fixed distance and magnification times. And the volume of the fluid droplet is kept the same, 15 μL, for each test. The main components of the fracturing fluid are hydroxypropyl guar, isopropanol, polyacrylamide and ethylene glycol.63 The results of contact angles with different improving fluids were obtained, as shown in Fig. 20. It was found that the contact angle of the fracturing fluid is the smallest and its wetting height is also the smallest in the three improving fluids, which is in accord with the results of the wetting model developed in the above section. The effect of improving fluid wettability on gas flow can be explained as in Fig. 21. At the same radius of pore in coal, the improving fluid with a lower wettability can bring a water-block effect, which can stop gas flow and dramatically reduce coal permeability, which is bad for gas recovery and hazards prevention. And the improving fluid with a higher wettability not only can have the effect of gas displacement it can also reduce the water-block effect. However, wettability can be improved by surfactant. The fracturing fluid shows a better wettability on the coal surface due to the surfactant of isopropanol. Therefore, coal wettability can be altered by selecting a suitable surfactant so as to reduce the water-block damage caused by fracturing fluids. For the same wetting area in a microscopic pore structure, the water-occupied volume will be larger when the wettability is smaller, that is, more improving fluid will be used for eliminating the hazards of methane. The use of a better wettability improving fluid will save the cost of volume and has a good performance on improving the reservoir. Therefore, it is better to use a high wettability fluid in hydraulic technology, which is conducive to methane hazards control and CBM extraction. This result is in accordance with general experimental research.64
 |
| | Fig. 20 Contact angle tests with different fluid types. | |
 |
| | Fig. 21 Impact of moisture wettability on gas flow. | |
However, volumetric strain is also a critical parameter that can influence the porosity of a coal matrix and it can be affected by different external and internal factors, such as pore gas pressure, adsorption-induced strain considering moisture, stress condition, thermal change. These influences are complicated intertwined processes which contain the interactions among gas, water, stress, thermal and other factors. This multi-field coupling and multiphase flow needs more experiments and discussion.
5. Conclusions
To obtain the moisture occurrence state in pores, two samples from different coal mines were used for a mercury-injection test and microscopic observation. The Wei Jiagou coal mine samples were used as a sample to analysis the dynamic process of moisture change and its influence model on gas flow. Based on ESEM observation, a mathematical model and the contact angle test, the following conclusion can be drawn:
(1) The main types of water occurrence state obtained were: a crescent shape, full filled shape and annulus shape, which provide powerful evidence to explain the influence of water on porosity. It was also shown that the box counting reached a minimum at a chamber pressure of 520 Pa and were reduced as a whole after water wetting.
(2) The cross-sectional area of occupied water would reach a peak value along with the change of contact angle, which has the maximum impact on the effective porosity. The experimental data can be matched well by the proposed moisture influence model. The increase of strains and water saturation both have a negative impact on permeability, while strains have little influence on permeability at a large initial porosity.
(3) For the same wetting area in the microscopic pore structure, the water-occupied volume and contact height will be larger when the wettability is smaller. The use of a better wettability improving fluid with a proper surfactant will save the cost of volume and have a good performance on the result of hydraulic technology.
Conflicts of interest
There are no conflicts to declare.
Acknowledgements
This study was supported by the National Natural Science Foundation of China (51474039, 51404046), Chongqing University Postgraduates' Innovation Project (CYS15007), Scientific Research Foundation of State Key Laboratory of Coal Mine Disaster Dynamics and Control (2011DA105287-ZD201302 and 2011DA105287-MS201403), Fundamental Research Funds for the Central Universities (106112015CDJXY240003), Chongqing Postdoctoral Research Project (Xm2017117) and the Basic Research of Frontier and Application of Chongqing (cstc2015jcy jA90019, cstc2016jcyjA0085).
References
- W. J. Herz, D. A. Thompson, C. E. Brett and J. R. Holland, AAPG Bull., 1983, 67, 483 Search PubMed.
- C. W. Byrer, T. H. Mroz and G. L. Covatch, J. Pet. Technol., 1987, 39, 821–834 CrossRef.
- J. R. Kelafant, V. A. Kuuskraa and D. E. Wicks, AAPG Bull., 1988, 72, 965–966 Search PubMed.
- D. E. Hallinger, AAPG Bull., 1991, 75, 366 Search PubMed.
- C. R. Ward, Int. J. Coal Geol., 2002, 50, 135–168 CrossRef CAS.
- J. Sobczyk, Fuel, 2014, 115, 288–294 CrossRef CAS.
- L. Wang, L. B. Cheng, Y. P. Cheng, G. Z. Yin, C. Xu, K. Jin and Q. L. Yang, J. Nat. Gas Sci. Eng., 2014, 18, 164–174 CrossRef.
- J. Sobczyk, Fuel, 2011, 90, 1018–1023 CrossRef CAS.
- J. A. Xu, S. J. Peng, D. D. Zhang, H. W. Yang and Y. Q. Tao, Disaster Adv., 2010, 3, 442–446 Search PubMed.
- Y. Konno, Y. Jin, K. Shinjou and J. Nagao, RSC Adv., 2014, 4, 51666–51675 RSC.
- A. Stephen, A. Adebusuyi, A. Baldygin, J. Shuster, G. Southam, K. Budwill, J. Foght, D. S. Nobes and S. K. Mitra, RSC Adv., 2014, 4, 22779–22791 RSC.
- S. Zhang, X. Xian, J. Zhou and L. Zhang, RSC Adv., 2017, 7, 42946–42955 RSC.
- D. Ma, Q. Li, M. Hall and Y. Wu, Energies, 2017, 10, 527 CrossRef.
- D. Ma, X. X. Miao, Y. Wu, H. B. Bai, J. G. Wang, M. Rezania, Y. H. Huang and H. W. Qian, J. Pet. Sci. Eng., 2016, 146, 297–307 CrossRef CAS.
- C. C. Li, D. M. Liu, Y. D. Cai and Y. B. Yao, Energy Explor. Exploit., 2016, 34, 378–399 CrossRef.
- Z. J. Pan and L. D. Connell, Int. J. Coal Geol., 2012, 92, 1–44 CrossRef CAS.
- I. Palmer, Int. J. Coal Geol., 2009, 77, 119–126 CrossRef CAS.
- J. Q. Shi and S. Durucan, Int. J. Coal Geol., 2014, 131, 172–176 CrossRef CAS.
- S. Tao, Y. B. Wang, D. Z. Tang, H. Xu and Y. M. Lv, Energy Sources, Part A, 2012, 34, 1801–1807 CrossRef CAS.
- L. Klinkenberg, Drilling and Production Practice, 1941 Search PubMed.
- L. W. Fan, H. P. Fang and Z. F. Lin, Phys. Rev. E: Stat., Nonlinear, Soft Matter Phys., 2001, 63, 051603 CrossRef CAS PubMed.
- S. T. Chu, Trans. ASAE, 1994, 37, 1205–1208 CrossRef.
- W. Purcell, J. Pet. Technol., 1949, 1, 39–48 CrossRef CAS.
- P.-z. Wong, J. Koplik and J. Tomanic, Phys. Rev. B: Condens. Matter Mater. Phys., 1984, 30, 6606 CrossRef.
- U. Frisch, B. Hasslacher and Y. Pomeau, Phys. Rev. Lett., 1986, 56, 1505 CrossRef CAS PubMed.
- G. R. McNamara and G. Zanetti, Phys. Rev. Lett., 1988, 61, 2332 CrossRef PubMed.
- S. Chen and G. D. Doolen, Annu. Rev. Fluid. Mech., 1998, 30, 329–364 CrossRef.
- C. K. Aidun and J. R. Clausen, Annu. Rev. Fluid. Mech., 2010, 42, 439–472 CrossRef.
- I. Fatt, Trans. Am. Inst. Min. Metall. Eng., 1956, 207, 160–163 Search PubMed.
- J.-Q. Wang, J.-F. Zhao, M.-J. Yang, Y.-H. Li, W.-G. Liu and Y.-C. Song, Fuel, 2015, 145, 170–179 CrossRef CAS.
- M. Ioannidis, M. Kwiecien, I. Chatzis, I. MacDonald and F. Dullien, Comprehensive pore structure characterization using 3D computer reconstruction and stochastic modeling, SPE Annual Technical Conference and Exhibition, 1997, p. 38713 Search PubMed.
- R. Marschallinger, Comput. Geosci., 1998, 24, 875–883 CrossRef.
- J. Seidle, M. Jeansonne and D. Erickson, Application of matchstick geometry to stress dependent permeability in coals, SPE Rocky Mountain Regional Meeting, 1992, p. 24361 Search PubMed.
- J. Shi and S. Durucan, Transp. Porous Media, 2004, 56, 1–16 CrossRef.
- S. Durucan and J. Edwards, Min. Sci. Technol., 1986, 3, 205–216 Search PubMed.
- X. Cui and R. M. Bustin, AAPG Bull., 2005, 89, 1181–1202 CrossRef CAS.
- Y. Peng, J. Liu, Z. Pan, L. D. Connell, Z. Chen and H. Qu, Fuel, 2017, 189, 270–283 CrossRef CAS.
- Y. Zhao, S. Cao, Y. Li and L. Qin, Journal of Mining and Safety Engineering, 2015, 32, 644–650 Search PubMed.
- C. Zhai, X. W. Xiang, J. Z. Xu and S. L. Wu, Nat. Hazards, 2016, 82, 507–530 CrossRef.
- G. Z. Hu, J. L. Xu, T. Ren, Y. W. Dong, W. Qin and Z. J. Shan, Int. J. Min., Reclam. Environ., 2016, 30, 48–63 CrossRef CAS.
- V. Perepelitsa, L. Shmatovskiy and A. Kolomiets, Technical and Geoinformational Systems in Mining, 2011, pp. 265–269 Search PubMed.
- Z. G. Yuan, H. T. Wang and N. P. Liu, Adv. Compos. Mater., Pts 1–3, 2012, 482–484, 1668–1671 Search PubMed.
- Y. Konno, Y. Jin, J. Yoneda, T. Uchiumi, K. Shinjou and J. Nagao, RSC Adv., 2016, 6, 73148–73155 RSC.
- T. Teng, J. G. Wang, F. Gao, Y. Ju and T. Xia, Transp. Porous Media, 2016, 113, 357–382 CrossRef CAS.
- D. Ma, M. Rezania, H. S. Yu and H. B. Bai, Eng. Geol., 2016, 217, 61–70 CrossRef.
- D. Ma, Z. Zhou, J. Wu, Q. Li and H. Bai, Energies, 2017, 10, 612 CrossRef.
- P. J. Crosdale, T. A. Moore and T. E. Mares, Int. J. Coal Geol., 2008, 76, 166–174 CrossRef CAS.
- J. H. Levy, S. J. Day and J. S. Killingley, Fuel, 1997, 76, 813–819 CrossRef CAS.
- D. Chen, Z. J. Pan, J. S. Liu and L. D. Connell, Energy Fuels, 2012, 26, 1695–1706 CrossRef CAS.
- D. R. Wilson, P. Lively, J. A. Sandarusi, et al. Coal bed methane recovery, US Pat., US5402847, 1995.
- R. Puri and D. Yee, Enhanced coalbed methane recovery, SPE Annual Technical Conference and Exhibition, 1990, p. 20737 Search PubMed.
- L. Arri, D. Yee, W. Morgan and M. Jeansonne, Modeling coalbed methane production with binary gas sorption, Proceeding of SPE Rocky Mountain Regional Meeting, 1992, p. 24363 Search PubMed.
- G. Yin, C. Jiang, X. U. Jiang, S. Peng and L. I. Wenpu, Chin. J. Rock Mech. Eng., 2011, 30, 3401–3406 Search PubMed.
- D. R. Spears, W. Sady and L. D. Kispert, Am. Chem. Soc., Div. Fuel Chem., Prepr. Pap., 1991, 1277–1282 CAS.
- S. Li, D. Tang, H. Xu, Z. Yang and L. Guo, Energy Fuels, 2012, 26, 5005–5014 CrossRef CAS.
- M. M. Dubinin, Chem. Rev., 1960, 60, 235–241 CrossRef CAS.
- J. I. Joubert, C. T. Grein and D. Bienstock, Fuel, 1974, 53, 186–191 CrossRef CAS.
- M. Koc and R. Bulut, Transportation Research Board Annual Meeting, 2014, 4414–4417 Search PubMed.
- J. Li, Q. Du and C. X. Sun, Pattern Recognit., 2009, 42, 2460–2469 CrossRef.
- Y. D. Cai, D. M. Liu, Z. J. Pan, Y. Che and Z. H. Liu, Transp. Porous Media, 2016, 111, 479–497 CrossRef CAS.
- Z. H. Ye, D. Chen and J. G. Wang, Fuel, 2014, 121, 1–10 CrossRef CAS.
- G. Mavko and A. Nur, Geophysics, 2012, 62, 1480–1482 CrossRef.
- U. S. D. o. Energy, 2009.
- L. U. Yi-Yu, Y. Feng, G. E. Zhao-Long, Z. Zhe and X. D. Lin, J. China Coal Soc., 2015, 40, 93–97 Search PubMed.
Footnote |
| † Electronic supplementary information (ESI) available. See DOI: 10.1039/c7ra09346b |
|
| This journal is © The Royal Society of Chemistry 2018 |
Click here to see how this site uses Cookies. View our privacy policy here. 
 Open Access Article
 This Open Access Article is licensed under a Creative Commons Attribution-Non Commercial 3.0 Unported Licence
 a,
Shugang Cao
a,
Shugang Cao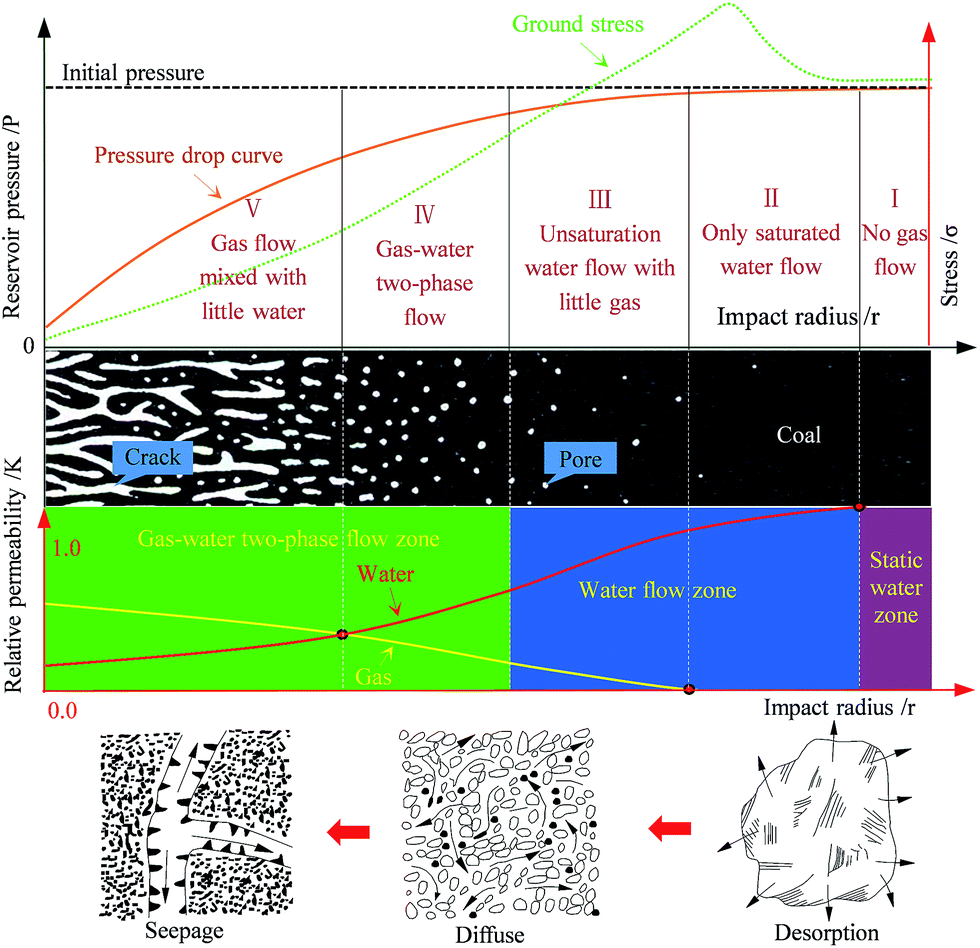
 classification system, Dubinin classification system, IUPAC classification system, Gan classification system and Ju Yiwen classification system, as shown in Fig. 5.54–56 For the better description of pore size, the
  (Hodot) decimal classification system is adopted in this paper. Pores are classified into micropores (r ≤ 10 nm), transition pores (10 < r ≤ 100 nm), mesopores (100 < r ≤ 1000 nm) and macropores (r > 1000 nm). Micropores and transition pores are thought to be related with the capillary condensation effect and the diffusion of methane occurs, respectively. And mesopores are the seepage space of a slow laminar flow; the space of severe laminar-flow and the mixing infiltration space of laminar flow, and turbulent flow are composed by macropores and visible pores, respectively.