A dual fluorogenic and 19F NMR probe for the detection of esterase activity†
Jie
Hu‡
a,
Kai
Cheng‡
b,
Qiong
Wu
b,
Dashuang
Ding
a,
Conggang
Li
 *b and
Zhen
Li
 *a
*a
aDepartment of Chemistry, Hubei Key Lab on Organic and Polymeric Opto-Electronic Materials, Wuhan University, Wuhan 430072, China. E-mail: lizhen@whu.edu.cn; lichemlab@163.com
bChina State Key Laboratory of Magnetic Resonance and Atomic and Molecular Physics, Wuhan Institute of Physics and Mathematics, The Chinese Academy of Sciences, Wuhan 430071, China. E-mail: conggangli@wipm.ac.cn
First published on 24th April 2018
Abstract
In this study, a dual-channel probe of FlE based on flavonoid derivatives is reported, which can yield “turn-on” signals of both fluorometry and 19F nuclear magnetic resonance in response to the presence of esterase. Upon the addition of esterase, FlE could convert into Fl, possessing the ESIPT effect. As a result, the fluorescence intensity was significantly enhanced and peaked at 510 nm, accompanying a change in the fluorescence of solution from nonluminous to strong green. Moreover, as determined by 19F NMR, the signal could apparently shift from δF −111.57 to −111.69 ppm. Due to the combination of these two detection approaches having good sensitivity, high selectivity, and real-time detection, FlE has been successfully applied to confocal fluorescence imaging for the detection of esterase in cells, which consistent with the 19F NMR test results in some sense.
Introduction
Esterase functions as a catalyst in the hydrolysis of esters and represents a broad class of enzymes widely used in biology and biotechnology. For example, it participates in material metabolism, material transport and gene expression through regulation of the activity of proteins in the organisms.1–3 It also plays an important role in cellular signaling.4 In addition, it has a wide range of applications in food processing and in the production of fine chemicals.5 Thus, to explore the related biological behaviors in detail, a number of methods, such as capillary zone electrophoresis,6 spectrophotometric analyses,7 plate assays,8 chromatography,9 fluorometry10 and so on, have been developed for the detection of the esterase activity. Among these, fluorometry demonstrates some advantages due to its simple operation, high sensitivity and low cost. Recently, Harry and co-workers reported a new fluorogenic esterase sensor through the activation of cellulosic materials for CuAAC click chemistry.11 Tong's group designed and synthesized a red fluorophore with the characteristic of aggregation-induced emission (AIE) and the effect of excited-state intramolecular proton transfer (ESIPT) to image esterase in the mitochondria of living cells.12 However, fluorescent sensors are not perfect for use in biological and tissue imaging due to their limited fluorescence penetration. Accordingly, most of these reported sensors have been studied in vitro and in small animals (such as mice and zebrafish) with good performance; however, their use is much limited for study of large animals and deep structures. To make the fluorescent probe more widely used in a biosystem, many near-infrared13 or two photon14 chromophores have been designed. Thus, to better improve the imaging depth, an alternative good choice is to combine nuclear magnetic resonance (NMR) with fluorometry.15 Ideally, NMR spectroscopy can augment the limitations of the previously mentioned luminogens as it provides information of deep tissues due to good penetration as well as absolute and accurate information about the structure and composition with high temporal resolution.Actually, many 1H NMR probes have been reported for the investigation of physiological events due to their high sensitivity.16 However, 1H NMR probes often suffer from significant background interference. Although the sensitivity of 19F NMR is relatively low (83% relative to that of 1H NMR), the chemical shifts of F disperse in a large region and are sensitive to environmental changes. More importantly, there is no detectable background in biological systems. Thus, 19F NMR sensors have been extensively reported for the detection and imaging of biomolecules, especially for the detection of enzyme activity.17 Liang and co-workers designed a probe that could turn the 19F MRI signal “off” and then “on” for the sequential detection of GSH and Casp3/7 through GSH-controlled assembly and Casp3/7-controlled disassembly.18 Thayumanavan's group reported a novel dendron probe for the detection of a specific target enzyme by disassembly.19 Reasonably, 19F NMR can also be used to detect esterase, offering another sensing signal in addition to fluorescence. Herein, we present a dual indicator of FlE that can simultaneously provide fluorescence and 19F nuclear magnetic signals, as shown in Scheme 1, in response to the cleavage of acetoxyl by esterase.20
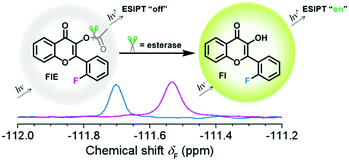 | ||
| Scheme 1 Response of FlE to esterase. After the addition of esterase, the 19F NMR signal shifted from δF −111.57 to −111.69 ppm and a strong fluorescence at 510 nm can be observed. | ||
Experimental
Reagents and materials
Dichloromethane was dried over and distilled from CaH2 under an atmosphere of dry nitrogen. All other chemicals were purchased from commercial suppliers in analytical grade and used without further purification. Sodium sulfate, potassium hydroxide, sodium bicarbonate, calcium chloride, magnesium chloride, hydrochloric acid, pyridine, H2O2, ethanol, acetic anhydride, glutathione, and vitamin C were purchased from Sinopharm Chemical Reagent Beijing Co., Ltd. 2-Hydroxyacetophenone was purchased from Aladdin Industrial Corporation, Shanghai, China. 2-Fluorobenzaldehyde and cysteine were purchased from HEOWNS Biochem Technologies LLC, Tianjin, China. Esterase and lysozyme were purchased from Source Biological Technology Co., Ltd, Shanghai, China. HeLa cells were provided by the culture collection center in Wuhan university.Characterization
1H and 13C NMR spectroscopy studies were conducted in deuterated chloroform solution via a Varian Mercury 400 spectrometer at 25 °C using tetramethylsilane (TMS; δ = 0 ppm) as an internal standard. 19F NMR spectroscopy studies were conducted in phosphate-buffered saline containing 10% deuterated dimethyl sulfoxide using a Bruker Avance DPX 600 spectrometer at 37 °C. Photoluminescence spectra were obtained using a Hitachi F-4500 fluorescence spectrophotometer at 25 °C. Fluorescence quantum yields were determined using FLS980 at 25 °C. High resolution mass spectra were obtained using the AGILENT Q-TOF 6530 mass spectrometer.Preparation of compounds
Cell culture and imaging
HeLa cells/MCF-7 cells were grown at 37 °C in humidified 5% (v/v) CO2 incubators in high-glucose Dulbecco's modified Eagle's medium (DMEM) supplemented with 10% (v/v) fetal bovine serum (FBS) and 1% penicillin–streptomycin. For fluorescence imaging, HeLa cells/MCF-7 cells were incubated with FlE at 37 °C under 5% CO2 for 30 min and then washed 3 times with a PBS buffer solution. Confocal images were obtained using a Leica TCS SP8 laser-scanning microscope equipped with a 63× oil objective, and the excitation wavelength of 405 nm was used.19F NMR measurements on cells
To obtain HeLa/MCF-7 cell NMR samples, cells were incubated with FlE, then detached from culture flasks with 0.25% trypsin, centrifuged at 200 × g for 5 min at room temperature, washed once in PBS, and counted using a haemocytometer. After this, 2.5 × 10⁷ HeLa cells/MCF-7 cells were gently resuspended in DMEM containing 5 mM HEPES (pH 7.2), 90 mM D-glucose, and 10% DMSO-d6, and 300 μL of cell suspension was obtained, which was used for the NMR measurements.Electroporation of HeLa cells
HeLa cells were pelleted and mixed with esterase in EPB at 40 × 106 cells per mL. Then, 100 μL aliquots (4 × 10⁶ cells) were transferred into a 100 μL NucleocuvetteTM Vessel (Lonza) and electroporated using an Amaxa 4D-Nucleofector (Lonza). The pulse program for HeLa was CN114. HeLa cells were pulsed three times with gentle mixing in between the pulses. Directly after electroporation, samples were transferred to T75 cell culture flasks. About 13.5 × 10⁶ cells were added to T75 flasks containing 15 mL of pre-warmed culture medium. HeLa cells were returned to the incubator and allowed to recover for 5 h. For fluorescence imaging, these recovered HeLa cells were washed three times with pre-warmed PBS and then incubated with FlE in DMEM media for 30 min. For in-cell 19F NMR experimrnts, the recovered cells were washed three times with pre-warmed PBS and incubated with FlE in DMEM media for 30 min. Then, they were detached from the Petri dish or culture flask by 0.125% trypsin. After being centrifuged at 200 × g for 5 min at 25 °C, cells were washed once in DMEM and counted using a haemocytometer. Then, 2.5 × 10⁷ HeLa cells were gently resuspended in DMEM containing 5 mM HEPES (pH 7.2), 90 mM D-glucose, and 10% DMSO-d6, and 300 μL of cell suspension was obtained, which was used for the NMR measurements.Results and discussion
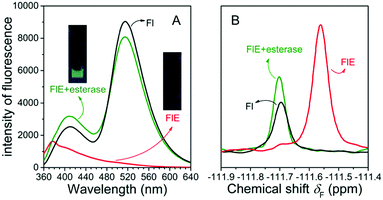
To achieve the molecular design of the dual-responsive probe of FlE, some fluorine atoms should be introduced, which is not difficult. However, to achieve the “turn-on” fluorescence signal, different mechanisms could be considered. According to the characteristic of esterase, especially the catalytic behavior, the ESIPT effect should be suitable for the molecular design: the additional linked acetyl group could block the intramolecular proton transfer to quench the fluorescence; however, after its cleavage in the presence of trace esterase, the fluorescence could be recovered.21 Accordingly, 2-fluorobenzaldehyde, a commercially available compound containing one fluorine atom, was directly used for the synthesis of compound 3 to offer the signal in 19F NMR spectra (Scheme 2). Then, compound 3 was oxidized to yield compound Fl with the ESIPT effect and the corresponding strong green fluorescence. As expected, after the introduction of the acetyl group, the active moiety of esterase, to obtain the FlE probe, the forbidden ESIPT effect led to loss of luminescence.The intermediates and the FlE probe were well characterized using 1H/13C nuclear magnetic resonance spectroscopy, mass spectrometry, and infrared spectroscopy (Fig. S7–S19, ESI†). Excitedly, the 19F chemical shifts of FlE and Fl were different, with an 19F peak at δF −111.57 ppm for FlE, which shifted to δF −111.69 ppm for Fl, which was good enough for the monitoring the esterase activity by the 19F NMR method. Thus, based on the totally different fluorescence behavior of FlE and Fl, FlE is a dual-responsive probe towards esterase with double “turn-on” output signals.
As shown in Fig. 1A, the very weak fluorescence of FlE could not be observed by naked eyes (as shown in the inset images), and only the weak fluorescence emission peak at 376 nm could be observed since the excited energy was dissipated in a non-radiative process as the result of the blocked ESIPT effect. Once esterase is encountered, the acetyl group is removed, and the intramolecular photon transfer is activated, which ignites the ESIPT effect. This leads to the strong green fluorescence as the visual “turn-on” signal. Similarly, in the presence and absence of the acetyl group, the 19F NMR signals were different as abovementioned, with the δF values at −111.57 ppm and −111.69 ppm, respectively. The fluorescence spectra and 19F NMR spectra of the reaction products were in agreement with those of compound Fl; this confirmed that esterase catalyzed FlE to Fl. Additionally, the MS spectra provided further proofs (Fig. S1, ESI†).
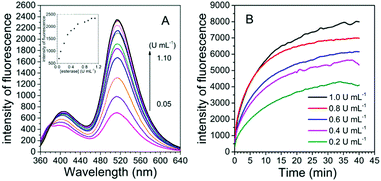
To examine the possibility of quantitative analysis of esterase activity, the experiments of concentration-dependent monitoring of enzymatic reaction were conducted. The titration experiment was carried out with esterase concentrations ranging from 0.05 to 1.1 U mL−1. Fig. 2A illustrates that the fluorescence intensity of the probe is gradually enhanced with the increasing concentration of esterase and finally reaches a saturation point at the concentration of 1.0 U mL−1. Overall, the fluorescence intensity was about 27 fold higher in the presence of esterase than that in the original state. A good linear relationship could be built in the concentration range of 0.05–0.3 U mL−1, with the detection limit calculated to be 0.001 U mL−1 (3σ/slope), which was similar to that obtained for the previously reported probes and low enough for esterase detection in biological systems (Fig. S2, ESI†).12,22 Thus, FlE was capable of detecting esterase. Moreover, in the presence of esterase at different concentrations (0.2 U mL−1, 0.4 U mL−1, 0.6 U mL−1, 0.8 U mL−1, and 1.0 U mL−1), the fluorescence intensity at 510 nm increased and reached a plateau in 40 min (Fig. 2B). Actually, the reaction rate was dependent on the esterase concentration, as demonstrated by the response time obtained for five different concentrations. The higher the concentration, the faster the initial reaction (Fig. 2B). Simultaneously, the fluorescence quantum yield increased from 0.20% to 5.21%, which was lower than that of Fl (18.10%) due to the absorption of non-luminescent substances such as esterase and unreacted FlE (Table S1, ESI†). The kinetics of the de-ester reaction were also determined according to the Michaelis–Menten equation. Correspondingly, the Michaelis constant (Km) and maximum velocity (Vmax) values could be calculated to be 27.0609 μM and 14.4928 μM s−1, respectively (Fig. S3, ESI†).
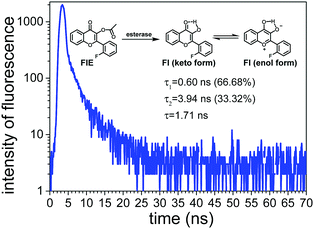
As shown in Fig. 3, Fl presented two fluorescence lifetimes of τ1 and τ2, confirming that Fl existed in two different forms, i.e. keto-form and enol-form, due to the ESIPT mechanism. The average fluorescence lifetime of Fl was calculated to be 1.71 ns. Since the probe FlE did not have a significant emission peak in the fluorescence emission spectrum, its fluorescence lifetime was not measured.
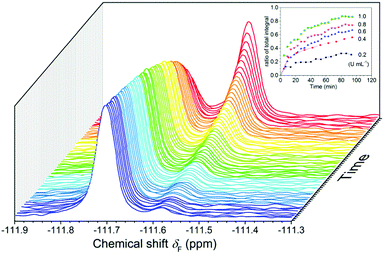
The results of 19F NMR experiments were similar to those of the fluorescence experiments with some slight variations (Fig. 4). As expected, the addition of esterase (0.4 U mL−1) to the FlE solution (1.0 × 10⁻⁴ mol L−1) resulted in gradual changes in the NMR spectra. The 19F signal at δF −111.57 ppm was slowly weakening, whereas a new 19F signal at δF −111.69 ppm grew. No other noticeable peaks in the 19F NMR spectra after the reaction suggested that FlE was nearly completely converted to compound Fl. Moreover, the ratio of the signal peak integral area in the 19F NMR spectra could accurately tell the reaction progress. This enabled the probe to monitor esterase in real time. Furthermore, the response rate of FlE to esterase was tested by time-course 19F NMR measurements in the first 90 min to resemble the time-dependent fluorescence spectra. However, as shown in Fig. S4 (ESI†), 19F NMR spectra took a longer time, more than 10 hours, to reach the reaction balance upon the addition of esterase (0.4 U mL−1). This is reasonable since the probe FlE should be easier to mix well with esterase in the 10 × 10 mm cuvette (used in the fluorescence experiments) rather than in the small glass NMR tube with different reaction speeds. Only the first 90 minutes of data were obtained for the remaining concentrations of esterase because the equilibrium was attained after a very long time in 19F NMR test.
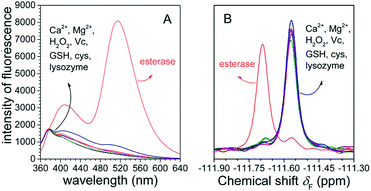
To examine whether FlE could specifically recognize esterase, we investigated its ability to discriminate between esterase and other analytes with possible interferences. Fluorescence changes and 19F signal changes of FlE towards various chemical entities including Ca2+, Mg2+, GSH, Cys, H2O2, vitamin C (Vc), lysozyme, and esterase were obtained. As shown in Fig. 5A, upon the addition of esterase, the fluorescence intensity of FlE at 510 nm exhibited significant enhancement accompanied with a distinct “turn on” green fluorescence. By contrast, other analytes caused no significant fluorescence signal changes. Similar to the case of fluorescence spectra, it was very easy to distinguish esterase from distractors in the 19F NMR spectra (Fig. 5B). Therefore, the excellent selectivity of esterase over other related analytes demonstrated that the probe FlE had potential applications in the detection of esterase in complex biological systems.
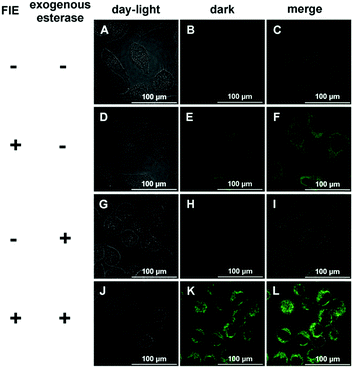
Due to its high sensitivity and selectivity for esterase, FlE was expected to be used for the intracellular enzyme activity detection. HeLa cells were used as a model, in which esterase was overexpressed.23 HeLa cells were incubated with FlE (1.0 × 10⁻⁴ mol L−1) for 30 min at 37 °C and then washed 3 times with a PBS buffer solution. As depicted in Fig. 6, upon excitation at 405 nm, HeLa cells exhibited nearly no background fluorescence (A–C). However, after being treated with FlE, HeLa cells demonstrated very strong fluorescence in the green channel (D–F); this was in agreement with the abovementioned fluorescence results of FlE. To further verify that the fluorescence change was intrigued by esterase, exogenous esterase was transferred into HeLa cells by electroporation. After being incubated with the same amount of FlE, the electroporation-treated cells generated a brighter green fluorescence, indicating that the “turn on” fluorescence signal in HeLa cells was really derived from the endogenous esterase. Additionally, MCF-7 cells were utilized to investigate the sensing property of the FlE probe and the time-dependent fluorescence. With the overexpressed esterase, MCF-7 cells were treated with FlE at different concentrations for 30 min at 37 °C (Fig. S5, ESI†).24 As easily observed, the fluorescence intensity increased with an increase in FlE concentration; this suggested a good cell permeability of FlE and its high reactivity in cells.
The 19F NMR spectra of FlE response to endogenous esterase in the cells were also obtained. The 19F spectra in cells are different from those obtained in buffer in the presence of esterase possibly due to the interference of various substances in cells. The intracellular environment was complicated, and F atoms were liable to forming intermolecular H bonds with H atoms in various environments. The formation of H bonds would cause significant changes in 19F NMR displacement. However, it did not affect the detection of the endogenous esterase. When the probe was incubated with the HeLa cells or MCF-7 cells for 30 min, two sets of signal peaks appeared in the 19F NMR spectra (Fig. S6A, ESI†). However, in the control experiment, HeLa cells, not cultured with FlE, did not show any F signals (Fig. S6B, ESI†); this indicated that the two sets of peaks in Fig. S6A (ESI†) should be ascribed to the probe. In this case, one group of signals originated from the unreacted probe, whereas the other corresponded to the product. These two sets of signal peaks had obviously different chemical shifts. These results demonstrated that the probe was an efficient indicator of the presence of endogenous esterase in cells.
Conclusions
In summary, we designed and synthesized a dual-channel probe of FlE that could detect esterase specifically with double “turn on” signals. FlE reacted with esterase to generate the compound Fl, which was confirmed by fluorescence spectra, 19F NMR spectra, and mass spectra. Due to the ESIPT effect of Fl and the F atom directly connected to the benzene ring, the fluorometry and 19F nuclear magnetic method could be combined to real-time monitor esterase with good sensitivity, high selectivity, and excellent cell permeability. After the addition of esterase, the fluorescence intensity of FlE at 510 nm increased significantly, and the location of 19F NMR signal changed as well. This FlE probe has the potential to be applied in the detection of esterase in deep tissue and in animals due to the strong penetration of the 19F NMR signal. Thus, our study provided a powerful means for the analysis of esterase with good sensitivity and excellent penetration.Conflicts of interest
There are no conflicts to declare.Acknowledgements
We are grateful to the National Science Foundation of China (No. 51573140) and Ministry of Science and Technology of China grant 2017YFA0505400 for the financial support.Notes and references
- A. M. Stathopoulos and M. S. Cyert, Genes Dev., 1997, 11, 3432–3444 CrossRef CAS PubMed.
- A. D. Quiroga, J. Lian and R. Lehner, PLoS One, 2012, 7(11), e49515, DOI:10.1371/journal.pone.0049515.
- M. C. Hunt, K. Solaas, B. F. Kase and S. E. H. Alexson, J. Biol. Chem., 2002, 277, 1128–1138 CrossRef CAS PubMed.
- (a) M. Comb, N. C. Birnberg, A. Seasholtz, E. Herbert and H. M. Goodman, Nature, 1986, 323, 353–356 CrossRef CAS PubMed; (b) J. Creighton, B. Zhu, M. Alexeyev and T. Stevens, J. Cell Sci., 2008, 121, 110–119 CrossRef CAS PubMed.
- (a) L. L. M. M. Melo, G. M. Pastore and G. A. Macedo, Process Biochem., 2005, 40, 3181–3185 CrossRef CAS; (b) E. Topakas, C. Vafiada and P. Christakopoulos, Process Biochem., 2007, 42, 497–509 CrossRef CAS; (c) M. Barros, M. A. P. C. Cellogoi and G. A. Macedo, J. Am. Oil Chem. Soc., 2016, 93, 37–44 CrossRef.
- J. A. Donaghy and A. M. Mckay, World J. Microbiol. Biotechnol., 1995, 11, 160–162 CrossRef CAS PubMed.
- C. E. Humphrey, M. A. A. Easson and N. J. Turner, ChemBioChem, 2004, 5, 1144–1148 CrossRef CAS PubMed.
- J. Grognux, D. Wahler, W. Nyfeler and J. L. Reymond, Tetrahedron: Asymmetry, 2004, 15, 2981–2989 CrossRef CAS.
- E. A. Snellman and R. R. Colwell, Antonie van Leeuwenhoek, 2008, 94, 621–625 CrossRef CAS PubMed.
- (a) Y. Kim, Y. Choi, R. Weissleder and C. H. Yung, Bioorg. Med. Chem. Lett., 2007, 17, 5054–5057 CrossRef CAS PubMed; (b) K. R. Tallman and K. E. Beatty, ChemBioChem, 2015, 16, 70–75 CrossRef CAS PubMed; (c) S. R. Levine and K. E. Beatty, Chem. Commun., 2016, 52, 1835–1838 RSC; (d) J. Wang, Y. Wu, F. Zeng, S. Huang and S. Z. Wu, Faraday Discuss., 2017, 196, 335–350 RSC.
- F. Derikvand, D. T. Yin, R. Barrett and H. Brumer, Anal. Chem., 2016, 88, 2989–2993 CrossRef CAS PubMed.
- L. Peng, S. Xu, X. Zheng, X. Cheng, R. Zhang, J. Liu, B. Liu and A. Tong, Anal. Chem., 2017, 89, 3162–3168 CrossRef CAS PubMed.
- (a) D. Yu, F. Huang, S. Ding and G. Feng, Anal. Chem., 2014, 86, 8835–8841 CrossRef CAS PubMed; (b) H. Chen, B. Dong, Y. Tang and W. Lin, Chem. – Eur. J., 2015, 21, 11696–11700 CrossRef CAS PubMed; (c) C. Yan, Z. Sun, H. Guo, C. Wu and Y. Chen, Mater. Chem. Front., 2017, 1, 2638–2642 RSC; (d) X. Wu, A. Shao, S. Zhu, Z. Guo and W. Zhu, Sci. China: Chem., 2016, 59, 62–69 CrossRef CAS; (e) Z. Xu, L. Kong, J. Zhao and W. Fan, Chin. J. Polym. Sci., 2016, 34, 407–419 CrossRef CAS.
- (a) C. M. Lemon, E. Karnas, X. Han, O. T. Bruns, T. J. Kempa, D. Fukumura, M. G. Bawendi, R. K. Jain, D. G. Duda and D. G. Nocera, J. Am. Chem. Soc., 2015, 137, 9832–9842 CrossRef CAS PubMed; (b) J. Liu, X. Guo, R. Hu, X. Liu, S. Wang, S. Li, Y. Li and G. Yang, Anal. Chem., 2016, 88, 1052–1057 CrossRef CAS PubMed; (c) H. Li, Q. Yao, J. Fan, J. Du, J. Wang and X. Peng, Biosens. Bioelectron., 2017, 94, 536–543 CrossRef CAS PubMed; (d) P. Yuan, R. Ma and Q. Xu, Sci. China: Chem., 2016, 59, 78–82 CrossRef CAS; (e) X. Wua, M. Jin, J. Xie, D. Wan and J. P. Malval, Chin. J. Polym. Sci., 2016, 34, 1456–1468 CrossRef CAS; (f) W. Wei, S. Feng, C. Zheng, G. Liang and F. Zhu, Chin. J. Polym. Sci., 2017, 35, 400–406 CrossRef CAS.
- (a) K. Tanaka, K. Inafuku and Y. Chujo, Bioorg. Med. Chem., 2008, 16, 10029–10033 CrossRef CAS PubMed; (b) K. Tanaka, N. Kitamura and Y. Chujo, Bioorg. Med. Chem., 2012, 20, 96–100 CrossRef CAS PubMed; (c) K. Tanaka, N. Kitamura, Y. Takahashi and Y. Chujo, Bioorg. Med. Chem., 2009, 17, 3818–3823 CrossRef CAS PubMed; (d) K. Tanabe, H. Harada, M. Narazaki, K. Tanaka, K. Inafuku, H. Komatsu, T. Ito, H. Yamada, Y. Chujo, T. Matsuda, M. Hiaoka and S. Nishimoto, J. Am. Chem. Soc., 2009, 131, 15982–15983 CrossRef CAS PubMed.
- (a) K. Hanaoka, K. Kikuchi, T. Terai, T. Komatsu and T. Nagano, Chem. – Eur. J., 2008, 14, 987–995 CrossRef CAS PubMed; (b) I. Kucharska, B. Liang, N. Ursini and L. Tamm, Biochem., 2016, 55, 5061–5072 CrossRef CAS PubMed; (c) J. D. Routledge, X. Zhang, M. Connolly, M. Tropiano, O. A. Blackburn, A. M. Kenwright, P. D. Beer, S. Aldridge and S. Faulkner, Angew. Chem., Int. Ed., 2017, 56, 7783–7786 CrossRef CAS PubMed.
- (a) K. Tanaka, N. Kitamura, K. Naka and Y. Chujo, Chem. Commun., 2008, 6176–6178 RSC; (b) S. Mizukami, R. Takikawa, F. Sugihara, Y. Hori, H. Tochio, M. Walchli, M. Shirakawa and K. Kikuchi, J. Am. Chem. Soc., 2008, 130, 794–795 CrossRef CAS PubMed; (c) S. Mizukami, H. Matsushita, R. Takikawa, F. Sugihara, M. Shirakawa and K. Kikuchi, Chem. Sci., 2011, 2, 1151–1155 RSC; (d) F. Li, P. Shi, J. Li, F. Yang, T. Wang, W. Zhang, F. Gao, W. Ding, D. Li, J. Li, Y. Xiong, J. Sun, W. Gong, C. Tian and J. Wang, Angew. Chem., Int. Ed., 2013, 52, 3958–3962 CrossRef CAS PubMed; (e) J. Hu, Q. Wu, K. Cheng, Y. Xie, C. Li and Z. Li, J. Mater. Chem. B., 2017, 5, 4673–4678 RSC; (f) K. Tanaka, N. Kitamura and Y. Chujo, Bioconjugate Chem., 2011, 22, 1484–1490 CrossRef CAS PubMed; (g) Y. Ye, Q. Wu, W. Zheng, B. Jiang, G. J. Pielak, M. Liu and C. Li, Anal. Bioanal. Chem., 2018, 410, 869–874 CrossRef CAS PubMed.
- Y. Yuan, H. Sun, S. Ge, M. Wang, H. Zhao, L. Wang, L. An, J. Zhang, H. Zhang, B. Hu, J. Wang and G. Liang, ACS Nano, 2015, 9, 761–768 CrossRef CAS PubMed.
- H. Wang, K. R. Raghupathi, J. Zhuang and S. Thayumanavan, ACS Macro Lett., 2015, 4, 422–425 CrossRef CAS PubMed.
- (a) H. N. Rydon, Nature, 1958, 182, 928–929 CrossRef CAS PubMed; (b) J. M. Pfeffer, J. T. Weadge and A. J. Clarke, J. Biol. Chem., 2013, 288, 2605–2613 CrossRef CAS PubMed.
- A. Banerjee and P. K. Sengupta, Chem. Phys. Lett., 2006, 424, 379–386 CrossRef CAS.
- (a) S. Kim, H. Kim, Y. Choi and Y. Kim, Chem. – Eur. J., 2015, 21, 9645–9649 CrossRef CAS PubMed; (b) M. Gao, Q. Hu, G. Feng, B. Z. Tang and B. Liu, J. Mater. Chem. B, 2014, 2, 3438–3442 RSC.
- A. Gyevai and I. Fazekas, Histochemie, 1971, 28, 33–37 CrossRef CAS.
- J. Katz, T. H. Finlay, S. Banerjee and M. Levitz, J. Steroid Biochem., 1987, 26, 687–692 CrossRef CAS PubMed.
Footnotes |
| † Electronic supplementary information (ESI) available: Additional figures, tables, and synthetic routes. See DOI: 10.1039/c8qm00107c |
| ‡ Contribute equally to this manuscript. |
| This journal is © the Partner Organisations 2018 |


