
Peroxidase-like Fe3O4 nanocomposite for activatable reactive oxygen species generation and cancer theranostics†
Kai
Zhang
ab,
Zhou
Yang
 *b,
Xiangdan
Meng
a,
Yu
Cao
a,
Yuedong
Zhang
a,
Wenhao
Dai
a,
Huiting
Lu
a,
Zhaofeng
Yu
b,
Haifeng
Dong
*a and
Xueji
Zhang
a
*b,
Xiangdan
Meng
a,
Yu
Cao
a,
Yuedong
Zhang
a,
Wenhao
Dai
a,
Huiting
Lu
a,
Zhaofeng
Yu
b,
Haifeng
Dong
*a and
Xueji
Zhang
a
aResearch Center for Bioengineering and Sensing Technology, School of Chemistry and Bioengineering, University of Science & Technology Beijing, Beijing 100083, P. R. China. E-mail: hfdong@ustb.edu.cn
bBeijing Key Laboratory of Function Materials for Molecule & Structure Construction, School of Materials Science and Engineering, University of Science and Technology Beijing, Beijing 100083, P. R. China. E-mail: yangz@ustb.edu.cn
First published on 16th April 2018
Abstract
Photodynamic therapy (PDT) that utilizes apoptosis induced by reactive oxygen species (ROS) has received extensive attention in practical cancer therapy. However, the hypoxic microenvironment of solid tumors significantly limits the efficacy of therapy. Approaches that overcome the barriers to PDT in hypoxic conditions by simultaneously producing ROS exogenously and improving the oxygenation of tumors have never been studied. Herein, an activatable ROS platform was designed that uses the high reactivity of peroxidase-like Fe3O4 toward endogenous hydrogen peroxide (H2O2) to concurrently generate ˙OH as a therapeutic agent and provide O2 for oxygen-dependent PDT. Multifunctional chitosan-encapsulated Fe3O4 nanoparticles modified with CuS and porphyrin (FCCP NPs) were fabricated to achieve multimodal imaging and synergetic therapy. The FCCP NPs possess enhanced intrinsic peroxidase mimetic activity to produce ROS and O2 from endogenous H2O2. Multimodal imaging in vivo, including photoacoustic imaging (PAI), magnetic resonance imaging (MRI), photoluminescence imaging (PLI), and photothermal imaging (PTI), exploits the tumor-targeting property of FCCP NPs upon intravenous injection. It can induce cancer cell death with remarkable efficiency both in vitro and in vivo via synergetic treatment with PDT and photothermal therapy (PTT). This study demonstrates the promise of the activatable generation of ROS and O2 for PDT with nanotechnology to overcome a current deficiency in cancer therapies.
Introduction
Photodynamic therapy (PDT) takes advantage of cancer treatment mediated by reactive oxygen species (ROS), which is widely considered to be the most effective clinical treatment of cancer.1–3 It utilizes the photodynamic effect between photosensitizers (PSs), light, and tissue oxygen (O2) to generate ROS to cause apoptotic or necrotic cell death.4,5 However, traditional PDT still faces several challenges such as the limited depth of light penetration and a reliance on oxygen, which hinder the widespread application of PDT as a first-line method of cancer treatment.6 In particular, the hypoxic microenvironment in solid tumors increases the resistance of tumors to PDT and greatly influences the efficacy of therapy.7 Two useful approaches have been proposed to overcome the barriers to PDT in hypoxic conditions by improving the oxygenation of tumors8 or via type I PDT, which produces ROS exogenously as an alternative strategy to PDT.1,9 For example, various oxygen-self-enriching nanosystems,10 the in situ generation of oxygen8,11 and exogenous ROS-generating agents12 have made considerable progress.Nanotechnologies have received considerable attention for developing both diagnostic and therapeutic agents. In general, theranostic nanomedicines integrate imaging and treatment moieties into one single unit, which possesses both diagnostic and therapeutic functions.13–15 It enables precise diagnosis and efficient therapeutic use and leads to a therapeutic paradigm that is expected to contribute to personalized medicine.16,17 Recently, peroxidase-like Fe3O4 nanostructures have received tremendous attention in bioapplications.18–21 They possess intrinsic enzyme mimetic activity that is similar to that of natural horseradish peroxidase (HRP), which can catalyze hydrogen peroxide (H2O2) to produce highly reactive hydroxyl radicals (˙OH) and O2.22,23 In general, the Haber–Weiss reaction produces ˙OH and O2 from the reaction between H2O2 and superoxide radicals (˙O2−).24 In biological systems, the iron-catalyzed Haber–Weiss reaction based on Fenton chemistry is considered to be the main mechanism that generates highly reactive radicals.22,25 There have been some studies that focused on therapy with endogenous or exogenous ˙OH related to Fe3O4 NPs.11 On the basis of the Fenton reaction catalyzed by Fe3O4 NPs, endogenous H2O2 may concurrently generate ˙OH as a therapeutic agent and provide O2 for oxygen-dependent PDT. However, studies of the systematic administration of Fe3O4 NPs to enhance PDT by concurrently using ˙OH and O2 to accompany other theranostic agents are not available, as far as we know.
Here, we used the outstanding characteristics of Fe3O4 clusters for the concurrent generation of ˙OH as a therapeutic agent and in situ production of O2 for modulating the hypoxic microenvironment of tumors to overcome resistance to photodynamic therapy. A type of porphyrin photosensitizer with high solubility, high 1O2 quantum yields, and photostability was designed. As shown in Scheme 1, Fe3O4 clusters were synthesized in situ using chitosan (CS) and further loaded with the porphyrin photosensitizer via static interactions and assembled with the photothermal conversion (PTC) agent CuS (FCCP). Owing to the in situ generation of ˙OH as a therapeutic agent and O2 for overcoming resistance to photodynamic therapy via the interaction between the Fe3O4 clusters and H2O2, the FCCP NPs that were designed exhibited higher in vitro PDT efficacy than that of free porphyrin. The accompanying CuS-based photothermal therapy (PTT) further enhanced the anticancer efficacy. The efficient targeting of tumors by FCCP NPs can be used to enable multimodal in vivo imaging, including photoacoustic imaging (PAI),26,27 magnetic resonance imaging (MRI),28–30 photoluminescence imaging (PLI),31 and photothermal imaging (PTI)32,33 upon intravenous injection. Notably, the in vivo therapeutic efficacy achieved by PDT/PTT using FCCP NPs was proved to be much better than that achieved with PDT using free porphyrin.
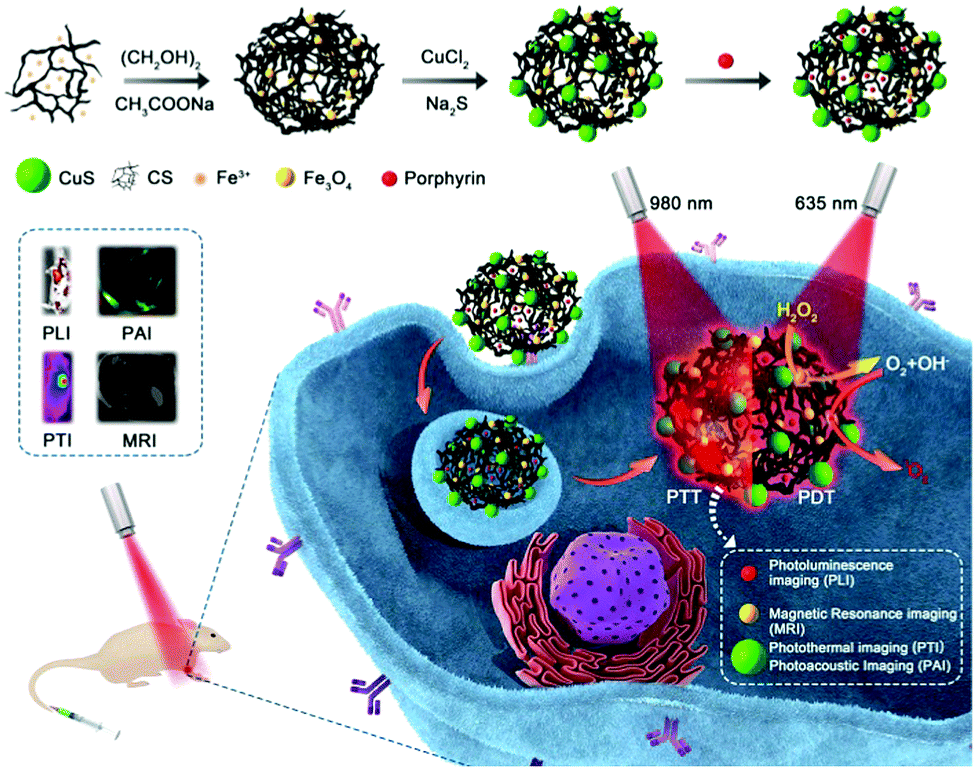 | ||
| Scheme 1 Schematic illustration of the fabrication of the FCCP nanoplatform for NIR laser irradiation-induced theranostics and multimodal bioimaging. | ||
Results and discussion
Synthesis and characterization of FCCP NPs
Fig. 1a shows a transmission electron microscopy (TEM) image of synthesized CS-encapsulated Fe3O4 (Fe3O4@CS) nanoclusters with an average size of 100 ± 10 nm, which consisted of numerous small Fe3O4 NPs with diameters of about 3 ± 1 nm. Scanning electron microscopy (SEM) further confirmed the size and morphology of the Fe3O4@CS NPs (Fig. 1d). CuS NPs with diameters of 10 ± 2 nm were uniformly covered on the surface of Fe3O4@CS by a simple in situ hydrothermal route (Fe3O4@CS/CuS) (Fig. 1b). Elemental mapping (Fig. 1f) derived from an SEM image of Fe3O4@CS/CuS (Fig. 1e) revealed copper (red) and iron (green) element, which indicated that CuS NPs were dispersed on the surface of Fe3O4@CS nanoclusters. High-resolution TEM (HRTEM) demonstrated the lattice spacing of 0.29 nm associated with (220) planes of Fe3O4 and the lattice spacing of 0.28 nm attributed to (103) planes of CuS, which confirmed the successful synthesis of Fe3O4@CS/CuS (Fig. 1c). Analysis of N2 adsorption/desorption isotherms revealed the mesoporous structure of Fe3O4@CS/CuS (Fig. S2, ESI†) with a mean pore diameter of 3.1 nm, which was useful for further loading with the porphyrin photosensitizer.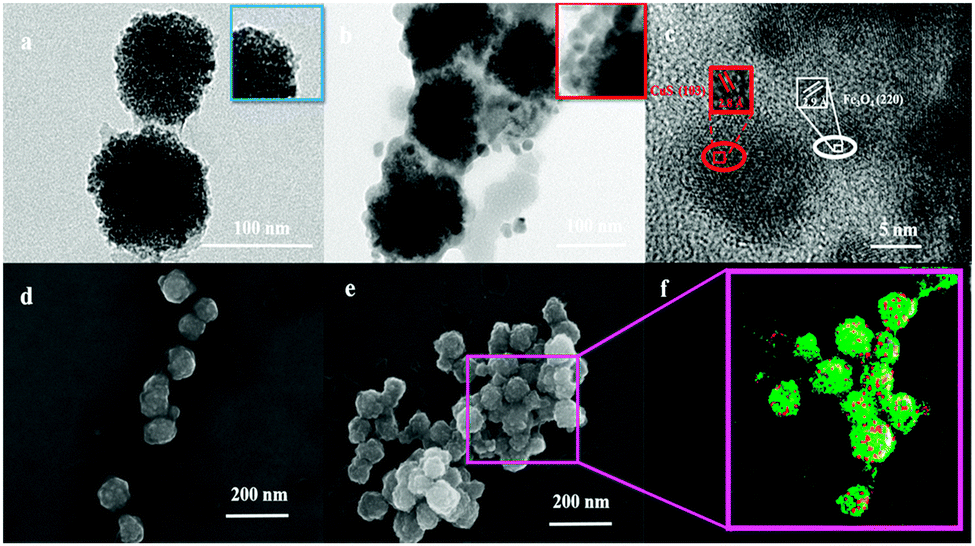 | ||
| Fig. 1 Characterization of as-synthesized NPs: (a) TEM and (d) SEM images of Fe3O4@CS nanoclusters. (b) TEM images, (e) SEM image and (f) elemental mapping of Fe3O4@CS/CuS NPs (copper (red) and iron (green)). (c) HRTEM image of Fe3O4@CS/CuS NPs. | ||
The X-ray diffraction (XRD) pattern of Fe3O4@CS/CuS (Fig. 2a) exhibited main characteristic diffraction peaks at 30.70°, 36.06°, 43.76°, 54°, 57.82° and 63.46°, which were assigned to the (220), (222), (400), (422), (511) and (440) planes, respectively, of Fe3O4,34 and 31.92° and 47°, which were attributed to the (103) and (110) planes, respectively, of CuS (JCPDS No. 19-0629).35 Notably, the broadening of the diffraction peaks suggested that the nanocomposite was composed of NPs with small sizes. The Raman spectrum also displayed characteristic bands related to the A1g modes of Fe3O4 and CuS at 700 cm−1 and 471 cm−1,36,37 respectively (Fig. 2b). From X-ray photoelectron spectroscopy (XPS) analysis, characteristic peaks related to O 1s, N 1s, Fe 2p, Cu 2p, S 2p and C 1s were all observed in the XPS survey spectrum of Fe3O4@CS/CuS (Fig. 2c), which demonstrated the formation of Fe3O4@CS/CuS composites. Fe3O4@CS/CuS exhibited two peaks at 710.6 and 724.1 eV, which corresponded to Fe 2p3/2 and Fe 2p1/2, and no obvious shakeup satellite structures were observed on the higher binding energy side of either main peak, which was consistent with the characteristic peaks of Fe3O438 (Fig. 2d). The characteristic peaks of Cu 2p at 932.4 and 952.4 eV were consistent with a previous report on CuS39 (Fig. 2e). The high-resolution spectrum of N 1s exhibited a peak at 398.0 eV due to NH2, which interacted with Fe3O4 to act as crosslinking bridges and stabilize CS on the surface of Fe3O4 (Fig. 2f).40,41
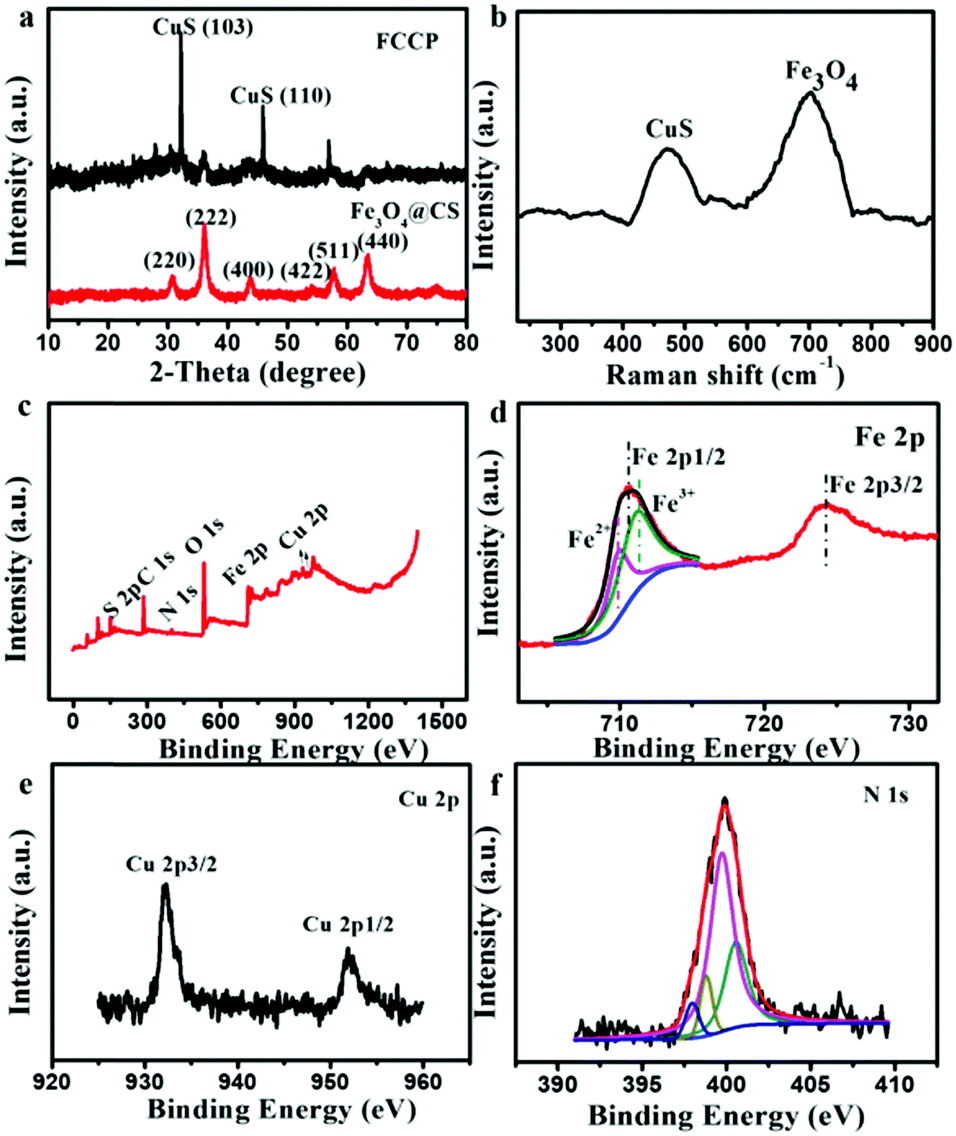 | ||
| Fig. 2 (a) Powder XRD pattern, (b) Raman spectrum and (c) XPS survey spectrum of synthesized Fe3O4@CS/CuS. High-resolution XPS spectra of (d) Fe 2p, (e) Cu 2p and (f) N 1s of Fe3O4@CS/CuS. | ||
The porphyrin photosensitizer was synthesized according to previous synthesis methods with some modifications, as shown in Scheme S1 (ESI†) and confirmed by mass spectrometry (MS) (Fig. S1, ESI†). To achieve a high loading capacity, the weight ratio of porphyrin![[thin space (1/6-em)]](https://www.rsc.org/images/entities/char_2009.gif) :Fe3O4@CS/CuS during assembly was optimized (Fig. S3b, ESI†). The porphyrin loading capacity reached a relatively high value of 9.8% at a porphyrin:Fe3O4@CS/CuS weight ratio of 1:1 (Fig. S3b and S5, ESI†). The synthesized porphyrin exhibited a strong photoluminescence emission at 671 nm when excited at the maximum excitation wavelength of 410 nm, which was beneficial for PLI (Fig. 3a). After the loading of porphyrin, the ultraviolet-visible-near infrared (UV-vis-NIR) absorption spectrum of FCCP exhibited characteristic absorption peaks at 410 and 940 nm, which were assigned to porphyrin and CuS, respectively (Fig. 3b). The Fourier transform infrared spectroscopy (FT-IR) spectrum of FCCP displayed characteristic transmittance peaks of porphyrin at 1450 cm−1 and 770 cm−1, which confirmed that porphyrin was successfully loaded into Fe3O4@CS/CuS NPs (Fig. 3c). The zeta potential was further used to characterize the assembly of FCCP. Fe3O4@CS displayed a zeta potential of ≈39.8 mV due to positively charged CS. The zeta potential decreased to ≈19.8 mV for Fe3O4@CS/CuS NPs as a result of the negative surface charge of CuS and further decreased to ≈−29.2 mV for FCCP because of negatively charged porphyrin (Fig. 3d). The negatively charged surface was useful for maintaining the stability of FCCP in a cell medium containing serum for biomedical applications. The zeta potential changed to ≈−27.6 mV after FCCP was mixed with serum, which suggested high stability. Dynamic light scattering (DLS) analysis indicated the narrow size distribution of FCCP after mixing with serum (Fig. S4a, ESI†), which was consistent with the result for the zeta potential that the FCCP NPs were well dispersed after mixing with serum. Fig. S4b (ESI†) further indicates the high dispersity of FCCP in PBS, DMEM and serum. The release of porphyrin from FCCP was performed in PBS buffer (10 mM) at pH values of 5.0 and 7.4 with/without irradiation with a 980 nm NIR laser (Fig. S6, ESI†). This indicated that the weakly acidic environment and local hyperthermia generated by the photothermal effect of FCCP when irradiated with the 980 nm NIR laser induced the slight release of porphyrin from FCCP. The high stability of porphyrin on FCCP facilitated effective therapy.
:Fe3O4@CS/CuS during assembly was optimized (Fig. S3b, ESI†). The porphyrin loading capacity reached a relatively high value of 9.8% at a porphyrin:Fe3O4@CS/CuS weight ratio of 1:1 (Fig. S3b and S5, ESI†). The synthesized porphyrin exhibited a strong photoluminescence emission at 671 nm when excited at the maximum excitation wavelength of 410 nm, which was beneficial for PLI (Fig. 3a). After the loading of porphyrin, the ultraviolet-visible-near infrared (UV-vis-NIR) absorption spectrum of FCCP exhibited characteristic absorption peaks at 410 and 940 nm, which were assigned to porphyrin and CuS, respectively (Fig. 3b). The Fourier transform infrared spectroscopy (FT-IR) spectrum of FCCP displayed characteristic transmittance peaks of porphyrin at 1450 cm−1 and 770 cm−1, which confirmed that porphyrin was successfully loaded into Fe3O4@CS/CuS NPs (Fig. 3c). The zeta potential was further used to characterize the assembly of FCCP. Fe3O4@CS displayed a zeta potential of ≈39.8 mV due to positively charged CS. The zeta potential decreased to ≈19.8 mV for Fe3O4@CS/CuS NPs as a result of the negative surface charge of CuS and further decreased to ≈−29.2 mV for FCCP because of negatively charged porphyrin (Fig. 3d). The negatively charged surface was useful for maintaining the stability of FCCP in a cell medium containing serum for biomedical applications. The zeta potential changed to ≈−27.6 mV after FCCP was mixed with serum, which suggested high stability. Dynamic light scattering (DLS) analysis indicated the narrow size distribution of FCCP after mixing with serum (Fig. S4a, ESI†), which was consistent with the result for the zeta potential that the FCCP NPs were well dispersed after mixing with serum. Fig. S4b (ESI†) further indicates the high dispersity of FCCP in PBS, DMEM and serum. The release of porphyrin from FCCP was performed in PBS buffer (10 mM) at pH values of 5.0 and 7.4 with/without irradiation with a 980 nm NIR laser (Fig. S6, ESI†). This indicated that the weakly acidic environment and local hyperthermia generated by the photothermal effect of FCCP when irradiated with the 980 nm NIR laser induced the slight release of porphyrin from FCCP. The high stability of porphyrin on FCCP facilitated effective therapy.
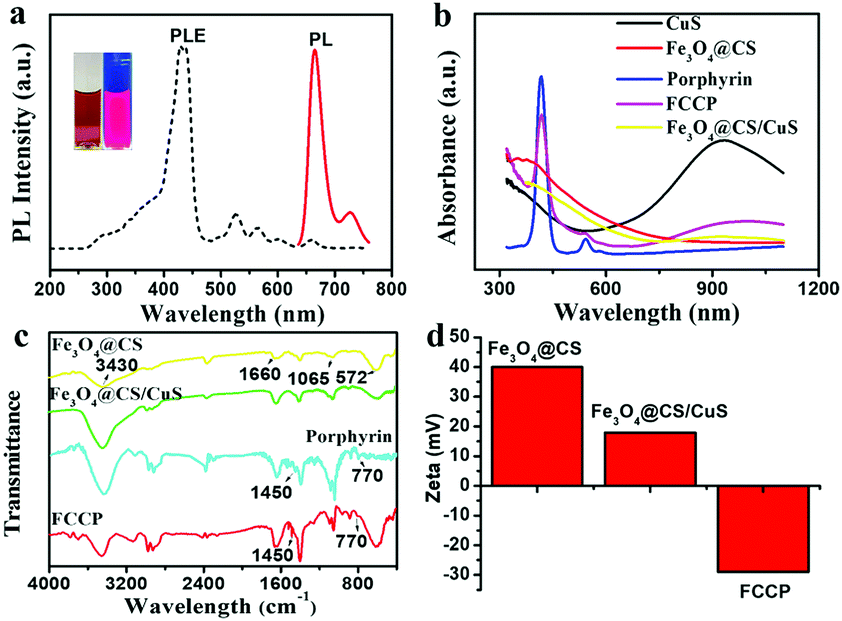 | ||
| Fig. 3 (a) Photoluminescence property of porphyrin, (b) UV-vis-NIR, (c) FT-IR and of synthesized NPs, (d) zeta potential characterizations of NPs assembly. | ||
In vitro imaging and ROS generation
The intrinsic peroxidase-like activity of FCCP for catalyzing the breakdown of H2O2 was first studied. Our studies showed that both Fe3O4@CS nanoclusters and FCCP catalyzed the reaction of the substrate 3,3′,5,5′-tetramethylbenzidine (TMB) in the presence of H2O2, which generated a blue color that was dependent on the NP concentration (Fig. 4a and c). This demonstrated that the assembly and modification processes did not affect the peroxidase-like activity of Fe3O4 nanoclusters. The corresponding color-generating reaction was subsequently stopped by adding 0.5 mol L−1 H2SO4, and a yellow color was gradually produced (Fig. 4b and d). The OD values derived from Fig. 4b and d are presented in Fig. 4e, which clearly reveals the high peroxidase-like activity of FCCP. The ˙OH-producing ability of FCCP was further investigated via electron spin resonance (ESR) measurements (Fig. 4f) using 5,5-dimethyl-1-pyrroline-N-oxide (DMPO) as an ˙OH-trapping agent. No peaks related to ˙OH were observed for the PBS control group. In contrast, for the FCCP group, the typical four peaks in the spectrum with an intensity ratio of 1:2:2:1 could be assigned to DMPO–OH adducts, which indicated that ˙OH was radically generated. We further investigated intracellular O2 levels and the production of ROS for A549 cancer cells with different treatments. A Cyto-ID® detection kit for hypoxia/oxidative stress, which uses a fluorogenic probe for the detection of intracellular hypoxia, was used to characterize the hypoxic intracellular environment of the cells (Fig. 4g). The ROS levels in A549 cells treated with Fe3O4@CS and FCCP NPs were determined using dichlorofluorescein diacetate (DCFH-DA),42–44 which is a fluorescent dye for ROS. From confocal microscopy images of the ROS level, it could be observed that the mean intensity of green fluorescence in A549 cells treated with FCCP NPs and exposed to a 635 nm NIR laser was enhanced to a greater extent than in the Fe3O4@CS group in comparison with control cells. The results could be explained by the fact that the enzyme mimetic Fe3O4@CS induced the generation of high amounts of ˙OH and O2 from H2O2 to enhance the fluorescence of the ROS dye, the latter of which was further transformed into 1O2 by the porphyrin photosensitizer under NIR laser irradiation to further improve the emission. Indirect evidence of the production of O2 within cells was obtained by confocal microscopy. A549 cells were pretreated with desferrioxamine (DFO), which is a hypoxia mimetic agent that can provide a hypoxic cellular environment. Fig. 4g shows typical confocal images of stronger red fluorescence (Cyto-ID hypoxia probe) in A549 cells after being treated with DFO for 4 h in comparison with the control group without DFO treatment. Notably, the fluorescence intensity obviously decreased in the cells pretreated with DFO after incubation with FCCP (100 μg mL−1) for a further 24 h. These results indicated that the generation of O2via the catalase-like activity of FCCP effectively overcame cellular hypoxia.
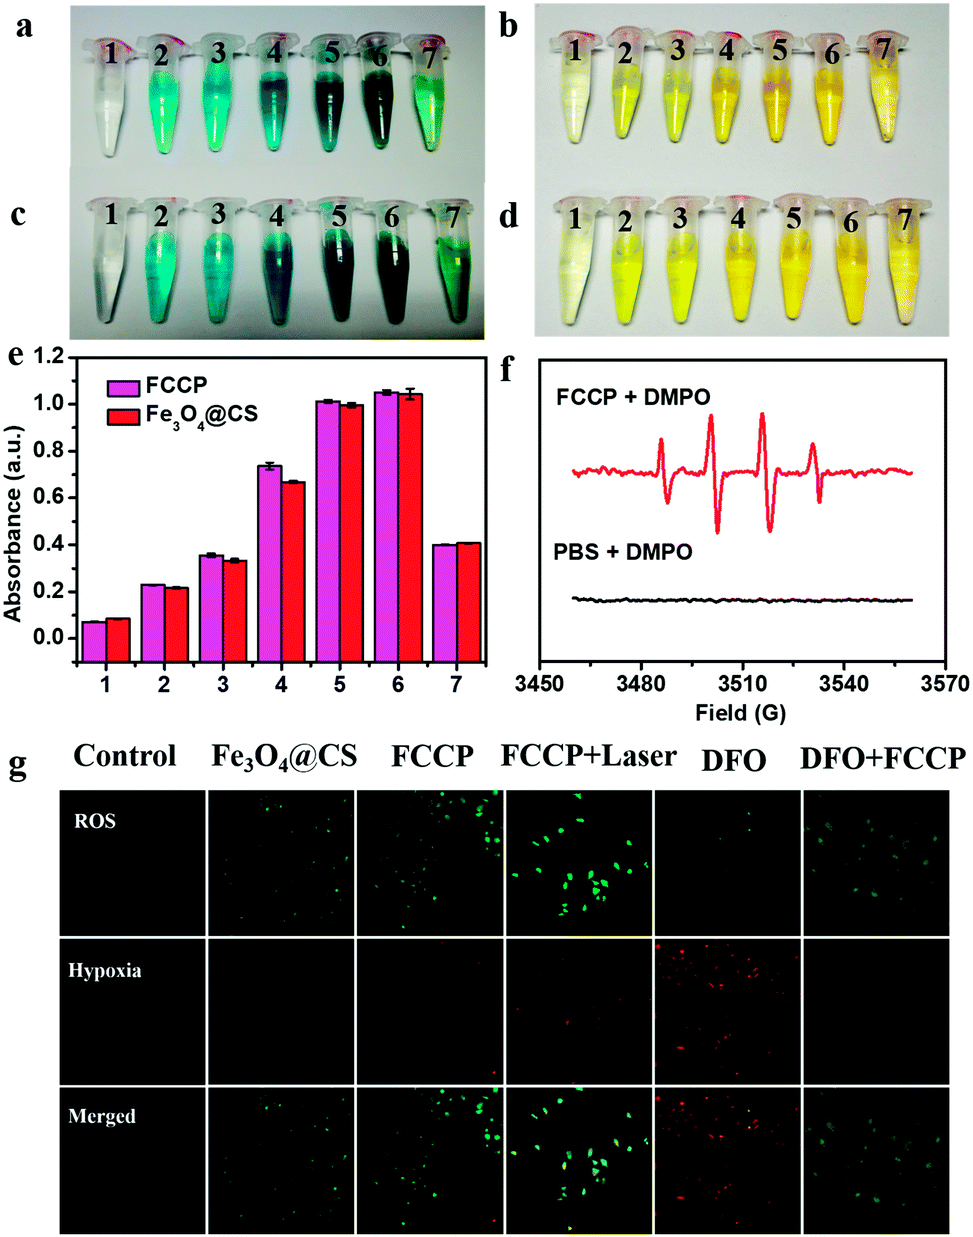 | ||
| Fig. 4 (a) Fe3O4@CS and (c) FCCP NPs catalyze the oxidation of the peroxidase substrate TMB in vitro in the presence of H2O2 to produce a blue color (from 1 to 6: 0, 10, 20, 50, 100, and 200 μg mL−1 of NPs; 7: HRP). In (b) and (d) the reactions corresponding to (a) and (c), respectively, were stopped using H2SO4 (0.5 mol L−1). (e) The corresponding OD values derived from (b) and (d). (f) ESR spectra of radical adducts trapped by DMPO in FCCP + H2O2 and PBS + H2O2. (g) Confocal fluorescence images of A549 cells with probes for the detection of ROS/hypoxia after different treatments. | ||
In principle, the strong NIR absorption of the PTC agent CuS might endow FCCP NPs with high PTC efficiency.45 To achieve high PTC efficiency, the weight ratio of Fe3O4@CS to CuS during synthesis was first optimized (Fig. S3a, ESI†), which indicated that excellent PTC efficiency was achieved when the weight ratio of Fe3O4@CS to CuS was 1:4. As shown in Fig. 5a, as was expected, the temperature of an Fe3O4@CS solution only increased by 14.4 °C over 10 min under a 980 nm NIR laser owing to the PT effect of Fe3O4@CS. However, the temperature of an FCCP solution increased by 45.8 °C, which mainly resulted from the strong NIR absorption of CuS.46,47 Photothermal stability studies illustrated the high stability and excellent reproducibility of FCCP (Fig. 5b), and the PTC efficiency was calculated to be 30% (Fig. S7, ESI†), which suggested that FCCP was a good PTC agent. The 1O2-producing abilities of synthesized porphyrin and FCCP for PDT were studied using the chemical probe 1,3-diphenylisobenzofuran (DPBF), which is an indicator of which the absorption can be quenched by 1O2. As shown in Fig. 5c, the relative absorbance of DPBF in solutions of porphyrin and FCCP under irradiation with 635 nm light for 100 s was recorded. The rapid decrease in the absorbance of DPBF in the solutions of porphyrin and FCCP revealed the high ability of porphyrin to generate 1O2. The 1O2 quantum yields of porphyrin and FCCP were calculated to be 0.81 and 0.87, respectively, which indicated that the loading of porphyrin on Fe3O4@CS/CuS did not affect the 1O2-producing ability of porphyrin. The 1O2-producing ability of FCCP was further investigated via ESR measurements (Fig. 5d) using 2,2,6,6-tetramethylpiperidine (TEMP) as an 1O2 trapping agent. The 1:1:1 triplet ESR signal of 1O2 can clearly be observed for FCCP after irradiation with a 635 nm laser. Its pronounced 1O2-generating ability makes FCCP promising for PDT anticancer treatment. The photoluminescence (PL) property of porphyrin for cell imaging was investigated. The strong red fluorescence of porphyrin observed in cells suggested that FCCP has high ability for PL imaging of cells (Fig. 5e). The MRI property of FCCP was also evaluated. The transverse relaxation rate (1/T2) of FCCP increased with an increase in the Fe concentration (Fig. 5f). Its high r2 relaxivity indicates that FCCP is a potential T2 contrast agent for MRI. PAI is being developed as a promising technique for visualizing tissue structures. As an emerging PAI agent, CuS has recently received tremendous attention.47 The PAI ability of FCCP was determined at various concentrations, as shown in Fig. 5g. The PA intensity exhibited a linear concentration-dependent increase, and a strong PAI signal of FCCP was obtained even at low concentrations, which demonstrated that FCCP is a potential PAI agent.
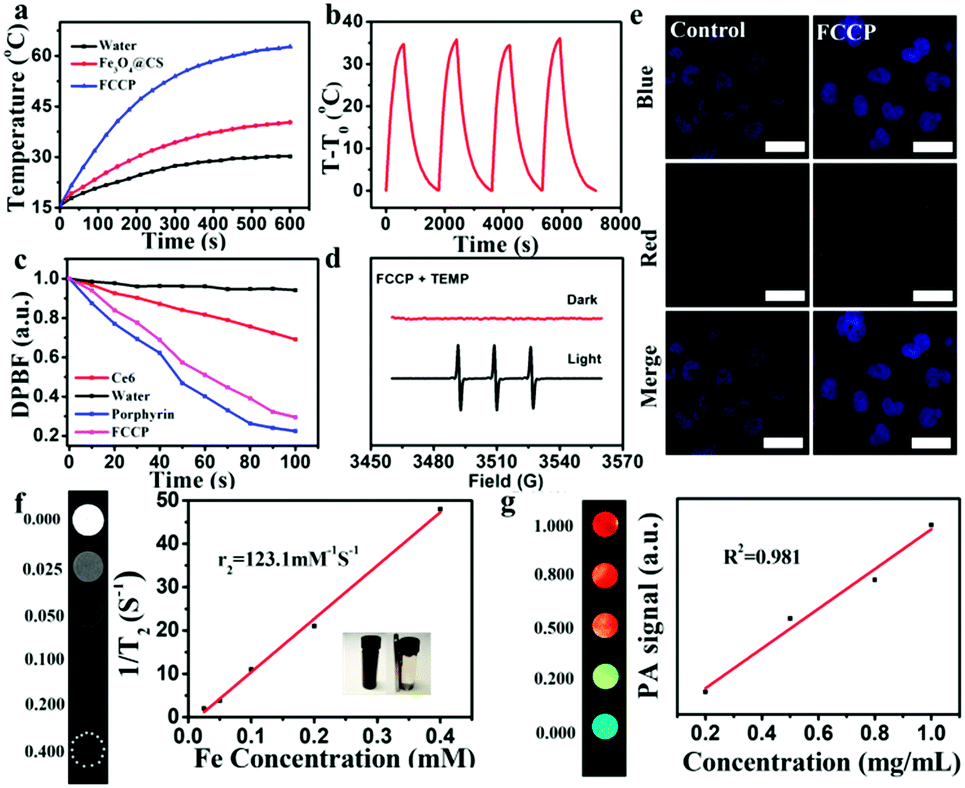 | ||
| Fig. 5 (a) Photothermal heating curves of water, Fe3O4@CS and FCCP solutions under irradiation with a 980 nm NIR laser for 10 min. (b) Photothermal stability of FCCP solution (100 μg mL−1) over four on/off cycles of irradiation with a 980 nm NIR laser. (c) Relative absorbance profiles at 420 nm of DPBF in different samples under irradiation with light every 10 s. (d) ESR spectra of FCCP in the presence of TEMP with or without irradiation with a 635 nm laser. (e) Confocal fluorescence images of tumor cells incubated with FCCP NPs or PBS (10 mM, pH 7.4); scale bars: 20 μm. (f) T2-Weighted MRI images of FCCP in aqueous solutions with different Fe concentrations and the corresponding T2 relaxation rate. (g) PAI images and corresponding PA intensity of FCCP at different concentrations. | ||
In vitro therapeutic efficacy
A 3-(4,5-dimethyl-2-thiazolyl)-2,5-diphenyl-2H-tetrazolium bromide (MTT) assay revealed the low cytotoxicity of FCCP (Fig. S8, ESI†). Calcein AM/propidium iodide (PI) dual staining and MTT assays were further used to investigate the therapeutic efficacy. As shown in Fig. 6a, FCCP-treated A549 cells exhibited a significantly higher cell death ratio under irradiation with a single 635 or 980 nm laser than control cells. Notably, FCCP-treated A549 cells irradiated with both 635 and 980 nm lasers were almost all dead, and the death ratio was higher than that of FCCP-treated A549 cells irradiated with a single 635 or 980 nm laser. This result was further confirmed by MTT experiments, in which control groups exhibited high cell viability of greater than 90%, which indicated that the NIR laser (635 or 980 nm) itself had a negligible influence on the cell viability (Fig. 6b). FCCP-treated cells that experienced combined 635 and 980 nm irradiation only displayed a cell viability of 12.0%, which was much lower than the values of 46.3% for cells irradiated with a single 635 nm laser and 38.5% for cells irradiated with a 980 nm laser. Multicellular tumor spheroids (MTS) generated by a liquid overlay cultivation technique using MCF-7 cells were initially employed to evaluate the feasibility of FCCP for in vivo therapeutics, as shown in Fig. 6c. The control groups, which included MCF-7 multicellular tumor spheroids (MTS) free of FCCP NPs and FCCP-treated MCF-7 MTS without NIR laser irradiation exhibited strong green fluorescence from living cells. In contrast, almost all the cells were dead and exhibited strong red fluorescence when FCCP-treated cells were irradiated with the 635 and 980 nm lasers. These results demonstrated the excellent therapeutic efficacy of FCCP-mediated PDT/PTT synergetic therapy and the great potential of FCCP NPs for in vivo PDT/PTT combined therapeutics.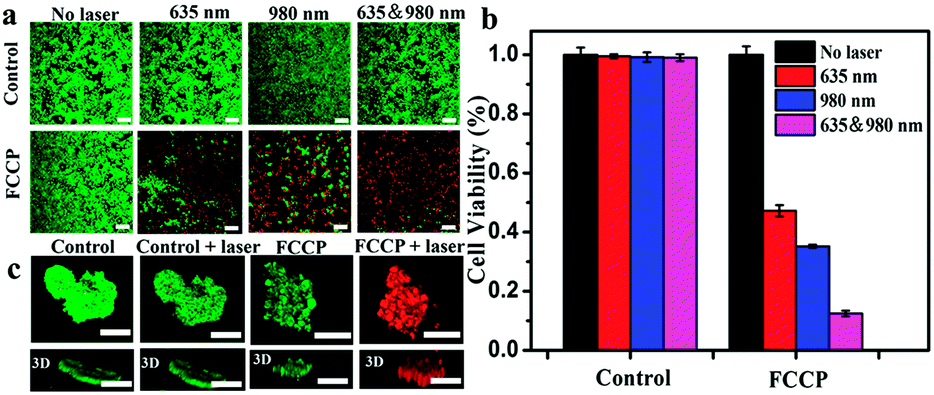 | ||
| Fig. 6 (a) Confocal fluorescence images of A549 cells and FCCP-treated A549 cells exposed to irradiation with different lasers. (b) MTT analysis of A549 cells and FCCP-treated A549 cells exposed to irradiation with different lasers. (c) Three-dimensional reconstructed confocal fluorescence images of control MCF-7 MTS and MCF-7 MTS exposed to irradiation with different lasers. The scale bars in all images correspond to 100 μm. | ||
In vivo imaging and pharmacokinetics
The good PTC achieved with FCCP makes it promising for in vivo PTI (Fig. 7a). As shown in Fig. 7b, the surface temperature of the tumor in mice injected with FCCP NPs rapidly increased to 50 °C under irradiation with a 980 nm laser for 5 min, whereas that in mice injected with PBS (10 mM, pH 7.4) exhibited a slight increase to 39.8 °C, which provided a potential tool for discriminating tumors from normal tissue. In vivo PLI was performed at different time points after the injection of FCCP NPs (Fig. 7c), which revealed the tumor-targeting property of FCCP NPs upon intravenous injection. Ex vivo PLI at 12 h demonstrated that FCCP NPs accumulated mainly in tumor tissues, and some accumulation of FCCP was also observed in the liver (Fig. 7d). In the case of MRI, tumor-bearing mice injected with FCCP NPs displayed a strong signal attenuation effect at the tumor site in comparison with the control group (Fig. 7e), which indicated the magnetic resonance contrast enhancement effect of FCCP NPs. Furthermore, the tumor tissue of tumor-bearing mice injected with FCCP NPs displayed a strong PAI signal in comparison with the control group, which was attributed to the FCCP NPs, which acted as a contrast agent (Fig. 7f). These results demonstrated the multimodal imaging ability of FCCP NPs, which provided a powerful tool for the diagnosis of tumor tissue. Nude mice bearing A549 cells received an intravenous (i.v.) injection of FCCP NPs to test the in vivo performance of the NPs. Fresh blood was collected to measure the Fe content via atomic emission spectrometry (ICP-AES) at desired time points after the injection of FCCP NPs. It is observed in Fig. 7g that the blood levels of FCCP NPs decreased gradually over time in accordance with a two-compartment model, and the circulation time was calculated to be 7.04 h. This fairly long circulation time in the blood is favorable for effective accumulation in tumors via the enhanced permeability and retention (EPR) effect. At 24 h after the injection, all mouse tumors and major organs were excised and analyzed by ICP-AES for a biodistribution study. As shown in Fig. 7h, in comparison with control mice without the injection of FCCP (Fig. S9, ESI†), the NPs displayed high accumulation in tumors. As for the organ-level location, the majority of the NPs were found in the spleen and liver as a result of reticuloendothelial uptake, which was consistent with previous reports.48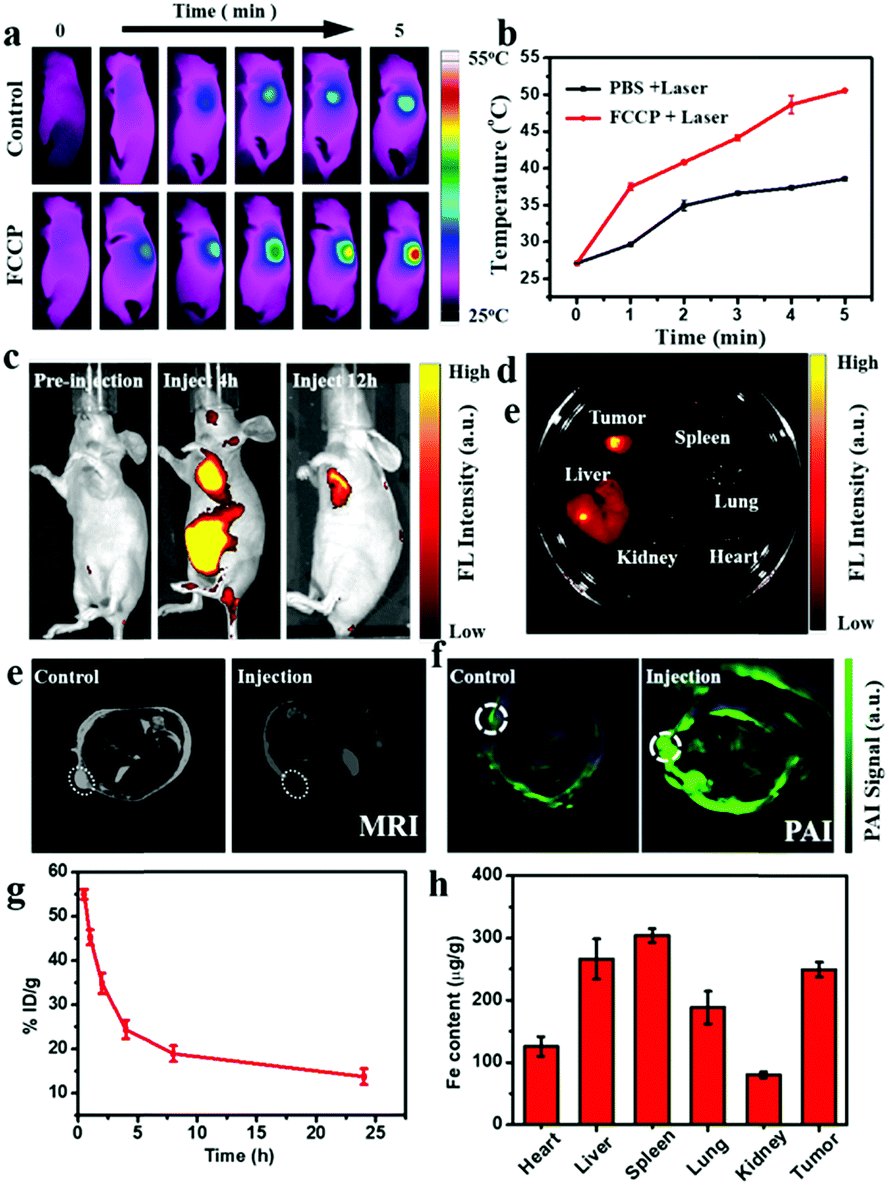 | ||
| Fig. 7 (a) PTI of mice treated with FCCP NPs or PBS (10 mM, pH 7.4), respectively. (b) Corresponding temperature of surface of tumors in (a). (c) PLI at different times of tumor-bearing mouse injected with FCCP NPs. (d) Ex vivo PLI of major organs and tumor dissected from mice injected with FCCP NPs at 12 h. (e) MRI and (f) PAI of tumor-bearing mouse injected with FCCP NPs and control. (g) Pharmacokinetic study of FCCP over a span of 24 h. (h) Biodistribution of FCCP at 24 h after i.v. injection into cancer tumor-bearing mice as determined by measurement of the Fe content in various organs and tissues. The error bars were based on the standard error of the mean for triplicate samples. Mice received an injection of 50 μL FCCP at a dosage of 25 mg Fe kg−1. | ||
In vivo therapeutic efficacy
The in vivo anticancer efficacy of FCCP NPs was investigated using five groups (n = 5) of A549 tumor-bearing nude mice. In comparison with the control group that received PBS (10 mM, pH 7.4), tumor growth was inhibited in all the treatment groups to some degree except the group treated with PBS (10 mM, pH 7.4) and irradiated with 635 and 980 nm NIR lasers (Fig. 8a and b), which indicated that the anticancer effect of the NIR lasers was negligible. The group treated with FCCP NPs displayed a much higher tumor inhibition rate than the group treated with free porphyrin under irradiation with the 635 nm NIR laser, which resulted from the outstanding characteristics of Fe3O4 nanoclusters for the simultaneous generation of ˙OH as a therapeutic agent and in situ production of O2 for modulating the hypoxic microenvironment of tumors to improve the efficacy of PDT (Fig. 8a and b). Furthermore, when the group treated with FCCP NPs were irradiated with 635 and 980 nm NIR lasers, the tumors almost disappeared owing to the synergistic effect of PDT and PTT, which indicated remarkable anticancer efficacy (Fig. 8a and b). A similar tumor inhibition rate was observed in the group treated with FCCP NPs and irradiated with the 980 nm NIR laser, which indicated that FCCP NPs can efficiently absorb NIR light energy for conversion into local heat to ablate the tumor (Fig. 8a and b). The slight change in the body weight of all the mice in the different groups demonstrated the high biocompatibility and biosafety of FCCP NPs in vivo (Fig. 8c). A hypoxyprobe (pimonidazole) immunohistochemical assay was performed to characterize the effect of FCCP NPs on the hypoxic environment of tumors. Tumor slices were extracted after different treatments and the cell nuclei and hypoxic areas were stained with 4′,6-diamidino-2-phenylindole (DAPI, blue) and anti-pimonidazole antibody (green), respectively, to observe the outcomes of the immunofluorescence staining assay. The intensity of the green color in the tumors underwent a significant decrease in mice after i.v. injection with FCCP nanoparticles in comparison with the control group, which indicated that the hypoxic environment of the tumor was significantly alleviated owing to the generation of O2 induced by FCCP NPs. Laser irradiation would not induce significant tumor hypoxia in the tumors treated with FCCP NPs, which further indicated the high O2-generating ability of FCCP NPs (Fig. 8d). The tumor sections stained with hematoxylin and eosin (H&E) displayed in Fig. 8f revealed extensive tumor tissue necrosis and abundant apoptotic cells in the tumor tissues in the group treated with FCCP NPs under irradiation with 635 and 980 nm NIR lasers in comparison with the other groups, which demonstrated high consistency with the data for tumor growth (Fig. 8e and Fig. S8, ESI†). The proliferative activity of tumor cells was further analyzed by immunostaining against Ki-67. The group injected with porphyrin with 635 nm NIR irradiation exhibited a decrease in Ki-67-positive cells in comparison with control groups with/without NIR irradiation, whereas the group treated with FCCP NPs under irradiation with a 635 nm NIR laser displayed fewer Ki-67-positive cells than the group treated with porphyrin (Fig. 8g). Notably, tumor tissues that received treatment with FCCP NPs coupled with irradiation with 635 and 980 nm NIR lasers displayed negligible numbers of Ki-67-positive cells. Terminal deoxynucleotidyl transferase UTP (uridine triphosphate) nick end labeling (TUNEL) (Fig. 8h) staining was further used to detect apoptotic cells in tumor tissues in the group injected with FCCP in combination with irradiation with 635 and 980 nm NIR lasers, whereas no obvious tumor damage was observed in the control group. These results further confirmed the advanced anticancer efficacy of FCCP NPs due to the synergistic effect of PDT/PTT.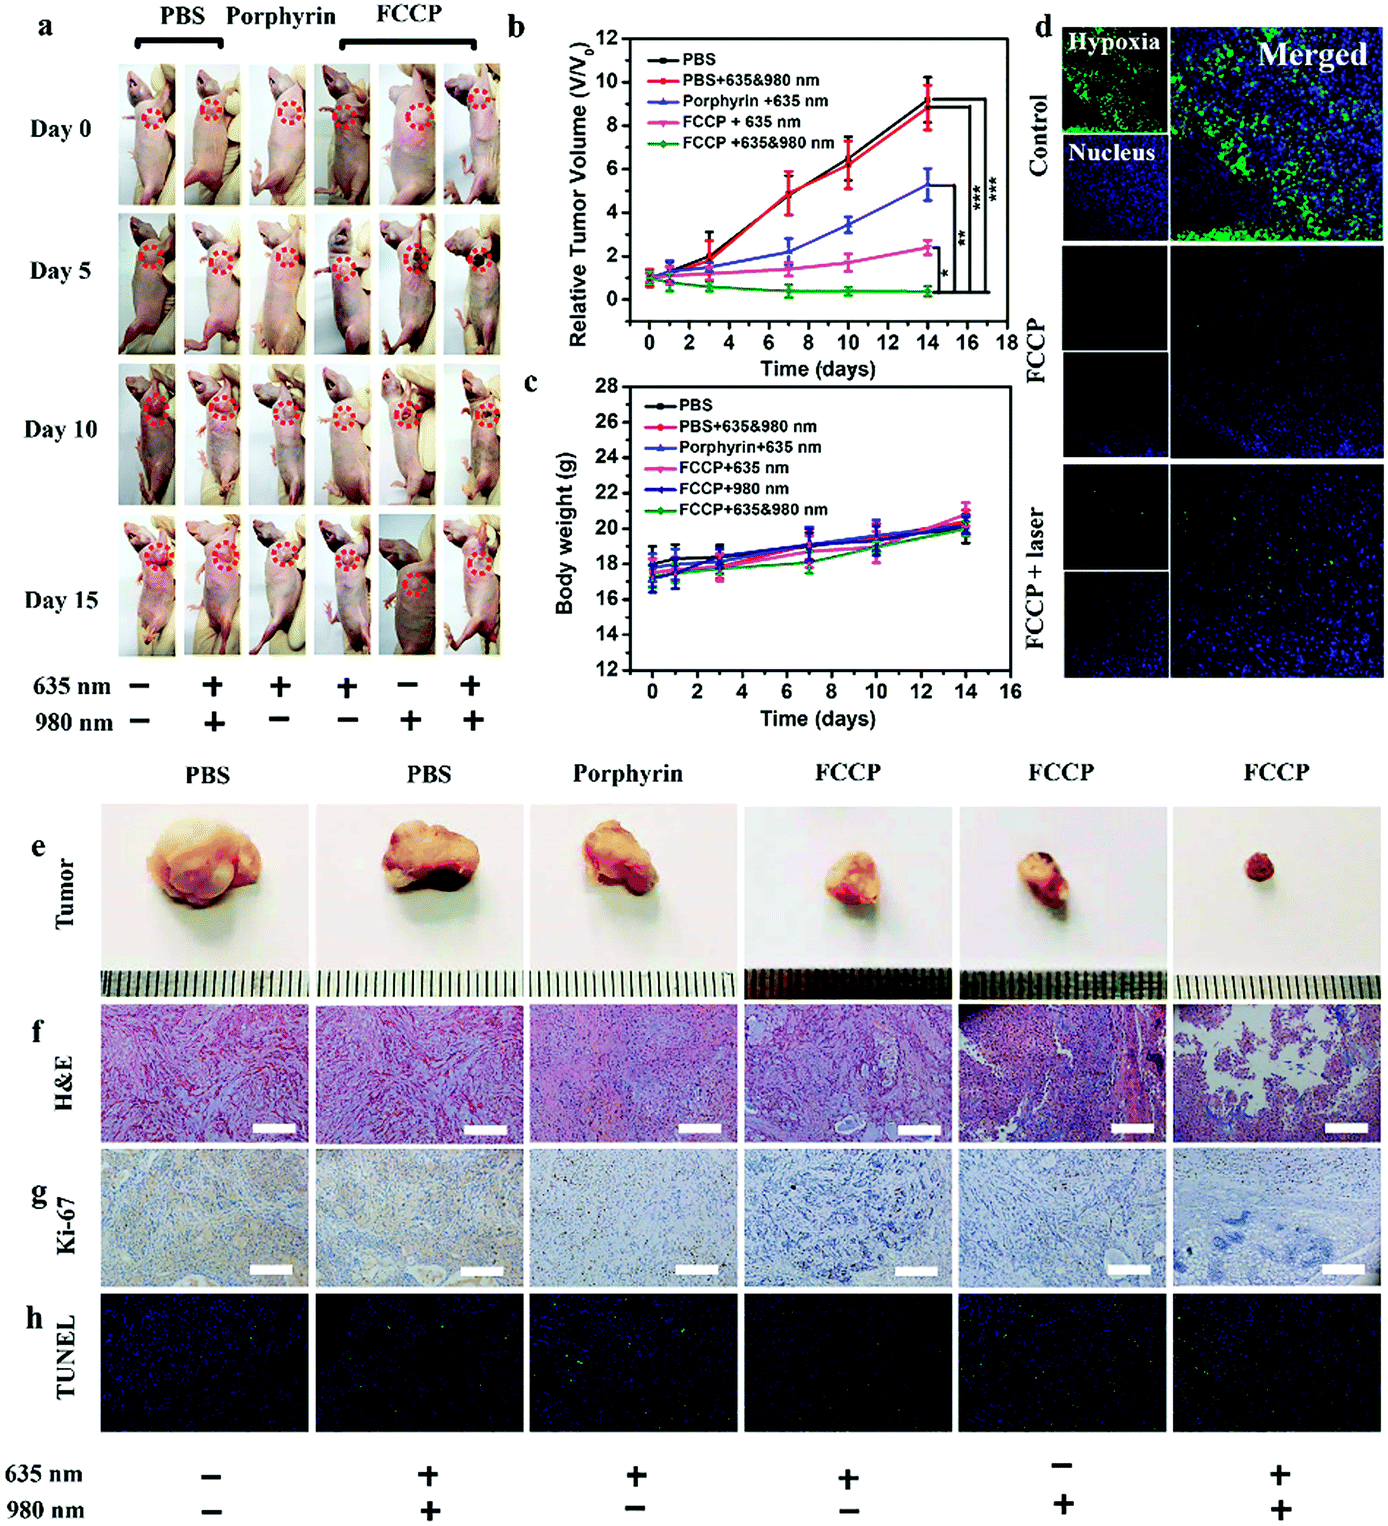 | ||
| Fig. 8 In vivo therapeutic effect of FCCP. (a) Representative photos of tumor-bearing nude mice after different treatments at various time points. Changes in the (b) relative tumor volume and (c) body weight of mice treated with PBS (10 mM, pH 7.4), PBS (10 mM, pH 7.4) + 635 and 980 nm NIR irradiation, free porphyrin, FCCP + 635 nm NIR irradiation, FCCP + 980 nm NIR irradiation, and FCCP + 635 and 980 nm NIR irradiation (mean ± s.e.m., n = 5). (d) Representative immunofluorescence images of tumor slices after hypoxia staining. The nucleus and hypoxic areas were stained with DAPI (blue) and anti-pimonidazole antibody (green). Photographs of tumor tissues from mice (e) treated by different methods after (f) H&E, (g) Ki-67 and (h) TUNEL analysis. The scale bars in all images correspond to 100 μm. | ||
We also collected images of H&E-stained major organs, including the heart, liver, spleen, lung and kidney, from A549 tumor-bearing mice that experienced different treatments (Fig. 9). Neither obvious organ damage nor inflammatory lesions were observed in the heart, liver, spleen and lung in mice treated with porphyrin and FCCP NPs with or without NIR laser treatment in comparison with control groups, which indicated the high biocompatibility in vivo of the proposed FCCP NPs.
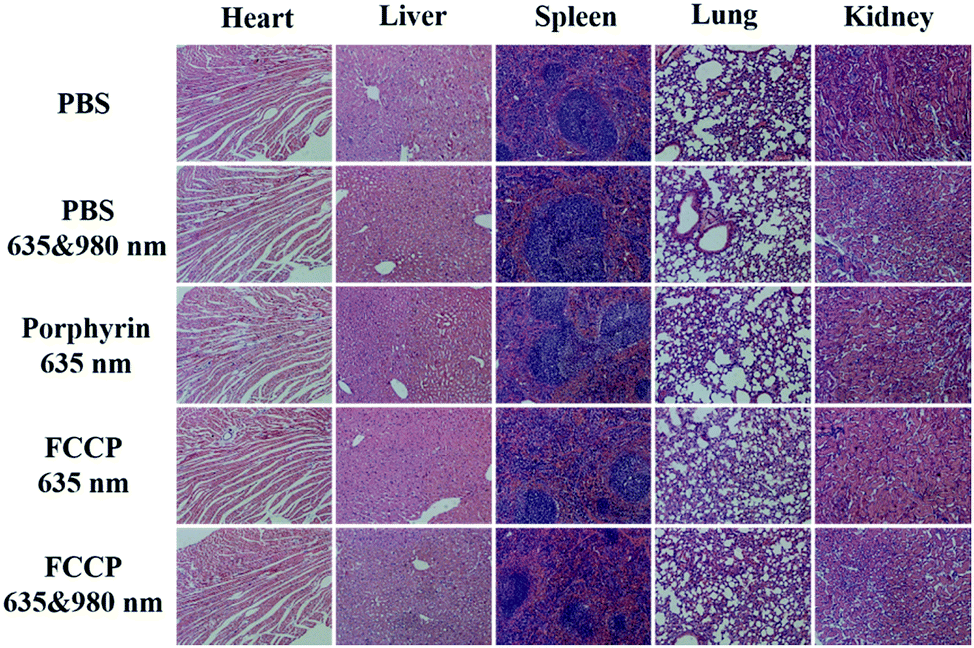 | ||
| Fig. 9 Images of H&E-stained major organs (heart, liver, spleen, lung, and kidney) of nude mice that experienced different treatments for 2 weeks. The scale bars in all images correspond to 100 μm. | ||
Conclusions
In summary, we utilized the outstanding enzyme mimetic characteristics of Fe3O4 NPs toward endogenous H2O2 for the concurrent generation of ˙OH as a therapeutic agent and in situ production of O2 for modulating the hypoxic microenvironment of tumors to overcome resistance to photodynamic therapy. An “all-in-one” multifunctional platform comprising CS-encapsulated Fe3O4 modified with CuS and porphyrin was fabricated to achieve multimodal imaging and synergetic therapy. The synthesized FCCP NPs take advantage of the generated ˙OH and 1O2 transformed from O2 by the porphyrin photosensitizer under NIR irradiation to achieve efficient PDT. In combination with PTT using CuS, FCCP NPs are able to induce cancer cell death with remarkable efficiency in vitro. Upon i.v. injection, the tumor-targeting activity of FCCP NPs can be efficiently revealed by multimodal imaging, including PAI, MRI, PLI and PTI, to guide therapy. The in vivo therapeutic efficacy achieved by PDT/PTT with FCCP NPs in inhibiting tumor growth was remarkably improved in comparison with that achieved by PDT using free porphyrin. The study may open a new avenue for the activatable generation of ROS via nanotechnology and the design of multifunctional theranostic platforms to overcome a current deficiency of cancer therapies.Experimental
Materials and reagents
All of the reagents were of analytical reagent grade, and all solutions were prepared with DI water without further purification. CS (80–95% deacetylated), FeCl3·6H2O, sodium acetate, ethylene glycol, copper chloride, Na2S, dimethyl sulphoxide (DMSO) and citric acid were purchased from Sinopharm Chemical Reagent Co., Ltd (Shanghai, China). Thiazolyl blue tetrazolium blue (MTT), 4,6′-diamidino-2-phenylindole (DAPI), and calcein AM were purchased from J&K China Chemical Ltd (Beijing, China). DCFH-DA was obtained from Beyotime Biotechnology (Shanghai, China). 1,3-Diphenylisobenzofuran (DPBF) was obtained from Alfa Aesar (Shanghai, China). Standard fetal bovine serum (FBS), phosphate-buffered saline (PBS; 10 mM, pH 7.4), and Dulbecco's modified Eagle's medium (DMEM) were obtained from Life Technologies Corporation (Los Angeles, CA, USA). Deionized (DI) water was generated using a Millipore Milli-Q system (Billerica, MA, USA).Material characterizations
The morphologies of FCCP NPs were examined by TEM (JEM-2010, 200 kV) and SEM (Hitachi S-4800). XPS analyses were performed using an ESCALAB 250 spectrometer (Thermo VG Scientific, USA). XRD was performed using X-rays with a Cu KR target. The porosity was determined from a nitrogen adsorption–desorption isotherm recorded using a surface area analyzer (QuadraSorb SI 2000-08, Quantachrome Instruments). Raman spectra were recorded at room temperature using an inVia Reflex Raman microscope with a laser excitation wavelength of 532 nm. FTIR measurements were recorded using a Nicolet 400 Fourier transform infrared spectrometer (Madison, WI). UV-vis-NIR absorption analyses were performed with a UV-1800 spectrophotometer (Shimadzu, Japan). All fluorescence measurements were performed using a confocal laser scanning fluorescence microscope (CLS; FV1200, Olympus, Japan).Preparation of porphyrin
Triglycol monomethyl ether (4.4 mL, 27.6 mmol) and para toluenesulfonyl chloride were added to a 250 mL round-bottom flask. To this flask 80 mL dichloromethane (DCM) was added, and then triethylamine (11.1 mL, 82.5 mmol) was added dropwise. The mixture was stirred at 0 °C for 12 h. The solvent was removed with a rotary evaporator, and then the residue was purified using a silica gel column with ethyl acetate and petroleum ether (2:1, v/v) as the eluent. A colorless oily liquid was collected as intermediate compound 1 (9.0 g, 88%). 1H NMR (CDCl3, 500 MHz): δ = 7.81 (d, J = 10.0 Hz, 2H), 7.34 (d, J = 10.0 Hz, 2H), 4.17 (t, J = 5.0 Hz, 2H), 3.69 (t, J = 5.0 Hz, 2H), 3.63–3.60 (m, 6H), 3.54 (t, J = 4.0 Hz, 2H), 3.38 (s, 3H), 2.45 (s, 3H). MALDI-TOF MS: m/z calcd for C14H22O6S 318.1, found 318.2.
3,4-Dihydroxybenzaldehyde (1.24 g, 9 mmol) and triglycol monomethyl ether tosylate (6.36 g, 36 mmol) were dissolved in DMF (60 mL), and then K2CO3 (4.97 g, 36 mmol) was added. The mixture was heated to 100 °C and stirred for 24 h. Then the reaction was quenched by the addition of H2SO4 (2 M, 120 mL). After cooling to room temperature, the mixture was extracted with dichloromethane/deionized water. The organic phase was dried over anhydrous magnesium sulfate and then spin-dried with a rotary evaporator. The residue was purified using a silica gel column with ethyl acetate and petroleum ether (1:1, v/v) as the eluent to obtain a faintly yellow oily liquid as intermediate compound 2 (3.8 g, 50%). 1H NMR (CDCl3, 500 MHz): δ = 9.76 (s, 1H), 7.37 (d, J = 7.5 Hz, 2H), 6.93 (d, J = 10.0 Hz, 1H), 4.20–4.14 (m, 4H), 3.85–3.82 (m, 4H), 3.70–3.68 (m, 4H), 3.61–3.58 (m, 8H), 3.49–3.47 (m, 4H), 3.30 (s, 6H). MALDI-TOF MS: m/z calcd for C21H34O9 430.2, found 430.2.
3,4-Bis(1,4,7,10-tetraoxaundecyl)benzaldehyde (4.21 g, 10 mmol) and distilled pyrrole were added to a 500 mL round-bottom flask. To this flask 250 mL dry dichloromethane was added. Then boron trifluoride diethyl etherate (1–2 mL) was added dropwise, and the mixture was stirred at room temperature under an atmosphere of nitrogen for 3 h. Afterwards, DDQ (2 g, 8.96 mmol) was added, and the mixture was stirred for a further 30 min. Then the reaction was stopped, and the solvent was removed with a rotary evaporator to obtain a black solid crude product, which was roughly purified by column chromatography using dichloromethane and methyl alcohol (30:1, v/v) as the eluent to obtain the purple crystalline end product P1. 1H NMR (CDCl3, 500 MHz): δ = 8.90 (s, 8H), 7.83 (s, 4H), 7.75 (d, J = 5.0 Hz, 4H), 7.30 (d, J = 10.0 Hz, 4H), 4.51 (t, J = 5.0 Hz, 8H), 4.34 (t, J = 5.0 Hz, 8H), 4.11 (t, J = 5.0 Hz, 8H), 3.96–3.92 (m, 16H), 3.82–3.80 (m, 8H), 3.78–3.76 (m, 16H), 3.71–3.64 (m, 16H), 3.50 (t, J = 10.0 Hz, 8H), 3.44 (s, 12H), 3.32 (t, J = 10.0 Hz, 8H), 3.22 (s, 12H), −2.77 (s, 2H, N–H). MALDI-TOF MS: m/z calcd for C100H142N4O32 1911.9, found 1911.7.
Preparation of Fe3O4@CS
Magnetic Fe3O4@CS particles were synthesized according to a modified literature protocol by a solvothermal reduction approach.29 In brief, 3.60 g FeCl3·6H2O was dissolved in 80.0 mL ethylene glycol, and 1.2 g CS powder was then added under strong stirring. Afterward, a 20 mL ethylene glycol solution containing sodium acetate (20.0 g) was slowly added to the above mixing solution, in which ethylene glycol served as a reductant to form Fe3O4 NPs and the oxygen element in the Fe3O4 NPs was supplied by sodium acetate. Then, the mixture was ultrasonicated for a period and heated to 185 °C gradually in a nitrogen atmosphere for 24 h. The nitrogen atmosphere was important for the formation of Fe3O4 by supplying a reducing environment. Fe3O4@CS was obtained by magnetic separation and washed several times with ethanol and water.Preparation of Fe3O4@CS/CuS
Firstly, 21 mg of CuCl2 was dissolved in 29 mL DI water and added to 1 mL of the resulting 5 mg mL−1 aqueous suspension of Fe3O4@CS in a 50 mL glass vial under ultrasound for 1 h. Subsequently, 2.6 mL of Na2S (12.3 mg mL−1) and 36 mg citric acid were added to the reaction solution. The reaction mixture was transferred to a water bath at 90 °C for 10 min and centrifuged to obtain Fe3O4@CS/CuS NPs. Different weight ratios of Fe3O4@CS:CuS (1:1, 1:2, 1:4, and 1:5) were also obtained via the above method.
Preparation of FCCP NPs
To load porphyrin into Fe3O4@CS/CuS NPs, a porphyrin solution was added to a solution of Fe3O4@CS nanoparticles in different weight ratios (0:1, 0.1:1, 0.5:1, 1:1, and 2:1), and the mixture was stirred for 24 h in the dark at room temperature, followed by centrifugation (10000 rpm, 10 min), and washed three times with DI water to remove free porphyrin molecules. The FCCP NPs that were obtained were redispersed in DI water.
In vitro assay of peroxidase-like activity and intracellular ROS level
To investigate the peroxidase-like activity of the synthesized NPs, 1 mL solutions with different concentrations of the prepared Fe3O4@CS and FCCP NPs (0, 10, 20, 50, 100, and 200 μg mL−1) were added to 1.5 mL tubes. Moreover, 0.5 ng HRP was used as a control in 1 mL reaction buffer (0.2 mol mL−1 NaAc, pH 3.6), after which 32 μL of H2O2 (30%) was added to the above solution, and then 10 mL TMB (10 mg mL−1, dissolved in DMSO) was added. After the tubes were incubated at 37 °C for 10 min, color-forming reactions were observed. Finally, 300 mL of 0.5 mol L−1 H2SO4 was used to stop the reactions.The ROS levels in cells treated with Fe3O4@CS or FCCP were measured using an ROS assay kit (DCFH-DA) according to the manufacturer's instructions. Cells treated with Fe3O4@CS NPs, free porphyrin, and FCCP NPs and control cells were incubated with DCFH-DA for 20 min at 37 °C. The cell media were removed and the remaining cells were washed with PBS (10 mM, pH 7.4) and resuspended in DMEM. The fluorescence intensity was recorded using a confocal laser scanning fluorescence microscope.
Photothermal performance of FCCP NPs
The PTC effects of the products that were obtained were measured as follows. A solution of the NPs in a quartz cuvette was exposed to a 980 nm NIR laser (Hi-Tech Optoelectronics Company) for 10 min at a power density of 0.72 W cm−2. The temperature of the solution was recorded once every 2 s using a digital thermometer with a thermocouple probe (OMEGA 4-channel). PT images were acquired with a TiS65 infrared camera (Fluke, USA). To measure the photothermal stability of FCCP NPs, a solution of FCCP NPs was exposed to a 980 nm NIR laser for 10 min at a power density of 0.72 W cm−2 and then cooled to room temperature without natural irradiation, and the laser on/off cycle was repeated four times. The temperature of the solution was measured and recorded once every 2 s using a digital thermometer with a thermocouple probe.Detection of singlet oxygen by chemical trapping
Firstly, 10 μL DPBF solution (10 mM) was added to 2 mL of a solution of FCCP NPs (20 μg mL−1) in a sealed quartz cuvette. The mixture solution was irradiated with a 635 nm NIR laser for 100 s, and the absorption intensity of DPBF at 420 nm was accordingly recorded every 10 s. In all experiments, the decrease in the absorbance caused by photobleaching of DPBF was measured and corrected. The natural values of the absorption of DPBF at 420 nm were plotted against the irradiation time and fitted by a linear least-squares model to determine the decay rate of the photosensitized process by a normalization method. For comparison, the absorbances of water, Fe3O4@CS and porphyrin were also measured in the same conditions.Cell cytotoxicity assay
Cancer cells were seeded on 96-well plates at 10000 cells per well for 24 h. Afterwards, the cells were incubated with NPs with various concentrations for a further 4 h, after which the culture medium was replaced with 100 μL of fresh medium. The cells were further incubated for 24 h, after which 10 μL MTT solution (5 mg mL−1 in PBS, pH 7.4) was added to each well, which was incubated for a further 4 h to measure the absorbance at 492 nm using a microplate reader.
In vitro PTT and PDT
To evaluate the therapeutic efficacy of FCCP NPs, A549 cells (5 × 10⁴) in 1 mL DMEM were incubated with FCCP NPs (100 μg mL−1) or PBS (10 mM, pH 7.4) in centrifuge tubes (1.5 mL) for 30 min at 4 °C and then irradiated for 10 min with a single 980 nm NIR laser at a power density of 0.72 W cm−2, a single 635 nm NIR laser at a power density of 0.16 W cm−2 or both lasers, respectively. The cells were then immediately transferred into a 96-well plate containing 100 μL of fresh DMEM and incubated at 37 °C for a further 24 h before MTT experiments were carried out to measure the cell viability. The cells were imaged using a confocal laser scanning fluorescence microscope.PTT and PDT on MTS
MTS were obtained according to our previous reports.49 The resulting MTS were incubated with FCCP NPs (100 μg mL−1) or PBS (10 mM, pH 7.4) for 4 h. After the incubation, MTS were washed with PBS (10 mM, pH 7.4) and cultured for a further 24 h. MTS were then stained with calcein-AM and PI for confocal imaging.In vivo imaging
For in vivo PTI, mice were divided into two groups and intravenously injected with a solution of FCCP NPs (200 μL, 1 mg mL−1) or PBS (200 μL, 10 mM, pH 7.4), respectively, and exposed for 5 min to a 980 nm laser, after which a picture was taken using an infrared thermal camera (Pluk, USA).For in vivo PLI, each mouse was intravenously injected with 200 μL of a solution of FCCP NPs (1 mg mL−1) for imaging. After 12 h, the mice were sacrificed and their major organs (heart, liver, spleen, lung, kidneys and tumor) were collected for imaging using an IVIS Spectrum Imaging System (PerkinElmer, USA).
For in vivo MRI, each mouse was intravenously injected with 200 μL of a solution of FCCP NPs (1 mg mL−1). After 24 h, the mice were imaged using a 1.0 T clinical MRI scanner (Niuman Corporation, China).
For in vivo PAI, mice were injected with a solution of FCCP NPs (200 μL, 1 mg mL−1) or PBS (200 μL, 10 mM, pH 7.4). After 24 h, the mice were placed in a MOST inVision 128 system, and the PA signal was recorded using an iThera Medical imaging system.
In vivo therapy
Female nude mice were purchased from Beijing Weitong Lihua Experimental Animal Technology Co. Ltd and used according to protocols approved by the Department of Laboratory Animal Science at Peking University Health Science Center. To develop a tumor model, each mouse was injected continuously with 100 μL PBS (10 mM, pH 7.4) containing 1 × 10⁶ A549 cells. The mice were used when the tumor volumes were about 50–60 mm3.The tumor-bearing mice were randomized into five groups: (1) the control group, in which animals received an injection of 100 μL PBS (10 mM, pH 7.4) through the caudal vein; (2) the PBS (10 mM, pH 7.4) injection + 635 and 980 NIR group, in which animals received an injection of 100 μL PBS (10 mM, pH 7.4) through the caudal vein, 4 h later the tumors received irradiation with 635 and 980 nm NIR lasers for 5 min, and the irradiation was repeated twice at intervals of 10 min; (3) the porphyrin + 635 NIR group; (4) the FCCP NPs + 635 NIR group; (5) the FCCP NPs + 980 NIR group; and (6) the FCCP + 635 and 980 NIR group. Regarding the injection dose, mice received an injection of 100 μL of a PBS (10 mM, pH 7.4) solution containing free porphyrin (group 3) or FCCP (groups 4–6) at an identical porphyrin dose of 5.0 mg kg−1. The tumor sizes were measured every day with digital calipers.
Conflicts of interest
The authors declare no competing financial interest.Acknowledgements
This work was supported by the Special Foundation for State Major Research Program of China (Grant No. 2016YFC0106602 and 2016YFC0106601), the National Natural Science Foundation of China (Grant No. 21645005, 21475008, 51673023, and 51473020), and the Open Research Fund Program of Beijing Key Lab of Plant Resource Research and Development, Beijing Technology and Business University (PRRD-2016-YB2).Notes and references
- Z. Sheng, D. Hu, M. Zheng, P. Zhao, H. Liu, D. Gao, P. Gong, G. Gao, P. Zhang, Y. Ma and L. Cai, ACS Nano, 2014, 8, 12310–12322 CrossRef CAS PubMed.
- J. Wang and J. Yi, Cancer Biol. Ther., 2008, 7, 1875–1884 CrossRef CAS PubMed.
- P. Zhang, W. Steelant, M. Kumar and M. Scholfield, J. Am. Chem. Soc., 2007, 129, 4526–4527 CrossRef CAS PubMed.
- J. P. Celli, B. Q. Spring, I. Rizvi, C. L. Evans, K. S. Samkoe, S. Verma, B. W. Pogue and T. Hasan, Chem. Rev., 2010, 110, 2795–2838 CrossRef CAS PubMed.
- C. A. Robertson, D. H. Evans and H. Abraharnse, J. Photochem. Photobiol., B, 2009, 96, 1–8 CrossRef CAS PubMed.
- A. Master, M. Livingston and A. Sen Gupta, J. Controlled Release, 2013, 168, 88–102 CrossRef CAS PubMed.
- D. E. Post, N. S. Devi, Z. C. Li, D. J. Brat, B. Kaur, A. Nicholson, J. J. Olson, Z. B. Zhang and E. G. Van Meir, Clin. Cancer Res., 2004, 10, 8603–8612 CrossRef CAS PubMed.
- J. Kim, H. R. Cho, H. Jeon, D. Kim, C. Song, N. Lee, S. H. Choi and T. Hyeon, J. Am. Chem. Soc., 2017, 139, 10992–10995 CrossRef CAS PubMed.
- S. Cui, D. Yin, Y. Chen, Y. Di, H. Chen, Y. Ma, S. Achilefu and Y. Gu, ACS Nano, 2013, 7, 676–688 CrossRef CAS PubMed.
- H. Ren, J. Liu, Y. Li, H. Wang, S. Ge, A. Yuan, Y. Hu and J. Wu, Acta Biomater., 2017, 59, 269–282 CrossRef CAS PubMed.
- W.-P. Li, C.-H. Su, Y.-C. Chang, Y.-J. Lin and C.-S. Yeh, ACS Nano, 2016, 10, 2017–2027 CrossRef CAS PubMed.
- Z. Zhou, J. Song, R. Tian, Z. Yang, G. Yu, L. Lin, G. Zhang, W. Fan, F. Zhang, G. Niu, L. Nie and X. Chen, Angew. Chem., Int. Ed., 2017, 56, 6492–6496 CrossRef CAS PubMed.
- J. Qi, Y. Fang, R. T. K. Kwok, X. Zhang, X. Hu, J. W. Y. Lam, D. Ding and B. Z. Tang, ACS Nano, 2017, 11, 7177–7188 CrossRef CAS PubMed.
- X. Cai, J. Liu, W. H. Liew, Y. Duan, J. Geng, N. Thakor, K. Yao, L.-D. Liao and B. Liu, Mater. Chem. Front., 2017, 1, 1556–1562 RSC.
- Z. Xu, X. Ma, Y.-E. Gao, M. Hou, P. Xue, C. M. Li and Y. Kang, Mater. Chem. Front., 2017, 1, 1257–1272 RSC.
- Y. Ma, J. Huang, S. Song, H. Chen and Z. Zhang, Small, 2016, 12, 4936–4954 CrossRef CAS PubMed.
- A. Fei, Q. Liu, J. Huan, J. Qian, X. Dong, B. Qiu, H. Mao and K. Wang, Biosens. Bioelectron., 2015, 70, 122–129 CrossRef CAS PubMed.
- L. Gao, J. Zhuang, L. Nie, J. Zhang, Y. Zhang, N. Gu, T. Wang, J. Feng, D. Yang, S. Perrett and X. Yan, Nat. Nanotechnol., 2007, 2, 577–583 CrossRef CAS PubMed.
- Y. L. Dong, H. G. Zhang, Z. U. Rahman, L. Su, X. J. Chen, J. Hu and X. G. Chen, Nanoscale, 2012, 4, 3969–3976 RSC.
- M. B. Gawande, P. S. Branco and R. S. Varma, Chem. Soc. Rev., 2013, 42, 3371–3393 RSC.
- R. X. Huang, Z. Q. Fang, X. M. Yan and W. Cheng, Chem. Eng. J., 2012, 197, 242–249 CrossRef CAS.
- W. P. Li, C. H. Su, Y. C. Chang, Y. J. Lin and C. S. Yeh, ACS Nano, 2016, 10, 2017–2027 CrossRef CAS PubMed.
- S.-Y. Li, H. Cheng, B.-R. Xie, W.-X. Qiu, J.-Y. Zeng, C.-X. Li, S.-S. Wan, L. Zhang, W.-L. Liu and X.-Z. Zhang, ACS Nano, 2017, 11, 7006–7018 CrossRef CAS PubMed.
- J. P. Kehrer, Toxicology, 2000, 149, 43–50 CrossRef CAS PubMed.
- H. H. Fan, G. B. Yan, Z. L. Zhao, X. X. Hu, W. H. Zhang, H. Liu, X. Y. Fu, T. Fu, X. B. Zhang and W. H. Tan, Angew. Chem., Int. Ed., 2016, 55, 5477–5482 CrossRef CAS PubMed.
- Z. Wang, P. Huang, O. Jacobson, Z. Wang, Y. Liu, L. Lin, J. Lin, N. Lu, H. Zhang, R. Tian, G. Niu, G. Liu and X. Chen, ACS Nano, 2016, 10, 3453–3460 CrossRef CAS PubMed.
- G. Ku, M. Zhou, S. Song, Q. Huang, J. Hazle and C. Li, ACS Nano, 2012, 6, 7489–7496 CrossRef CAS PubMed.
- J. Li, Y. He, W. Sun, Y. Luo, H. Cai, Y. Pan, M. Shen, J. Xia and X. Shi, Biomaterials, 2014, 35, 3666–3677 CrossRef CAS PubMed.
- L.-S. Lin, Z.-X. Cong, J.-B. Cao, K.-M. Ke, Q.-L. Peng, J. Gao, H.-H. Yang, G. Liu and X. Chen, ACS Nano, 2014, 8, 3876–3883 CrossRef CAS PubMed.
- Z. Gao, X. Liu, G. Deng, F. Zhou, L. Zhang, Q. Wang and J. Lu, Dalton Trans., 2016, 45, 13456–13465 RSC.
- S. Yamano, J. Dai, S. Hanatani, K. Haku, T. Yamanaka, M. Ishioka, T. Takayama, C. Yuvienco, S. Khapli, A. M. Moursi and J. K. Montclare, Biomaterials, 2014, 35, 1705–1715 CrossRef CAS PubMed.
- B. A. Albani, B. Pena, N. A. Leed, N. De Paula, C. Pavani, M. S. Baptista, K. R. Dunbar and C. Turro, J. Am. Chem. Soc., 2014, 136, 17095–17101 CrossRef CAS PubMed.
- X. Meng, Z. Liu, Y. Cao, W. Dai, K. Zhang, H. Dong, X. Feng and X. Zhang, Adv. Funct. Mater., 2017, 27, 1605592 CrossRef.
- W. Jiang, W. Wang, B. Pan, Q. Zhang, W. Zhang and L. Lv, ACS Appl. Mater. Interfaces, 2014, 6, 3421–3426 CAS.
- K. Ding, J. Zeng, L. Jing, R. Qiao, C. Liu, M. Jiao, Z. Li and M. Gao, Nanoscale, 2015, 7, 11075–11081 RSC.
- R. J. Thibeau, C. W. Brown and R. H. Heidersbach, Appl. Spectrosc., 1978, 32, 532–535 CrossRef CAS.
- C. Zhao, X. Wu, X. Zhang, P. Li and X. Qian, J. Electroanal. Chem., 2017, 785, 172–179 CrossRef CAS.
- J. Gao, X. Ran, C. Shi, H. Cheng, T. Cheng and Y. Su, Nanoscale, 2013, 5, 7026–7033 RSC.
- H. Wu, Y. Li and Q. Li, Appl. Phys. A: Mater. Sci. Process., 2017, 123, 196 CrossRef.
- L. Dambies, C. Guimon, S. Yiacoumi and E. Guibal, Colloids Surf., A, 2001, 177, 203–214 CrossRef CAS.
- C. Shen, Y. Shen, Y. Wen, H. Wang and W. Liu, Water Res., 2011, 45, 5200–5210 CrossRef CAS PubMed.
- S.-Y. Li, H. Cheng, B.-R. Xie, W.-X. Qiu, L.-L. Song, R.-X. Zhuo and X.-Z. Zhang, Biomaterials, 2016, 104, 297–309 CrossRef CAS PubMed.
- K. Han, S.-B. Wang, Q. Lei, J.-Y. Zhu and X.-Z. Zhang, ACS Nano, 2015, 9, 10268–10277 CrossRef CAS PubMed.
- S.-Y. Li, H. Cheng, W.-X. Qiu, L.-H. Liu, S. Chen, Y. Hu, B.-R. Xie, B. Li and X.-Z. Zhang, ACS Appl. Mater. Interfaces, 2015, 7, 28319–28329 CAS.
- X. Liu, B. Li, F. Fu, K. Xu, R. Zou, Q. Wang, B. Zhang, Z. Chen and J. Hu, Dalton Trans., 2014, 43, 11709–11715 RSC.
- L. Zhang, S. Gao, F. Zhang, K. Yang, Q. Ma and L. Zhu, ACS Nano, 2014, 8, 12250–12258 CrossRef CAS PubMed.
- Z. Wang, P. Huang, O. Jacobson, Z. Wang, Y. Liu, L. Lin, J. Lin, N. Lu, H. Zhang, R. Tian, G. Niu, G. Liu and X. Chen, ACS Nano, 2016, 10, 3453–3460 CrossRef CAS PubMed.
- L. Rao, L.-L. Bu, J.-H. Xu, B. Cai, G.-T. Yu, X. Yu, Z. He, Q. Huang, A. Li, S.-S. Guo, W.-F. Zhang, W. Liu, Z.-J. Sun, H. Wang, T.-H. Wang and X.-Z. Zhao, Small, 2015, 11, 6225–6236 CrossRef CAS PubMed.
- E. B. Berens, J. M. Holy, A. T. Riegel and A. Wellstein, J. Visualized Exp., 2015, 105, e53409 Search PubMed.
Footnote |
| † Electronic supplementary information (ESI) available: Additional figures and associated discussions. See DOI: 10.1039/c8qm00098k |
| This journal is © the Partner Organisations 2018 |