
Adsorption behavior and structure transformation of mesoporous metal–organic frameworks towards arsenates and organic pollutants in aqueous solution†
Jianhua
Cai
 *ab,
Xuhui
Mao
*a and
Wei-Guo
Song
b
*ab,
Xuhui
Mao
*a and
Wei-Guo
Song
b
aSchool of Resource and Environmental Sciences, Wuhan University, Wuhan 430072, P. R. China. E-mail: clab@whu.edu.cn
bKey Laboratory of Molecular Nanostructure and Nanotechnology, Institute of Chemistry, Chinese Academy of Sciences, Zhongguancun North First Street 2, Beijing 100190, P. R. China. E-mail: jianhuacai@iccas.ac.cn
First published on 23rd May 2018
Abstract
Highly porous, water stable metal–organic frameworks, MIL-100(Fe,Al), were investigated for the adsorptive removal of arsenates. Superb adsorption properties were exhibited with maximum adsorption capacities of as high as 116 mg g−1 and 128 mg g−1 for MIL-100(Fe) and MIL-100(Al), respectively. The arsenate adsorption capacities of MIL-100(Fe,Al) were much higher than those of previously reported Fe-based and Al-based nanomaterials or porous materials. Owing to the unsaturated metal sites and organic ligand species, three types of organic contaminants could be removed with fast adsorption kinetics. The organic dye molecules (10 mg L−1 initial concentrations) could be rapidly removed by the MIL-100(Fe,Al) adsorbents with a removal efficiency of more than 80% in five minutes. The structural investigation of the adsorption behavior revealed that the guest molecules (arsenate or dye molecules) enter into the ordered mesopores of MIL-100(Fe,Al), and disrupt the long-range order of these uniform mesoporous channels. Electronic structure changes of the coordinative metal ions were investigated using X-ray photoelectron spectroscopy and Mössbauer spectroscopy to understand the interaction mechanism. The pore structure-occurring adsorption process of the Fe/Al-based MOFs is much more efficient than the traditional surface-occurring adsorption process, therefore the frameworks show good prospects for a variety of adsorptive separation applications.
Introduction
Metal–organic frameworks (MOFs), constructed from metal-containing units and organic ligand species, are hybrid crystalline materials that have attracted significant attention. MOFs have fascinating coordination structures and topologies, including a regular pore structure, high porosity and a large surface area. All of these notable features allow MOFs to play a profound role in gas storage, separation, and other applications.1,2 MOFs are known for their tunable pore size that ranges from a microporous to mesoporous scale.3,4 Mesoporous metal–organic frameworks, with a cavity size in the range of 2–50 nm, are of great interest due to their particularly promising ability to capture large-size molecules. Furthermore, considering their water and chemical stabilities, the use of MOFs can be expanded to aqueous adsorption, drug delivery and host–guest chemistry, etc. In particular, with the growing demand for functional materials designed for environmental remediation, the effective uptake of harmful substances can be achieved if robust, porous MOFs are rationally chosen.In recent years, the application of porous MOFs to the adsorption of contaminants in aqueous or non-aqueous media has attracted a large amount of attention due to the unique structures of MOFs.5–8 For example, studies on their use in the adsorption of trace amounts of pollutants (e.g. pharmaceutical molecules in water9,10), and the uptake of different types of aromatic organics,11–17 heterocyclic contaminants18–21 and oxyanions22–26 have been published. Samokhvalov reviewed the application of MOFs for the adsorption of organic compounds in solution,27 and he pointed out that the adsorption mechanism of organic molecules on MOFs covered ionic interactions, Brønsted acid–base interactions, hydrogen bonding, coordination bonding, and π–π interactions. From the perspective of material design, if the metal cations and organic “linker” units can be well selected, different mechanisms may occur in one metal–organic framework to achieve adsorbents with versatile functions. For example, the simultaneous removal of oxyanions (such as arsenates and phosphates) and aromatic compounds has proven to be a challenge for the activated carbon materials used in water treatment processes because activated carbon only has negatively charged surface functional groups. In regard to MOFs, the simultaneous removal of oxyanions and aromatic compounds may be resolved by constructing a well-ordered three-dimensional structure with appropriate positively charged central metal ions and organic linkers.
In the present study, we have synthesized the porous octahedral iron/aluminum trimesate metal–organic frameworks MIL-100(Fe) and MIL-100(Al) for the spontaneous removal of arsenates and organic dyes. Iron and aluminum have been selected because they are readily available, inexpensive, environmentally benign and non-toxic. Furthermore, our hypothesis is that the Fe and Al central metal ions can endow the MOF adsorbents with enhanced ability to remove arsenates due to their strong affinity to the arsenates; meanwhile, the Fe/Al central ions and organic parts of MIL-100(Fe) and MIL-100(Al) may provide a cooperative binding of aromatic organics via coordination, electrostatic interactions and π–π interactions.6 In order to verify the hypothesis, we investigated the saturated adsorption capacity (Qm) of MIL-100(Fe) and MIL-100(Al) for arsenates, by looking at the adsorption kinetics of three types of dyes and the adsorption mechanisms were studied using PXRD, and XPS and Mössbauer spectroscopies. We hope that the present work not only reveals the good prospects for the use of MOFs in the field of water treatment, but also sheds light on the design of high-performance and versatile adsorbents for various separation demands.
Experimental
Preparation of octahedral MIL-100(Fe) and MIL-100(Al)
MIL-100(Fe) was prepared according to a modified literature procedure28,29 by mixing metallic iron (8.0 mmol, 0.45 g), 1,3,5-benzenetricarboxylic acid or trimesic acid (5.4 mmol, 0.866 g), concentrated nitric acid (4.8 mmol), hydrofluoric acid (1.6 mmol) and deionized water (40 mL) and then heating the mixture at 433 K for 12 h in a Teflon-lined autoclave. The light-orange solid product was collected by filtration and washed with deionized water. The as synthesized MIL-100(Fe) was further purified by a two-step process using hot water and ethanol to decrease the amount of residual trimesic acid. Typically, 15 g of MIL-100(Fe) was added to 700 mL of deionized water and heated at 353 K for 3 h, followed by extraction in 700 mL of hot ethanol at 333 K for 3 h.For MIL-100(Al), impure phases such as MIL-110(Al) and MIL-96(Al) always accompany the target product. To obtain pure MIL-100(Al), the reaction time was delicately controlled, on the basis of reported methods in literature.30,31 Typically, 0.61 mmol (230 mg) of aluminum nitrate, 0.41 mmol (104 mg) of trimethyl-1,3,5-trimesate and 0.77 mL of nitric acid (1 M) with 2.8 mL of deionized water were mixed. After stirring overnight, the solution was transferred into a 23 mL Teflon-lined autoclave. The temperature was increased to 483 K over a period of 1 h and was then maintained at 483 K for 30 min. A yellowish product was obtained by filtration and washed with deionized water. Activation of MIL-100(Al) was performed by a two-step process using DMF (N,N-dimethylformamide) and hot water to decrease the amount of residual organics and anions. Typically, 1 g of MIL-100(Al) in 80 mL of DMF was heated at 423 K for 3 h, followed by extraction in 80 mL of deionized water at 373 K for 3 h.
Characterization
Powder X-ray diffraction (PXRD) patterns were recorded by a Rigaku D/max-2500 diffractometer with Cu Kα radiation (λ = 1.5418 Å) at 40 kV and 200 mA. The morphology and structures (EDS) of the samples were characterized using a field emission scanning electron microscope (FE-SEM, JEOL 6701F) and transmission electron microscope (TEM, JEOL 2100F). The nitrogen adsorption–desorption isotherms were measured on a Quantachrome Autosorb AS-1 instrument and the surface areas were measured by the Brunauer–Emmett–Teller (BET) method, where the pore size distributions were derived using the density functional theory (DFT) model and the pore volumes were derived using the t-method. Fourier-transform infrared (FT-IR) spectra were recorded on a Bruker Tensor 27. X-ray photoelectron spectroscopic (XPS) data were obtained with an ESCALab220i-XL electron spectrometer from VG Scientific using 300 W Al Kα radiation. The UV-visible absorption spectra were obtained using a UV-visible spectrophotometer (UV-2550, Shimadzu, Japan). Transmission Mössbauer spectroscopic measurements were carried out at room temperature using a conventional constant-acceleration spectrometer and a 57Co source. Velocity calibrations were performed using α-Fe foil. All isomer shifts were given relative to that of α-Fe.Adsorption experiments
Solutions with different concentrations of As(V) were prepared using Na2HAsO4·12H2O as the arsenate source without pH adjustment. As such, As(V) was mainly present in the form of HAsO42− in solutions with neutral to weakly alkaline pH values. To obtain the adsorption isotherm, 10 mg of MIL-100(Fe) or MIL-100(Al) was added to 25 mL of As(V) (0.4 g L−1) solution with different concentrations of 10, 20, 50, 100, 150, 200, 300 mg L−1 and the solutions were placed on a rotating shaker for 12 h at 25 °C. The solid and liquid phases were then separated using a 0.2 μm membrane and analyzed by inductively coupled plasma-optical emission spectroscopy (ICP-OES, Shimadzu ICPE-9000) to measure the concentration of the arsenate in the remaining clear solution. The pH value of the arsenate solution was adjusted using 2 M HCl or 2 M NaOH. Then, 10 mg of adsorbent was added into a 25 mL solution with pH values of 4, 7, and 11. Selective adsorption experiments were performed by adding 50 ppm of disturbing ions into a 10 ppm arsenate solution. Disturbing ions were introduced using the sodium salts NaCl, Na2SO4, NaNO3 and NaHCO3, respectively. After saturated adsorption for 12 h in a rotating shaker at 25 °C, the clear solutions were collected and analyzed by ICP-OES to measure the concentration of the arsenates.Adsorption experiments with low levels of arsenate were performed by adding 0.5 g L−1 of the MOFs into 50, 100, 200, 400, 600 and 800 μg L−1 arsenate solutions. The adsorption solutions were kept in a rotating shaker for 12 h at 25 °C. Then the clear solutions were separated and analyzed by ICP-MS. The desorption of arsenate was realized by adding 0.05 M HCl solutions.
For the removal of organic contaminants, 10 mg of the adsorbents were added in 25 mL, 10 ppm methylene blue (MB), rhodamine B (RhB) and Coomassie Brilliant Blue G-250 (CBB) solutions under stirring. About 1 mL of solution was taken at different time intervals and immediately centrifuged to separate the supernatant and tested in a UV-vis spectrophotometer (Shimadzu) from 350–800 nm.
Results and discussion
Characterization of MIL-100(Fe,Al)
The as-prepared MIL-100(Fe) and MIL-100(Al) samples were analyzed by SEM and TEM. Fig. 1a distinctly depicts the octahedral shape of the obtained MIL-100(Fe) sample. For the MIL-100(Al) sample in Fig. 1c and d, an octahedral shape can be observed, but the edges of the octahedrons are less clear than those of MIL-100(Fe). Both the MIL-100(Fe) and MIL-100(Al) particles have an average size of around 1 μm. Viewing them from the [111] direction, a hexagonal image can be observed (see the TEM images in Fig. 1b and d), indicating that both of the MOFs have particles with symmetric microstructures. The energy-dispersive X-ray (EDX) spectra of the MIL-100(Fe) and MIL-100(Al) samples (Fig. S1, ESI†) suggest that no impurities are present in the obtained materials.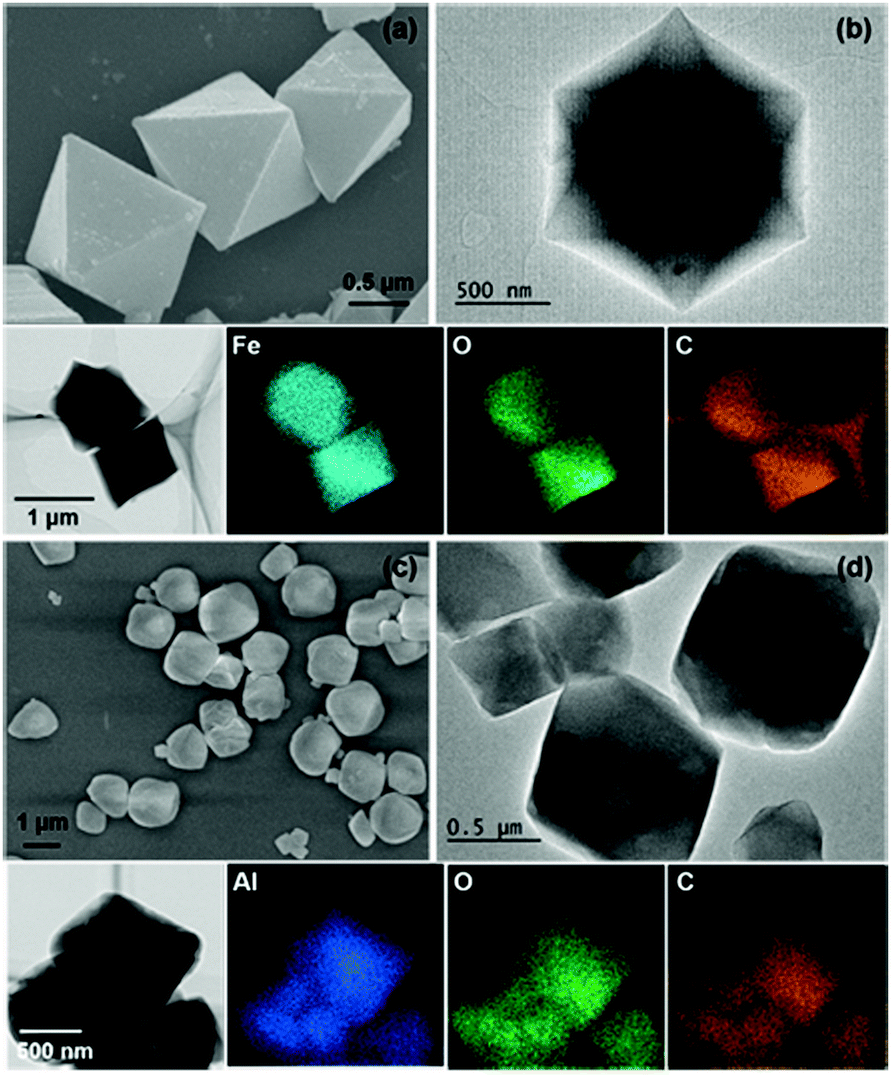 | ||
| Fig. 1 (a) Scanning electron microscopy (SEM) images and (b) transmission electron microscopy (TEM) images of MIL-100(Fe); (c) SEM images and (d) TEM images of MIL-100(Al). | ||
The powder X-ray diffraction (PXRD) patterns (Fig. 2a) show that MIL-100(Fe) and MIL-100(Al) have identical diffraction characteristic peaks. The feature of a pure MIL-100 phase is the presence of three high-intensity peaks located within the 2θ angle range below 4°. Based on the crystal structure analysis,29,31,32 Both MIL-100 structures (Fe,Al) have identical topologies, built from trimers of metal octahedrons (Fig. 2b(1)) and organic benzene-1,3,5-tricarboxylate (BTC) linkers. These μ3-O trimers connect with the BTC molecules to form a hybrid supertetrahedron (ST) unit. Four vertices of the ST are occupied by the trimers while the organic linkers are located at the four faces of the ST (Fig. 2b(2)). The supertetrahedra further assemble into a zeolite ZSM-39 architecture with MTN-typology in 3D space (Fig. 2b(3)). The zeolite ZSM-39 architecture has the characteristics of an octahedral morphology and symmetric crystallographic structure.33 The (M3O(OH)(H2O)2)4[BTC]4 (M = Fe, Al) supertetrahedra in the MOFs are similar to the SiO4 tetrahedra found in ZSM-39. Two types of mesoporous cavities are formed (see Fig. 2b(4)), and the smaller cage (with a diameter of nearly 25 Å) is a dodecahedron comprising 12 pentagonal rings. The larger cage is delimited by 12 pentagonal rings and 4 hexagonal rings, leading to a hexakaidodecahedron cage (51264) with a diameter of close to 29 Å.
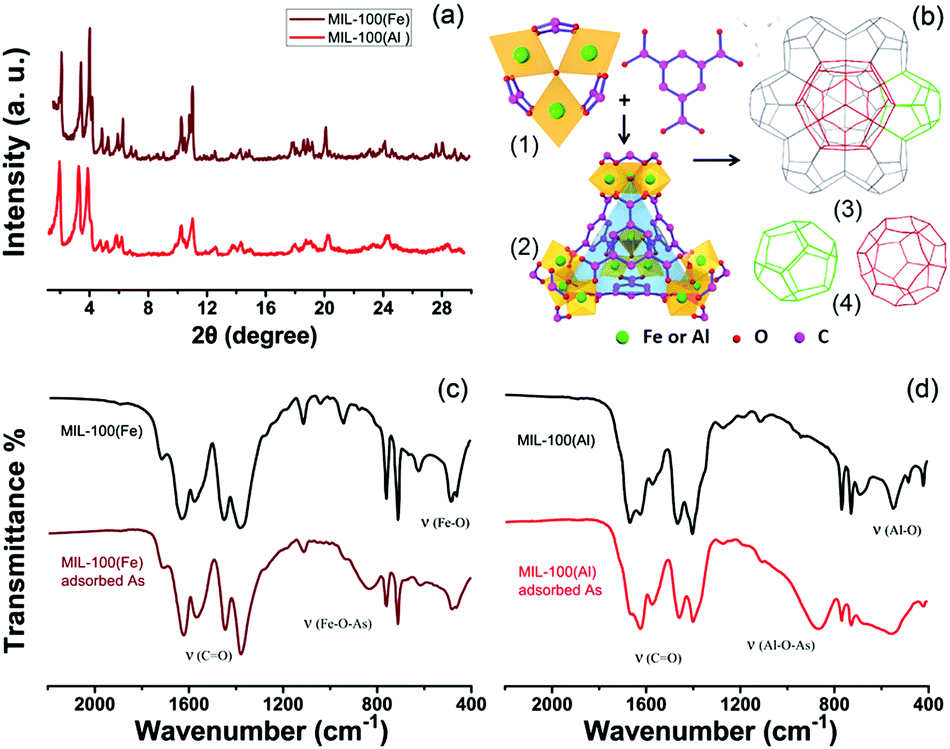 | ||
| Fig. 2 Structure and characterization of MIL-100; (a) the PXRD patterns, (b) the construction of the framework: (1) the primary building unit (a trimer of iron/aluminum octahedra) and the organic ligands; (2) the hybrid supertetrahedron; (3) a schematic view of the MTN topology from the [111] direction in MIL-100, (4) with the two types of cages present. (c and d) Magnified Fourier-transform infrared (FT-IR) spectra of both MIL-100 structures (Fe,Al) for comparison. | ||
The activated MIL-100(Fe) MOF has a large BET surface area of 1369.6 m2 g−1, while the BET surface area of MIL-100(Al) is around 1370.4 m2 g−1 (Fig. S2, ESI†). When the adsorbents were saturated, by adsorbing a 100 ppm contaminated solution (80 mg/25 mL), their surface areas decreased respectively, as shown in Fig. S2, ESI.† The pore sizes and pore volumes also decreased at the same time (Table S1, ESI†). The Fourier-transform infrared (FT-IR) spectra of MIL-100(Fe,Al) are shown in Fig. S3, ESI† and the magnified IR spectra are presented in Fig. 2c and d. The peak at around 1700 cm−1 corresponds to the C![[double bond, length as m-dash]](https://www.rsc.org/images/entities/char_e001.gif) O vibration. Two peaks at 1400–1500 cm−1 can be ascribed to the vibration of the benzene ring. The peaks below 1000 cm−1 are mainly due to the vibration of Fe/Al–O.
O vibration. Two peaks at 1400–1500 cm−1 can be ascribed to the vibration of the benzene ring. The peaks below 1000 cm−1 are mainly due to the vibration of Fe/Al–O.
Removal of arsenates and organics
The arsenate adsorption isotherms were plotted and are shown in Fig. 3a and b for MIL-100(Fe) and MIL-100(Al). The maximum adsorption capacities (Qm) were found to be 116 mg g−1 for MIL-100(Fe) and 128 mg g−1 for MIL-100(Al) according to the Langmuir adsorption model (eqn (1)). | (1) |
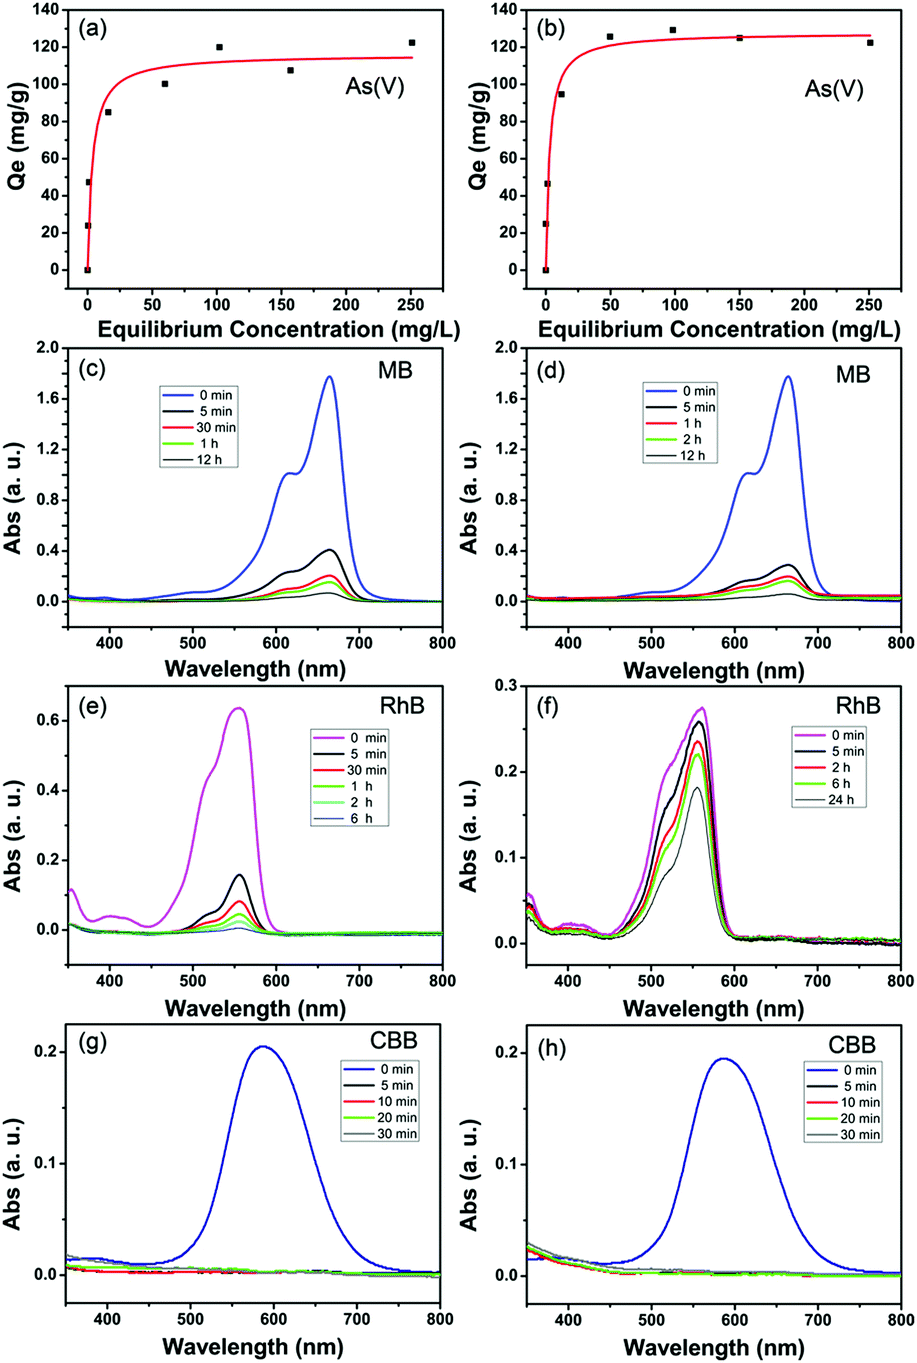 | ||
| Fig. 3 (a) Adsorption isotherm of arsenate from water by MIL-100(Fe), (b) adsorption isotherm of arsenates from water by MIL-100(Al); (c, e and g) adsorption kinetic curves of 10 ppm of MB, RhB and CBB by MIL-100(Fe). (d, f and h) Adsorption kinetic curves of 10 ppm od MB, RhB and CBB by MIL-100(Al). | ||
The maximum adsorption capacities of the prepared adsorbents were compared with other Fe,Al-based adsorbents and the comparisons are shown in Table 1. The maximum adsorption capacities of the as-prepared porous MIL-100(Fe) and MIL-100(Al) MOFs are much higher than those of recently reported Fe and Al-based adsorptive materials.34–52 In addition, iron oxides and activated alumina are commercial adsorbents for arsenate decontamination. From Table 1, the prepared MOF adsorbents exhibit significantly higher adsorption capacities for the removal of arsenate compared to these commercial adsorbents. Fe or Al elements are well known for their benign affinity to arsenates and arsenites, therefore Fe-based and Al-based minerals and composites are the most used materials to uptake arsenic from wastewater or groundwater. Besides the capacity, a wide pH-tolerance range and adsorption selectivity in real decontamination conditions of an adsorbent are also important. From the experimental results shown in Table S2 (ESI†), when the pH value of the solution varies from acidic (pH = 4) to alkaline (pH = 11), the adsorption is also effective with high efficiencies. But, at pH = 4, arsenates tend to exist in the form of neutral H3AsO4, which may lead to a decline in the adsorption capacity of As(V) at low pH. Since conventional anions such as NO3−, Cl−, SO42−, and HCO3− are ubiquitous in practical natural water and industrial wastewater, it is relevant to examine the adsorption preference of the adsorbent toward target arsenates from the viewpoint of practical application. Interference experiments were performed by adding high concentration coexisting anion species into 10 ppm of arsenate solutions. From the results shown in Table S3 (ESI†), the presence of 50 ppm of coexisting anions have a slight effect on the arsenate uptakes for both the MIL-100(Fe) and MIL-100(Al) adsorbent. Moreover, given the fact that low-level arsenate contaminated drinking water (with hundreds of micrograms per liter) is often encountered in real purification processes, the performance of an adsorbent at low concentrations is essential to evaluate its prospects for use in industrial applications. When 0.5 g L−1 of MIL-100(Al) adsorbent is added, arsenate solutions with initial As(V) concentrations ranging from 50 to 800 μg L−1 can be detoxicated to a level of below 50 μg L−1 (Fig. S4a, ESI†). For the MIL-100(Fe) adsorbent, arsenate solutions with initial As(V) concentrations ranging from 50 to 600 μg L−1 can be detoxicated to the drinking water standard of the World Health Organization for arsenic (below 10 μg L−1) (Fig. S4b, ESI†). This definitely indicates that the adsorbents are effective in the removal of low levels of arsenates for practical application.
| Adsorbents | Adsorption capacity (mg g−1) | pH condition | Ref. |
|---|---|---|---|
| a Number of molecules adsorbed per metal site at saturation. | |||
| MIL-100(Fe) | 116 | 4–11 | This study |
| 0.51/metal sitea | |||
| MIL-100(Al) | 128 | 4–11 | This study |
| 0.52/metal sitea | |||
| Flower like iron oxide | 7.6 | 4 | 34 |
| Flower like α-Fe2O3 | 51 | 3 | 35 |
| Iron oxide composite | 74.91 | 3–10 | 36 |
| Goethite | 4.7 | 5 | 37 |
| α-FeOOH | 66.2 | — | 38 |
| α-Fe2O3 | 75.3 | — | 39 |
| Hierarchical porous Fe3O4 | 7.23 | 5 | 40 |
| MnFe2O4/CoFe2O4 | 90/74 | 3–10 | 41 |
| Maghemite nanoparticles | 50 | 3–9 | 42 |
| Cellulose@iron oxide | 32.11 | 2–9 | 43 |
| α-FeOOH hollow spheres | 58 | — | 44 |
| Graphene–Fe3O4 | 16 | Neutral | 45 |
| Magnetite–graphene | 5.83 | 4–10 | 46 |
| HBC–Fe3O4–MnO2 | 1.47 | 2–9 | 47 |
| Fe2O3@carbon | 17.9 | — | 48 |
| Iron–aluminium hydroxide | 49.6 | 3–11 | 49 |
| Aluminum oxide | 30.7 | 1.9–8.2 | 50 |
| Allophane | 27.14 | 6.5 | 51 |
| Com. activated alumina | 15.9 | 2.6–9.5 | 52 |
| Commercial Fe2O3 | 0.46 | 4 | 34 |
| Commercial maghemite | 16.7 | 3–9 | 42 |
The FT-IR spectra of the MOF particles after the adsorption process are shown in Fig. 2c and d. The emerging peaks at around 825 cm−1 and 868 cm−1 in the spectra can be assigned to the vibration of Fe–O–As(V) and Al–O–As(V), respectively. This observation confirms that the adsorption of arsenates is associated with the Fe/Al metal atom centers of the MOFs. In comparison with the reported Fe and Al-based materials listed in Table 1, the mesopores within the MOFs provide more interior space for the adsorption process, therefore the Fe/Al active sites can be utilized in a more effective way for the removal of arsenic.
Fig. 3c and d show the adsorption kinetics of MB in the MIL-100(Fe) and MIL-100(Al) adsorbents. 77% of the dissolved MB (10 mg L−1) was adsorbed in 5 minutes by MIL-100(Fe) and the removal efficiency reached 91% within 1 hour. Finally, 96% of MB was removed in 12 hours. In the case of MIL-100(Al), 84% of MB was removed in 5 minutes and 97% at 12 hours. The adsorption kinetics of RhB by MIL-100(Fe) and MIL-100(Al) were plotted and are shown in Fig. 3e and f. 72% of the RhB was adsorbed in 5 minutes, 91% in 1 hour and 99% in 6 hours by MIL-100(Fe) (Fig. 3e). The adsorption of RhB by MIL-100(Al) was not as quick as that of the iron trimesate. Only 34% of RhB was adsorbed within 24 hours. This can be ascribed to the poor affinity of aluminum trimesate to the RhB molecules. As for the CBB dye, the adsorption was extremely quick for both MIL-100(Fe) and MIL-100(Al). In 5 minutes, almost 100% of the organic molecules were removed (Fig. 3g and h). The elemental dispersion of the saturated adsorbed samples is shown in Fig. S5 and S6, ESI.† As can be observed, in addition to the homogeneously dispersed Fe/Al and O elements, the exotic arsenic element is evenly distributed within the MOF particles in the same manner. For the dye-adsorbed samples, digital photographs straightforwardly support the successful adsorption of these colored organics (Fig. S7, ESI†).
The structural changes of the MIL-100(Fe) and MIL-100(Al) frameworks are shown in Fig. 4a and b. As mentioned in our previous work,53 the capture of arsenates in a pore structure destroys the long-range order of ordered mesopores, leading to the disappearance of low angle diffraction peaks at 2° and 3.4°. Moreover, if arsenates are desorbed from the mesopores, this long-range order can be recovered, and the diffraction peaks that disappeared can emerge once again.53 On the one hand, metal–organic frameworks of MIL-100 have the crystallographic topology the same as that of the MTN-type zeolite; on the other hand, it also possesses the diffraction characteristics of long-range ordered mesopore materials, such as the MCM series54,55 and SBA series mesoporous materials.56–58 In Fig. 4a and b, the two strong diffraction peaks at 2° and 3.4° were found to be weakened for the MOF materials after adsorption. This proves the entrance of guest molecules into the uniform mesopores and the breaking of the long-range order. When arsenates are desorbed out under acidic conditions, the structures are partly recovered, and the corresponding diffraction peaks appear once again. Nevertheless, the short-range order remains almost intact during the adsorption process. This is much different from what is observed in the adsorption processes of small sized gas molecules.59 Gas molecules are not large enough to occupy the empty mesopores. Most of them are adsorbed onto the pore walls of the mesopores at ambient temperature and pressure. This is not sufficient to change the long-range order of these ordered mesopores. By contrast, when molecules with a large size fill most of the mesopores, the non-uniform dispersion and the decrease of the mesoporous pore volume leads to changes in the long-range order.
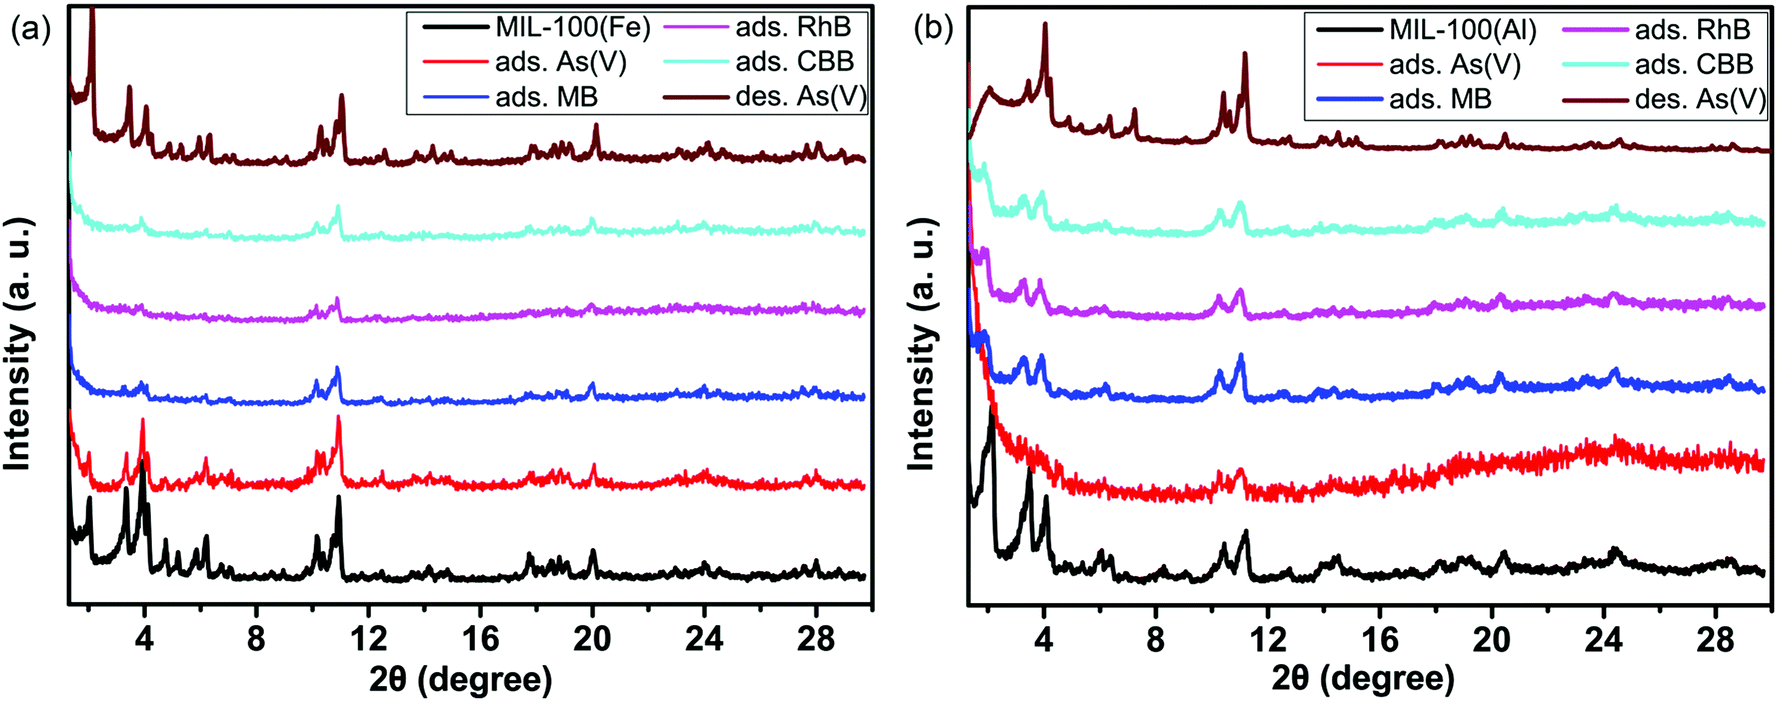 | ||
| Fig. 4 (a) The variation in the PXRD patterns of MIL-100(Fe) with saturated adsorption in 100 ppm HAsO42−, MB, RhB and CBB solutions, (b) the changes in the PXRD patterns of MIL-100(Al) with saturated adsorption in 50 ppm HAsO42−, MB, RhB and CBB solutions. | ||
The incorporation of guest molecules into the MOFs is illustrated in Fig. 5.53 Three terminal sites of the iron/aluminum trimers are occupied by two H2O molecules and one OH− anion (or fluorine), respectively.60,61 The two terminal water molecules in the trimers are removable as revealed by the thermogravimetric analysis (Fig. S8, ESI†) and IR spectroscopic studies in the literature.60 This observation means that external molecules may substitute the H2O molecules to coordinate with Fe(III) and Al(III) when stronger interactions exist between the metal sites and external compounds such as the arsenates, MB, RhB and CBB in this study. In order to analyze the effects of the entrance of other guest molecules, the Fe 3p and Al 2p X-ray photoelectron spectra were recorded and are shown in Fig. 6a and b (while the full-range XPS spectra and corresponding elemental content analysis are given in Fig. S9 and Table S4, ESI†). Fe is mainly coordinated by O in the primary trimesate (secondary building units). It was found that the Fe 3p peak distinctly moved to a lower binding energy after adsorbing the organic dyes with N/S heterocycles (Table 2). This can be ascribed to the interaction between the Fe central ions and the N/S ligand atoms. The Fe 3p binding energy change was not detected for the arsenate adsorbed sample, this may be due to the fact that the Fe–O–As interaction is not as strong as that between the Fe and N/S ligand atoms. For the Al 2p peaks, changes in the binding energy were also observed. The peaks of Al 2p slightly move to a higher binding energy after adsorbing arsenate, RhB and CBB (Table 2). These shifts are also caused by the interaction of external guest molecules with coordinatively unsaturated aluminum sites. Because the electronic structure of Al(III) is very different from that of the transition metal Fe(III), the changes in the binding energy can be different, even though the same species of molecules are being adsorbed.
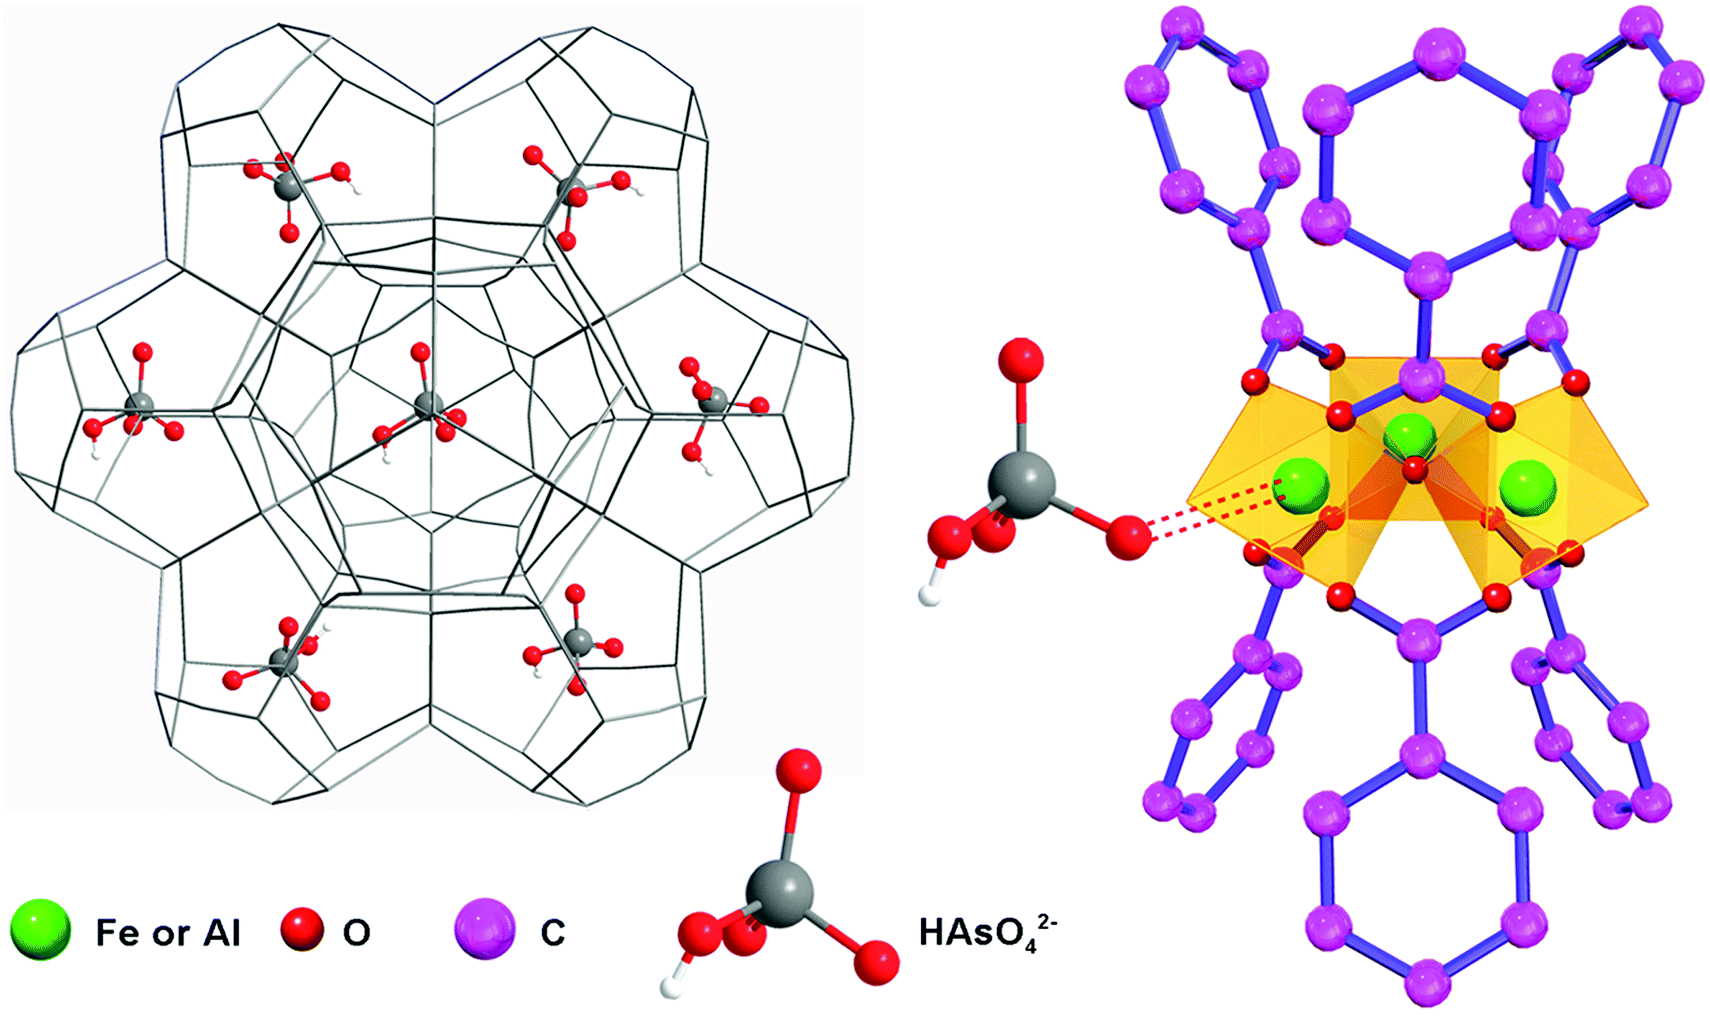 | ||
| Fig. 5 Schematic illustration of the adsorption mechanism of guest molecules (HAsO42− is demonstrated as an example) in the mesopores of MIL-100(Fe,Al). | ||
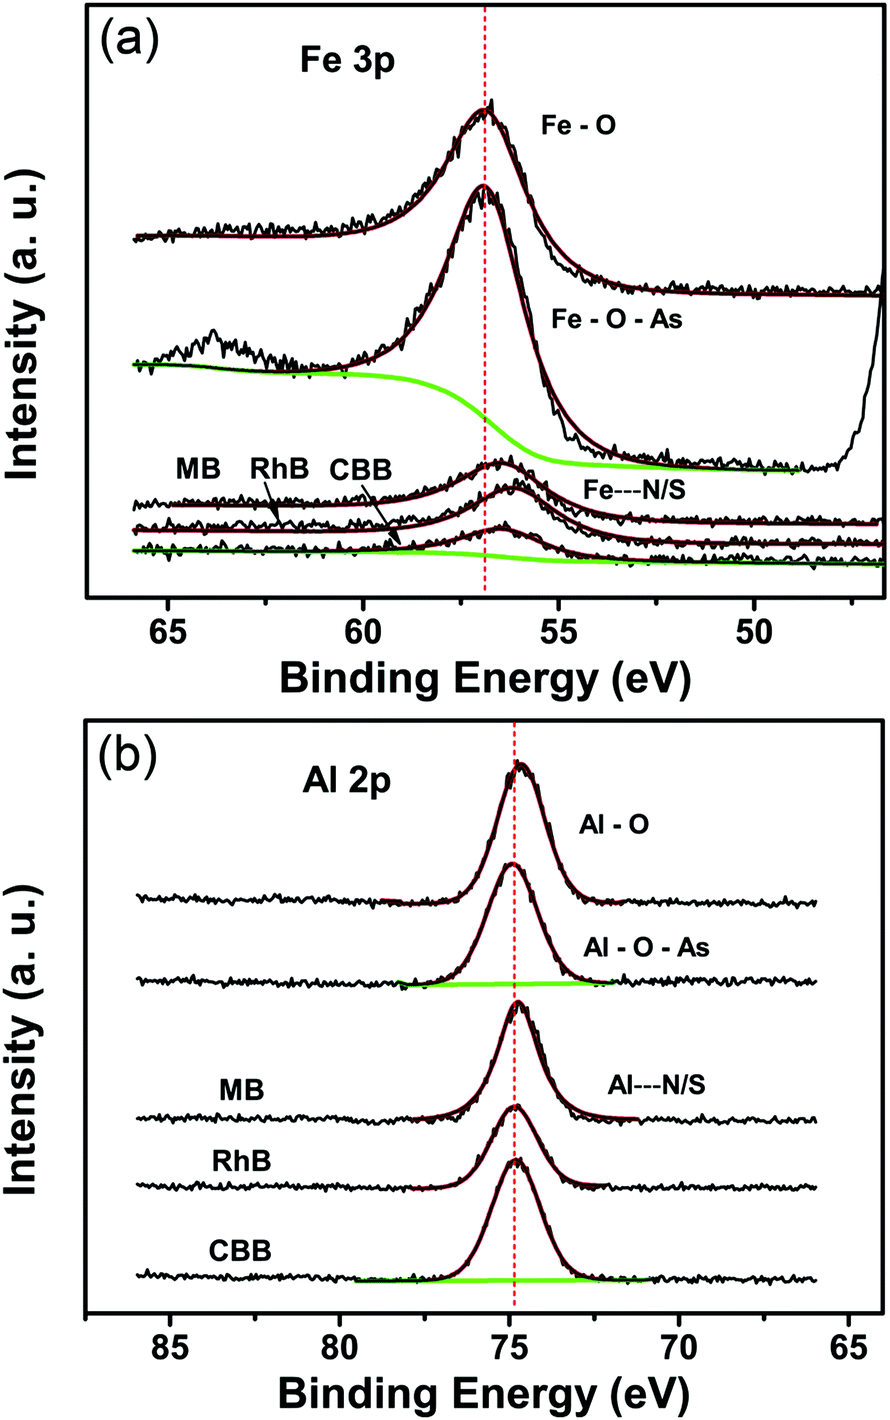 | ||
| Fig. 6 (a) X-ray photoelectron spectra (XPS) of Fe 3p for the initial MIL-100(Fe) and after the adsorption of HAsO42−, MB, RhB and CBB solutions. (b) XPS spectra of Al 2p for the initial MIL-100(Al) and after the adsorption of HAsO42−, MB, RhB and CBB solutions. | ||
| Binding energy | Fe 3p peak (eV) | Al 2p peak (eV) |
|---|---|---|
| MIL-100(Fe/Al) | 56.72 | 74.65 |
| MIL-100(Fe/Al)-As | 56.72 | 74.90 |
| MIL-100(Fe/Al)-MB | 56.52 | 74.65 |
| MIL-100(Fe/Al)-RhB | 56.27 | 74.74 |
| MIL-100(Fe/Al)-CBB | 56.57 | 74.82 |
During the structural changes, more information regarding the coordination and structure of Fe were also provided with the assistance of Mössbauer spectroscopy (Fig. S10, ESI†). The spectrum of MIL-100(Fe) consists of a set of different quadrupolar components, which are well-defined according to previous research.20,29 The basic building unit of MIL-100(Fe) is a trimer of μ3-oxo linked Fe(III) octahedra. So, three main types of Fe octahedral units were distinguished with quadrupole splittings 0.27 mm s−1, 0.59 mm s−1 and 0.77 mm s−1. Chemical shifts (δ) obtained from the spectrum indicate that high-spin states of Fe3+ ions exist. The values of the quadrupole splittings correspond to different degrees of distortion, with the highest value attributed to the Fe octahedron containing the fluoride anion. The spectra of the arsenate, MB, RhB, and CBB saturated samples show similar Fe signals to those of the un-adsorbed one. Three main types of peaks are distinguished, but with a larger quadrupole splitting of Fe2 (0.77 mm s−1, 0.78 mm s−1, 0.76 mm s−1, 0.76 mm s−1). It is recognized that the larger quadrupole splitting values indicate a larger asymmetrical electric field produced by an asymmetric electronic charge distribution or ligand arrangement.
Considering the coordinative interaction of the Fe site and guest molecules, it is speculated that this larger quadrupole splitting of Fe2 is induced by ligand replacement (e.g. arsenate, MB, RhB and CBB). The two other types of Fe unit environment show similar quadrupole splittings to those of their parent samples with little change, demonstrating that the guest ligands affect the environment of the Fe octahedral units in the same way that water molecules do.
Conclusions
In this work, highly porous MIL-100(Fe,Al) octahedra were synthesized and used as potential adsorbents for the oxyanion arsenates and organic dyes. The maximal adsorption capacities for HAsO42− were as high as 116 mg g−1 and 128 mg g−1 for MIL-100(Fe) and MIL-100(Al), respectively, values that are superior to those of most of the reported Fe and Al-based materials. Moreover, these frameworks also demonstrated a high affinity to organic contaminants, and about 80% of the organic molecules could be quickly adsorbed and removed in 10 ppm methylene blue, rhodamine B and Coomassie Brilliant Blue G-250 solutions. Electronic structure changes of metal ions were detected from X-ray photoelectron spectroscopy (XPS) peak shifts. This confirmed that the coordinative interaction between contaminant molecules to the unsaturated metal sites was the key factor for the high affinity. Different from traditional sorbents, the large interior space of the MOFs allowed the entrance of guest molecules. In turn, the presence of these guest molecules changed the long-range order of the uniform mesopores of the MOFs. Further studies are needed to explore the effects of the change in the long-range order on the stability of the MOFs. We hope that this work will give provide some inspiration for the design of MOFs for the adsorptive removal of aqueous contaminants.Conflicts of interest
There are no conflicts to declare.Acknowledgements
This work is supported by the National Basic Research Program (No. 2011CB933700) and the National Natural Science Foundation of China (No. 51778505, 21273006). The authors are grateful to Dr Jing Li for his kind suggestions and discussions.Notes and references
- H. Furukawa, K. E. Cordova, M. O’Keeffe and O. M. Yaghi, Science, 2013, 341, 1230444 CrossRef PubMed.
- H.-C. Zhou, J. R. Long and O. M. Yaghi, Chem. Rev., 2012, 112, 673–674 CrossRef PubMed.
- H. Deng, S. Grunder, K. E. Cordova, C. Valente, H. Furukawa, M. Hmadeh, F. Gándara, A. C. Whalley, Z. Liu, S. Asahina, H. Kazumori, M. O’Keeffe, O. Terasaki, J. F. Stoddart and O. M. Yaghi, Science, 2012, 336, 1018–1023 CrossRef PubMed.
- M. Eddaoudi, J. Kim, N. Rosi, D. Vodak, J. Wachter, M. O'Keeffe and O. M. Yaghi, Science, 2002, 295, 469–472 CrossRef PubMed.
- I. Ahmed and S. H. Jhung, J. Hazard. Mater., 2016, 301, 259–276 CrossRef PubMed.
- Z. Hasan and S. H. Jhung, J. Hazard. Mater., 2015, 283, 329–339 CrossRef PubMed.
- N. A. Khan, Z. Hasan and S. H. Jhung, J. Hazard. Mater., 2013, 244–245, 444–456 CrossRef PubMed.
- C. Wang, X. Liu, N. Keser Demir, J. P. Chen and K. Li, Chem. Soc. Rev., 2016, 45, 5107–5134 RSC.
- K. A. Cychosz and A. J. Matzger, Langmuir, 2010, 26, 17198–17202 CrossRef PubMed.
- Z. Hasan, J. Jeon and S. H. Jhung, J. Hazard. Mater., 2012, 209–210, 151–157 CrossRef PubMed.
- E. Haque, J. W. Jun and S. H. Jhung, J. Hazard. Mater., 2011, 185, 507–511 CrossRef PubMed.
- E. Haque, J. E. Lee, I. T. Jang, Y. K. Hwang, J.-S. Chang, J. Jegal and S. H. Jhung, J. Hazard. Mater., 2010, 181, 535–542 CrossRef PubMed.
- S.-H. Huo and X.-P. Yan, J. Mater. Chem., 2012, 22, 7449–7455 RSC.
- Y. Jia, Q. Jin, Y. Li, Y. Sun, J. Huo and X. Zhao, Anal. Methods, 2015, 7, 1463–1470 RSC.
- M. Maes, S. Schouteden, L. Alaerts, D. Depla and D. E. De Vos, Phys. Chem. Chem. Phys., 2011, 13, 5587–5589 RSC.
- F. Tan, M. Liu, K. Li, Y. Wang, J. Wang, X. Guo, G. Zhang and C. Song, Chem. Eng. J., 2015, 281, 360–367 CrossRef.
- C.-F. Zhang, L.-G. Qiu, F. Ke, Y.-J. Zhu, Y.-P. Yuan, G.-S. Xu and X. Jiang, J. Mater. Chem. A, 2013, 1, 14329–14334 Search PubMed.
- K. A. Cychosz, A. G. Wong-Foy and A. J. Matzger, J. Am. Chem. Soc., 2008, 130, 6938–6939 CrossRef PubMed.
- N. A. Khan and S. H. Jhung, Angew. Chem., Int. Ed., 2012, 51, 1198–1201 CrossRef PubMed.
- M. Maes, M. Trekels, M. Boulhout, S. Schouteden, F. Vermoortele, L. Alaerts, D. Heurtaux, Y.-K. Seo, Y. K. Hwang, J.-S. Chang, I. Beurroies, R. Denoyel, K. Temst, A. Vantomme, P. Horcajada, C. Serre and D. E. De Vos, Angew. Chem., Int. Ed., 2011, 50, 4210–4214 CrossRef PubMed.
- B. Van de Voorde, M. Boulhout, F. Vermoortele, P. Horcajada, D. Cunha, J. S. Lee, J.-S. Chang, E. Gibson, M. Daturi, J.-C. Lavalley, A. Vimont, I. Beurroies and D. E. De Vos, J. Am. Chem. Soc., 2013, 135, 9849–9856 CrossRef PubMed.
- C. O. Audu, H. G. T. Nguyen, C.-Y. Chang, M. J. Katz, L. Mao, O. K. Farha, J. T. Hupp and S. T. Nguyen, Chem. Sci., 2016, 7, 6492–6498 RSC.
- Y. Gu, D. Xie, Y. Ma, W. Qin, H. Zhang, G. Wang, Y. Zhang and H. Zhao, ACS Appl. Mater. Interfaces, 2017, 9, 32151–32160 Search PubMed.
- A. J. Howarth, M. J. Katz, T. C. Wang, A. E. Platero-Prats, K. W. Chapman, J. T. Hupp and O. K. Farha, J. Am. Chem. Soc., 2015, 137, 7488–7494 CrossRef PubMed.
- A. J. Howarth, Y. Liu, J. T. Hupp and O. K. Farha, CrystEngComm, 2015, 17, 7245–7253 RSC.
- C. Wang, X. Liu, J. P. Chen and K. Li, Sci. Rep., 2015, 5, 16613 CrossRef PubMed.
- A. Samokhvalov, Chem. – Eur. J., 2015, 21, 16726–16742 CrossRef PubMed.
- Y. K. Seo, J. W. Yoon, J. S. Lee, U. H. Lee, Y. K. Hwang, C. H. Jun, P. Horcajada, C. Serre and J. S. Chang, Microporous Mesoporous Mater., 2012, 157, 137–145 CrossRef.
- P. Horcajada, S. Surble, C. Serre, D.-Y. Hong, Y.-K. Seo, J.-S. Chang, J.-M. Greneche, I. Margiolaki and G. Ferey, Chem. Commun., 2007, 2820–2822 RSC.
- N. A. Khan, J. S. Lee, J. Jeon, C.-H. Jun and S. H. Jhung, Microporous Mesoporous Mater., 2012, 152, 235–239 CrossRef.
- C. Volkringer, D. Popov, T. Loiseau, G. Ferey, M. Burghammer, C. Riekel, M. Haouas and F. Taulclle, Chem. Mater., 2009, 21, 5695–5697 CrossRef.
- G. Ferey, C. Serre, C. Mellot-Draznieks, F. Millange, S. Surble, J. Dutour and I. Margiolaki, Angew. Chem., Int. Ed., 2004, 43, 6296–6301 CrossRef PubMed.
- J. L. Schlenker, F. G. Dwyer, E. E. Jenkins, W. J. Rohrbaugh, G. T. Kokotailo and W. M. Meier, Nature, 1981, 294, 340–342 CrossRef.
- L. S. Zhong, J. S. Hu, H. P. Liang, A. M. Cao, W. G. Song and L. J. Wan, Adv. Mater., 2006, 18, 2426–2431 CrossRef.
- C.-Y. Cao, J. Qu, W.-S. Yan, J.-F. Zhu, Z.-Y. Wu and W.-G. Song, Langmuir, 2012, 28, 4573–4579 CrossRef PubMed.
- X. Yang, X. Wang, Y. Feng, G. Zhang, T. Wang, W. Song, C. Shu, L. Jiang and C. Wang, J. Mater. Chem. A, 2013, 1, 473–477 Search PubMed.
- P. Lakshmipathiraj, B. R. V. Narasimhan, S. Prabhakar and G. Bhaskar Raju, J. Hazard. Mater., 2006, 136, 281–287 CrossRef PubMed.
- H. Li, W. Li, Y. Zhang, T. Wang, B. Wang, W. Xu, L. Jiang, W. Song, C. Shu and C. Wang, J. Mater. Chem., 2011, 21, 7878–7881 RSC.
- Z. Wei, R. Xing, X. Zhang, S. Liu, H. Yu and P. Li, ACS Appl. Mater. Interfaces, 2013, 5, 598–604 Search PubMed.
- T. Wang, L. Zhang, H. Wang, W. Yang, Y. Fu, W. Zhou, W. Yu, K. Xiang, Z. Su, S. Dai and L. Chai, ACS Appl. Mater. Interfaces, 2013, 5, 12449–12459 Search PubMed.
- S. Zhang, H. Niu, Y. Cai, X. Zhao and Y. Shi, Chem. Eng. J., 2010, 158, 599–607 CrossRef.
- T. Tuutijärvi, J. Lu, M. Sillanpää and G. Chen, J. Hazard. Mater., 2009, 166, 1415–1420 CrossRef PubMed.
- X. Yu, S. Tong, M. Ge, J. Zuo, C. Cao and W. Song, J. Mater. Chem. A, 2013, 1, 959–965 Search PubMed.
- B. Wang, H. Wu, L. Yu, R. Xu, T.-T. Lim and X. W. Lou, Adv. Mater., 2012, 24, 1111–1116 CrossRef PubMed.
- B. Paul, V. Parashar and A. Mishra, Environ. Sci.: Water Res. Technol., 2015, 1, 77–83 Search PubMed.
- V. Chandra, J. Park, Y. Chun, J. W. Lee, I.-C. Hwang and K. S. Kim, ACS Nano, 2010, 4, 3979–3986 CrossRef PubMed.
- J. Zhu, S. A. Baig, T. Sheng, Z. Lou, Z. Wang and X. Xu, J. Hazard. Mater., 2015, 286, 220–228 CrossRef PubMed.
- Z. Wu, W. Li, P. A. Webley and D. Zhao, Adv. Mater., 2012, 24, 485–491 CrossRef PubMed.
- P. Suresh Kumar, R. Q. Flores, C. Sjöstedt and L. Önnby, J. Hazard. Mater., 2016, 302, 166–174 CrossRef PubMed.
- F. Zha, W. Huang, J. Wang, Y. Chang, J. Ding and J. Ma, Chem. Eng. J., 2013, 215–216, 579–585 CrossRef.
- Y. Arai, D. L. Sparks and J. A. Davis, Environ. Sci. Technol., 2005, 39, 2537–2544 CrossRef PubMed.
- T.-F. Lin and J.-K. Wu, Water Res., 2001, 35, 2049–2057 CrossRef PubMed.
- J. Cai, X. Wang, Y. Zhou, L. Jiang and C. Wang, Phys. Chem. Chem. Phys., 2016, 18, 10864–10867 RSC.
- J. S. Beck, J. C. Vartuli, W. J. Roth, M. E. Leonowicz, C. T. Kresge, K. D. Schmitt, C. T. W. Chu, D. H. Olson and E. W. Sheppard, J. Am. Chem. Soc., 1992, 114, 10834–10843 CrossRef.
- C. T. Kresge, M. E. Leonowicz, W. J. Roth, J. C. Vartuli and J. S. Beck, Nature, 1992, 359, 710–712 CrossRef.
- Q. Huo, R. Leon, P. M. Petroff and G. D. Stucky, Science, 1995, 268, 1324–1327 Search PubMed.
- Q. Huo, D. I. Margolese, U. Ciesla, P. Feng, T. E. Gier, P. Sieger, R. Leon, P. M. Petroff, F. Schuth and G. D. Stucky, Nature, 1994, 368, 317–321 CrossRef.
- D. Zhao, J. Feng, Q. Huo, N. Melosh, G. H. Fredrickson, B. F. Chmelka and G. D. Stucky, Science, 1998, 279, 548–552 CrossRef PubMed.
- H. Sung Cho, H. Deng, K. Miyasaka, Z. Dong, M. Cho, A. V. Neimark, J. Ku Kang, O. M. Yaghi and O. Terasaki, Nature, 2015, 527, 503–507 CrossRef PubMed.
- A. Vimont, J. M. Goupil, J. C. Lavalley, M. Daturi, S. Surble, C. Serre, F. Millange, G. Ferey and N. Audebrand, J. Am. Chem. Soc., 2006, 128, 3218–3227 CrossRef PubMed.
- J. W. Yoon, Y. K. Seo, Y. K. Hwang, J. S. Chang, H. Leclerc, S. Wuttke, P. Bazin, A. Vimont, M. Daturi and E. Bloch, Angew. Chem., Int. Ed., 2010, 49, 5949–5952 CrossRef PubMed.
Footnote |
| † Electronic supplementary information (ESI) available: Energy dispersive spectroscopy analysis, nitrogen adsorption–desorption isotherms, FT-IR, elemental dispersions of the TEM mapping images, TG, X-ray photoelectron spectroscopy (XPS) data, and Mössbauer spectra of MIL-100(Fe). See DOI: 10.1039/c8qm00002f |
| This journal is © the Partner Organisations 2018 |