Electron-transporting foldable alternating copolymers of perylenediimide and flexible macromolecular chains†
Tsuneaki
Sakurai
 *a,
Naomi
Orito
a,
Shusaku
Nagano
b,
Kenichi
Kato
c,
Masaki
Takata
c and
Shu
Seki
 *a
*a
aDepartment of Molecular Engineering, Graduate School of Engineering, Kyoto University, Nishikyo-ku, Kyoto 615-8510, Japan. E-mail: sakurai-t@moleng.kyoto-u.ac.jp; seki@moleng.kyoto-u.ac.jp
bNagoya University Venture Business Laboratory, Nagoya University, Furo-cho, Chikusa, Nagoya 464-8603, Japan
cMaterials Visualization Photon Science Group, RIKEN SPring-8 Center, 1-1-1 Kouto, Sayo, Hyogo, 679-5148, Japan
First published on 20th February 2018
Abstract
Tuning the electrical conductivity of conjugated macromolecules by nanostructure ordering plays a key role in developing carrier transporting materials applicable to flexible organic electronic devices. Alternating copolymers of perylene-3,4,9,10-tetracarboxylic acid diimide (PDI) and flexible macromonomers, poly(dimethylsiloxane) (PDMS), poly(ethylene glycol) (PEG), or poly(propylene glycol) (PPG), were synthesized via simple polycondensation reactions between 3,4,9,10-perylenetetracarboxylic dianhydride (PTCDA) and bis-amine-terminated corresponding macromonomers. Dynamic traces of absorption and fluorescence spectra of the series of alternating copolymers, with the indication of PDI chromophores, suggested the more foldable nature in tetrahydrofuran of the PDMS-based polymer than of the PEG- and PPG-based polymers. The folding capability of these polymers in solution was confirmed by fluorescence spectra and the absolute fluorescence quantum efficiency values. In the solid films, the condensed state of the polymers showed X-ray diffraction patterns of periodic structures, which depend on the type of macromolecular chains: PEG showed a highly crystallized state in contrast to the slightly crystalline PDI molecules in the PDMS and PPG-based polymers. Photoconductivity upon ultraviolet excitation has been screened by noncontact microwave measurements, and the mobility of electrons has also been characterized based on the kinetic traces of radical anions on the PDI chromophores. The negligible optical absorption observed from the PDMS-based polymers revealed the lowest photocarrier generation yield among the prepared polymers. The observed low conductivity for the PDMS-based, most foldable polymers possibly results from a lower photo-charge generation yield and thermal fluctuations of the flexible PDMS chains. The PEG-based polymer marked the largest electron mobility of 0.2 cm2 V−1 s−1, reflecting the highly crystalline nature of the PEG chains.
Introduction
Materials available for flexible electronics have attracted increasing attention in recent years, and polymer-based materials have played a key role in the devices.1–4 Flexible and solution-processable polymers for electronics are often composed of π-conjugated segments and flexible insulated chains, where the former relies on electrical conductivity and the latter secures flexibility and solubility. Among the explored polymer electronics, block copolymers containing π-conjugated molecules are interesting motifs because they are known to form micrometer–nanometer domains via self-assembly to afford directional charge transport properties.5,6 There, the flexible segments not only work as solubilizing parts but also allow nanostructure-directing functions. On the other hand, alternating polymers (oligomers) of π-conjugated molecules and insulated flexible chains (a kind of multi-block copolymer) have not been fully explored toward organic electronics, though they have the potential to construct one- or two-dimensional arrays of π-electronic systems via intrapolymer folding7 and/or interpolymer π–π interactions. Flexible, and even elastic characters would be added to those alternating copolymers if the entropic spring of macromolecular chains was utilized.Liquid crystal polymers8 are a representative class of such rigid–flexible alternating copolymers that has been studied before. In its early stage, mesogenic behaviors and the nanostructure of mesogens and linkers were studied, where the mesogenic parts were mostly composed of phenylene- or oligophenylene- based molecular units while alkyl or oligo(ethylene glycol) (OEG) chains were used as flexible linkers.9–13 Then, molecular arrangements or supramolecular structures of rigid–flexible alternating copolymers attracted attention for tuning of their photophysical properties.14 For example, photoluminescence and electroluminescence were realized for rod–coil copolymers from oligo(p-phenylene vinylene)s and alkyl chains.15–18 Although the structural information in their solid states is still difficult to clarify, material application as a solid-state emitter was clearly demonstrated.
From the viewpoint of solution-state assembly, rigid–flexible polymers (oligomers) have been studied within the concept of a “foldamer”. A foldamer is initially defined as “any polymer with a strong tendency to adopt a specific, compact conformation”,19,20 which features hydrogen bonding-assisted helical or sheet-like folding behaviors that mimic biomacromolecules like proteins. Afterwards, another definition was proposed: “Any oligomer that folds into a conformationally ordered state in solution, the structures of which are stabilized by a collection of noncovalent interactions between nonadjacent monomer units”,21,22 highlighting that the cooperative interactions include various interactions such as π–π and hydrophobic ones. Recently, other types of folding polymers have been broadly interpreted as foldamers. Multi-block copolymers of π-conjugated rods and hydrophilic chains were utilized for biomimetic applications in their folded forms.23,24 Another interesting feature in recent reports is the integration into two-dimensional nanosheets from the pre-organized folded crystallization assembly of rigid–flexible alternating polymers/oligomers in solution.25–27 Namely, the macroscopic assembly of foldable polymers25–28 provides the potential for soft materials to be used in their solid-state.
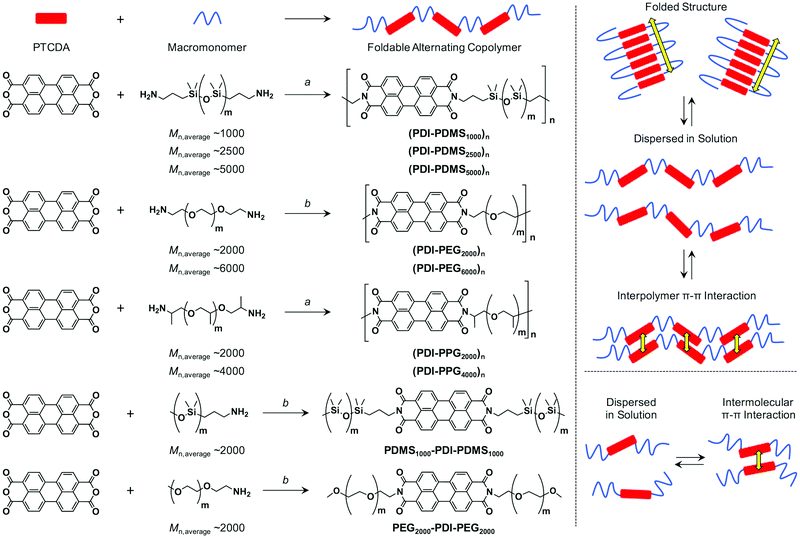
Based on the above background, we have started to evaluate the intrinsic charge carrier transport property of foldamer systems. Foldable polyurethanes carrying naphthalene diimides as side groups29 and thiophene nanosheets from alternating co-oligomers of bithiophene and oligo(ethyleneglycol) units30 were previously studied by the flash-photolysis time-resolved microwave conductivity (FP-TRMC) technique, a contactless microwave-based evaluation method of photo-generated charge carriers.31–33 In the present work, our attention is given to the characterization of charge transport properties of simple rod–coil foldamer systems. Perylene-3,4,9,10-tetracarboxylic acid diimide (PDI) was chosen as a rod-shaped π-system because PDI is known to show strong π–π interactions.34 Most of the reported foldamers employ hydrogen bonds or crystallization of aromatic segments without strong π–π interactions. Main-chain liquid crystals also usually involve mesogens that cannot stack on each other in a solution state. We consider that strong π–π interactions of PDIs would result in the folded assembly in solution when PDIs are linked with flexible macromolecular chains. The cast films from these assemblies will eventually provide electron transport pathways. So far, alternating copolymers35–38 and co-oligomers39–42 of a PDI derivative and flexible chain were reported by several groups. No obvious folding behavior was confirmed in solution for those of PDI and macromonomers,35–38 while folding behaviors of the above discrete oligomers were investigated in detail.39–42 However, none of them focused on their semiconducting and photoconductive properties. Here, we chose amine-terminated poly(dimethylsiloxane) (PDMS), poly(ethylene glycol) (PEG) and poly(propylene glycol) (PPG) as flexible macromonomer chains, and conjugated them with 3,4,9,10-perylenetetracarboxylic dianhydride via polycondensation reactions (Scheme 1). The resulting PDI–flexible chain multi-block copolymers were studied in solution and film states. We revealed that folding behaviors in solution were drastically changed depending on the type of linker chain. In solid films, the intrinsic electron mobility along stacked PDI units, estimated by the FP-TRMC technique, was found to reach up to 0.2 cm2 V−1 s−1.
Experimental
Materials
3,4,9,10-Perylenetetracarboxylic dianhydride (PTCDA) and quinoline were purchased from Tokyo Chemical Industry Co. Tetrahydrofuran (THF), chloroform (CHCl3), and Zn(OAc)2 were purchased from Wako Pure Chemical Industries. Poly(dimethylsiloxane), bis(3-aminopropyl) terminated (average Mn ∼ 2![[thin space (1/6-em)]](https://www.rsc.org/images/entities/char_2009.gif) 500), poly(propylene glycol)bis(2-aminopropyl ether) (average Mn ∼ 2000 and 4000), poly(ethylene glycol)diamine (average Mn ∼ 2000 and 6000), and methoxy poly(ethylene glycol)amine (average Mn ∼ 2000, extent of labelling: >0.4 mmol g−1 NH2 loading) were purchased from Sigma-Aldrich. Aminopropyl terminated polydimethylsiloxane (average Mn ∼ 1000 and 5000) and monoaminopropyl terminated poly(dimethylsiloxane) (average Mn ∼ 2000) were purchased from Gelest.
500), poly(propylene glycol)bis(2-aminopropyl ether) (average Mn ∼ 2000 and 4000), poly(ethylene glycol)diamine (average Mn ∼ 2000 and 6000), and methoxy poly(ethylene glycol)amine (average Mn ∼ 2000, extent of labelling: >0.4 mmol g−1 NH2 loading) were purchased from Sigma-Aldrich. Aminopropyl terminated polydimethylsiloxane (average Mn ∼ 1000 and 5000) and monoaminopropyl terminated poly(dimethylsiloxane) (average Mn ∼ 2000) were purchased from Gelest.
Measurements and methods
Molecular weights of polymers were determined by size exclusion chromatography (SEC) with polystyrene standards. SEC analysis was performed on HITACHI model L-2130, L-2455, L-2530 chromatography instruments with Shodex KF-804L/KF-805L columns using THF as an eluent at a flow rate of 1 mL min−1 at 40 °C. A refractive index detector and multi-wavelength photodiode array detector were used for detecting the elution peaks. Polymerization progress was confirmed by the analytical SEC at 520 nm absorption after 24 h of reaction. The crude polymers were purified by recycling preparative HPLC on a Japan Analytical Industry Co. model LC-9210NEXT equipped with JAIGEL-2.5HH/-3HH columns. Electronic absorption spectra were recorded on a JASCO model V-570 UV/VIS/NIR spectrophotometer. The variable-temperature measurements were carried out using a screw-cap quartz cuvette. Photoluminescence spectra were recorded on a HITACHI model F-2700 spectrofluorometer. Absolute photoluminescence quantum yield was evaluated on a Hamamatsu model Quantaurus-QY absolute PL quantum yield measurement system. Dynamic light scattering was measured on a Malvern model Zetasizer system. Powder X-ray diffraction measurements were carried out using a synchrotron radiation X-ray beam with a wavelength of 0.108 nm on BL44B243 at the Super Photon Ring (SPring-8, Hyogo, Japan). A large Debye–Scherrer camera was used in conjunction with an imaging plate as a detector, and all diffraction patterns were recorded with a 0.01° step in 2θ. During the measurements, samples were put into a 0.5 mm thick glass capillary and rotated to obtain a homogeneous diffraction pattern. The exposure time to the X-ray beam was 1.5 min. Grazing-incidence X-ray scattering (GIXS) measurements for the cast films were performed using a Rigaku FR-E X-ray diffractometer with a Rigaku model R-AXIS IV 2D detector.44 Cu Kα radiation (λ = 0.1542 nm) with a beam size of approximately 300 μm × 300 μm was used for the X-ray beams, while the camera length was set at 300 mm. The sample stage was composed of a goniometer and vertical stage (CHUO Precision Industria ATS-C316-EM/ALV-300-HM). Flash-photolysis time-resolved microwave conductivity (FP-TRMC) measurements were carried out at 25 °C in air with a resonant cavity. The resonant frequency and power of the microwave probes were 9.1 GHz and 3 mW, respectively. Charge carriers were photo-injected into the sample upon exposure to a third harmonic generation (λ = 355 nm) of a Spectra Physics model INDI-HG Nd:YAG laser with a pulse duration of 5–8 ns. The photon density of the 355 nm laser pulse was 9.1 × 10¹⁵ photons cm−2. The TRMC signal picked up by a diode (rise time < 1 ns) was monitored by a Tektronics model TDS3052B digital oscilloscope. The observed conductivities, given by the photocarrier generation yield (ϕ) multiplied by the sum of charge carrier mobilities (∑μ), were normalized according to the equation; | (1) |
 | (2) |
Synthesis of alternating copolymers and reference polymers
![[thin space (1/6-em)]](https://www.rsc.org/images/entities/char_2009.gif) 000) and PTCDA were polymerized and purified. Mn = 12 × 103 g mol−1, Mw = 23 × 103 g mol−1, polydispersity index: Đ = 1.8.
000) and PTCDA were polymerized and purified. Mn = 12 × 103 g mol−1, Mw = 23 × 103 g mol−1, polydispersity index: Đ = 1.8.
Results and discussion
Design of rod–coil foldable alternating copolymers
The driving force of the folding event for a polymer has been well discussed and rationalized in terms of the loss of the conformational entropy in the folded state with its much larger conformational ensemble and the enthalpic gains.22 In other words, folding requires less reduction in entropy than the process of intermolecular self-assembly, and thus folding is favoured in solution interpreted by the second law of thermodynamics. The enthalpic gain is mainly given by the π–π interactions for π-conjugated units, which motivated us to use PDI molecules capable of strong association capability. The enthalpic gains on folding and interpolymer interaction between two PDI units should be almost identical (ΔHfold ∼ ΔHself-assembly < 0) because the stacking geometry of two PDI units should be the same. However, the entropic changes on folding and interpolymer self-assembly are quite different. According to a simple model,41 we can conclude that the entropic loss is larger for interpolymer self-assembly (ΔSfold < ΔSself-assembly < 0). Therefore, a folding process is much favored compared with interpolymer self-assembly. If the enthalpic gain exceeds entropic loss at that temperature, folding must take place. As introduced above, PDI units were previously incorporated in rod (PDI)–coil (flexible macromolecular chains) alternating polymers but distinguished folding behaviors in solution were not observed for these polymers.35–38 It is assumed that the used polymeric linkers such as poly(tetrahydrofuran) do not have high enough flexibility for the small entropic losses. On the other hand, Li et al. found that PDI–oligo(ethylene glycol) (OEG) oligomers fold in solution,39–42 which indicates that the short and flexible linker of OEG helps the folded structure to be stable at the temperature and concentration. Again, none of these examples addressed the charge transport property given by stacked PDI arrays.Aiming for compatibility of simple synthesis and facile film fabrication capability, a condensation reaction between 3,4,9,10-perylenetetracarboxylic dianhydride (PTCDA) and an amine-terminated flexible macromonomer was employed to form an imide bond, which constructs the main chains for these polymers (Scheme 1). In order to suppress the entropy loss, we chose highly flexible poly(dimethylsiloxane) (PDMS) chain as macromonomers.45–47 This flexibility relies on the long Si–O bond, as well as a small rotational barrier along Si–O–Si (∼3.3 kJ mol−1 around a Me2Si–O bond) and variability of its bond angle.48 In addition, poly(ethylene glycol) (PEG) and poly(propylene glycol) (PPG) were also studied, taking into account their more flexible nature than long alkyl and poly(tetrahydrofuran) chains due to the high content of C–O–C bonds with similar character49 to the Si–O–Si bond.
Synthesis of foldable alternating copolymers
According to the Experimental section, PTCDA and amine-terminated macromonomers (7 types: Scheme 1) were polymerized at 200 °C in molten imidazole or a quinoline solution of imidazole and Zn(OAc)2, both of which are typically used for the conversion from PTCDA to a PDI derivative.34 Since amine-terminated PDMSs and PPGs are liquid or fluidic even at room temperature, the polymerization was carried out in molten imidazole. In the case with amine-terminated PEGs, the macromonomers are solid and thus the reactions were carried out in quinoline solution. After polymerization for 24 h, imidazole and Zn(OAc)2 were removed from the mixtures, which were eventually purified by preparative size-exclusion chromatography (SEC) using crosslinked polystyrene beads, where the high-molecular weight fraction was collected as CHCl3 solutions. The molecular weight was estimated by analytical SEC using THF as an eluent with polystyrene standards. As discussed later, some of the obtained alternating copolymers are considered to be folded in THF. In that sense, the absolute values of number-average molecular weight (Mn) and weight-average molecular weight (Mw) with respect to polystyrene standards cannot be simply used for determining the degree of polymerization (n). However, the analytical SEC results summarized in Table 1 suggested that PEG-based foldamers have small molecular weights while those with PDMS or PPG were much more elongated. This fact can be understood because the initial PEG macromonomers are not fluidic but solid and their solubility is not good, resulting in the faster precipitation during polymerization reactions even though quinoline solvent was added. Moreover, the theoretically preferred molar ratios of PTCDA and macromonomers are 1![[thin space (1/6-em)]](https://www.rsc.org/images/entities/char_2009.gif) :
:![[thin space (1/6-em)]](https://www.rsc.org/images/entities/char_2009.gif) 1 for copolymers and 1
1 for copolymers and 1![[thin space (1/6-em)]](https://www.rsc.org/images/entities/char_2009.gif) :
:![[thin space (1/6-em)]](https://www.rsc.org/images/entities/char_2009.gif) 2 for reference macromonomers. However, we found that a larger amount of PTCDA (e.g. 5 eq. to the macromonomer) resulted in the observation of higher molecular-weight polymers in analytical SEC. Thus, we chose the reaction conditions as described in Table 1. In fact, PTCDA cannot be completely soluble in quinoline or molten imidazole, which may be the reason for the unbalanced molar ratios affording relatively high molecular weight polymers.
2 for reference macromonomers. However, we found that a larger amount of PTCDA (e.g. 5 eq. to the macromonomer) resulted in the observation of higher molecular-weight polymers in analytical SEC. Thus, we chose the reaction conditions as described in Table 1. In fact, PTCDA cannot be completely soluble in quinoline or molten imidazole, which may be the reason for the unbalanced molar ratios affording relatively high molecular weight polymers.
| Entry | Reaction conditiona | Monomer ratiob | M n/g mol−1 | M w/g mol−1 | Đ |
|---|---|---|---|---|---|
| a See synthesis in Experimental section. b Molar ratio of the PTCDA/macromonomer. | |||||
| (PDI–PDMS1000)n | A | 5 | 44 × 103 | 82 × 103 | 1.9 |
| (PDI–PDMS2500)n | A | 5 | 54 × 103 | 88 × 103 | 1.6 |
| (PDI–PDMS5000)n | A | 5 | 25 × 103 | 74 × 103 | 3.0 |
| (PDI–PEG2000)n | B | 1 | 7.0 × 10³ | 8.0 × 10³ | 1.1 |
| (PDI–PEG6000)n | B | 8 | 8.0 × 10³ | 12 × 103 | 1.6 |
| (PDI–PPG2000)n | A | 8 | 32 × 103 | 56 × 103 | 1.7 |
| (PDI–PPG4000)n | A | 8 | 12 × 103 | 23 × 103 | 1.8 |
| PDMS2000–PDI–PDMS2000 | C | 0.5 | 1 × 10³ | 1.4 × 10³ | 1.4 |
| PEG2000–PDI–PEG2000 | C | 0.5 | 4.8 × 10³ | 5.4 × 10³ | 1.1 |
Folding behaviors in solution
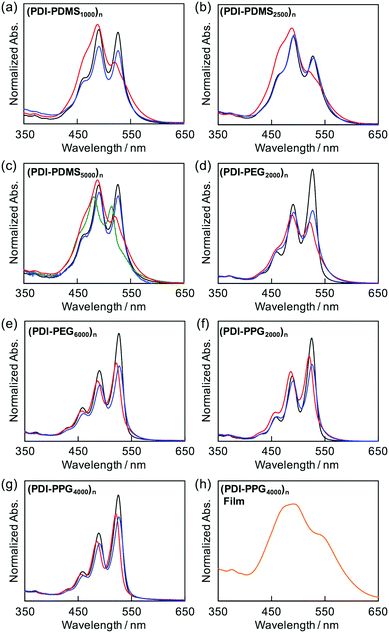
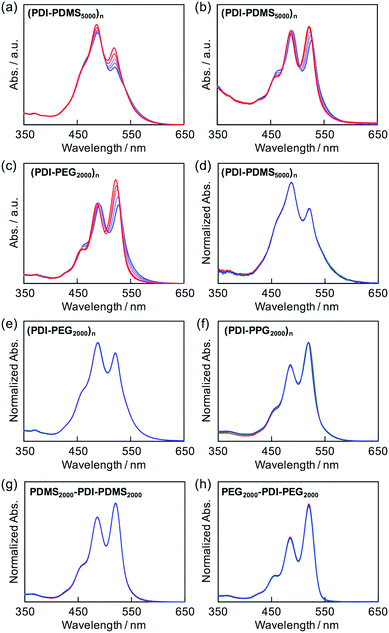
The folding behaviors of the prepared polymers were primarily monitored by absorption spectra of PDI chromophores as a probe in solution.41,42 It is known that PDI-based cyclophanes50,51 and folded39–42/self-assembled52,53 PDI chromophores with H-aggregation mode54 have an inverse intensity distribution among their vibronic states, A0→0/A0→1 < 1, whereas dissociated PDI molecules have usual Franck–Condon progressions with A0→0/A0→1 ∼ 1.6.55 Therefore, the absorption ratio of the 0 → 0 (ca. 530 nm) to 0 → 1 (ca. 490 nm) transitions can be used, as long as no concentration dependence is observed, to briefly quantify the degree of folding in the PDI-containing polymers. This remarkable intensity reversal originates from the strong electron–phonon coupling in PDI dimers as the absorption maximum blue shifts by ca. 0.17 eV from the 0 → 0 transition to the 0 → 1 transition. As discussed previously,41,42 the relative intensities of the vibronic bands for PDI molecules are dominated by the Franck–Condon factors. The intensity reversal indicates that the optimum overlap has shifted from (0 → 0, 〈χv=0′|χv=0〉) in free monomers to (0 → 1, 〈χv=1′|χv=0〉) in the π-staked structures, where χ and χ′ are the ground- and excited-state vibronic wave functions, respectively. The strong electron–phonon coupling indicates that the PDI molecules adopt a largely eclipsed H-stacking structure with π–π distances less than the van der Waals contact to establish quantum interactions of π-orbital overlaps.As shown in Fig. 1, (PDI–PDMS1000)n and (PDI–PDMS2500)n in THF exhibited inverse intensity distributions of A0→0/A0→1(α) = 0.62 and 0.59, respectively. These values are quite small, which is indicative of strong π–π interactions among the PDI chromophores. In contrast, CHCl3 and toluene solutions of these polymers showed different spectral patterns. (PDI–PDMS1000)n in CHCl3 and toluene yielded the α values of 0.97 and 0.95, respectively, which were obviously larger than that in THF. For (PDI–PDMS2500)n, the α values are still lower than 1; 0.78 in CHCl3 and 0.74 in toluene. (PDI–PDMS5000)n has higher solubility than the above two polymers most likely because it has relatively large PDMS segments, leading to the fact that it was soluble even in hexane (α = 0.89). However, still, THF was found to be the most effective solvent to induce π–π interactions among PDI chromophores in solution (Fig. 1c), where the α value was calculated to be 0.62. Then, other polymers were investigated in the same manner. (PDI–PEG2000)n showed an inverse intensity distribution with A0→0/A0→1(α) = 0.90 in THF, while the spectral shape indicated the presence of completely dissociated PDI chromophores in CHCl3 (Fig. 1d). By changing the average Mn of PEG chains from 2000 to 6000, the spectral patterns in THF and toluene represent normal intensity distributions (Fig. 1e). Namely, chain length is an important parameter for the folding event, as initially expected due to entropic factors. For the PPG-based copolymers, both (PDI–PPG2000)n and (PDI–PPG4000)n in all three solvents displayed absorption spectra with a normal intensity distribution (Fig. 1f and g). This might be due to hampering by the branched methyl groups of propylene glycol chains next to the nitrogen atoms of imide groups (Scheme 1),56,57 leading to the suppression of the folding behaviour. To address the quantitative contribution from entropy loss in the folding behaviour, temperature-dependent absorption spectra were measured for representative foldable polymers, (PDI–PDMS5000)n and (PDI–PEG2000)n, as shown in Fig. 2a–c.58 Partial dissociation of PDI stacks in the folded state was clearly observed both in THF (Fig. 2a) and toluene (Fig. 2b), whereas there is only a little change in good solvent at the same concentration (Fig. S1, ESI†). It should be noted that the dissociation was observed in the identical temperature range despite the different solvation enthalpies between THF and toluene, suggesting the dissociation behavior originates primarily from the entropy gain in PDMS chains. A similar tendency was confirmed for (PDI–PEG2000)n in toluene (Fig. 2c). Based on the absorption intensity plots at different wavelengths (Fig. S2, ESI†), it can be concluded that the observed temperature dependence was different from a simple association/dissociation model often used for PDI compounds52,53 and reflected more complicated processes. However, the fact that the α values became larger upon heating suggests the progression of the dissociation. Importantly, the absorption spectra were independent of the concentration of polymers in these solvents at 10−6–10−4 M (Fig. 2d–f). According to the association constants of PDIs in solutions usually falling in the range around 102–103 M−1,57 concentration-dependent stacking behaviours should appear at these concentration ranges. However, in the present case, the spectral patterns in THF explicitly indicate PDI–PDI interactions even in the highly-diluted solutions (monomer-unit concentration: 10−6 M), and thus all the spectral changes in Fig. 1 primarily relate to folding/unfolding events of isolated macromolecular chains containing interactions among multi-PDI chromophores.
The folding capability of the (PDI–PDMSm)n series and (PDI–PEG2000)n is also supported indirectly by the spectral changes observed in the reference macromonomer compounds of PDMS2000–PDI–PDMS2000 and PEG2000–PDI–PEG2000, as seen in Fig. 2g and h. Up to the concentration of 10−4 M, no characteristic spectral change was observed, indicating no concentration dependence of inter-PDI interactions. Moreover, the values of α for these compounds in THF were estimated to be 1.22 and 1.59, which correspond to normal intensity distributions between A0→0 and A0→1. Interconversion of the normal/inverse intensity distributions, depending on solvents, was specifically observed for the polymers. This suggests that the PDI aggregations take place only in the folded state of the polymers. It should be noted that dynamic light scattering measurements of polymers in solutions also suggested the dispersed, non-aggregated state of the polymers (Fig. S3, ESI†).
Relationship between folding and emission property
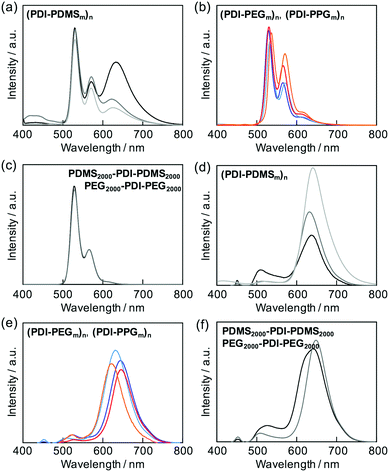
The stacking nature of PDIs in the folded states could also be investigated by fluorescence spectroscopy for all the prepared polymers. Most of the polymers exhibited fluorescence originating from a singlet excited state of isolated PDIs in the corresponding macromolecular chains (Fig. 3b). The two macromonomer compounds also followed this tendency (Fig. 3c). The only exceptional case was observed for the (PDI–PDMSm)n series, giving a clear structureless emission band at around 630 nm (Fig. 3a); a characteristic peak of excimer emission.34,59 The relative intensity of the emission bands depended on the flexible PDMS length; the shorter chains allowed effective formation of PDI aggregates in the excited state.In the condensed phases, all of the polymers showed almost complete suppression of emission from isolated PDI molecules, and the emission was converted into that of excimers (Fig. 3d–f). This implies that the flexible chains of PDMS, PEG, and PPG are not able to completely hamper aggregations among PDIs, and the excited energy relaxation occurs via intermolecular energy transfer among PDIs in the solid state.
Aggregation-induced quenching of excited energies on PDI molecules can be discussed quantitatively by the emission quantum efficiency, as summarized in Table 2. The quantum efficiency of a reference macromonomer, PEG2000–PDI–PEG2000, reached Φ = 0.76 in THF, which almost corresponds to the efficiency from free PDI molecules in nonpolar solvents.34,57,60 However, the value considerably drops down to Φ = 0.48 for the other reference macromonomer, PDMS2000–PDI–PDMS2000. This is most likely due to the vibrational coupling between PDI cores and PDMS chains with much higher flexibility at room temperature, providing non-radiative pathways of excited energy dissipation. In contrast to the high quantum efficiencies of the above reference compounds, the values were obviously lower in the polymers, particularly in the ones with the shorter flexible chains. PDMS-based copolymers were revealed to show especially low quantum yields, which is consistent not only with their excimer formation capability (Fig. 3a) but also with their effective aggregation tendency in THF (Fig. 1a–c). The interesting relationship is the positive correlation between the values of Φ and α (Fig. 4). Both absorption and fluorescence spectral studies disclosed the validity of the alternating copolymer design with large π-conjugated cores and flexible macromolecular chains. Based on the reported glass transition temperature Tg of PDMS (∼−120 °C),61 PEG (∼−60 °C),62 PPG (∼−70 °C)63 chains with sufficient molecular weights, the most flexible nature of the PDMS chains is reasonable and it accounts for the relatively-favored folding structures from the viewpoint of entropy. Although the Tg of PPG is the second-lowest, the stacking of PDI units may be restricted by the branched methyl groups of propylene units,56,57 resulting in the unfolded behaviour. PEG-based copolymers serve as a foldamer depending on the PEG linker length that plays an important role in the entropy term.
| Entry | Φ | A 0→0/A0→1 |
|---|---|---|
| (PDI–POMS2500)n | 0.23 | 0.59 |
| (PDI–PDMS5000)n | 0.30 | 0.65 |
| (PDI–PEG2000)n | 0.32 | 0.89 |
| (PDI–PEG6000)n | 0.59 | 1.30 |
| (PDI–PPG2000)n | 0.38 | 1.22 |
| (PDI–PPG4000)n | 0.52 | 1.36 |
| PDMS2000–PDI–PDMS2000 | 0.48 | 1.22 |
| PEG2000–PDI–PEG2000 | 0.76 | 1.59 |
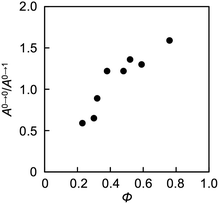 | ||
| Fig. 4 Plots of absolute quantum efficiency Φ and the ratio of absorption intensity A0→0/A0→1 (=α) of PDI chromophores in THF. Φ and α values are extracted from Table 2. | ||
Self-organized behaviors in solid states
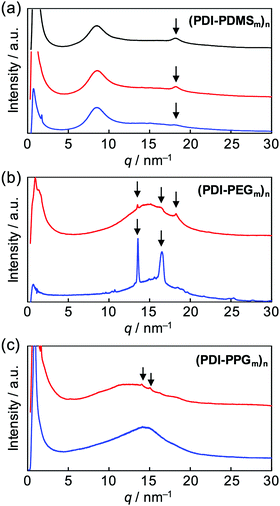
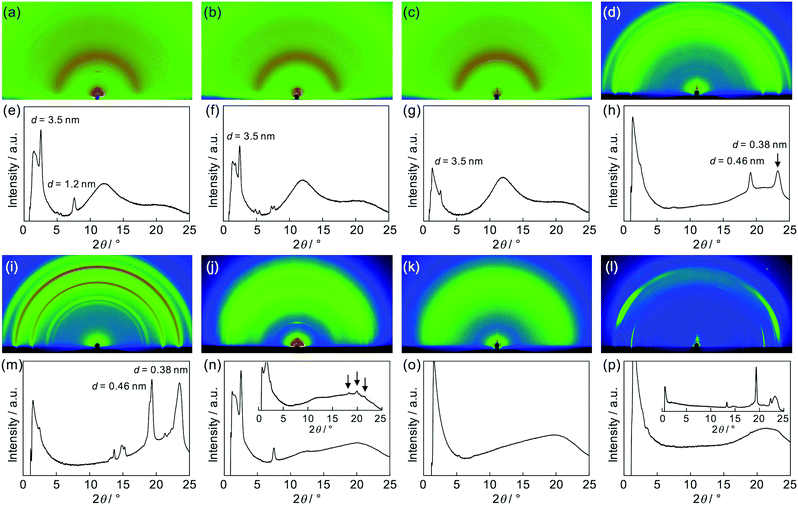
After the confirmation of the folding behaviours in solution, self-assembly of these polymers in solid states was investigated. Differential scanning calorimetry traces, exemplified for (PDI–PDMS5000)n (Fig. S4, ESI†), indicated no remarkable phase transition from −50 to 300 °C. Then, X-ray diffraction (XRD) analysis at room temperature was attempted. Powder XRD measurements for non-oriented samples were carried out and one-dimensional diffraction patterns were obtained, as shown in Fig. 5. The polymers of the (PDI–PDMSm)n series provided broad peaks at around q = 9 and 18 nm−1 (Fig. 5a). The former is derived from loose packings of PDMS chains while the latter may be PDI–PDI spacings. The spacing values of the latter peaks were calculated as d = 3.35 Å, corresponding to the inter-plane distance of stacking PDI systems.64(PDI–PEGm)n polymers showed one broad diffraction at ca. q = 15 nm−1 (Fig. 5b), which likely results from an amorphous halo of PEG chains. However, a set of sharp crystalline peaks (q ∼ 13–18 nm−1) was also observed for the PEG-based polymers, in particular for (PDI–PEG6000)n. Crystallization was more facilitated for longer PEG chains, whereas the peak at d = 3.42 Å was also observed for (PDI–PEG2000)n. For PPG-based polymers, only (PDI–PPG2000)n implied the presence of crystalline peaks (Fig. 5c). Considering the amorphous feature for the pattern of (PDI–PPG4000)n, the slight crystalline character may be related to the packing of PDI units. The pattern of (PDI–PPG2000)n contains a broad peak at d = 3.38 Å.Then, as can be seen in Fig. 6, grazing-incidence X-ray scattering (GIXS) two-dimensional images were obtained for the dropcast films of these polymers from THF solutions on a quartz substrate. Apparently, crystallization of PEG chains in the (PDI–PEG2000)n and (PDI–PEG6000)n films was characterized with particularly strong peaks at d = 0.38 and 0.46 nm (Fig. 6h and m). Meanwhile, the amorphous character of (PDI–PPG4000)n was again confirmed (Fig. 6o). For (PDI–PPG2000)n, anisotropic structural ordering was observed (Fig. 6n). While crystalline peaks appeared in the in-plane direction similar to its powder XRD pattern, two scattering peaks at d = 3.5 and 1.2 nm were observed in the out-of-plane direction. Although we cannot assign these peaks, it was found that similar peaks appeared for all the three (PDI–PDMSm)n films (Fig. 6e–g). Based on this fact, a certain long-range order was present for these films, where the periodicity was independent of chain length. We speculate that the packing of PDI molecules is the origin of these scattering peaks. However, the driving force of crystallization may be stronger when long PEG chains were utilized. Thus, crystalline PEG peaks were the dominant feature for the PEG-based polymers.
Intrinsic electron transport property in solid films: microwave-based conductivity evaluation and transient absorption spectroscopy
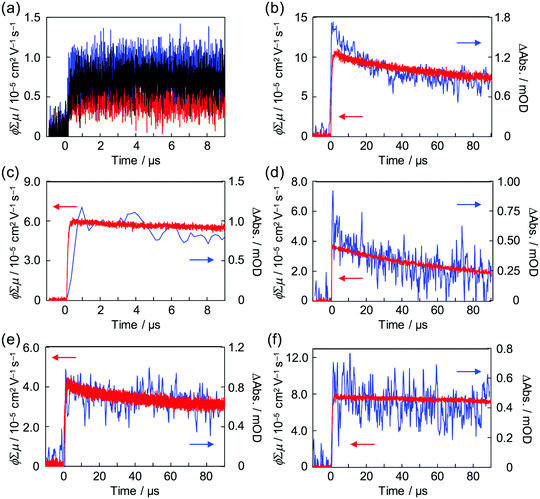
Strong steady state interaction between PDI chromophores was revealed in (PDI–PDMSm)n, while the long-range clear periodic structure was confirmed in (PDI–PEGm)n with almost identical inter-planer distances of 0.34 nm for electron delocalization over the columnar stacking axes.34,65 Local charge carrier motion has been assessed by combination of time-resolved microwave conductivity (TRMC) measurement and transient absorption spectroscopy (TAS)31,66,67 to address the question of which is more advantageous for charge carrier transport: stable inter-planer interaction in the steady state or long-range periodicity of π–π stacking with high crystallinity. Except for the (PDI–PDMSm)n copolymers, clear conductivity transients in TRMC were observed in the series of copolymers upon photo-irradiation at 355 nm (Fig. 7), where an isolated PDI chromophore exhibits only a slight optical transition dipole and then the light absorption depth profile is almost constant, suppressing the second order recombination kinetics due to the highly concentrated electron–hole pairs around the top surfaces (absorptivity: α ∼ 0.5 μm−1). This is also supported by the small mismatches of kinetic traces of transient conductivity and radical anions of PDI monitored by TAS at 730 nm68,69 in the time range of a few μs (Fig. 7b and c) observed in the PDI–PEG systems. Overall, the kinetic traces of both the transient absorption and TRMC measurements are well overlapped in the entire time course to 100 μs, suggesting the conductivity signal clearly originates from the free electrons generated on the PDI chromophores (PDI˙−). The molar extinction coefficient of PDI˙− had been reported as ε(PDI˙−) = 74![[thin space (1/6-em)]](https://www.rsc.org/images/entities/char_2009.gif) 000 M−1 cm−1 (anions)−1, allowing the fully-experimental determination of photoionization yield (ϕ) in the copolymer systems upon 355 nm excitation. Since the photoconductivity kinetic traces are normalized by the value of ϕ and given as ϕ∑μ, dividing the value of (ϕ∑μ)max by ϕmax at the end of the kinetics leads to the local mobility of electrons (∑μ) in the present system, which is summarized in Table 3. Herein, (PDI–PEG2000)n marked the highest electron mobility of 0.2 cm2 V−1 s−1, while the values of both ϕ and ϕ∑μ were negligible in (PDI–PDMSm)n copolymers. This implies that the steady state π–π inter-molecular interactions cannot overcome the thermal fluctuation of PDMS chains with the higher entropy terms, while the high crystallinity of PEG chains in the copolymer systems assists an effective hopping transport of electrons along the PDI aggregates. For the future design of ‘elastic’ electronic copolymers with folding–unfolding behaviours, it is presumed to be important to design semi-flexible inter-linking chains with entropy terms between those of the PEG and PDMS chains.
000 M−1 cm−1 (anions)−1, allowing the fully-experimental determination of photoionization yield (ϕ) in the copolymer systems upon 355 nm excitation. Since the photoconductivity kinetic traces are normalized by the value of ϕ and given as ϕ∑μ, dividing the value of (ϕ∑μ)max by ϕmax at the end of the kinetics leads to the local mobility of electrons (∑μ) in the present system, which is summarized in Table 3. Herein, (PDI–PEG2000)n marked the highest electron mobility of 0.2 cm2 V−1 s−1, while the values of both ϕ and ϕ∑μ were negligible in (PDI–PDMSm)n copolymers. This implies that the steady state π–π inter-molecular interactions cannot overcome the thermal fluctuation of PDMS chains with the higher entropy terms, while the high crystallinity of PEG chains in the copolymer systems assists an effective hopping transport of electrons along the PDI aggregates. For the future design of ‘elastic’ electronic copolymers with folding–unfolding behaviours, it is presumed to be important to design semi-flexible inter-linking chains with entropy terms between those of the PEG and PDMS chains.
| Entry | (ϕ∑μ)maxa/cm2 V−1 s−1 | ϕ max | ∑μc/cm2 V−1 s−1 |
|---|---|---|---|
| a (ϕ∑μ)max is a maximum value of the FP-TRMC trace. b ϕ max was calculated from the maximum value of ΔO.D. at 730 nm and absorption coefficient of PDI radical anions. c ∑μ was calculated by dividing of the value of ϕ∑μ by ϕ value picked up at the time where both kinetics are overlapped. | |||
| (PDI–PDMS1000)n | 0.5 × 10⁻⁵ | —a | —a |
| (PDI–PDMS2500)n | 0.8 × 10⁻⁵ | —a | —a |
| (PDI–PDMS5000)n | 0.7 × 10⁻⁵ | —a | —a |
| (PDI–PEG2000)n | 1.1 × 10⁻⁴ | 4.6 × 10⁻⁴ | 0.2 |
| (PDI–PEG6000)n | 6.0 × 10⁻⁵ | 9.2 × 10⁻⁴ | 0.07 |
| (PDI–PPG2000)n | 2.0 × 10⁻⁵ | 2.2 × 10⁻⁴ | 0.1 |
| (PDI–PPG4000)n | 3.5 × 10⁻⁵ | 6.3 × 10⁻⁵ | 0.06 |
| PDMS2000–PDI–PDMS2000 | 4.0 × 10⁻⁵ | 9.0 × 10⁻⁵ | 0.04 |
| PEG2000–PDI–PEG2000 | 8.0 × 10⁻⁵ | 6.2 × 10⁻⁴ | 0.1 |
Conclusions
Alternating copolymers of a perylenediimide (PDI) π-system and flexible macromolecular chains such as poly(dimethylsiloxane) (PDMS), poly(ethyleneglycol) (PEG), and poly(propylene glycol) (PPG) were newly synthesized in order to focus on their folding behaviour to construct electron-transporting PDI arrays via self-assembly. Due to the highly flexible nature of PDMS chains, PDI–PDMS alternating copolymers showed a distinct folding behaviour in THF solution, which was confirmed by the inter-PDI interactions observed by means of absorption spectroscopy and fluorescence spectroscopy. Inverse distribution of A0→0/A0→1 at around 0.6 as well as excimer formation of PDI–PDMS polymers strongly supported this folding event, whereas PDI–PEG polymers exhibited a weaker tendency of folding and PPG-based ones appeared to be almost dispersed in solution. The effectiveness of alternating copolymer structures was clearly demonstrated by comparing the reference macromonomer compounds of a PDI molecule carrying two PDMS or PEG chains at its termini, where these reference macromolecular compounds showed less inter-PDI interactions in solution. Therefore, it was revealed that the entropic effect of PDMS linkers strongly helps the PDI–PDI interactions in PDI–PDMS polymers. In the solid state, PDI–PDMS polymers afforded broad X-ray diffraction peaks corresponding to inter-plane distances among PDI units, while crystalline peaks of PEG chains appeared for the PDI–PEG polymers. Combination of flash-photolysis microwave conductivity and transient absorption spectroscopy for the solid films dropcast from THF solution disclosed the electron-transporting property for these PDI-based polymers in a fully-experimental and noncontact manner. In contrast to the much smaller conductivity and absorption signals for PDI–PDMS polymers, which indicate the low yields of photoinduced charge generation, PDI–PEG polymers recorded an intrinsic electron mobility of 0.2 cm2 V−1 s−1. Although the PDI–PDMS polymers are capable of folding even in diluted solution, long-range crystalline order of PEG chains may be effective in the solid state to align PDI chromophores and eventually provide the higher electron mobility. Selection of chains with appropriate entropy terms between PEG and PDMS chains would also be promising for the progress of foldamer-based soft organic electronics.Conflicts of interest
The authors declare no conflict of interest.Acknowledgements
This work was partially supported by the Grant-in-Aid for Scientific Research (No. 26102011, 15K21721, 26249145, and 17H04880) from Japan Society for the Promotion of Science (JSPS) and research grants from the Ogasawara Foundation for the Promotion of Science & Engineering, Tateisi Science and Technology Foundation, the Eno Science Foundation, and Iketani Science and Technology Foundation. The synchrotron radiation experiments were performed at BL44B2 in SPring-8 with the approval of RIKEN (Proposal No. 20160014). GI-XS experiments were conducted in Nagoya University, supported by Nanotechnology Platform Program of MEXT, Japan (Proposal No. S-16-NU-0017). We also acknowledge Prof. Akihiro Ito for the evaluation of absolute photoluminescence quantum yield and DLS measurements for Prof. Kenji Matsuda and Prof. Takashi Hirose in Kyoto University.Notes and references
- M. U. Ocheje, B. P. Charron, A. Nyayachavadi and S. Rondeau-Gagné, Flexible Printed Electron., 2017, 2, 043002 CrossRef.
- R. Xie, R. H. Colby and E. D. Gomez, Adv. Electron. Mater., 2017, 3, 1700356 CrossRef.
- Y. H. Lee, M. Jang, M. Y. Lee, O. Y. Kweon and J. H. Oh, Chem, 2017, 3, 724–763 CAS.
- A. D. Printz and D. J. Lipomi, Appl. Phys. Rev., 2016, 3, 021302 Search PubMed.
- H.-C. Kim, S.-M. Park and W. D. Hinsberg, Chem. Rev., 2010, 110, 146–177 CrossRef CAS PubMed.
- H. G. Yoo, M. Byun, C. K. Jeong and K. J. Lee, Adv. Mater., 2015, 27, 3982–3998 CrossRef CAS PubMed.
- C. Leitold and C. Dellago, J. Chem. Phys., 2014, 141, 134901 CrossRef PubMed.
- C. K. Ober, J. I. Jin, Q. Zhou and R. W. Lenz, Liquid crystal polymers with flexible spacers in the main chain, in Liquid Crystal Polymers I. Advances in Polymer Science, ed. N. A. Platé, Springer, Berlin, Heidelberg, 1984, vol. 59 Search PubMed.
- C. Ober, R. W. Lenz, G. Galli and E. Chiellini, Macromolecules, 1983, 16, 1034–1036 CrossRef CAS.
- J. S. Moore and S. I. Stupp, Macromolecules, 1987, 20, 282–293 CrossRef CAS.
- S. W. Kantor, T.-C. Sung and E. D. T. Atkins, Macromolecules, 1992, 25, 2789–2795 CrossRef CAS.
- Z. R. Wagner, T. K. Roenigk and F. E. Goodson, Macromolecules, 2001, 34, 5740–5743 CrossRef CAS.
- M. T. Hargadon, E. A. Davey, T. B. Mcintyre, D. Gnanamgari, C. M. Wynne, R. C. Swift, J. R. Zimbalist, B. L. Fredericks, A. J. Nicastro and F. E. Goodson, Macromolecules, 2008, 41, 741–750 CrossRef CAS.
- J. A. Osaheni and S. A. Jenekhe, J. Am. Chem. Soc., 1995, 117, 7389–7398 CrossRef CAS.
- Z. Yang, F. E. Karasz and D. C. Morton, J. Chem. Phys., 1993, 74, 3584–3586 Search PubMed.
- X. Zhu, M. C. Traub, D. A. Vanden Bout and K. N. Plunkett, Macromolecules, 2012, 45, 5051–5057 CrossRef CAS.
- M. C. Traub, K. H. Dubay, S. E. Ingle, X. Zhu, K. N. Plunkett, D. R. Reichman and D. A. V. Bout, J. Phys. Chem. Lett., 2013, 4, 2520–2524 CrossRef CAS.
- J. M. Lucas, J. A. Labastide, L. Wei, J. S. Tinkham, M. D. Barnes and P. M. Lahti, J. Phys. Chem. A, 2015, 119, 8010–8020 CrossRef CAS PubMed.
- D. H. Appella, L. A. Christianson, I. L. Karle, D. R. Powell and S. H. Gellman, J. Am. Chem. Soc., 1996, 118, 13071–13072 CrossRef CAS.
- S. H. Gellman, Acc. Chem. Res., 1998, 31, 173–180 CrossRef CAS.
- J. C. Nelson, J. G. Saven, J. S. Moore and P. G. Wolynes, Science, 1997, 277, 1793–1796 CrossRef CAS PubMed.
- D. J. Hill, M. J. Mio, R. B. Prince, T. S. Hughes and J. S. Moore, Chem. Rev., 2001, 101, 3893–4011 CrossRef CAS PubMed.
- T. Muraoka, T. Shima, T. Hamada, M. Morita, M. Takagi and K. Kinbara, Chem. Commun., 2011, 47, 194–196 RSC.
- T. Muraoka and K. Kinbara, Chem. Commun., 2016, 52, 2667–2678 RSC.
- Y. Zheng, H. Zhou, D. Liu, G. Floudas, M. Wagner, K. Koynov, M. Mezger, H. J. Butt and T. Ikeda, Angew. Chem., Int. Ed., 2013, 52, 4845–4848 CrossRef CAS PubMed.
- T. Ikeda, Langmuir, 2015, 31, 667–673 CrossRef CAS PubMed.
- M. Vybornyi, A. Rudnev and R. Häner, Chem. Mater., 2015, 27, 1426–1431 CrossRef CAS.
- T. Mondal, K. Dan, J. Deb, S. S. Jana and S. Ghosh, Langmuir, 2013, 29, 6746–6753 CrossRef CAS PubMed.
- T. Mondal, T. Sakurai, S. Yoneda, S. Seki and S. Ghosh, Macromolecules, 2015, 48, 879–888 CrossRef CAS.
- T. Ikeda, H. Tamura, T. Sakurai and S. Seki, Nanoscale, 2016, 8, 14673–14681 RSC.
- S. Seki, A. Saeki, T. Sakurai and D. Sakamaki, Phys. Chem. Chem. Phys., 2014, 16, 11093–11113 RSC.
- A. Saeki, Y. Koizumi, T. Aida and S. Seki, Acc. Chem. Res., 2012, 45, 1193–1202 CrossRef CAS PubMed.
- F. C. Grozema and L. D. A. Siebbeles, J. Phys. Chem. Lett., 2011, 2, 2951–2958 CrossRef CAS.
- F. Würthner, C. R. Saha-Möller, B. Fimmel, S. Ogi, P. Leowanawat and D. Schmidt, Chem. Rev., 2016, 116, 962–1052 CrossRef PubMed.
- E. E. Neuteboom, R. A. J. Janssen and E. W. Meijer, Synth. Met., 2001, 121, 1283–1284 CrossRef CAS.
- E. E. Neuteboom, S. C. J. Meskers, E. W. Meijer and R. A. J. Janssen, Macromol. Chem. Phys., 2004, 205, 217–222 CrossRef CAS.
- S. K. Nisha and S. K. Asha, ACS Appl. Mater. Interfaces, 2014, 6, 12457–12466 CAS.
- Y. Liang, D. Wang, Y. Wu, Q. Lai, L. Xue and S. Feng, Appl. Surf. Sci., 2011, 257, 10576–10580 CrossRef CAS.
- W. Wang, L. S. Li, G. Helms, H. H. Zhou and A. D. Q. Li, J. Am. Chem. Soc., 2003, 125, 1120–1121 CrossRef CAS PubMed.
- W. Wang, J. J. Han, L.-Q. Wang, L.-S. Li, W. J. Shaw and A. D. Q. Li, Nano Lett., 2003, 2, 455–458 CrossRef.
- A. D. Q. Li, W. Wang and L. Q. Wang, Chem. – Eur. J., 2003, 9, 4594–4601 CrossRef CAS PubMed.
- A. D. Shaller, W. Wang, A. Li, G. Moyna, J. J. Han, G. L. Helms and A. D. Q. Li, Chem. – Eur. J., 2011, 17, 8350–8362 CrossRef CAS PubMed.
- K. Kato and H. Tanaka, Adv. Phys.: X, 2016, 1, 55–80 Search PubMed.
- M. Sano, S. Nakamura, M. Hara, S. Nagano, Y. Shinohara, Y. Amemiya and T. Seki, Macromolecules, 2014, 47, 7178–7186 CrossRef CAS.
- C. Aguilera, J. Bartulin, B. Hisgen and H. Ringsdorf, Makromol. Chem., 1983, 262, 253–262 CrossRef.
- A. B. Samui, S. Pandey and S. P. Mishra, RSC Adv., 2015, 5, 68351–68355 RSC.
- M. Zhao, K. Hashimoto and K. Tajima, Synth. Met., 2013, 175, 9–14 CrossRef CAS.
- K. L. Geisinger and G. V. Gibbs, Phys. Chem. Miner., 1983, 7, 204–210 CrossRef.
- P. Buckley and P. A. Giguère, Can. J. Chem., 1967, 45, 397–407 CrossRef CAS.
- H. Langhals and R. Ismael, Eur. J. Org. Chem., 1998, 1915–1917 CrossRef CAS.
- J. Sung, A. Nowak-Król, F. Schlosser, B. Fimmel, W. Kim, D. Kim and F. Würthner, J. Am. Chem. Soc., 2016, 138, 9029–9032 CrossRef CAS PubMed.
- S. Yagai, T. Seki, T. Karatsu, A. Kitamura and F. Würthner, Angew. Chem., Int. Ed., 2008, 47, 3367–3371 CrossRef CAS PubMed.
- S. Ghosh, X. Q. Li, V. Stepanenko and F. Würthner, Chem. – Eur. J., 2008, 14, 11343–11357 CrossRef CAS PubMed.
- M. Kasha, H. R. Rawls and M. Ashraf El-Bayoumi, Pure Appl. Chem., 1965, 11, 371–392 CrossRef CAS.
- W. E. Ford, J. Photochem., 1987, 37, 189–204 CrossRef CAS.
- H. Langhals, Helv. Chim. Acta, 2005, 88, 1309 CrossRef CAS.
- Z. Chen, B. Fimmel and B. F. Würthner, Org. Biomol. Chem., 2012, 10, 5845–5855 CAS.
- The possibility of concentration changes upon heating was discussed in detail in the ESI.† The small values of volume expansion coefficients a [=(1/Vm)(dVm/dT)] ranging in 0.9–1.2 × 10⁻³ K−1 for ethers, the presence of isosbestic points in absorption spectra upon heating, and the fact of no distinct change for the CHCl3 solution case are the discussed points.
- D. Veldman, S. M. A. Chopin, S. C. J. Meskers, M. M. Groeneveld, R. M. Williams and R. A. J. Janssen, J. Phys. Chem. A, 2008, 112, 5846–5857 CrossRef CAS PubMed.
- M. Sadrai, L. Hadel, R. R. Sauers, S. Husain, K. Krogh-Jespersen, J. D. Westbrook and G. R. Bird, J. Phys. Chem., 1992, 96, 7988–7996 CrossRef CAS.
- S. J. Clarson, K. Dodgson and J. A. Semlyen, Polymer, 1985, 26, 930–934 CrossRef CAS.
- P. Tormala, Eur. Polym. J., 1974, 10, 519–521 CrossRef CAS.
- G. P. Johari, A. Hallbrucker and E. Mayer, J. Polym. Sci., Part B: Polym. Phys., 1988, 26, 1923–1930 CrossRef CAS.
- T. Sakurai, Y. Tsutsui, K. Kato, M. Takata and S. Seki, J. Mater. Chem. C, 2016, 4, 1490–1496 RSC.
- V. Percec, H. J. Sun, P. Leowanawat, M. Peterca, R. Graf, H. W. Spiess, X. Zeng, G. Ungar and P. A. Heiney, J. Am. Chem. Soc., 2013, 135, 4129–4148 CrossRef CAS PubMed.
- A. Saeki, S. Seki, Y. Koizumi and S. Tagawa, J. Photochem. Photobiol., A, 2007, 186, 158–165 CrossRef CAS.
- S. Yagai, M. Usui, T. Seki, H. Murayama, Y. Kikkawa, S. Uemura, T. Karatsu, A. Kitamura, A. Asano and S. Seki, J. Am. Chem. Soc., 2012, 134, 7983–7994 CrossRef CAS PubMed.
- W. E. Ford, H. Hiratsuka and P. V. Kamat, J. Phys. Chem., 1989, 93, 6692–6696 CrossRef CAS.
- D. Gosztola, M. P. Niemczyk, W. Svec, A. S. Lukas and M. R. Wasielewski, J. Phys. Chem. A, 2000, 104, 6545–6551 CrossRef CAS.
Footnote |
| † Electronic supplementary information (ESI) available: Dynamic light scattering data and differential scanning calorimetry chart. See DOI: 10.1039/c7qm00616k |
| This journal is © the Partner Organisations 2018 |

