Light-promoted conversion of greenhouse gases over plasmonic metal–carbide nanocomposite catalysts†
Oruganti
Anjaneyulu
*ab,
Kazu
Takeda
c,
Satoshi
Ishii
de,
Shigenori
Ueda
fg,
Tadaaki
Nagao
de,
Peng
Xiaobo
ae,
Takeshi
Fujita
eh,
Masahiro
Miyauchi
 *ce and
Hideki
Abe
 *aei
*aei
aNational Institute for Materials Science, 1-1 Namiki, Tsukuba, Ibaraki 305-0044, Japan. E-mail: ABE.Hideki@nims.go.jp
bCentral University of Karnataka, Kalaburagi, Karnataka 585367, India
cDepartment of Materials Science and Engineering, School of Materials and Chemical Technology, Tokyo Institute of Technology, 2-12-1 Ookayama, Meguro-ku, Tokyo 152-8552, Japan. E-mail: mmiyauchi@ceram.titech.ac.jp
dWPI International Center for Material Nanoarchitectonics, National Institute for Materials Science, 1-1 Namiki, Tsukuba, Ibaraki 305-0044, Japan
eCore Research for Evolutional Science and Technology (CREST), Japan Science and Technology Agency (JST), 4-1-8 Honcho, Kawaguchi, Saitama 332-0012, Japan
fSynchrotron X-ray Station at SPring-8, National Institute for Materials Science, 1-1-1 Kouto, Sayo, Hyogo, 679-5148, Japan
gQuantum Beam Unit, National Institute for Materials Science, Sengen, Tsukuba 305-0047, Japan
hWPI Advanced Institute for Materials Research, Tohoku University, Sendai 980-8577, Japan
iGraduate School of Science and Technology, Saitama University, 255 Shimo-Okubo, Saitama 338-8570, Japan
First published on 10th January 2018
Abstract
Nanocomposite catalysts consisting of metallic cobalt and tantalum carbide were synthesized and they efficiently promoted an uphill conversion of greenhouse gases including CO2 and CH4 into CO and H2 under visible light. Electromagnetic simulations demonstrated that the efficient energy transformation by Co@TaC was attributed to the enhanced surface-located plasmon resonance.
Solar energy is sufficiently abundant and renewable that it is anticipated to be the ultimate resource for a sustainable society and economy. Different approaches to scavenge and store solar energy have been proposed.1 Solar thermal collectors transform solar energy into heat, which is finally stored in heat capacitors such as circulating water systems. Solar light can be directly transformed into electricity with solar cells and stored in secondary batteries. These technologies are highly established to achieve energy transformation efficiencies greater than 10%, yet they are limited in their use as power sources for stationary devices.2 Chemical energy is more favorable than either heat or electricity because it can be contained in carrier molecules, transported and used on demand. The catalytic generation of hydrogen from naturally abundant water using solar light as an energy source is thus of great interest in energy, sustainability and materials sciences.3 However, hydrogen is not the best material as a storage or carrier of solar energy because of its low volumetric density of energy and explosive nature. To improve the transportability and safety, there have been several attempts to convert the photogenerated hydrogen into metal hydrides.4
Catalytic conversions of naturally abundant carbon dioxide1 and/or methane (CH4) can yield energetically dense carbon-based resources, such as carbon monoxide (CO), formic acid, hydrocarbons and/or alcohols. Both CO2 and CH4 are not only the major components of natural gas but also the most predominant greenhouse gases.5 The catalytic conversion of such greenhouse gases into valuable synthesis gas comprising CO and H2, namely, greenhouse-to-synthesis-gas conversion (GTS conversion), can, when sufficiently powered by solar light, not only realize the low-cost production of synthesis gases for the chemical industry but also considerably reduce the impact of greenhouse gases in the global atmosphere.6 GTS conversion is traditionally conducted over cobalt (Co)- and/or nickel-based catalysts at elevated temperatures higher than 850 °C, which requires the mass consumption of fossil fuels (including CH4) and results in large CO2 emissions.7
Precious-metal (PM) catalysts consisting of gold (Au) and rhodium3 nanoparticles and/or gold–palladium (Au–Pd) alloy nanoparticles have realized low-temperature GTS conversion (<600 °C) under illumination because of the ability of Au nanomaterials to be heated by UV and visible light through surface-localized plasmon resonance (SLPR).8 Such SLPR-mediated GTS conversion can be a rational approach to transform light energy into chemical energy through uphill reaction pathways (CH4 + CO2 ⇒ 2H2 + 2CO: free-energy gain = +171.2 kJ mol−1 and/or CO2 + H2 ⇒ CO + H2O: free-energy gain = +28.4 kJ mol−1; see the ESI† for details on the verification of free energy), reducing the use of fuels to achieve the reaction temperature. However, none of these PM-based catalysts are likely applicable to broad- or large-scale use because of the high material costs of PMs, such as Au, Rh and Pd, which often exceed 10 $g−1.
Here, we have, for the first time, reported the synthesis of a PM-free nanocomposite catalyst comprising Co nanoparticles and tantalum carbide (i.e., Co@TaC) from Co–Ta precursors that were obtained through the chemical reduction of metal precursors in an organic solvent. The synthesized Co@TaC efficiently catalyzed GTS conversion at 600 °C under visible light, where 50% of the gain in chemical energy was contributed by the light illumination. In contrast, GTS conversion over traditional alumina-supported Co catalysts significantly relied on heat energy, where the light illumination contributed less than 5% to the energy gain. Electromagnetic simulations substantiated that Co@TaC can absorb visible- and infrared light through the strong SLPR of TaC, which generated high-temperature regions (hot spots) at the Co/TaC interface to drive GTS conversion over the Co surface.
Co@TaC was synthesized in a two-step process involving chemical reduction in an aprotic solvent followed by an annealing treatment in an inert gas atmosphere (Scheme 1). Metal chloride precursors of CoCl2 and TaCl5 were dissolved in dry diethylene glycol dimethyl ether (diglyme) and reduced with superhydride (LiEt3BH, 1.0 M in dry tetrahydrofuran (THF)) in an inert atmosphere to obtain Co–Ta alloy clusters (see the ESI† for synthetic details). The as-prepared Co–Ta clusters were coated with a carbon-containing layer consisting of organic molecules such as the ligand of a superhydride. When heated in an inert atmosphere, the carbon-coated Co–Ta clusters were transformed into a nanocomposite of metal Co and TaC as a result of the diffusion of carbon atoms from the surface into the bulk to promote phase separation at the nanometer scale (nanophase separation).9 The driving force for the nanophase separation is likely due to the considerable difference in the formation enthalpies of TaC (ΔHf = −159 kJ mol−1) and CoC (ΔHf = −10 kJ mol−1), leading to the preferred formation of TaC, leaving Co as a pure metal.10
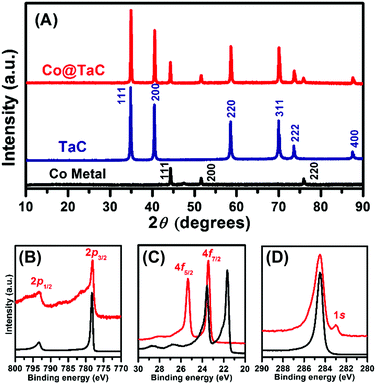
Fig. 1A shows the powder X ray (pXRD) profiles for metallic Co, TaC and the Co@TaC nanocomposite (Cu Kα radiation, λ = 0.15418 nm; PANalytical X’pert). The reflection peaks for Co@TaC were assigned to metallic Co (2θ = 44.28, 51.60 and 75.90 degrees) corresponding to the 111, 200 and 220 reflections, respectively, of a face-centered cubic structure (Fm![[3 with combining macron]](https://www.rsc.org/images/entities/char_0033_0304.gif) m; a = 0.3554 nm) and TaC (2θ = 34.94, 40.55, 58.63, 70.06, 73.66 and 87.59 degrees) corresponding to the 111, 200, 220, 311, 222, 400 and 331 reflections, respectively, of the NaCl structure (a = 0.445 nm).11 Hard X-ray photoemission spectroscopy (HAXPES) was performed with synchrotron radiation (photon energy = 5.95 keV). Fig. 1B shows the HAXPES spectra for metallic Co and Co@TaC in the Co 2p region. The Co 2p1/2 and 2p3/2 emissions from Co@TaC appeared at the same binding energies as those from the metallic Co, 793.22 and 778.17 eV, respectively, showing that the Co atoms in the Co@TaC were in the same chemical environment as in pristine Co (see the ESI,† Fig. S5, for TaC-supported Co nanoparticles).12 Unlike the Co 2p emissions, the Ta 4f- and C 1s emissions from Co@TaC had substantially different binding energy values than the corresponding metallic Ta and carbon graphite because the Ta and C atoms are bound to each other through Ta–C bonds to form solid-state TaC (Fig. 1C and D).13
m; a = 0.3554 nm) and TaC (2θ = 34.94, 40.55, 58.63, 70.06, 73.66 and 87.59 degrees) corresponding to the 111, 200, 220, 311, 222, 400 and 331 reflections, respectively, of the NaCl structure (a = 0.445 nm).11 Hard X-ray photoemission spectroscopy (HAXPES) was performed with synchrotron radiation (photon energy = 5.95 keV). Fig. 1B shows the HAXPES spectra for metallic Co and Co@TaC in the Co 2p region. The Co 2p1/2 and 2p3/2 emissions from Co@TaC appeared at the same binding energies as those from the metallic Co, 793.22 and 778.17 eV, respectively, showing that the Co atoms in the Co@TaC were in the same chemical environment as in pristine Co (see the ESI,† Fig. S5, for TaC-supported Co nanoparticles).12 Unlike the Co 2p emissions, the Ta 4f- and C 1s emissions from Co@TaC had substantially different binding energy values than the corresponding metallic Ta and carbon graphite because the Ta and C atoms are bound to each other through Ta–C bonds to form solid-state TaC (Fig. 1C and D).13
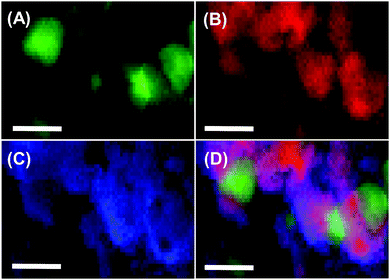
Fig. 2 shows the scanning transmission electron microscopy (STEM) images of Co@TaC. Metallic Co formed nanocrystals with an average size of 30 nm (Fig. 2A), whereas Ta and C were distributed as an extended matrix of TaC (Fig. 2B and C). The merged image shows that the Co nanocrystals were incorporated in the TaC matrix, partially exposed to the atmosphere (see the ESI,† Fig. S3, for high-resolution TEM images).
 | ||
| Fig. 2 Compositional mapping images for Co@TaC showing the distributions of Co (A), Ta (B), and C (C) and a merged image (D). The scale bars correspond to 50 nm. | ||
We then performed GTS conversion tests over the Co@TaC catalyst at elevated temperatures under illumination. An aliquot of 20 mg of the Co@TaC catalyst was placed on a porous alumina substrate (4 mm diameter) in an atmosphere-controllable reaction chamber equipped with a quartz viewport (ESI,† for instrumental details see Fig. S1). The catalyst was illuminated with visible light (ESI,† Xe lamp, 150 kW m−2; Fig. S2) through the viewport. A reactant gas consisting of CO2, CH4 and Ar (volume ratio: CO2![[thin space (1/6-em)]](https://www.rsc.org/images/entities/char_2009.gif) :
:![[thin space (1/6-em)]](https://www.rsc.org/images/entities/char_2009.gif) CH4
CH4![[thin space (1/6-em)]](https://www.rsc.org/images/entities/char_2009.gif) :
:![[thin space (1/6-em)]](https://www.rsc.org/images/entities/char_2009.gif) Ar = 1
Ar = 1![[thin space (1/6-em)]](https://www.rsc.org/images/entities/char_2009.gif) :
:![[thin space (1/6-em)]](https://www.rsc.org/images/entities/char_2009.gif) 1
1![[thin space (1/6-em)]](https://www.rsc.org/images/entities/char_2009.gif) :
:![[thin space (1/6-em)]](https://www.rsc.org/images/entities/char_2009.gif) 98) was passed over the catalyst at a total flow of 10 ml min−1 at 600 °C. The chemical composition of the effluent gas was analyzed with a set of microscale gas chromatographs.
98) was passed over the catalyst at a total flow of 10 ml min−1 at 600 °C. The chemical composition of the effluent gas was analyzed with a set of microscale gas chromatographs.
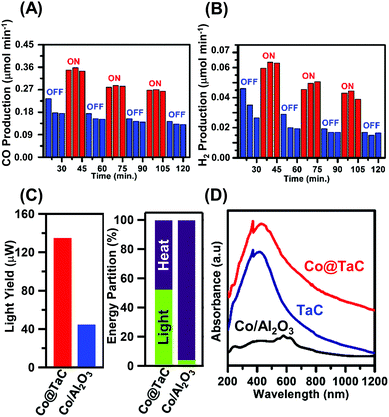
Fig. 3 shows the GTS conversion performance of the Co@TaC catalyst. In an aliquot obtained after 20 min exposure to the reactant gas in the dark, the effluent gas contained 0.18 μmol min−1 of CO (Fig. 3A). When the catalyst was illuminated with visible light for 30 min after the gas exposure, the CO concentration in the effluent gas increased up to 0.35 μmol min−1. The CO generation decreased down to less than 0.18 μmol min−1 when the light was off. This light-responsive trend was repeatedly observed for Co@TaC over 2 hours after the gas exposure. The H2 generation over Co@TaC exhibited a similar trend of CO generation (Fig. 3B). H2 generation under illumination was nearly 2 times larger than that in the dark (ESI† – catalytic performance of Co@TaC summarized in Table S1; see Fig. S6 for the CO generation over Co@TaC at 500 °C).
Co@TaC yielded 135 μW of chemical energy from 1.88 W of light illumination via GTS conversion at 600 °C, achieving a light-to-chemical energy transformation of 0.0072% (left panel of Fig. 3C; see the ESI† for details on the calculations of this light yield). The alumina-supported Co catalyst (Co/Al2O3; ESI,† see Fig. S4 for a TEM image) yielded 44 μW of chemical energy under the same conditions, showing that Co/Al2O3 was less capable of transforming light energy into chemical energy via GTS conversion. Indeed, Co/Al2O3 did not respond to light illumination, exhibiting no considerable change in CO or H2 production with or without light (ESI,† see Fig. S7 and S8 for the gas production over the Co/Al2O3). As shown in the right panel of Fig. 3C, 50% of the total chemical energy gain through GTS conversion over Co@TaC was contributed by the light illumination, whereas Co/Al2O3 produced synthesis gas mostly by relying on heat, resulting in a light-energy fraction lower than 5% (see the ESI† for details on the calculation of light-energy fractions).
One of the origins of the enhanced light-to-chemical energy transformation by Co@TaC can be attributed to the ability of TaC to absorb UV and visible light (Fig. 3D). TaC powder and Co@TaC showed an intense light absorption in the 300–1000 nm wavelength range. Density functional calculations demonstrated that some of the early-d-metal carbides and nitrides, including TaC and TiN, can absorb visible light through surface-localized plasmon resonance (SLPR).14
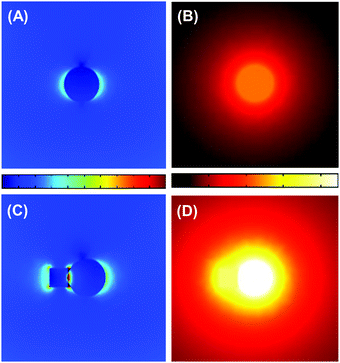
Fig. 4 shows the results of numerical simulations on the temperature and electric-field amplitude distributions around TaC and Co@TaC nanoparticles that are illuminated by monochromatic light from the top. As a result of the intense SLPR of TaC, the electric field around the illuminated TaC particle shows a dipolar distribution having poles at both the ends of the given particle (Fig. 4A). The temperature in the centre of the TaC particle considerably increases due to the photothermal processes via damping of the SLPR (Fig. 4B). The electromagnetic simulations further demonstrate that the electric-field amplitude is maximized at the Co/TaC interface because of a conjugated SLPR between the Co nanocrystals and TaC nanoparticles (Fig. 4C). The temperature distribution around Co@TaC has a maximum at the interface between the Co nanocrystal and the TaC counterpart (Fig. 4D).
The incident light is absorbed by Co@TaC through this conjugated SLPR, which results in heat generation at the Co/TaC interface. The GTS conversion is initiated by decomposition of chemisorbed CH4 into C adatoms and H2 gas: CH4 = Cad + H2, which is hardly promoted over Co surfaces at temperatures lower than 600 °C and at ambient pressure. The Co nanocrystals of Co@TaC efficiently drive the targeted GTS conversion at low temperatures utilizing the heat energy provided by the plasmonic TaC counterpart through the metal/carbide interface.
In conclusion, we successfully materialized a catalytic metal-carbide nanocomposite, Co@TaC. Co@TaC absorbed light in the 300 to 1000 nm wavelength range through surface-localized plasmon resonance (SLPR). As a result of the enhanced SLPR at the metal/carbide interface, Co@TaC efficiently promoted light-to-chemical energy conversion through an uphill greenhouse-to-synthesis-gas (GTS) conversion to scavenge and store light energy in synthesis gas molecules. This work demonstrates that plasmonic nanomaterials comprising catalytic late-d-metals and early-d-metal carbides and/or nitrides are promising materials for light-driven GTS conversion and prompt further research into unexplored materials toward efficient solar-to-chemical energy conversions for ever-lasting sustainable societies.
Conflicts of interest
There are no conflicts to declare.Acknowledgements
This work was financially supported by JST CREST (Japan Science and Technology Agency: JST) and the NIMS Microstructural Characterization Platform as a program of the “Nanotechnology Platform” of the Ministry of Education, Culture, Sports, Science and Technology (MEXT), Japan. The HAXPES measurements were performed under the approval of the NIMS Synchrotron X-ray Station (Proposal No. 2017A4602 and 2016B4600). The authors are grateful to HiSOR, Hiroshima University, and JAEA/SPring-8 for the development of HAXPES at BL15XU of SPring-8. The authors thank Dr Mukesh Kumar and Dr Rajesh Kodiyath for useful scientific discussions.References
- (a) C. Wang and D. Astruc, Chem. Soc. Rev., 2014, 43, 7188–7216 RSC; (b) A. Kudo and Y. Miseki, Chem. Soc. Rev., 2009, 38, 253–278 RSC; (c) W. Zhang, W. Lai and R. Cao, Chem. Rev., 2017, 117, 3717–3797 CrossRef CAS PubMed.
- (a) N. S. Lewis, Science, 2007, 315, 798–801 CrossRef CAS PubMed; (b) P. V. Kamat, J. Phys. Chem. C, 2007, 111, 2834–2860 CrossRef CAS; (c) L. A. Weinstein, J. Loomis, B. Bhatia, D. M. Bierman, E. N. Wang and G. Chen, Chem. Rev., 2015, 115, 12797–12838 CrossRef CAS PubMed.
- (a) M. Grätzel, Acc. Chem. Res., 1981, 14, 376–384 CrossRef; (b) X. Chen, S. Shen, L. Guo and S. S. Mao, Chem. Rev., 2010, 110, 6503–6570 CrossRef CAS PubMed; (c) X. Chen, C. Li, M. Grätzel, R. Kostecki and S. S. Mao, Chem. Soc. Rev., 2012, 41, 7909–7937 RSC; (d) K. Maeda and K. Domen, Bull. Chem. Soc. Jpn., 2016, 89, 627–648 CrossRef CAS.
- X. Qu, Y. Li, P. Li, Q. Wan and F. Zhai, Front. Mater. Sci., 2015, 9, 317–331 CrossRef.
- (a) D. Pakhare and J. Spivey, Chem. Soc. Rev., 2014, 43, 7813–7837 RSC; (b) M.-S. Fan, A. Z. Abdullah and S. Bhatia, ChemCatChem, 2009, 1, 192–208 CrossRef CAS; (c) D. Li, Y. Nakagawa and K. Tomishige, Appl. Catal., A, 2011, 408, 1–24 CrossRef CAS.
- (a) S. M. Stagg-Williams, F. B. Noronha, G. Fendley and D. E. Resasco, J. Catal., 2000, 194, 240–249 CrossRef CAS; (b) J. B. Claridge, A. P. E. York, A. J. Brungs, C. Marquez-Alvarez, J. Sloan, S. C. Tsang and M. L. H. Green, J. Catal., 1998, 180, 85–100 CrossRef CAS; (c) J. Low, B. Cheng and J. Yu, Appl. Surf. Sci., 2017, 392, 658–686 CrossRef CAS.
- (a) D. Baudouin, K. C. Szeto, P. Laurent, A. De Mallmann, B. Fenet, L. Veyre, U. Rodemerck, C. Coperet and C. Thieuleux, J. Am. Chem. Soc., 2012, 134, 20624–20627 CrossRef CAS PubMed; (b) S. Kawi, Y. Kathiraser, J. Ni, U. Oemar, Z. Li and E. T. Saw, ChemSusChem, 2015, 8, 3556–3575 CrossRef CAS PubMed; (c) T. Wu, Q. Zhang, W. Cai, P. Zhang, X. Song, Z. Sun and L. Gao, Appl. Catal., A, 2015, 503, 94–102 CrossRef CAS; (d) K. Nagaoka, K. Takanabe and K. Aika, Chem. Commun., 2002, 1006–1007 RSC; (e) H. Abe, J. Liu and K. Ariga, Mater. Today, 2016, 19, 12–18 CrossRef CAS.
- (a) H. Liu, X. D. Meng, H. Zhang, P. Li, K. Chang, T. Wang, M. Li, T. Nagao and J. Ye, Angew. Chem., Int. Ed., 2015, 54, 11545–11549 CrossRef CAS PubMed; (b) F. Wang, C. Li, H. Chen, R. Jiang, L.-D. Sun, Q. Li, J. Wang, J. C. Yu and C.-H. Yan, J. Am. Chem. Soc., 2013, 135, 5588–5601 CrossRef CAS PubMed; (c) X. Huang, Y. Li, Y. Chen, H. Zhou, X. Duan and Y. Huang, Angew. Chem., Int. Ed., 2013, 52, 6063–6067 CrossRef CAS PubMed.
- (a) T. Tanabe, T. Imai, T. Tokunaga, S. Arai, Y. Yamamoto, S. Ueda, G. V. Ramesh, S. Nagao, H. Hirata, S. Matsumoto, T. Fujita and H. Abe, Chem. Sci., 2017, 8, 3374–3378 RSC; (b) T. Imai, S. Ueda, S. Nagao, H. Hirata, K. R. Deepthi and H. Abe, RSC Adv., 2017, 7, 9628–9631 RSC; (c) T. Fujita, H. Abe, T. Tanabe, Y. Ito, T. Tokunaga, S. Arai, Y. Yamamoto, A. Hirata and M. Chen, Adv. Funct. Mater., 2016, 26, 1609–1616 CrossRef CAS.
- E. M. Abdelkader, P. A. Jelliss and S. W. Buckner, Inorg. Chem., 2015, 54, 5897–5906 CrossRef CAS PubMed.
- L. K. Brar, G. O. Singla and P. Pandey, RSC Adv., 2016, 6, 109174–109184 RSC.
- J. P. Bonnelle, J. Grimbolt and A. D’huysser, J. Electron Spectrosc. Relat. Phenom., 1975, 7, 151 CrossRef CAS.
- N. S. Alhajri, H. Yoshida, D. H. Anjum, A. T. Garcia-Esparza, J. Kubota, K. Domen and K. Takanabe, J. Mater. Chem. A, 2013, 1, 12606–12616 CAS.
- (a) M. Kumar, N. Umezawa, S. Ishii and T. Nagao, ACS Photonics, 2016, 3, 43–50 CrossRef CAS; (b) G. V. Naik, V. M. Shalaev and A. Boltasseva, Adv. Mater., 2013, 25, 3264–3294 CrossRef CAS PubMed; (c) O. Anjaneyulu, S. Ishii, T. Imai, T. Tanabe, S. Ueda, T. Nagao and H. Abe, RSC Adv., 2016, 6, 110566–110570 RSC.
Footnote |
| † Electronic supplementary information (ESI) available. See DOI: 10.1039/c7qm00569e |
| This journal is © the Partner Organisations 2018 |


