 Open Access Article
Transmission electron microscopy as an important tool for characterization of zeolite structures
W.
Wan
 ,
J.
Su
,
X. D.
Zou
,
J.
Su
,
X. D.
Zou
 and
T.
Willhammar
 *
*
Inorganic and Structural Chemistry, Department of Materials and Environmental Chemistry, Stockholm University, SE-106 91 Stockholm, Sweden. E-mail: tom.willhammar@mmk.su.se
First published on 26th September 2018
Abstract
Transmission electron microscopy (TEM) is an important tool for structure characterization of zeolite materials. Structural information can be obtained by different TEM techniques, for example electron diffraction (ED), high-resolution transmission electron microscopy (HRTEM), scanning transmission electron microscopy (STEM) and electron tomography (ET), each with its own advantages and limitations. These techniques are briefly introduced. Examples are given to show how these techniques can be used to solve various structure-related problems in zeolites. With this review we will describe the basic principles of transmission electron microscopy techniques for structural characterization, including recent methodological advancements. Advantages as well as challenges of using TEM for structural characterization will be described in relation to other methods. Examples of structural characterization of zeolites will be given for each of the methods.
1. Introduction
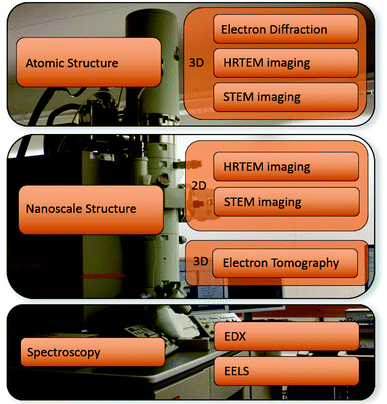
Zeolites are crystalline materials built from corner-sharing TO4 (T = Si, Al, P, Ge, etc.) tetrahedra, which form three-dimensional (3D) 4-connected frameworks with uniformly sized pores of molecular dimensions.1 They have wide industrial applications in heterogeneous catalysis, sorption, separation and ion-exchange.2 The interesting properties of zeolites are largely due to their unique pore structures with well-defined pore sizes, shape and dimensionality. The continuously increasing demands on porous materials with highly specific properties have pushed scientists to synthesize zeolites with unique structures and functionalities. Structure information is thus crucial for understanding the properties, exploiting applications and developing new zeolite materials with desirable properties and functionalities.Transmission electron microscopy (TEM) has been widely applied for characterization of zeolite structures, for instance, structure determination of new zeolites, study of growth mechanisms of nano-sized zeolites and pore structures of hierachical micro- and meso-porous zeolites, and analysis of metal sites in zeolites. While single crystal X-ray diffraction (SXRD) and powder X-ray diffraction (PXRD) are the main techniques for characterization of zeolite structures, TEM are used for studying crystals too small or too complicated to be studied by X-ray diffraction.3 In addition to diffraction, there are different imaging techniques in TEM since electrons can be easily focused by electromagnetic lenses. For direct imaging of atomic structures of a sample, high-resolution transmission electron microscopy (HRTEM) and scanning transmission electron microscopy (STEM) can be used. In addition, energy dispersive X-ray spectroscopy (EDX) and electron energy loss spectroscopy (EELS) devices attached to a transmission electron microscope can provide chemical information of the sample. An overview of the different techniques described in this review is given in Fig. 1. TEM is feasible for studying individual nano- or submicron-sized particles in the sample, while X-ray diffraction gives information about the entire sample.
Amongst various TEM techniques, electron diffraction (ED) is widely used for phase identification and structure determination of zeolite crystals. Recently developed 3D electron diffraction methods have shown to be more powerful than conventional diffraction techniques. Almost complete 3D electron diffraction data can be obtained from an arbitrarily oriented crystal within a matter of minutes. A rapidly growing number of zeolite structures have been solved using the 3D electron diffraction techniques.
Different from diffraction techniques that provide average information of a material in reciprocal space, HRTEM and STEM give information in real space, which facilitate direct visualization of pores and local structure (surfaces, disorders and defects) in zeolite materials. HRTEM and STEM images are related to the structure projection of zeolite materials. Both amplitude and phase information of crystal structure factors can be extracted from the images and used for solving complex zeolite structures, especially those containing defects and disorders.
Recently, TEM techniques have been employed in studies of hierarchical micro- and meso-porous zeolites. The incorporation of mesopores into microporous zeolites offers fast mass transfer and overcomes the diffusion limitation imposed by the small pore sizes of zeolites, making them applicable for catalysis involving large molecules. Because the mesopores in most hierarchical micro- and meso-porous zeolites are disordered, it is necessary to combine different techniques to characterize the complex pore structures of such zeolite materials. Electron crystallographic (EC) methods can be used to study the microporous structures, while electron tomography (ET) is commonly used to characterize the mesopores. The development of new TEM techniques has greatly facilitated the discovery of new complex zeolite materials and improvement of the properties and functionalities of existing zeolite materials.
In this review, we present different electron microscopic techniques and their applications for structure characterization of zeolites and mesoporous zeolite materials. We focus on transmission electron microscopic techniques, including electron diffraction, HRTEM/STEM imaging and electron tomography. Both the basics and new developments for each technique will be described. We will demonstrate how various electron microscopic methods are chosen and used for solving different structural problems in zeolite materials.
2. Transmission electron microscopy methods
2.1 High-resolution transmission electron microscopy (HRTEM)
High-resolution transmission electron microscopy (HRTEM) is one of the most common imaging techniques used for studying microporous materials at atomic scale. HRTEM images could be obtained in a TEM with a highly coherent electron beam source, stable optics and lenses with low aberrations. HRTEM images provide a direct, intuitive representation of the object in real space. Comparing to diffraction methods which average many, similar unit cells in an area about a few hundred of nanometers or more, information from HRTEM is local and reveals the local structure projection of the object. HRTEM is therefore very useful for studying non-crystalline materials or crystals with defects.It is important to note that HRTEM images are usually not directly interpretable in terms of structure projection due to various reasons, including dynamical effects and non-linear effects when the electron waves are combined to form an image.3 These effects are more dominant for thick samples (>50 nm). To facilitate image interpretation, it is always recommended to use as thin samples as possible for HRTEM. More significantly, the contrast of HRTEM images changes with the imaging conditions, especially the focus of the objective lens (Fig. 2). At different defocus values, the objective lens of a TEM transfers the structure to an HRTEM image differently, changing the contrast of the image dramatically. The effects of defocus and other optical parameters on an HRTEM image can be represented by a contrast transfer function (CTF) T(u):
T(u) = D(u)![[thin space (1/6-em)]](https://www.rsc.org/images/entities/char_2009.gif) sin sin![[thin space (1/6-em)]](https://www.rsc.org/images/entities/char_2009.gif) χ(u) = D(u) χ(u) = D(u)![[thin space (1/6-em)]](https://www.rsc.org/images/entities/char_2009.gif) sin(πελu2 + ½πCsλ3u4) sin(πελu2 + ½πCsλ3u4) | (2.1) |
| I(u) = T(u)F(u) | (2.2) |
Eqn (2.2) shows that the phases of F(u) and I(u) are the same if T(u) > 0, and differ by 180° if T(u) < 0. An HRTEM image can be interpreted directly in terms of the structure projection only if it is taken under the optimum defocus conditions (i.e. near the Scherzer defocus) where T(u) ≈ −1. For HRTEM images taken under other conditions, the crystallographic structure factors F(u) can be obtained from the HRTEM image by CTF compensation according to eqn (2.2), where the CTF is calculated according to eqn (2.1) and its effects are removed from the Fourier transform of the image. The defocus and astigmatism values required to calculate T(u) can be determined from the Fourier transform of the HRTEM image, if there exists an amorphous region on the crystal.3
The CTF compensated image can be further improved by imposing the symmetry by crystallographic image processing, which is especially helpful for HRTEM images of periodic objects with low signal to noise ratios, where the image quality can be improved by averaging the unit cells and imposing the symmetry.3
In recent years, the development of aberration correctors pushed the resolution limit of TEM to the sub-Ångström level.4 Aberration correctors allow in principle easier HRTEM imaging of zeolites due to the improved resolution limit. However, a major limitation of the image resolution for zeolite materials is electron beam damage, not the TEM itself. Nevertheless, the negative spherical-aberration imaging mode, which is made available by the aberration correctors, could provide structural images of zeolites with improved resolution.5
HRTEM images of zeolites are usually recorded at low electron dose in order to reduce electron beam damage, resulting in low signal-to-noise ratio and low resolution. To improve image quality, multiple exposures of the same crystal area can be made at the Scherzer defocus condition and later averaged after sample drift correction.6 It is however difficult to reliably find the Scherzer defocus conditions experimentally. Instead, through-focus images consisting around 5–20 images can be collected starting from a random focus. These images are post-processed to correct for the sample drift during the exposures, compensate for the aberrations, and reconstruct a structure projection image with much higher resolution and signal-to-noise ratio.7,8
One limiting factor for imaging beam sensitive materials is the low detective quantum efficiency (DQE) of the detector. Recent developments of direct-detection cameras provide new possibilities to image samples using extremely low electron dose.9 This has led to several important breakthroughs in structural biology.10 Recently the use of direct detection cameras has made it possible to image beam sensitive materials such as zeolites and metal organic frameworks (MOFs) with a remarkably high quality.11,12
2.2 Scanning transmission electron microscopy (STEM)
In a TEM, imaging can also be achieved by focusing the electron beam into a spot and scanning it across a specimen in a raster pattern.13 At each probe position, bright-field and annular dark-field (ADF) detectors positioned below the specimen can record integrated intensities from the transmitted un-scattered and scattered electrons, respectively. The dark-field detectors are usually ring detectors with large apertures that collect electrons at high scattering angles (≫10 mrad). By using a short camera length of the microscope, it can be ensured that only electrons scattered to angles much higher than those of the Bragg diffractions are collected. The resulting images are called high-angle annular dark-field (HAADF)-STEM images.For HAADF-STEM imaging, the resolution (d) of the images under optimum imaging conditions is limited by the aberrations of the objective lens that focuses the electrons onto the specimen:
| d = 0.43λ3/4Cs1/4 | (2.3) |
Significant progress in developing aberration correctors for TEM has been made in recent years and commercial TEMs with probe correctors are now available. The resolution of HAADF-STEM images has been pushed down to the sub-Ångström level and makes it easier to image atomic columns using STEM imaging.
HAADF-STEM images are formed by Rutherford-scattered electrons and the theoretical contrast of the images is proportional to Z2, where Z is the atomic number. Compared to HRTEM images, the contrast of HAADF-STEM images is stronger and much easier to interpret. The sensitivity of the HAADF-STEM images to the atomic numbers makes HAADF-STEM very useful for visualizing metal nanocatalysts in zeolites which would be otherwise very difficult by HRTEM. With aberration correctors, HAADF-STEM is demonstrated to be capable of imaging small Ag clusters in a zeolite-A matrix.14 and even single site-isolated Pt atoms in K-LTL zeolites15 as shown in Fig. 3.
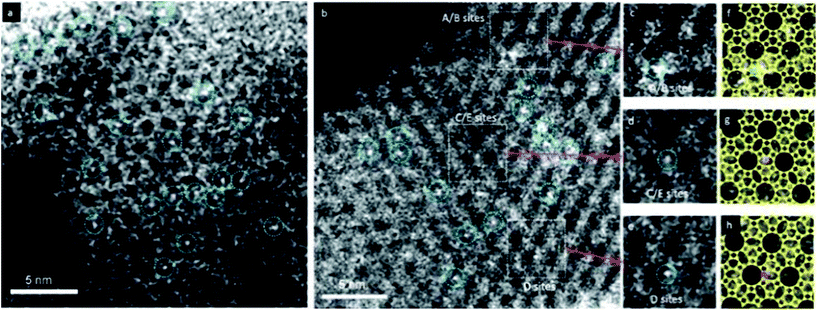 | ||
| Fig. 3 HAADF-STEM images showing site-isolated Pt atoms in K-LTL zeolite in the (a) oxidized and (b) as-prepared samples. White features in dashed blue circles indicate Pt atoms. Magnified views (c–e) of the highlighted regions in (b), containing one Pt atom each at A/B sites in (c), at C/E sites in (d), and at D sites in (e). Simulations (f–h) of the LTL zeolite in the [110] direction superimposed on the magnified views in (c–e), showing Pt atoms (green) at A/B sites in (f), at C/E sites in (g) (purple), and at D sites in (h) (red).15 | ||
As an alternative to HAADF-STEM that uses electrons at high scattering angles for imaging and gives higher contrast for heavier atoms one can place an annular detector at lower angles (still excluding the central ∼10 mrad) and use it to collect electrons. This technique is called annular bright field STEM (ABF-STEM). The contrast of such images carries information about both light and heavy elements. ABF-STEM has shown to be powerful for imaging light elements (e.g. oxygen).16
As the focused electron beam scans across the sample to form a STEM image, EDX and EELS signals can be collected simultaneously. This allows for the collection of spectroscopic and elemental mapping with high-spatial resolution (up to atomic resolution).
Electron beam damage is an important factor that limits the application of STEM imaging of zeolites at atomic resolution, because of the high intensity of the focused electron probe. Other obstacles in STEM imaging includes sample contamination, due to the high electron beam intensity, as well as geometric distortions and blurring arising due to sample drift during the exposure, as a full STEM scan usually takes seconds.
2.3 3D reconstruction of HRTEM and STEM images
HRTEM and STEM images are only 2D projections of the 3D structure. In order to determine a crystal structure in 3D, it is necessary to combine images from different projections. 3D reconstruction of a crystal structure is essentially the determination of crystallographic structure factors of the crystal. The structure factor phase and amplitude are directly available from the Fourier transform of a structural image taken at the Scherzer defocus from a thin crystal. In cases where HRTEM images are taken at other defocus conditions, it is necessary to perform image processing to compensate for the effects of the CTF and recover the structural image as described above.3Once the structure factor amplitudes and phases are determined from 2D images in different projections, a 3D map can be obtained by Fourier summation of the structure factors for all reflections, according to:3
 | (2.4) |
Atomic positions and atomic types can be identified from the reconstructed 3D map. The number of projections needed for a 3D structure determination depends on the symmetry of the crystal and how the strong reflections are distributed. For solving a structure, it is enough to obtain the structure factor amplitudes and phases of symmetry-independent strong reflections. Weak reflections contribute much less to the potential map than strong reflections do. Other symmetry-related reflections can be generated according to the symmetry. The higher the symmetry, the fewer number of projections is needed for a complete structure determination.
A number of complex zeolite structures have been solved by 3D reconstruction from HRTEM images. It is demonstrated that 3D reconstruction using HAADF-STEM images and HRTEM images yields similar results, as shown in Fig. 4.17 It should be mentioned that 3D reconstruction from HRTEM and STEM images is rather demanding and often requires extensive experimental work by well-trained electron microscopists to take many good images at atomic resolution. For determination of the 3D structures of nano-sized crystals without disorder, the recently developed 3D electron diffraction methods are much more preferred, as will be shown later. However, 3D reconstruction of HRTEM and STEM images remains valuable when a crystal is heavily disordered and only very small perfect areas can be found in the crystal. One such an example is the structure of zeolite ITQ-39, as determined from two projections of HRTEM images extracted from perfect areas of only a few unit cells in size in heavily disordered crystals.18
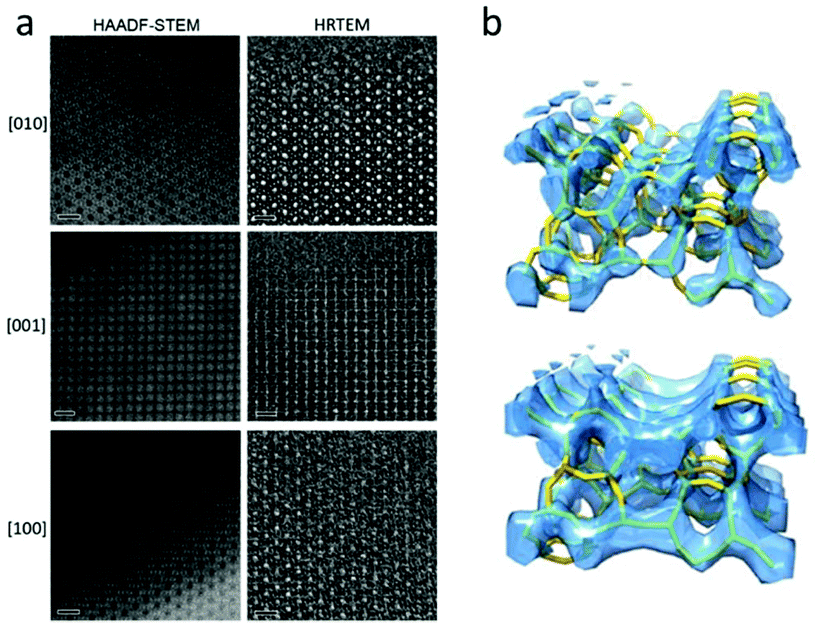 | ||
| Fig. 4 (a) Aberration-corrected HAADF-STEM images (left) and HRTEM images (right) of zeolite silicalite-1 taken along the three main zone axes [010], [001] and [100]. The scale bars are 2 nm. Note that the contrast is reversed between the HAADF-STEM and the HRTEM images. The pores are black in the HAADF-STEM images and white in the HRTEM images. (b) Reconstructed 3D map from the HAADF-STEM images (top) and the HRTEM images (bottom), with the structure model inserted.17 | ||
2.4 Electron diffraction (ED)
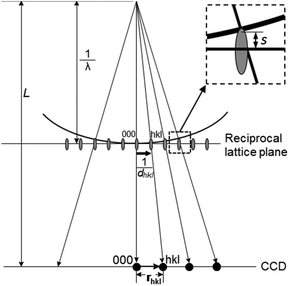
Electron diffraction is an important technique for phase identification, determination of orientation relationship of crystals down to a few nanometers in size as well as determination of unknown crystal structures.3 In an electron diffraction pattern, the positions of diffraction spots depend on the unit cell parameters, lattice type and crystal orientation. Thus, electron diffraction can be used for the determination of unit cell parameters and lattice type, from which the possible phases can be identified.3 If the crystal structure is known, electron diffraction can be used for determination of the crystal orientation.19 For intergrown crystals, electron diffraction can be used for determination of the orientation relationship of two crystals. The intensities of the diffraction spots are related to the arrangements of the atoms within the unit cell – the atomic positions. If ED patterns are taken from thin enough crystals (typically <500 nm for zeolites) – so that dynamical effects are not very severe, atomic positions of better than 0.10 Å in accuracy can be achieved.20 The symmetry of the diffraction pattern is related to the crystal symmetry. It is possible to determine the crystal symmetry and in most cases the space group from the intensity distribution of the diffraction spots.3 Conventionally, single zonal 2D ED patterns were used for structural characterization. Significant developments and applications in 3D electron diffraction methods have been made in recent years and proved superior in structure characterization compared to the conventional 2D electron diffraction.| dhkl = Lλ/rhkl | (2.5) |
Information about the atomic arrangements in a structure is embedded in the ED intensities. It is possible to solve unknown zeolite structures from the ED intensities extracted from a few zonal ED patterns of the zeolites. For example, the structure of a large-pore, high-silica zeolite SSZ-48 was solved and refined using intensities extracted from 11 zonal ED patterns.21 However, the quality of intensities from zonal ED patterns is rather low for structure characterization due to the dynamical effects and excitation errors (Fig. 5). Therefore, structure solution of novel zeolites based on intensities from zonal ED patterns is rare.
In order to obtain ED patterns with more kinematical intensities and higher resolution, the electron beam can be tilted away from the zone axis. This is the idea behind precession electron diffraction (PED), in which the electron beam is precessed in a hollow cone around the optical axis,22 by using either dedicated hardware or software. The angle between the electron beam and the optical axis is usually 1–4°. The resultant ED pattern is an average of the ED patterns from all different beam directions. Compared to conventional zonal ED patterns, PED patterns are less dynamical because fewer reflections are excited at the same time. Tilting the beam away from the zone axis allows reflections to be integrated through Bragg conditions and higher resolution reflections to be recorded. Although intensities from zonal PED patterns alone have been demonstrated to be feasible for structure solution of zeolites,23 additional information from PXRD is often required. PED intensities can be used to either solve structure projections or repartition overlapping peak intensities for PXRD data.24
Over the last decade, there have been several important breakthroughs in the development of new methods to facilitates 3D electron diffraction data collection. Early approaches for 3D electron diffraction data collection are the automated diffraction tomography (ADT)25 and rotation electron diffraction (RED).26,27 Both methods can be used to collect almost complete 3D ED data using a combination of crystal tilt in discrete steps and fine control of the electron beam. ADT usually uses discrete goniometer tilts in small steps (∼1.0°) combined with continuous PED to cover the reciprocal space. RED combines discrete goniometer tilt steps (typically 2–3°) with very fine steps of beam tilt, typically 0.05–0.20°. Both methods have shown to be successful in structure determination of new zeolite materials, see Table 1. The collection of one 3D data set using this stepwise approach takes around one hour.
| Name | Code | Channel system | Max ring | Method(s) for structure solution | Year |
|---|---|---|---|---|---|
ITQ-38![[thin space (1/6-em)]](https://www.rsc.org/images/entities/char_2009.gif) 55 55 |
ITG | 3D | 12 | HRTEM + modelling | 2012 |
SSZ-52![[thin space (1/6-em)]](https://www.rsc.org/images/entities/char_2009.gif) 6 6 |
SFW | 3D | 8 | HRTEM + modelling | 2013 |
SSZ-61![[thin space (1/6-em)]](https://www.rsc.org/images/entities/char_2009.gif) 56 56 |
-SSO | 1D | 18 | HRTEM + modelling | 2014 |
IM-5![[thin space (1/6-em)]](https://www.rsc.org/images/entities/char_2009.gif) 58,59 58,59 |
IMF | 3D | 10 | HRTEM + PRXD or 3D reconstruction of HRTEM | 2007 |
ITQ-39![[thin space (1/6-em)]](https://www.rsc.org/images/entities/char_2009.gif) 18 18 |
-ITN | 3D | 12 | 3D reconstruction of HRTEM | 2012 |
ECNU-5![[thin space (1/6-em)]](https://www.rsc.org/images/entities/char_2009.gif) 60/SSZ-70 60/SSZ-70![[thin space (1/6-em)]](https://www.rsc.org/images/entities/char_2009.gif) 61 61 |
*-SVY | 2D | 14 | 3D reconstruction of HRTEM/HRTEM + PXRD + NMR | 2015/2017 |
TNU-9![[thin space (1/6-em)]](https://www.rsc.org/images/entities/char_2009.gif) 62 62 |
TUN | 3D | 10 | HRTEM + PXRD | 2006 |
SSZ-74![[thin space (1/6-em)]](https://www.rsc.org/images/entities/char_2009.gif) 63 63 |
-SVR | 3D | 10 | HRTEM + PXRD | 2008 |
SU-78![[thin space (1/6-em)]](https://www.rsc.org/images/entities/char_2009.gif) 64 64 |
3D | 12 | HRTEM + SXRD | 2012 | |
ITQ-40![[thin space (1/6-em)]](https://www.rsc.org/images/entities/char_2009.gif) 65 65 |
-IRY | 3D | 16 | ED | 2010 |
ITQ-26![[thin space (1/6-em)]](https://www.rsc.org/images/entities/char_2009.gif) 66 66 |
IWS | 3D | 12 | ED + PRXD | 2008 |
ITQ-37![[thin space (1/6-em)]](https://www.rsc.org/images/entities/char_2009.gif) 67 67 |
-ITV | 3D | 30 | ED + PRXD | 2009 |
ITQ-43![[thin space (1/6-em)]](https://www.rsc.org/images/entities/char_2009.gif) 68 68 |
3D | 28 | ADT | 2011 | |
ITQ-51![[thin space (1/6-em)]](https://www.rsc.org/images/entities/char_2009.gif) 69 69 |
IFO | 1D | 16 | RED | 2013 |
IM-17![[thin space (1/6-em)]](https://www.rsc.org/images/entities/char_2009.gif) 70 70 |
UOV | 3D | 12 | ADT | 2014 |
EMM-23![[thin space (1/6-em)]](https://www.rsc.org/images/entities/char_2009.gif) 71 71 |
*-EWT | 3D | 24 | RED | 2014 |
PKU-16![[thin space (1/6-em)]](https://www.rsc.org/images/entities/char_2009.gif) 72 72 |
POS | 3D | 12 | RED | 2014 |
PKU-14![[thin space (1/6-em)]](https://www.rsc.org/images/entities/char_2009.gif) 73 73 |
3D | 12 | RED + PXRD | 2014 | |
PST-6![[thin space (1/6-em)]](https://www.rsc.org/images/entities/char_2009.gif) 74 74 |
PSI | 1D | 10 | RED | 2014 |
ERS-18![[thin space (1/6-em)]](https://www.rsc.org/images/entities/char_2009.gif) 75 75 |
EEI | 2D | 8 | RED + PXRD | 2014 |
ITQ-53![[thin space (1/6-em)]](https://www.rsc.org/images/entities/char_2009.gif) 76 76 |
-IFT | 3D | 14 | RED | 2015 |
ITQ-54![[thin space (1/6-em)]](https://www.rsc.org/images/entities/char_2009.gif) 77 77 |
-IFU | 3D | 20 | RED | 2015 |
CIT-7![[thin space (1/6-em)]](https://www.rsc.org/images/entities/char_2009.gif) 78 78 |
CSV | 2D | 10 | RED + PXRD | 2015 |
SSZ-87![[thin space (1/6-em)]](https://www.rsc.org/images/entities/char_2009.gif) 79 79 |
IFW | 3D | 10 | RED + PXRD | 2015 |
ZSM-25![[thin space (1/6-em)]](https://www.rsc.org/images/entities/char_2009.gif) 38 38 |
MWF | 3D | 8 | RED | 2015 |
PST-20/25/26/28![[thin space (1/6-em)]](https://www.rsc.org/images/entities/char_2009.gif) 38,80 38,80 |
3D | 8 | RED | 2015/2016 | |
CIT-13![[thin space (1/6-em)]](https://www.rsc.org/images/entities/char_2009.gif) 81 81 |
*CTH | 2D | 14 | RED | 2016 |
ITQ-58![[thin space (1/6-em)]](https://www.rsc.org/images/entities/char_2009.gif) 82 82 |
2D | 8 | Fast-EDT | 2016 | |
EMM-26![[thin space (1/6-em)]](https://www.rsc.org/images/entities/char_2009.gif) 83 83 |
EWS | 2D | 10 | RED | 2016 |
ZSM-43![[thin space (1/6-em)]](https://www.rsc.org/images/entities/char_2009.gif) 39 39 |
MRT | 2D | 8 | RED + HRTEM | 2017 |
SCM-14![[thin space (1/6-em)]](https://www.rsc.org/images/entities/char_2009.gif) 84/ITQ-62 84/ITQ-62![[thin space (1/6-em)]](https://www.rsc.org/images/entities/char_2009.gif) 85 85 |
SOR | 3D | 12 | RED/Fast-EDT | 2017/2018 |
STA-20![[thin space (1/6-em)]](https://www.rsc.org/images/entities/char_2009.gif) 86 86 |
SWY | 3D | 8 | ED + PXRD + STEM | 2017 |
IM-18![[thin space (1/6-em)]](https://www.rsc.org/images/entities/char_2009.gif) 50 50 |
*UOE | 3D | 10 | RED + HRTEM | 2018 |
SYSU-3![[thin space (1/6-em)]](https://www.rsc.org/images/entities/char_2009.gif) 87 87 |
3D | 24 | cRED | 2018 | |
PST-13/14![[thin space (1/6-em)]](https://www.rsc.org/images/entities/char_2009.gif) 88 88 |
POR | 3D | 8 | cRED | 2018 |
AlPO-78![[thin space (1/6-em)]](https://www.rsc.org/images/entities/char_2009.gif) 89 89 |
2D | 8 | HRTEM + modelling | 2018 |
Over the recent years a new approach for collection of 3D ED data has been developed by several groups in parallel. In all cases, the goniometer is continuously rotated around a tilt axis during the acquisition of ED frames. Each ED frame covers an angular range that is determined by the rotation speed of the goniometer and the exposure time. Different from the stepwise rotation in ADT and RED, continuous rotation electron diffraction records integrated intensities of reflections. The method is developed under different names; MicroED,28–31 fast EDT32 and continuous rotation electron diffraction, cRED.33 An important advantage of continuous rotation approach is that the data collection time can be greatly reduced (0.5–5 min). This is reflected by the fact that the methods were developed in labs working with electron beam sensitive materials and proteins. The continuous rotation data collection can be adapted to conventional TEM setups. The data quality and data collection speed are further increased by using a sensitive hybrid ED detector with a fast readout speed.
ED frames collected by above mentioned 3D approaches can be processed and used to reconstruct the 3D reciprocal lattice of a crystal, from which the unit cell parameters can be easily determined. Slices perpendicular to main zone axes can be cut from the 3D reciprocal lattice and used for identification of the reflection conditions, which in turn are used to deduce the space group. Intensities of the reflections are extracted and output together with the indices for structure solution and refinement using crystallographic software. Existing data processing software developed for single crystal X-ray diffraction, such as XDS34 and Dials35 have been adapted to electron diffraction data and used for unit cell and space group determination, as well as for generating the intensity data input files for structure determination. A schematic representation of structure determination by RED is given in Fig. 6.
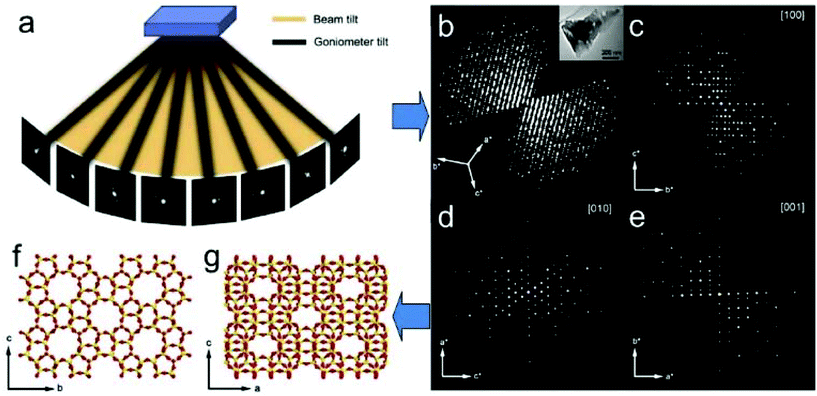 | ||
| Fig. 6 Schematic representation of ab initio structure determination by the rotation electron diffraction (RED) method. (a) RED data (individual ED frames) are collected by combining beam tilt and goniometer tilt. (b) Reconstructed 3D reciprocal lattice and (c–e) main zone axes cuts. After further data processing the unit cell is determined and the reflections are indexed. A resultant hkl list is then used for determination of the atomic structure (f and g) of the crystals (here zeolite silicalite-1).37 | ||
Recently a new and fully automated ED method, called serial electron diffraction (SerialED), was developed.36 In SerialED, individual crystals of arbitrary orientations are located automatically by software, and single 2D ED pattern is taken from each of the crystals. In such a way, a large number of crystals, up to 3500 per hour, can be screened. After orientation finding the ED patterns are merged to a 3D data set. This method has shown to be powerful for structure determination and phase analysis of beam sensitive materials, such as zeolites.36
The 3D ED methods have shown to be very powerful for structure determination of polycrystalline zeolite crystals that are too small to be studied by single crystal X-ray diffraction,37 including both new zeolites and zeolites that were previously discovered but remained unsolved.38,39 Among the over 50 new zeolite structures that have been published since 2010, more than 27 were solved by 3D ED alone or in combination with other techniques, see section 3.2.2 for more details. Today collection and processing of cRED data can be performed on a routine basis in several groups. Despite the relatively high R-values due to dynamical scattering and other effects, 3D ED data behave like single crystal X-ray diffraction data and can be used in a similar way for structure solution and refinement using existing software developed for SXRD. The main difference is that atomic scattering factors for electrons are used instead for those for X-rays. The resolution and accuracy of the 3D ED data are nearly comparable to those of X-ray diffraction.38 The 3D ED method has become one of the most important method for structure determination of polycrystalline zeolite materials.
2.5 Electron tomography (ET)
Although HRTEM and HAADF-STEM images can reach atomic resolution, they are only 2D projections. To obtain 3D information it is necessary to combine images from different projections, as described earlier. For non-periodic objects, such as hierarchical zeolites and zeolites containing defects, it is not possible to obtain a complete 3D structure using images from only a few projections or combining images from different particles. Instead, electron tomography (ET) should be applied. Electron tomography is a method for reconstructing the interior of an object from TEM images (TEM images and STEM images, etc.) taken along different directions. It is normally collected by tilting the particle along a tilt axis with a small angle increment and recording an image at each angle. These images can be used for tomographic reconstruction to recover a 3D volume, called tomogram, from which the 3D structure of the particle can be determined, as illustrated in Fig. 7.40,41 Common reconstruction methods include the real space back-projection and iterative methods. Electron tomography has become a powerful tool for studying zeolite crystals, especially zeolites containing mesoporosity and metal nanocatalysts.42 Here we will give a brief introduction about the principles of electron tomography, followed by the practical considerations of applying ET in characterization of porous materials. Later, we will present a few recent examples of the applications of electron tomography on mesoporous zeolites.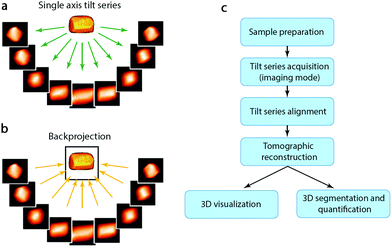 | ||
| Fig. 7 (a) A tilt series of images of a 3D object are recorded as projections and (b) then back-projected to retrieve the 3D volume. (c) Steps involved in an ET experiment from sample preparation to 3D visualization and quantification.41 | ||
The resolution of tomography is different in different directions and is affected by various parameters. For a single-axis tilt series, the resolution along the tilt axis is the same as the original image. The resolution perpendicular to the tilt axis and electron beam is limited by the diameter (D) of the reconstructed volume and the number of projections (N) used. Assuming the projections are taken over an angular range of ±90° with fixed angle increments, the theoretical resolution d is expressed as:
| d = πD/N | (2.6) |
In practice, data collection is usually limited to about ±75° around a single tilt axis because the tilt of the sample holder is restricted by the limited space between the objective pole pieces of the microscope. In addition, the object may be blocked at high tilt angles by the holder itself or by other nearby objects. The missing data due to the limited tilt range is called the missing wedge in electron tomography. It causes elongation in the reconstructed tomogram and reduction of the resolution along the electron beam direction.
Tomographic reconstruction is based on the assumption that the images are the Radon transforms of the 3D object. In other words, the contrast of the images is linear to the projected thickness and mass of the 3D object, this is referred to as the projection requirement. Bright-field TEM images from non-crystalline samples have more or less mass-thickness contrast. Therefore, applications of tomographic reconstruction on TEM images have proven successful. For crystalline materials, however, the contrast of the images may have contribution from diffraction if some reflections happen to be in Bragg conditions. The presence of this diffraction contrast can reduce the resolution and quality of the tomographic reconstruction. STEM images can also be used for electron tomography. The contrast of a HAADF-STEM image is directly related to the atomic number Z and not affected by diffraction contrast caused by crystal orientation compared to that of the bright-field TEM images. In principle, higher quality tomographic reconstruction could be achieved using HAADF-STEM images than using bright-field TEM. Such advantage has led the STEM tomography to atomic resolution in recent developments.43–48
As shown in Fig. 7, the reconstructed ET tomogram can be both visualized to examine the structure and used for quantification. In the applications of ET on zeolites, not only can the 3D distribution of metal nanocatalysts and mesopores in a zeolite particle be determined, but also their sizes can be quantified. For quantification, however, care should be taken when interpreting the results. The contrast of both bright-field TEM images and HAADF-STEM images changes with the focus conditions and it is important to use consistent focus settings throughout data collection. It is often difficult to find the right threshold for the segmentation of the tomograms and measurements from other techniques may help to achieve a reliable quantification.
An alternative approach for studies of the 3D structure of a materials is in-line holography. This approach is based on a through-focus series of HRTEM images acquired and the exit wave reconstruction, which enables reconstruction of the atomic structure in 3D.49
3. Structural study of new zeolites by electron crystallography
Electron crystallography has been gradually established as an essential alternative for studying the structures of porous materials, notably, zeolites. Since 2006, at least 40 new zeolite structures have been reported as solved by electron crystallography alone or in combination with other techniques, as summarized in Table 1. Nowadays, high resolution transmission electron microscopy and electron diffraction are the two main techniques of electron crystallography for determination of zeolite structures.With HRTEM images, the atomic arrangements in a crystal and possible disorders can be directly visualized. Thus, HRTEM could both serve as a primary tool for structure determination, and assist with useful information. HRTEM is especially useful for studying zeolite crystals that contain disorders such as stacking faults, twinning and intergrowth.18,50
ED is an important technique for phase identification and determination of crystal orientation, for crystals down to a few nanometers in size. Unit cell and space group information, as well as intensities of reflections can also be obtained from ED patterns, which can be used for structure solution of novel zeolites. Because ED requires a much lower electron dosage on the sample than HRTEM does, it causes less structural damage of the sample. Thus ED is more suitable than HRTEM and STEM for investigating beam sensitive zeolites.
Here, we present several examples to demonstrate the applications of these two methods in zeolite structural study.
3.1 Structure determination of zeolites by high resolution transmission electron microscopy (HRTEM)
![[thin space (1/6-em)]](https://www.rsc.org/images/entities/char_2009.gif) 53 and SSZ-31.54 Here we present examples of recent structure determination of three new zeolites ITQ-38
53 and SSZ-31.54 Here we present examples of recent structure determination of three new zeolites ITQ-38![[thin space (1/6-em)]](https://www.rsc.org/images/entities/char_2009.gif) 55 SSZ-61
55 SSZ-61![[thin space (1/6-em)]](https://www.rsc.org/images/entities/char_2009.gif) 56 and IZE-FER57 by combining HRTEM and model building.
56 and IZE-FER57 by combining HRTEM and model building.
ITQ-38 is a germanosilicate zeolite synthesized using the dicationic piperidine-derivatives as the organic structure directing agents (OSDAs).55 The unit cell and space group were first obtained from high-resolution PXRD data. However, peak overlapping and the presence of stacking faults in the crystals precluded the structure solution solely from the PXRD data. HRTEM images taken along the [010] and [101] directions were then used for the structure solution of the ITQ-38 framework. The structure projection image was reconstructed from 20 through-focus HRTEM images of ITQ-38 along [010] using the software QFOCUS,8 which indicated 10- and 12-ring channels along this direction. In addition, regions with 8- and 12-ring channels were also found in the HRTEM images along [010], which were identified as the zeolite ITQ-22. The perfect intergrowth of ITQ-22 and ITQ-38 indicates that the two zeolites contain the same building layer, but with different stackings. Based on such information, a structural model of ITQ-38 was built, which was later confirmed by HRTEM images from [101], electron diffraction and Rietveld refinement from PXRD data. ITQ-38 contains inter-connected 10- and 12-ring channels along three directions. While the building layers in the ITQ-38 framework are related by an inversion center, those in ITQ-22 are related by a glide plane.
The structure determination of the high silica zeolite SSZ-61 presents another example of this approach.56 SSZ-61 has an unusual framework structure with extra-large dumbbell-shaped pore openings. The unit cell was initially obtained by electron diffraction and PXRD (a = 25.03 Å, b = 5.30 Å, c = 19.99 Å, β = 104.5°) and has a short b-axis, which indicates that the structure contains only one-dimensional channels along the b-axis.90 The structure projection reconstructed from 20 through-focus HRTEM images taken along the b-axis shows large elongated pores delimited by 4-, 5- and 6-rings (Fig. 8a). Furthermore, intergrowth of SSZ-61 with a 12-ring MTW structure was also identified from the image (Fig. 8b). Based on this information, three potential structural models were constructed, as shown in Fig. 8c–e. All the models contain the same building layer similar to that in the MTW framework, which are connected by pairs of 5-rings. Finally, the structural model C was confirmed to be the correct one by 29Si MAS NMR and Rietveld refinement, as well as by taking into account the size of the OSDA in the pore. The b-axis is doubled in the model C, where the Si atoms pointing to the channel are connected to one another directly in a pairwise manner along the channel wall (Fig. 8c). Each of these Si atoms is connected to a terminal OH− group, which offers the possibility of inserting a catalytically active center in the channel between the terminal O atoms in place of H+.
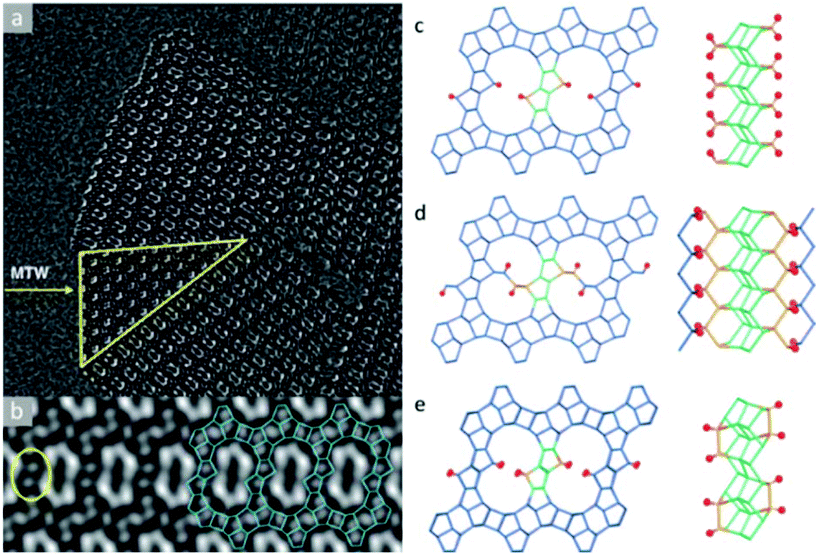 | ||
| Fig. 8 Images of SSZ-61 reconstructed from a series of through-focus HRTEM images and the proposed structural models. (a) The reconstructed structure projection from 20 HRTEM images along the [010] direction, where the yellow triangle showed an MTW-type intergrowth. (b) Lattice averaged image viewed along the channel direction highlighting the connecting rings (yellow) and a possible arrangement (blue) of 4-, 5- and 6-rings around the large pore. Structural models for SSZ-61: (c) model A with Q2 Si atoms, (d) model B with two 12-ring channels, and (e) model C with 18-ring dumbbell-shaped channels.56 | ||
The third example, IEZ-FER, is an interlayer expanded zeolite (IEZ) synthesized using a 2D FER-type layered silicate as a precursor.57 IEZs show physical and chemical properties comparable to zeolites, but with larger pore windows and functional groups. However, structural study of such materials by X-ray diffraction is challenging due to the small particle size and the presence of stacking faults in the crystals. HRTEM provides direct evidence of both the expansion of the 2D zeolite interlayers and the presence of stacking faults, and is powerful for investigation of such materials. Because IEZ-FER was prepared by treating an FER-type precursor with diethoxydimethylsilane, the structural model was assumed containing the FER layers, while how these layers are connected was yet to be confirmed. HRTEM images of the calcined IEZ-FER were taken, which showed that the pillaring of the T sites in the interlayer space leads to a 3D framework with 12- and 10-ring channels along the [001] and [010] directions, respectively. The pentasil layer, which is identical to the layer of FER, could be clearly seen from the HRTEM images. Besides, some defects were also observed in HRTEM images which are formed by a 1/2b shift of the FER layer.
![[thin space (1/6-em)]](https://www.rsc.org/images/entities/char_2009.gif) 18 and IM-5
18 and IM-5![[thin space (1/6-em)]](https://www.rsc.org/images/entities/char_2009.gif) 59 and zeolite beta polytype B.91
59 and zeolite beta polytype B.91
The complex intergrown zeolite ITQ-39 with a three-dimensional intersecting pairwise 12-ring and 10-ring pore system18 was solved by 3D reconstruction of HRTEM images. ITQ-39 exhibited very promising results in alkylation of aromatics with olefins. Its PXRD pattern shows peak broadening caused by stacking faults and intergrowth of nano-sized domains. Structure projection images of ITQ-39 along [010] and [100] were reconstructed from the through-focus series of 20 HRTEM images (Fig. 9a and b), which show that the crystal domains are only a few unit cells in size. Large pairwise 12-ring channels and small twin domains could be clearly observed along [010] (Fig. 9a). The 10-ring channels stacked in the c*-direction and stacking faults could be observed from the images along [100] (Fig. 9b). The structure factor amplitudes and phases were extracted from the Fourier transforms of the small domains marked in Fig. 9a and b. A 3D electrostatic potential map was reconstructed from the 53 strongest reflections (Fig. 9c), from which all 28 unique Si atoms could be located. The structures of two other polytypes ITQ-39A and ITQ-39C were deduced from ITQ-39B based on the stacking sequences observed in Fig. 9b.
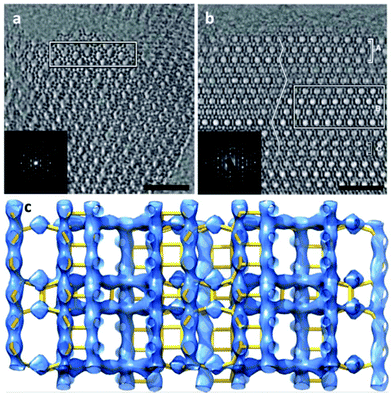 | ||
| Fig. 9 Structure projection images reconstructed from 20 HRTEM images along (a) [010] and (b) [100] of ITQ-39. 10-ring channels are observed in (b), and the channel stacking is traced by a line in (b). The domains used for structure factor determination are outlined by the rectangles. (c) The 3D electrostatic potential map reconstructed from the structure factor amplitudes and phases extracted from the marked nano domains in (a) and (b).18 | ||
The first example that PXRD and HRTEM data were combined for structure determination is the high-silica zeolite TNU-9 with 3D 10-ring channels.62 High quality HRTEM images of TNU-9 were recorded along the [010], [001] and [−110] directions. Although the projection along [010] is similar to that of MFI, attempts to solve the structure by model building based on these images failed. The zeolite-specific structure solution program FOCUS92 was applied on the PXRD data, however, no reasonable solution was obtained. By using the structure factor phases (in total 258) obtained from the HRTEM images taken along the three projections as the starting phases to the program FOCUS, the structure solution was found. The framework of TNU-9 contains 24 symmetry-independent Si atoms, which was then the most complex zeolite structure solved.
The high-silica zeolite IM-5 with 2D 10-ring channels58 is an important catalyst for hydrocarbon cracking and NO reduction. Its properties could not be fully understood without the detailed crystal structure information. The large unit cell (a = 14.299 Å, b = 57.413 Å, and c = 20.143 Å) makes it difficult to solve the structure by PXRD alone using standard ab initio structure solution methods. HRTEM images were taken along the three main zone axes of IM-5 (Fig. 10a–c), from which a rough structural model was built. 95 structure factor phases calculated from the model these were input in the powder charge-flipping (pCF) algorithm implemented in the program Superflip93 and a structural model with improved bond geometries could be obtained and finally refined against the PXRD data. SSZ-74 is a high silica zeolite with 3D 10-ring channels63 and shows good catalytic properties for a wide variety of reactions. Only one HRTEM image of relatively low resolution taken along [110] was obtained, from which 29 structure factor amplitudes and phases could be derived. Such information was used to construct a structure envelope that defines the full 3D channel system, within which no framework atoms are expected. The structure envelope was imposed in real space in the pCF algorithm to eliminate any electron density in the pores. Finally, the structural model was obtained from the PXRD data using the pCF algorithm implemented in Superflip. Subsequent Rietveld refinement showed that the structure of SSZ-74 has ordered vacancies which were not observed before in zeolites.
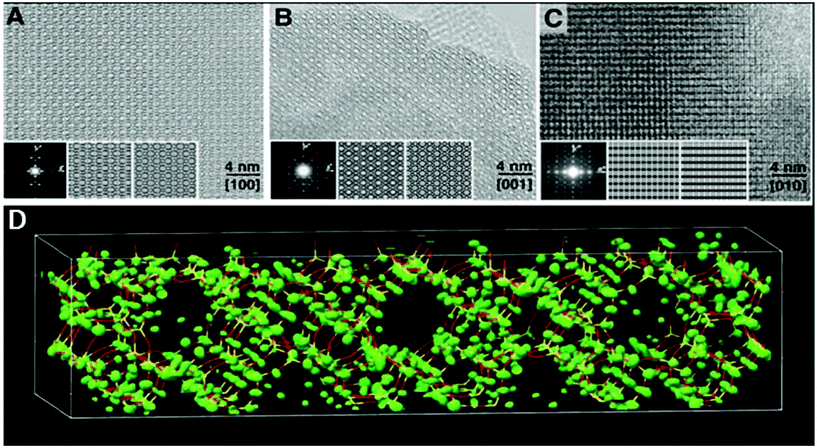 | ||
| Fig. 10 HRTEM images of IM-5 taken along (a) [100], (b) [001] and (c) [010]. (d) Electron density map from pCF that was used to derive the structure of IM-5. A stick model of the final refined structure of IM-5 has been superimposed for comparison.58 | ||
3.2 Structure determination of zeolites by electron diffraction
Such a strategy was applied for solving the structure of a germanosilicate, ITQ-37 (space group P4132/P4332, a = 26.5126(3) Å).67 The high degree of overlapping reflections (>94%) and peak broadening due to the small crystal sizes posed great challenges for the structure determination by PXRD alone. Because ITQ-37 is too electron beam sensitive to obtain high quality HRTEM images, selected area zonal electron diffraction patterns along the [100], [110], [111] and [120] directions were recorded and used for the pre-repartitioning of the overlapping reflections in PXRD. The pCF algorithm implemented in Superflip was applied for the structure solution based on the improved PXRD intensities after pre-repartitioning. Ten unique T atoms and 18 out of the 19 unique oxygen atoms were automatically located from the electron density map. The missing oxygen atom was identified and thus added manually between two T-sites. The final framework structure was confirmed by Rietveld refinement. ITQ-37 is the first chiral zeolite with a gyroidal channel system and extra-large 30-ring pore openings.
For three-dimensional structures, a single projection is usually not sufficient for a complete structure determination. Phases for certain projections could be determined from ED data and then used in combination with PXRD data in the same way as those derived from HRTEM images. For instance, structure factor phases of ITQ-26 were deduced from the integrated ED intensities of 41 hk0 and 17 0kl reflections by maximum entropy and likelihood.66 These phases were used as the constraint for subsequent phasing trials of the PXRD data using the program FOCUS. A structural model of ITQ-26 was found and later refined by Rietveld methods. The structure comprises 7 unique T-sites forming a 3D framework with one straight 12-ring channel along [001] and two 12-ring channels tilted with respect to the straight 12-ring channel.
![[thin space (1/6-em)]](https://www.rsc.org/images/entities/char_2009.gif) 82 and PST-13/14
82 and PST-13/14![[thin space (1/6-em)]](https://www.rsc.org/images/entities/char_2009.gif) 88 by using the continuous rotation technique.
88 by using the continuous rotation technique.
The new borosilicate zeolite ITQ-58 has a 2D 8-ring channel system.82 The material crystallizes in the triclinic space group P![[1 with combining macron]](https://www.rsc.org/images/entities/char_0031_0304.gif) . The low symmetry prevented structure solution from other methods. In order to solve the structure, fast-EDT32 data were collected by using a continuous mechanical tilt of the crystal during acquisition of diffraction patterns. The integration of the continuous tilting of the crystal was complemented by precession electron diffraction. Each data set covered a tilt range of 50° and were collected in ∼30 s. The short acquisition time was important to minimize the electron beam damage. Five data sets from five different crystals were collected and analyzed independently. One of the data sets was identified to be an impurity phase, zeolite STF. From each of the remaining data sets the same triclinic unit cell could be obtained. Due to the low data completeness, it was not possible to obtain a structural model from the individual data sets. After combining the four data sets a merged data set with 41% completeness and 0.88 Å resolution could be obtained. Using direct methods implemented in the software SIR2014,94 a structure solution could be obtained where all 16 Si and 18 out of 32 O atom positions could be obtained. The remaining 14 O atoms could be found after successive difference Fourier map analysis. A least squares refinement resulted in a refinement R1 of 31.9% using 64 restrains on Si–O distances. The final structural model was confirmed by performing a Rietveld refinement resulting in residuals of Rwp = 0.086 and Rexp = 0.027.
. The low symmetry prevented structure solution from other methods. In order to solve the structure, fast-EDT32 data were collected by using a continuous mechanical tilt of the crystal during acquisition of diffraction patterns. The integration of the continuous tilting of the crystal was complemented by precession electron diffraction. Each data set covered a tilt range of 50° and were collected in ∼30 s. The short acquisition time was important to minimize the electron beam damage. Five data sets from five different crystals were collected and analyzed independently. One of the data sets was identified to be an impurity phase, zeolite STF. From each of the remaining data sets the same triclinic unit cell could be obtained. Due to the low data completeness, it was not possible to obtain a structural model from the individual data sets. After combining the four data sets a merged data set with 41% completeness and 0.88 Å resolution could be obtained. Using direct methods implemented in the software SIR2014,94 a structure solution could be obtained where all 16 Si and 18 out of 32 O atom positions could be obtained. The remaining 14 O atoms could be found after successive difference Fourier map analysis. A least squares refinement resulted in a refinement R1 of 31.9% using 64 restrains on Si–O distances. The final structural model was confirmed by performing a Rietveld refinement resulting in residuals of Rwp = 0.086 and Rexp = 0.027.
The two related aluminophosphate molecular sieves, PST-13/14, were synthesized using diethylamine as organic structure-directing agent and has a 3D 8-ring channel system.88 The structure of PST-13 contains five coordinated framework Al atoms with bridged hydroxyl groups. Upon calcination, PST-13 undergoes a transformation to PST-14 with loss of these bridging hydroxyl groups creating a tetrahedral framework. The transition of 5-coordinated to tetrahedral Al species was also confirmed by 27Al NMR. In order to determine the structures of PST-13/14. cRED data was collected using a sensitive Timepix hybrid detector with a read out time of just 8 ms. This minimized the loss of data during the continuous tilt. The cRED data was collected with a tilt speed of 0.45° s−1 and a very low beam dose of ∼0.1 e− Å−2 s−1 (Fig. 11). The space group of both PST-13 and 14 was determined from the cRED data to be P![[4 with combining macron]](https://www.rsc.org/images/entities/char_0034_0304.gif) 21c. The tilt ranges of the data sets used for structure determination was 121° and 130° respectively and with a resolution up to 0.78 Å. The completeness of the data sets were 97.7% and 90.0% following the large tilt range and high symmetry. The structure was solved using the software SIR2014
21c. The tilt ranges of the data sets used for structure determination was 121° and 130° respectively and with a resolution up to 0.78 Å. The completeness of the data sets were 97.7% and 90.0% following the large tilt range and high symmetry. The structure was solved using the software SIR2014![[thin space (1/6-em)]](https://www.rsc.org/images/entities/char_2009.gif) 94 and refined using SHELXL.95 The refinement was performed without the need to use restraints on distances and converged to R1 of 20.1% for PST-13 and 29.9% for PST-14. The final structure of PST13/14 has 8 distinct T-site (T = Al, P) atoms and a framework density of 16.9. Following the structure determination by cRED a Rietveld refinement was performed which converged at Rwp and Rp of 0.090 and 0.066 for dehydrated PST-13 and 0.070 and 0.051 for dehydrated PST-14, respectively.
94 and refined using SHELXL.95 The refinement was performed without the need to use restraints on distances and converged to R1 of 20.1% for PST-13 and 29.9% for PST-14. The final structure of PST13/14 has 8 distinct T-site (T = Al, P) atoms and a framework density of 16.9. Following the structure determination by cRED a Rietveld refinement was performed which converged at Rwp and Rp of 0.090 and 0.066 for dehydrated PST-13 and 0.070 and 0.051 for dehydrated PST-14, respectively.
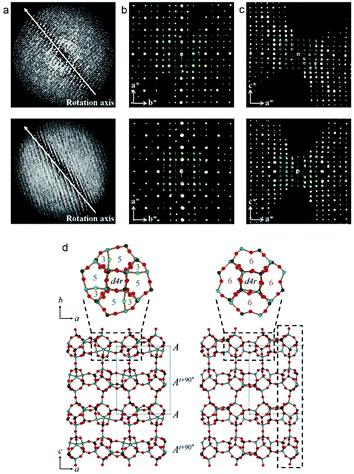 | ||
| Fig. 11 (a) The reconstructed 3D reciprocal lattice of PST-13 (top) and PST-14 (bottom) viewed perpendicular to the rotation axis. (b, c) 2D sections through the reciprocal lattice corresponding to (b) hk0 and (c) 0kl. (d) The structures of PST-13 (left) and PST-14 (right) with Al in light blue, P dark gray and O in red.88 | ||
4. Applications of electron microscopy for studies of zeolite materials
4.1 Studies of nano-sized zeolites using electron microscopy
Besides structure determination, electron microscopy has also been used for the observation and identification of nano-sized zeolites. Nano-zeolites show improved catalytic activities in diffusion-limited reactions, and have attracted steady interests. TEM is an important tool for studying the structure of such nano-zeolites.One notable example is the single unit cell thick ZSM-5 crystals that were synthesized using a purpose designed di-quaternary ammonium-type surfactant. The long alkyl chains of the structure-directing agent prevented the growth of the crystals in one dimension. This material was characterized using HRTEM imaging where it was possible to show that the material was growing as flakes of MFI type zeolite with a thickness of just one unit cell along the crystallographic b-axis.96
TEM was used to study the growth mechanism of zeolite silicalite-1 in a clear solution aged for 40 months at room temperature, in a study by Liang and co-workers.97 TEM images revealed the aggregation of nano-sized crystalline building units (1–4 nm in thickness) into larger crystalline zeolite particles (15–30 nm) even without heating. HRTEM images and their Fourier transforms show that these small nano-slabs preferentially stacked along the a or b crystallographic directions. These TEM studies support the model describing the formation of silicalite-1 as a successive aggregation process of structured building blocks.
A similar system, TPA-silicalite-1, was studied by applying cryogenic transmission electron microscopy (cryo-TEM), by Kumar and co-workers.98 After keeping the TPA-silica sols at room temperature for 200 days, some aggregate-like larger particles (30–50 nm) were observed by TEM, which were still amorphous. After 220 days, aggregates with a similar size as the 200-day sample were observed, but now exhibit lattice fringes that are consistent with those of silicalite-1. This observation suggests that the amorphous particles transformed to silicalite-1 crystals sometime between 200 and 220 days. This study points out the formation of predominantly amorphous aggregates before the MFI crystallization and also shows the importance of the intra-aggregate rearrangements in the nucleation and growth of zeolites.
HRTEM was also employed to study the synthesis of nano-sized template-free zeolites. Ng and co-workers investigated the very early stages of zeolite crystallization in colloidal systems, which can provide access to important nanoscale zeolite phases while avoiding the use of expensive organic templates.99 They reported the effective synthesis of ultra-small (6–15 nm) crystals of the large-pore zeolite EMT from template-free colloidal precursors at low temperature (30 °C) with very high yield. HRTEM images of the solid particles extracted at different crystallization times revealed the presence of amorphous gel after 8 to 14 hours of heating at 30 °C. After 24 hours of heating, ultra-small crystallites of zeolite EMT appeared in the amorphous matrix, which was further confirmed by the broad amorphous peak and low intense Bragg peaks in the PXRD pattern. After 36 hours of heating, the amorphous particles turned completely into EMT nanocrystals, as shown by well-defined hexagonal shapes and crystalline fringes in the TEM images (Fig. 12). The individual crystals have sizes of 10 to 15 nm and thickness of 2 to 3 nm.
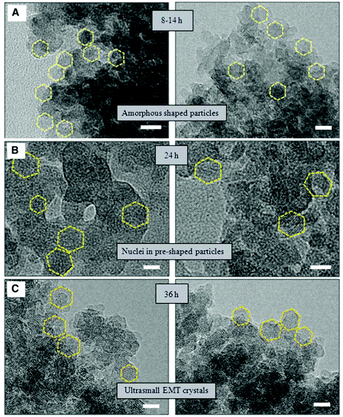 | ||
| Fig. 12 TEM images showing the process of nucleation and growth of the ultra-small EMT crystals from template-free colloidal precursors. (A) Amorphous-shaped particles in the template-free precursor suspension after 8 to 14 hours. (B) Birth of ultra-small EMT nuclei after 24 hours. (C) Fully crystalline ultra-small EMT after 36 hours of conventional heating at 30 °C. Scale bars, 10 nm.99 | ||
4.2. Applications of electron tomography on hierarchical zeolites
For 3D structure determination of periodic structures such as zeolites and ordered mesoporous materials, electron crystallography (EC), for example electron diffraction and 3D reconstruction of HRTEM and STEM images from different zone axes can be used. For studying hierarchical zeolites containing disordered mesopore structures or having the 3D distribution of metal nanocatalysts in zeolites, electron tomography is the method of choice. EC and ET are complementary to each other. While EC can reach atomic resolution (better than 0.3 nm to resolve Si sites), the resolution of conventional ET is only 1–4 nm. ET provides unique information about the size and shape of the mesopores, and their distribution and connectivity in hierarchical mesoporous zeolites. Electron tomography has successfully been utilized for, e.g. studying size and distribution of metal nanoparticle inside zeolites100 and mesopores in zeolites.101–105 Here we show a few examples of recent work of mesoporous zeolites studied by electron tomography combined with other techniques.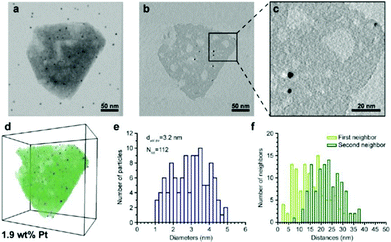 | ||
| Fig. 13 Electron tomography and image analysis study of a Pt-HY30-R crystal. (a) TEM at 0° tilt angle; black dots are 5 nm gold particles used for the alignment of the tilt images; (b) 0.32 nm thick reconstruction slice from the middle of the zeolite crystal shown in (a). (c) Enlarged region (b) highlighting the presence of larger Pt particles. White streaks emerging from the Pt particles are artefacts of the weighted back-projection reconstruction and should not be confused with the presence of mesopores. (d) Volume and iso-surface rendering shows segmented Pt particles (blue), zeolite crystal (green), and mesopores (white). (e) Pt size distribution, volume-averaged Pt diameter, and total number of measured Pt particles. (f) Surface-to-surface distances of first and second nearest neighbouring Pt particles.100 | ||
Zečević and co-workers presented an excellent example of the application of electron tomography and image analysis in studying the mesoporosity in a zeolite Y.102 Bright-field TEM images were collected within ±75° at a tilt step of 1° or 2°. While each individual TEM image indicates the presence of a complex mesopore network, the reconstructed 3D tomograms showed much more clearly the presence of channel-like mesopores and their connectivity than the images did, as shown in Fig. 14a and b. After image processing by segmentation, voxels in the tomogram that belong to the mesopores are separated from those belonging to the micropore solid. This allowed quantification of the important properties of the mesopore network with regard to its accessibility. Mesopores that are open and accessible from the outer surface, could be separated from those which are closed and can only be accessed from the outer surface through the micropores, as shown in Fig. 14c and d. The volumes and diameters of the mesopores were quantified. Quantitative information about the diameter of the mesopores enabled the identification and quantification of the so-called ‘constricted’ mesopores which can be reached through narrow openings.
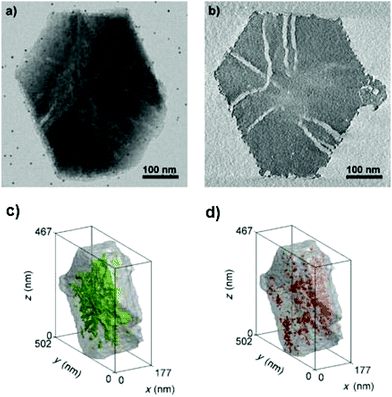 | ||
| Fig. 14 (a) TEM micrograph from a tilt series showing the presence of a complex mesopore network in the mesoporous zeolite Y sample and (b) a virtual slice from the middle of the reconstructed volume obtained by electron tomography showing the presence of channel-like mesopores distributed throughout the crystal. Accessibility of the mesopores was described and quantified using image processing. The open and “closed” mesopores are shown in green (c) and red (d), respectively, in the 3D volume.102 | ||
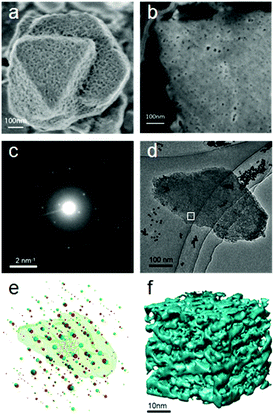 | ||
| Fig. 15 (a) Morphology and (b) ion-polished cross section of a mesostructured zeolite Y crystal. The mesopores distributed on the surface of and inside the crystal are clearly visible. Both images were taken at low voltage (electron beam landing energy of 0.5 keV and stage bias of 2 kV). (c) An ED frame in the rotation electron diffraction (RED) data series and (d) the corresponding TEM image in the ET series. (e) Reconstructed 3D reciprocal lattices from the RED data with the reconstructed 3D morphology of the corresponding particle obtained from electron tomography superimposed. RED data shows that the particle is highly crystalline zeolite Y with two twin domains (lattices shown in red and green, respectively) sharing a common (111) plane. (f) The 3D volume of a part of the tomogram from the area marked in (d) showing the connectivity of the mesopores in zeolite Y.104 | ||
Electron tomography was used to study the distribution and connectivity of mesopores in 3D in the zeolite.104 Because the resolution of ET was limited to a few nanometers, it was not possible to resolve the micropores (<2 nm) in zeolites. To investigate the hierarchical structure from atomic to meso scale of the same mesostructured Y crystal, the 3D RED method was combined with ET (Fig. 15). The electron diffraction patterns taken at an arbitrary crystal orientation (Fig. 15c) showed that the mesoporous Y crystals were of high crystallinity. The 3D reciprocal lattice reconstructed from the RED data shows that the particle contains two sets of crystal lattices of zeolite Y, indicating the presence of twinning (Fig. 15e). The orientation relationship between the twin components as well as their orientations in relation to the particle could be deduced. The tomogram reconstructed from the ET images shows clearly that uniformly-sized mesopores are distributed throughout the crystal. The pore architecture and the connectivity of the mesopores are intuitively illustrated from the pore structural model reconstructed by electron tomography (Fig. 15f). More detailed pore structures and connectivity of the bulk sample were obtained by advanced gas sorption measurements.104
4.3. Analysis of metal sites in zeolites at atomic resolution
Due to its sensitivity to the atomic numbers, HAADF-STEM imaging can be used to detect metal species in zeolite structures. With this technique, it is possible to observe single heavy atoms or small metal clusters in zeolites. It can provide direct local information about the catalytic species that are not attainable with spectroscopic and traditional microscopic techniques.HAADF-STEM imaging was employed to determine the locations of the Pt atoms in zeolite K-LTL as a CO oxidation catalyst.15 The infrared (IR) and extended X-ray absorption fine structure (EXAFS) studies showed that [Pt(NH3)4]2+ complexes were present in the zeolite. The HAADF-STEM images shown in Fig. 3 confirmed the absence of platinum clusters and showed exclusively the site-isolated single Pt atom species both before and after oxidation. By carefully analyzing the precise Pt locations, the [Pt(NH3)4]2+ complexes present initially were located primarily at the D sites in the largest pores (66%). The others were in smaller pores (23% in A/B) sites and 11% in C/E sites. Some Pt atoms moved as a result of the oxidation, with the approximate population present in the largest pores decreasing to 56%, while that in the medium-sized A/B pores remained almost unchanged at 24% and that in the smallest C/E pores increased to 20%.
Aberration-corrected HAADF-STEM imaging was also applied to investigate heavy metal ion-exchanged zeolites, such as a Ag ion exchanged zeolite A.14 The incorporation of silver into the zeolite resulted in the formation of a material with antibacterial activity and with particular applications for the recovery of radioactive materials. Both NaA (sodium zeolite A) and AgA (silver zeolite A) were imaged. The NaA image showed that the black parts correspond to the parts with no mass, which are zeolite alpha cages, linked to each other by the sodalite cages. For AgA, because of the large difference between the atomic number of silver and those of the species in the zeolitic framework (Al and Si), it is rather difficult to observe the zeolite framework and only four atomic columns forming squares or nine columns were identified (Fig. 16). The distance between the atoms located at the corners was around 4.72 Å, which can be attributed to Ag located at the 6-rings forming the sodalite cages, and matched well with the value from the model by Rietveld refinement. The distance between the Ag columns in the adjacent sodalite cages was found to be approximately 7.41 Å, close to that in the model (7.57 Å). Besides, the analysis of the intensity of atomic columns indicated the formation of a silver octahedron inside the sodalite cages surrounded by eight cations, each located in the center of a 6-ring.
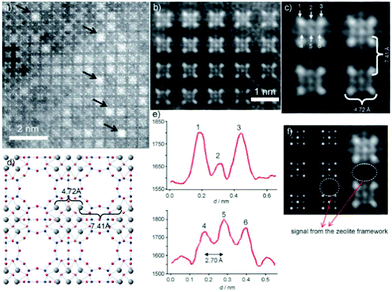 | ||
| Fig. 16 (a) Aberration-corrected HAADF-STEM image of AgA along the [001] direction, where the white spots are single atomic columns and the black arrows point to Ag clusters in the alpha cages. (b, c) Fourier-filtered images of the atomic distribution where the four columns of Ag at the corners of the sodalite cage are separated by 4.72 Å and each sodalite cage is separated by 7.41 Å. (d) Proposed model with the Ag atoms in grey. (e) Intensity profiles performed on the atoms marked as 1, 2, and 3 in (c) and 4, 5, and 6 with the interatomic distance between these atoms being 2.70 Å. (f) Multislice STEM simulation along the [001] direction and the experimental image is shown alongside.14 | ||
In a recent study Altantzis and co-workers used aberration corrected HAADF-STEM imaging in combination with PXRD to visualize the atomic arrangement of luminescent Ag clusters inside zeolites X and Y.106 They showed that the difference in composition between the two zeolites affected the arrangement of Ag atoms inside the pores of the material. Knowledge regarding the different arrangement of the Ag atoms could be used to explain the altered luminescent behavior of the two materials.
5. Conclusions and future prospects
We have presented different electron microscopic techniques and their applications for structure characterization of zeolite materials. We have demonstrated how various electron microscopic methods are chosen and used for solving different structural problems and how these methods can be applied in combination with other techniques, for example powder X-ray diffraction and solid-state NMR. Electron diffraction can be used for phase identification, unit cell and space group determination of crystals too small to be studied by single crystal X-ray diffraction or too complex to be studied by powder X-ray diffraction. The recently developed 3D electron diffraction techniques have shown to be very efficient and powerful for ab initio structure determination of novel zeolites. HRTEM and STEM have unique advantages for structure determination, because both the structure factor amplitudes and phases can be directly obtained from the images. Both TEM and STEM can provide atomic resolution. Compared to HRTEM the contrast of HAADF-STEM images is more sensitive to atomic numbers, therefore HAADF-STEM is very useful for revealing metal clusters in zeolite catalysts. 3D atomic structure can be obtained by 3D reconstruction of HRTEM and HAADF-STEM images from different projections. This technique is especially useful for structure determination of zeolites with disorders, in which only small ordered areas are available. For 3D structure characterization of zeolites with disordered mesopores or containing metal nano-particles, electron tomography is the method of choice. The 3D structures can be visualized and even quantified.We have shown that transmission electron microscopy is a very powerful tool for structure characterization of zeolites. However, there are still several challenges to overcome so that rich and accurate structural information can be obtained routinely in the application of the TEM techniques in zeolites.
For structure determination of new zeolite structures, the recently developed new electron diffraction techniques have made the collection of single crystal 3D ED data on a TEM almost as feasible and fast as that on a single crystal X-ray diffractometer, but from crystals millions times smaller. Data processing and structure determination software developed for X-ray diffraction can be used for electron diffraction data. The accuracy of the structure determination of zeolites can reach better than 0.10 Å. The main challenge that remains is to further improve the quality of ED intensities and minimize or take into account dynamical effects in order to obtain more detailed structures such as guest species in the pores.
HRTEM and STEM have unique advantages for studying disordered zeolite materials. The recent development of aberration correctors greatly strengthened these techniques and pushed the resolution to the sub-Ångström level. However, electron beam damage still remains a challenge for the application in zeolites. New data collection methods and improved detectors can be the solutions for the problem.
The resolution of electron tomography for zeolite materials is currently limited to a few nanometers. New methods need to be developed to improve the resolution, so that it is possible to resolve both the micro- and meso-pores in mesoporous zeolites. New algorithms and software are needed for quantification of the pore size, quantity and connectivity of mesopores in mesoporous zeolites.
New methods need to be developed for studying extremely beam sensitive materials. This requires both the improvement of data collection techniques and development of fast and high quality detectors so that high quality data can be collected in a short time before the material is destroyed by electron beams.
Finally, we want to emphasize that TEM techniques only deal with individual crystallites, it is important to combine different techniques for structure characterization of bulk zeolite materials, for example various TEM techniques, powder X-ray diffraction, solid state NMR and gas sorption to obtain a complete structure information about the material. The structure information will give insights about the formation mechanisms of zeolites and zeolitic materials derived from zeolites, and help us to improve the materials, understand the properties and explore new applications.
Conflicts of interest
There are no conflicts to declare.Acknowledgements
The project is supported by the Swedish Research Council (VR, No. 2017-0432), the Swedish Governmental Agency for Innovation Systems (VINNOVA), and the Knut & Alice Wallenberg Foundation through the project grant 3DEM-NATUR. The EM facility was supported by the Knut and Alice Wallenberg Foundation. TW acknowledges the Swedish Research Council (VR) for an International Postdoc grant (2014-06948).References
- C. Baerlocher and L. B. McCusker, Database of Zeolite Structures, http://www.iza-structure.org/databases/, (accessed July 1, 2018).
- M. E. Davis, Nature, 2002, 417, 813–821 CrossRef CAS PubMed.
- X. Zou, S. Hovmöller and P. Oleynikov, Electron Crystallography: Electron Microscopy and Electron Diffraction, Oxford University Press, 2011 Search PubMed.
- M. Haider, S. Uhlemann, E. Schwan, H. Rose, B. Kabius and K. Urban, Nature, 1998, 392, 768–769 CrossRef CAS.
- K. Yoshida, Y. Sasaki and H. Kurata, AIP Adv., 2013, 3, 042113 CrossRef.
- D. Xie, L. B. McCusker, C. Baerlocher, S. I. Zones, W. Wan and X. Zou, J. Am. Chem. Soc., 2013, 135, 10519–10524 CrossRef CAS PubMed.
- W. M. J. Coene, A. Thust, M. Op de Beeck and D. Van Dyck, Ultramicroscopy, 1996, 64, 109–135 CrossRef CAS.
- W. Wan, S. Hovmöller and X. Zou, Ultramicroscopy, 2012, 115, 50–60 CrossRef CAS PubMed.
- X. Li, P. Mooney, S. Zheng, C. R. Booth, M. B. Braunfeld, S. Gubbens, D. A. Agard and Y. Cheng, Nat. Methods, 2013, 10, 584–590 CrossRef CAS PubMed.
- A. Bartesaghi, A. Merk, S. Banerjee, D. Matthies, X. Wu, J. L. S. Milne and S. Subramaniam, Science, 2015, 348, 1147–1151 CrossRef CAS PubMed.
- Y. Zhu, J. Ciston, B. Zheng, X. Miao, C. Czarnik, Y. Pan, R. Sougrat, Z. Lai, C.-E. Hsiung, K. Yao, I. Pinnau, M. Pan and Y. Han, Nat. Mater., 2017, 16, 532–536 CrossRef CAS PubMed.
- D. Zhang, Y. Zhu, L. Liu, X. Ying, C.-E. Hsiung, R. Sougrat, K. Li and Y. Han, Science, 2018, 359, 675–679 CrossRef CAS PubMed.
- S. J. Pennycook, Ultramicroscopy, 1989, 30, 58–69 CrossRef.
- A. Mayoral, T. Carey, P. A. Anderson, A. Lubk and I. Diaz, Angew. Chem., Int. Ed., 2011, 50, 11230–11233 CrossRef CAS PubMed.
- J. D. Kistler, N. Chotigkrai, P. Xu, B. Enderle, P. Praserthdam, C.-Y. Chen, N. D. Browning and B. C. Gates, Angew. Chem., Int. Ed., 2014, 53, 8904–8907 CrossRef CAS PubMed.
- S. D. Findlay, N. Shibata, H. Sawada, E. Okunishi, Y. Kondo, T. Yamamoto and Y. Ikuhara, Appl. Phys. Lett., 2009, 95, 191913 CrossRef.
- T. Willhammar, A. Mayoral and X. Zou, Dalton Trans., 2014, 43, 14158–14163 RSC.
- T. Willhammar, J. Sun, W. Wan, P. Oleynikov, D. Zhang, X. Zou, M. Moliner, J. Gonzalez, C. Martínez, F. Rey and A. Corma, Nat. Chem., 2012, 4, 188–194 CrossRef CAS PubMed.
- E. F. Rauch, J. Portillo, S. Nicolopoulos, D. Bultreys, S. Rouvimov and P. Moeck, Z. Kristallogr. – New Cryst. Struct., 2010, 225, 103–109 CAS.
- Y. Wang, T. Yang, H. Xu, X. Zou and W. Wan, J. Appl. Crystallogr., 2018, 51, 1094–1101 CrossRef CAS.
- P. Wagner, O. Terasaki, S. Ritsch, J. G. Nery, S. I. Zones, M. E. Davis and K. Hiraga, J. Phys. Chem. B, 1999, 103, 8245–8250 CrossRef CAS.
- R. Vincent and P. A. Midgley, Ultramicroscopy, 1994, 53, 271–282 CrossRef CAS.
- D. L. Dorset, C. J. Gilmore, J. L. Jorda and S. Nicolopoulos, Ultramicroscopy, 2007, 107, 462–473 CrossRef CAS PubMed.
- D. Xie, C. Baerlocher and L. B. McCusker, J. Appl. Crystallogr., 2008, 41, 1115–1121 CrossRef CAS.
- U. Kolb, T. Gorelik, C. Kübel, M. T. Otten and D. Hubert, Ultramicroscopy, 2007, 107, 507–513 CrossRef CAS PubMed.
- D. Zhang, P. Oleynikov, S. Hovmöller and X. Zou, Z. Kristallogr., 2010, 225, 94–102 CAS.
- W. Wan, J. Sun, J. Su, S. Hovmöller and X. Zou, J. Appl. Crystallogr., 2013, 46, 1863–1873 CrossRef CAS PubMed.
- I. Nederlof, E. van Genderen, Y.-W. Li and J. P. Abrahams, Acta Crystallogr., Sect. D: Biol. Crystallogr., 2013, 69, 1223–1230 CrossRef CAS PubMed.
- D. Shi, B. L. Nannenga, M. G. Iadanza and T. Gonen, eLife, 2013, 2, e01345 CrossRef PubMed.
- B. L. Nannenga, D. Shi, A. G. W. Leslie and T. Gonen, Nat. Methods, 2014, 11, 927–930 CrossRef CAS PubMed.
- K. Yonekura, K. Kato, M. Ogasawara, M. Tomita and C. Toyoshima, Proc. Natl. Acad. Sci. U. S. A., 2015, 112, 3368–3373 CrossRef CAS PubMed.
- M. Gemmi, M. G. I. La Placa, A. S. Galanis, E. F. Rauch and S. Nicolopoulos, J. Appl. Crystallogr., 2015, 48, 718–727 CrossRef CAS.
- H. Xu, H. Lebrette, T. Yang, V. Srinivas, S. Hovmöller, M. Högbom and X. Zou, Structure, 2018, 26, 667–675 CrossRef CAS PubMed.
- W. Kabsch, Acta Crystallogr., Sect. D: Biol. Crystallogr., 2010, 66, 125–132 CrossRef CAS PubMed.
- M. T. B. Clabbers, T. Gruene, J. M. Parkhurst, J. P. Abrahams and D. G. Waterman, Acta Crystallogr., Sect. D: Struct. Biol., 2018, 74, 506–518 CrossRef CAS PubMed.
- S. Smeets, X. Zou and W. Wan, J. Appl. Crystallogr., 2018, 51, 1262–1273 CrossRef.
- J. Su, E. Kapaca, L. Liu, V. Georgieva, W. Wan, J. Sun, V. Valtchev, S. Hovmöller and X. Zou, Microporous Mesoporous Mater., 2014, 189, 115–125 CrossRef CAS.
- P. Guo, J. Shin, A. G. Greenaway, J. G. Min, J. Su, H. J. Choi, L. Liu, P. A. Cox, S. B. Hong, P. A. Wright and X. Zou, Nature, 2015, 524, 74–78 CrossRef CAS PubMed.
- T. Willhammar, J. Su, Y. Yun, X. Zou, M. Afeworki, S. C. Weston, H. B. Vroman, W. W. Lonergan and K. G. Strohmaier, Inorg. Chem., 2017, 56, 8856–8864 CrossRef CAS PubMed.
- P. A. Midgley and M. Weyland, Ultramicroscopy, 2003, 96, 413–431 CrossRef CAS PubMed.
- Z. Saghi and P. A. Midgley, Annu. Rev. Mater. Res., 2012, 42, 59–79 CrossRef CAS.
- H. Friedrich, P. E. de Jongh, A. J. Verkleij and K. P. de Jong, Chem. Rev., 2009, 109, 1613–1629 CrossRef CAS PubMed.
- M. C. Scott, C.-C. Chen, M. Mecklenburg, C. Zhu, R. Xu, P. Ercius, U. Dahmen, B. C. Regan and J. Miao, Nature, 2012, 483, 444–447 CrossRef CAS PubMed.
- B. Goris, S. Bals, W. Van den Broek, E. Carbó-Argibay, S. Gómez-Graña, L. M. Liz-Marzán and G. Van Tendeloo, Nat. Mater., 2012, 11, 930–935 CrossRef CAS PubMed.
- C.-C. Chen, C. Zhu, E. R. White, C.-Y. Chiu, M. C. Scott, B. C. Regan, L. D. Marks, Y. Huang and J. Miao, Nature, 2013, 496, 74–77 CrossRef CAS PubMed.
- B. Goris, J. De Beenhouwer, A. De Backer, D. Zanaga, K. J. Batenburg, A. Sánchez-Iglesias, L. M. Liz-Marzán, S. Van Aert, S. Bals, J. Sijbers and G. Van Tendeloo, Nano Lett., 2015, 15, 6996–7001 CrossRef PubMed.
- Y. Yang, C.-C. Chen, M. C. Scott, C. Ophus, R. Xu, A. Pryor, L. Wu, F. Sun, W. Theis, J. Zhou, M. Eisenbach, P. R. C. Kent, R. F. Sabirianov, H. Zeng, P. Ercius and J. Miao, Nature, 2017, 542, 75–79 CrossRef CAS PubMed.
- T. Willhammar, K. Sentosun, S. Mourdikoudis, B. Goris, M. Kurttepeli, M. Bercx, D. Lamoen, B. Partoens, I. Pastoriza-Santos, J. Pérez-Juste, L. M. Liz-Marzán, S. Bals and G. Van Tendeloo, Nat. Commun., 2017, 8, 14925 CrossRef CAS PubMed.
- D. V. Dyck, J. R. Jinschek and F.-R. Chen, Nature, 2012, 486, 243–246 CrossRef PubMed.
- M. O. Cichocka, Y. Lorgouilloux, S. Smeets, J. Su, W. Wan, P. Caullet, N. Bats, L. B. McCusker, J.-L. Paillaud and X. Zou, Cryst. Growth Des., 2018, 18, 2441–2451 CrossRef CAS.
- M. M. J. Treacy and J. M. Newsam, Nature, 1988, 332, 249–251 CrossRef CAS.
- J. M. Newsam, M. M. J. Treacy, W. T. Koetsier and C. B. D. Gruyter, Proc. R. Soc. London, Ser. A, 1988, 420, 375–405 CrossRef CAS.
- M. E. Leonowicz, J. A. Lawton, S. L. Lawton and M. K. Rubin, Science, 1994, 264, 1910–1913 CrossRef CAS PubMed.
- R. F. Lobo, M. Tsapatsis, C. C. Freyhardt, I. Chan, C.-Y. Chen, S. I. Zones and M. E. Davis, J. Am. Chem. Soc., 1997, 119, 3732–3744 CrossRef CAS.
- M. Moliner, T. Willhammar, W. Wan, J. González, F. Rey, J. L. Jorda, X. Zou and A. Corma, J. Am. Chem. Soc., 2012, 134, 6473–6478 CrossRef CAS PubMed.
- S. Smeets, D. Xie, C. Baerlocher, L. B. McCusker, W. Wan, X. Zou and S. I. Zones, Angew. Chem., Int. Ed., 2014, 53, 10398–10402 CrossRef CAS PubMed.
- J. Ruan, P. Wu, B. Slater, Z. Zhao, L. Wu and O. Terasaki, Chem. Mater., 2009, 21, 2904–2911 CrossRef CAS.
- C. Baerlocher, F. Gramm, L. Massüger, L. B. McCusker, Z. He, S. Hovmöller and X. Zou, Science, 2007, 315, 1113–1116 CrossRef CAS PubMed.
- J. Sun, Z. He, S. Hovmöller, X. Zou, F. Gramm, C. Baerlocher and L. B. McCusker, Z. Kristallogr., 2010, 225, 77–85 CAS.
- L. Xu, X. Ji, J.-G. Jiang, L. Han, S. Che and P. Wu, Chem. Mater., 2015, 27, 7852–7860 CrossRef CAS.
- S. Smeets, Z. J. Berkson, D. Xie, S. I. Zones, W. Wan, X. Zou, M.-F. Hsieh, B. F. Chmelka, L. B. McCusker and C. Baerlocher, J. Am. Chem. Soc., 2017, 139, 16803–16812 CrossRef CAS PubMed.
- F. Gramm, C. Baerlocher, L. B. McCusker, S. J. Warrender, P. A. Wright, B. Han, S. B. Hong, Z. Liu, T. Ohsuna and O. Terasaki, Nature, 2006, 444, 79–81 CrossRef CAS PubMed.
- C. Baerlocher, D. Xie, L. B. McCusker, S.-J. Hwang, I. Y. Chan, K. Ong, A. W. Burton and S. I. Zones, Nat. Mater., 2008, 7, 631–635 CrossRef CAS PubMed.
- Z.-B. Yu, Y. Han, L. Zhao, S. Huang, Q.-Y. Zheng, S. Lin, A. Córdova, X. Zou and J. Sun, Chem. Mater., 2012, 24, 3701–3706 CrossRef CAS.
- A. Corma, M. J. Díaz-Cabañas, J. Jiang, M. Afeworki, D. L. Dorset, S. L. Soled and K. G. Strohmaier, Proc. Natl. Acad. Sci. U. S. A., 2010, 107, 13997–14002 CrossRef CAS PubMed.
- D. L. Dorset, K. G. Strohmaier, C. E. Kliewer, A. Corma, M. J. Díaz-Cabañas, F. Rey and C. J. Gilmore, Chem. Mater., 2008, 20, 5325–5331 CrossRef CAS.
- J. Sun, C. Bonneau, Á. Cantín, A. Corma, M. J. Díaz-Cabañas, M. Moliner, D. Zhang, M. Li and X. Zou, Nature, 2009, 458, 1154–1157 CrossRef CAS PubMed.
- J. Jiang, J. L. Jorda, J. Yu, L. A. Baumes, E. Mugnaioli, M. J. Diaz-Cabanas, U. Kolb and A. Corma, Science, 2011, 333, 1131–1134 CrossRef CAS PubMed.
- R. Martínez-Franco, M. Moliner, Y. Yun, J. Sun, W. Wan, X. Zou and A. Corma, Proc. Natl. Acad. Sci. U. S. A., 2013, 110, 3749–3754 CrossRef PubMed.
- Y. Lorgouilloux, M. Dodin, E. Mugnaioli, C. Marichal, P. Caullet, N. Bats, U. Kolb and J.-L. Paillaud, RSC Adv., 2014, 4, 19440–19449 RSC.
- T. Willhammar, A. W. Burton, Y. Yun, J. Sun, M. Afeworki, K. G. Strohmaier, H. Vroman and X. Zou, J. Am. Chem. Soc., 2014, 136, 13570–13573 CrossRef CAS PubMed.
- W. Hua, H. Chen, Z.-B. Yu, X. Zou, J. Lin and J. Sun, Angew. Chem., Int. Ed., 2014, 53, 5868–5871 CrossRef CAS PubMed.
- J. Liang, J. Su, Y. Wang, Y. Chen, X. Zou, F. Liao, J. Lin and J. Sun, Chem. – Eur. J., 2014, 20, 16097–16101 CrossRef CAS PubMed.
- J. K. Lee, A. Turrina, L. Zhu, S. Seo, D. Zhang, P. A. Cox, P. A. Wright, S. Qiu and S. B. Hong, Angew. Chem., Int. Ed., 2014, 53, 7480–7483 CrossRef CAS PubMed.
- S. Smeets, D. Xie, L. B. McCusker, C. Baerlocher, S. I. Zones, J. A. Thompson, H. S. Lacheen and H.-M. Huang, Chem. Mater., 2014, 26, 3909–3913 CrossRef CAS.
- Y. Yun, M. Hernández, W. Wan, X. Zou, J. L. Jordá, A. Cantín, F. Rey and A. Corma, Chem. Commun., 2015, 51, 7602–7605 RSC.
- J. Jiang, Y. Yun, X. Zou, J. Luis Jorda and A. Corma, Chem. Sci., 2015, 6, 480–485 RSC.
- J. E. Schmidt, D. Xie, T. Rea and M. E. Davis, Chem. Sci., 2015, 6, 1728–1734 RSC.
- S. Smeets, L. B. McCusker, C. Baerlocher, D. Xie, C.-Y. Chen and S. I. Zones, J. Am. Chem. Soc., 2015, 137, 2015–2020 CrossRef CAS PubMed.
- J. Shin, H. Xu, S. Seo, P. Guo, J. G. Min, J. Cho, P. A. Wright, X. Zou and S. B. Hong, Angew. Chem., Int. Ed., 2016, 55, 4928–4932 CrossRef CAS PubMed.
- J. H. Kang, D. Xie, S. I. Zones, S. Smeets, L. B. McCusker and M. E. Davis, Chem. Mater., 2016, 28, 6250–6259 CrossRef CAS.
- J. Simancas, R. Simancas, P. J. Bereciartua, J. L. Jorda, F. Rey, A. Corma, S. Nicolopoulos, P. Pratim Das, M. Gemmi and E. Mugnaioli, J. Am. Chem. Soc., 2016, 138, 10116–10119 CrossRef CAS PubMed.
- P. Guo, K. Strohmaier, H. Vroman, M. Afeworki, P. I. Ravikovitch, C. S. Paur, J. Sun, A. Burton and X. Zou, Inorg. Chem. Front., 2016, 3, 1444–1448 RSC.
- Y. Luo, S. Smeets, F. Peng, A. S. Etman, Z. Wang, J. Sun and W. Yang, Chem. – Eur. J., 2017, 23, 16829–16834 CrossRef CAS PubMed.
- L. Bieseki, R. Simancas, J. L. Jordá, P. J. Bereciartua, Á. Cantín, J. Simancas, S. B. Pergher, S. Valencia, F. Rey and A. Corma, Chem. Commun., 2018, 54, 2122–2125 RSC.
- A. Turrina, R. Garcia, A. E. Watts, H. F. Greer, J. Bradley, W. Zhou, P. A. Cox, M. D. Shannon, A. Mayoral, J. L. Casci and P. A. Wright, Chem. Mater., 2017, 29, 2180–2190 CrossRef CAS.
- C. Zhang, E. Kapaca, J. Li, Y. Liu, X. Yi, A. Zheng, X. Zou, J. Jiang and J. Yu, Angew. Chem., Int. Ed., 2018, 57, 6486–6490 CrossRef CAS PubMed.
- S. Seo, T. Yang, J. Shin, D. Jo, X. Zou and S. B. Hong, Angew. Chem., Int. Ed., 2018, 57, 3727–3732 CrossRef CAS PubMed.
- B. D. Yuhas, J. P. S. Mowat, M. A. Miller and W. Sinkler, Chem. Mater., 2018, 30, 582–586 CrossRef CAS.
- P. Guo, N. Yan, L. Wang and X. Zou, Cryst. Growth Des., 2017, 17, 6821–6835 CrossRef CAS.
- A. Corma, M. Moliner, Á. Cantín, M. J. Díaz-Cabañas, J. L. Jordá, D. Zhang, J. Sun, K. Jansson, S. Hovmöller and X. Zou, Chem. Mater., 2008, 20, 3218–3223 CrossRef CAS.
- R. W. Grosse-Kunstleve, L. B. McCusker and C. Baerlocher, J. Appl. Crystallogr., 1999, 32, 536–542 CrossRef CAS.
- L. Palatinus and G. Chapuis, J. Appl. Crystallogr., 2007, 40, 786–790 CrossRef CAS.
- M. C. Burla, R. Caliandro, B. Carrozzini, G. L. Cascarano, C. Cuocci, C. Giacovazzo, M. Mallamo, A. Mazzone and G. Polidori, J. Appl. Crystallogr., 2015, 48, 306–309 CrossRef CAS.
- G. M. Sheldrick, Acta Crystallogr., Sect. A: Found. Crystallogr., 2008, 64, 112–122 CrossRef CAS PubMed.
- M. Choi, K. Na, J. Kim, Y. Sakamoto, O. Terasaki and R. Ryoo, Nature, 2009, 461, 246–249 CrossRef CAS PubMed.
- D. Liang, L. R. A. Follens, A. Aerts, J. A. Martens, G. Van Tendeloo and C. E. A. Kirschhock, J. Phys. Chem. C, 2007, 111, 14283–14285 CrossRef CAS.
- S. Kumar, Z. Wang, R. L. Penn and M. Tsapatsis, J. Am. Chem. Soc., 2008, 130, 17284–17286 CrossRef CAS PubMed.
- E.-P. Ng, D. Chateigner, T. Bein, V. Valtchev and S. Mintova, Science, 2012, 335, 70–73 CrossRef CAS PubMed.
- J. Zečević, A. M. J. van der Eerden, H. Friedrich, P. E. de Jongh and K. P. de Jong, ACS Nano, 2013, 7, 3698–3705 CrossRef PubMed.
- S. Bals, K. J. Batenburg, D. Liang, O. Lebedev, G. Van Tendeloo, A. Aerts, J. A. Martens and C. E. A. Kirschhock, J. Am. Chem. Soc., 2009, 131, 4769–4773 CrossRef CAS PubMed.
- J. Zečević, C. J. Gommes, H. Friedrich, P. E. de Jongh and K. P. de Jong, Angew. Chem., Int. Ed., 2012, 51, 4213–4217 CrossRef PubMed.
- J. V. Aelst, D. Verboekend, A. Philippaerts, N. Nuttens, M. Kurttepeli, E. Gobechiya, M. Haouas, S. P. Sree, J. F. M. Denayer, J. A. Martens, C. E. A. Kirschhock, F. Taulelle, S. Bals, G. V. Baron, P. A. Jacobs and B. F. Sels, Adv. Funct. Mater., 2015, 25, 7130–7144 CrossRef.
- J. Garcia-Martinez, C. Xiao, K. A. Cychosz, K. Li, W. Wan, X. Zou and M. Thommes, ChemCatChem, 2014, 6, 3110–3115 CrossRef CAS.
- L. Van Tendeloo, W. Wangermez, A. Vandekerkhove, T. Willhammar, S. Bals, A. Maes, J. A. Martens, C. E. A. Kirschhock and E. Breynaert, Chem. Mater., 2017, 29, 629–638 CrossRef CAS.
- T. Altantzis, E. Coutino-Gonzalez, W. Baekelant, G. T. Martinez, A. M. Abakumov, G. V. Tendeloo, M. B. J. Roeffaers, S. Bals and J. Hofkens, ACS Nano, 2016, 10, 7604–7611 CrossRef CAS PubMed.
| This journal is © the Partner Organisations 2018 |

