
A novel route to synthesize carbon spheres and carbon nanotubes from carbon dioxide in a molten carbonate electrolyzer
Zhida
Li†
 a,
Dandan
Yuan†
a,
Hongjun
Wu
*a,
Wei
Li
b and
Di
Gu
a
a,
Dandan
Yuan†
a,
Hongjun
Wu
*a,
Wei
Li
b and
Di
Gu
a
aProvincial Key Laboratory of Oil & Gas Chemical Technology, College of Chemistry & Chemical Engineering, Northeast Petroleum University, Daqing, 163318, China. E-mail: hjwu@nepu.edu.cn; Tel: +86-0459-6503331
bCollege of Petroleum Engineering, Northeast Petroleum University, Daqing, 163318, China
First published on 6th November 2017
Abstract
The process of molten salt CO2 capture and electrochemical conversion provides us with a new way to close the present carbon cycle and mitigate global climate change by transforming the greenhouse gas CO2 into carbonaceous fuels or chemicals. In this paper, carbon spheres and carbon nanotubes that can be used as a societal resource to serve mankind are synthesized from CO2 in diverse electrolyte composites with inexpensive metallic electrodes. Carbon products, subsequent to electrolysis, are characterized by EDS, SEM, TEM, Raman, TGA, FTIR, BET and XRD to reveal the elemental composition and morphological and structural features. The results demonstrate that Li–Ca–Na and Li–Ca–K carbonate electrolytes favor carbon sphere formation rather than carbon nanotube formation, and in particular, K2CO3 shows enhanced interference with carbon nanotube growth. In contrast, Li–Ca–Ba and Li–Ba carbonate composites present an increase in the carbon nanotube fraction. Additionally, CNTs generated from Li–K, Li–Ba and Li–Ca–Ba present a different diameter. In this way, the CO2-derived carbon products of carbon spheres and carbon nanotubes could be alternatively synthesized through the appropriate regulation of the electrolyte composition.
1. Introduction
The discovery of fullerenes has motivated extensive, worldwide interest in structured carbon materials, in particular, the investigation on carbon nanotubes (CNTs), including multi-walled CNTs and single-walled CNTs.1–4 The discovery has also been extended to the widely known spherical carbons, exemplified by carbon black, which has resulted in an exponential growth in the field of carbon sphere (CS) studies, such as solid CSs, core–shell CSs, and hollow CSs.5–8 The over-demand for both CNTs and CSs has been universally acknowledged owing to their wide applications. CNTs have been cited as the prime focus in the nanotechnology field due to their select physicochemical properties, with potential to be applied in lightweight reinforced high strength materials,9,10 capacitors,11,12 Li/Na-ion batteries,13,14 nanoelectronics,15 and catalysts.16 CNT synthesis pathways vary widely from arc discharge, laser ablation, chemical vapor deposition, and solid phase pyrolysis to ion or laser sputtering, etc.17–21 For CSs, potential utilization in reinforcement materials or matrices for rubber, catalyst supports, lubricating materials, anodes in second Li-ion batteries, and hydrogen storage media endows CSs with a promising economic value and a special focus on its synthesis pathway as well.22 Amit A. Deshmukh divided CS production routes into two types: (i) chemical vapor deposition, arc-discharge and laser ablation processes, which used high temperature decomposition of carbonaceous materials under an inert atmosphere to produce spheres; (ii) low-temperature pyrolysis and catalytic decomposition, often in an autoclave.22Combined with the research hotspot of CO2 removal and global climate change, recent research interest in molten carbonates is increasingly directed to advanced applications in capturing and converting unwanted CO2 into valued carbon materials23–26 and even alkane or syngas on co-electrolysis with hydroxide.27–29 During this electrochemical process, electrons directly act as strong redox reagents to reduce the target compounds and finally achieve the transition from CO2 to harmless, value-added carbonaceous chemicals. Other reported CO2 reduction pathways, such as photochemical and biological methods, demonstrate a satisfactory CO2 degradation performance as well, but their scale-up applications are limited by their complexity and high cost of operation.30 In comparison, the molten salt based electrochemical method provides a more facile route to close the carbon cycle and alleviate the intensifying greenhouse effect. However, most of the CO2-derived carbon products using the indicated method are amorphous due to a lack of further investigation and optimization of the electrolysis conditions.31–33 More recently, Licht's group introduced the carbon nanofiber (CNF) synthesis in pure molten lithium carbonate, where metallic nucleation sites redeposited on the cathodic surface played a critical role in the CNF growth process.34 In this paper, rather than expensive Li2CO3, we present several lower cost carbonate composites, involving binary carbonates and ternary carbonates, to split CO2 into structured materials of CSs and CNTs. To the best of our knowledge, this is the first attempt to synthesize CSs from CO2via molten salt electrolysis. This molten salt electrolyzer, from the carbon cycle and energy storage points of view, provides an alternative route for humans to resolve global excessive CO2 emissions and, simultaneously, finishes the energy transition and storage from conventional electricity to chemical energy.
2. Materials and methods
To form carbon deposits in a molten carbonate electrolyzer, the presence of Li2CO3 is proven to be necessary due to the lower potential needed to produce solid carbon, compared with Na2CO3 and K2CO3 preferring CO or alkali metal generation instead.25,35 Anhydrous Li2CO3, Na2CO3, K2CO3, BaCO3, and CaCO3 are used to form ternary electrolyte composites of a Li–Ca–Na mixture (66.7![[thin space (1/6-em)]](https://www.rsc.org/images/entities/char_2009.gif) :20:13.3, wt%), a Li–Ca–K mixture (66.7:20:13.3, wt%), and a Li–Ca–Ba mixture (66.7:16.6:16.6, wt%), and binary electrolytes of a Li–K mixture (80:20, wt%) and a Li–Ba mixture (80:20, wt%). A detailed procedure for the production of solid carbon from CO2 and the purification of the as-prepared electrolytic carbon can be found in our previous publications.25,26 Anhydrous electrolyte is transferred into a 50 mL corundum crucible (Al2O3 > 99%) placed in a sealed steel reactor, and electrolysis is performed at a temperature of 750 °C between a galvanized iron cathode (active area of 5 cm2, Hebei Steady Metal Products Co., Ltd) and a nickel anode (active area of 10 cm2, Hebei Steady Metal Products Co., Ltd) under a 1 atm CO2 atmosphere. Prior to an enlarged constant current density of 200 mA cm−2 for rapid carbon deposition, we used a lower initial current density, such as 10 mA cm−2, to perform the pre-electrolysis process. Unless specifically noted, all the described current densities are in terms of the active area of the cathode. It is worth noting that the electricity consumed by heating up and the electrolysis process can be replaced by sustainable energy, such as solar energy in the STEP process.36–38 After electrolysis, the cathode is removed from the carbonate melts and carbon products still remain on the spiral galvanized iron cathode but fall off when the cathode is uncoiled. Afterwards, the extracted carbon product is treated by acid leaching (30 mL of 6 M HCl) for 48 hours, ultraphonic treatment (10–15 min), water washing (distilled water), and suction filtration (0.4 μm filter membrane), and finally dried in a drum wind drying oven at 80 °C for 4 hours for purification.
:20:13.3, wt%), a Li–Ca–K mixture (66.7:20:13.3, wt%), and a Li–Ca–Ba mixture (66.7:16.6:16.6, wt%), and binary electrolytes of a Li–K mixture (80:20, wt%) and a Li–Ba mixture (80:20, wt%). A detailed procedure for the production of solid carbon from CO2 and the purification of the as-prepared electrolytic carbon can be found in our previous publications.25,26 Anhydrous electrolyte is transferred into a 50 mL corundum crucible (Al2O3 > 99%) placed in a sealed steel reactor, and electrolysis is performed at a temperature of 750 °C between a galvanized iron cathode (active area of 5 cm2, Hebei Steady Metal Products Co., Ltd) and a nickel anode (active area of 10 cm2, Hebei Steady Metal Products Co., Ltd) under a 1 atm CO2 atmosphere. Prior to an enlarged constant current density of 200 mA cm−2 for rapid carbon deposition, we used a lower initial current density, such as 10 mA cm−2, to perform the pre-electrolysis process. Unless specifically noted, all the described current densities are in terms of the active area of the cathode. It is worth noting that the electricity consumed by heating up and the electrolysis process can be replaced by sustainable energy, such as solar energy in the STEP process.36–38 After electrolysis, the cathode is removed from the carbonate melts and carbon products still remain on the spiral galvanized iron cathode but fall off when the cathode is uncoiled. Afterwards, the extracted carbon product is treated by acid leaching (30 mL of 6 M HCl) for 48 hours, ultraphonic treatment (10–15 min), water washing (distilled water), and suction filtration (0.4 μm filter membrane), and finally dried in a drum wind drying oven at 80 °C for 4 hours for purification.
The elemental composition of the cathodically generated carbon product is revealed by using an energy dispersive spectrometer (EDS, X-Max, British Oxford Instruments Co., Ltd). The micromorphology and microstructure of these electrolytic carbon products are investigated by scanning electron microscopy (SEM, SIGMA, Zeiss Company) and transmission electron microscopy (TEM, JEM-2100, JEOL). Raman microspectroscopy (Raman, DXR, Thermo Fisher Scientific) and Fourier Transform Infrared Spectroscopy (FTIR, Tensor 27, Bruker) are used to reveal relevant structural features. Thermogravimetric analysis (TGA, Diamond, PerkinElmer Co., Ltd) is utilized to study the thermal stabilities. The Brunauer–Emmett–Teller (BET, Tristar-3020, Micromeritics Instrument Corporation) method is employed to determine the surface area. Furthermore, to study the crystal form of the carbon materials with spherical and tubular structures, carbon products deposited in Li–Ca–Na, Li–Ca–K, Li–Ca–Ba and Li–Ba are characterized by X-ray diffraction (XRD, D/MAX 2200, Rigaku).
3. Results and discussion
3.1 CO2 dissolution and splitting
Thermodynamic stability experiments of Li2CO3 have previously been performed and confirmed a visible CO2 dissolution in molten Li2CO3 under a CO2 atmosphere or upon Li2O addition.36–38 The mass loss of Li2CO3, which can be described with eqn (1), was low under an open atmosphere (∼0.04% CO2) up to 850 °C, but then exhibited a significant increase at 950 °C, as shown in Fig. 1. Additional observation is that an extended duration also led to a visible increase in the mass loss of Li2CO3, from ∼7% after 5 hours to ∼17% after 21 hours under 950 °C. However, when heated under 1 atm of CO2, Li2CO3 presented a nearly zero mass loss, ∼0.02%, at 950 °C after 5 hours, indicated by a green dot. From the decreased mass loss, we confirmed the rapid combination of excess CO2 and the produced but dissolved Li2O into Li2CO3, according to eqn (2). | ||
| Fig. 1 Thermodynamic stability analysis of Li2CO3 under diverse conditions.36 | ||
This interaction was further experimentally verified when foreign Li2O was added into molten Li2CO3. There was no mass loss found in Li2CO3–Li2O (90:10, wt%) at 850 °C for 5 hours. Moreover, with a larger fraction of Li2O (82% Li2CO3–18% Li2O), a mass gain was even observed after 5 hours duration. Besides Li2O, CaO can also serve as an absorbent for CO2 capture, but Li2O is much more dissolvable in eutectic carbonates. As further presented by Wang's group, a Li2O-containing ternary Li–Na–K carbonate mixture also exhibited a visibly enhanced CO2 dissolution process.39 All this information suggests that molten carbonates can readily achieve the regeneration process under a CO2 atmosphere or with sufficient Li2O introduction.
| Li2CO3 → Li2O + CO2 | (1) |
| CO2 + Li2O → Li2CO3. | (2) |
Additionally, fused carbonates, taking molten Li2CO3 as an example, have 10 moles of tetravalent carbon per liter available for subsequent electrochemical reduction; in contrast, the CO2 concentration in air is only ∼0.04%, which is equivalent to 10−5 moles of tetravalent carbon per liter.26,28,40 Thus, compared to atmospheric CO2, molten carbonates demonstrate a million-fold increase of reducible tetravalent carbon sites per unit volume, which could accelerate the carbon deposition reactions.
Relevant electrochemical reactions, involving carbon deposition at the cathode, oxygen formation at the anode, the regeneration process of carbonate melts, and the overall reaction in this electrolyzer, can be described with the following equations.25
Cathode reaction:
| CO32− + 4e− → C + 3O2−. | (3) |
Anode reaction:
| 2O2−–4e− → O2. | (4) |
Electrolyte reproduction:
| O2− + CO2 → CO32−. | (5) |
Overall reaction:
| CO2 → C + O2. | (6) |
As shown by Fig. 2a, a thick layer of carbon products aggregates on the galvanized iron cathode due to the direct splitting of CO32− during the reaction process (eqn (3)). Some frozen carbonates are found to adhere to the carbon surface and therefore acid leaching is shown to be necessary. Fig. 2b shows the purified carbon products after a series of post-treatments, and we used EDS to analyze the elemental composition within the indicated detection region (SEM image, right bottom), as displayed in Fig. 2c. C occupies an overwhelming molar ratio of over 90% with O and Au taking up the remaining less than 10%. Doubtlessly, Au comes from the coating operation for SEM-EDS characterization. As to the presence of O in carbon materials, Tang considers that the cathodically generated products are likely to be elemental carbon with few oxygen containing functional groups.41 The oxygen-containing groups are common for active carbons and are believed to be preferable for capacitance performance.42,43
 | ||
| Fig. 2 (a) Photograph of the cathode after electrolysis; (b) purified carbon powders; (c) EDS analysis of the obtained carbon products. | ||
The production capacity of a molten carbonate electrolyzer has been analyzed based on Faraday's law,25 and generally, 1 A h generates 0.1 g carbon materials and consumes approximately 0.4 g CO2. Now, we are trying to scale up the electrolysis setup to 10 A (cathode area 50 cm2, anode area 100 cm2), where 24 g carbon materials are prepared with 96 g CO2 consumed per day.
3.2 CS structure from Li–Ca–Na and Li–Ca–K carbonate melts
It is found that NiO has a low solubility in Li2CO3, merely 10−5 moles NiO per mole of molten Li2CO3, equivalent to 1 mg Ni per 100 g Li2CO3.44 If controlled well, the soluble nickel can serve as an efficient catalyst and nucleate valuable CNT growth.26 In the process of synthesizing CNTs or CNFs through molten Li2CO3 electrolysis, nickel nucleation sites, as previously explained, originate from anodic corrosion and redeposit at the cathode.26 A low initial activating current density, such as 10 mA cm−2, facilitates the oxidation of the nickel anode to form NiO due to its low reduction potential, and the partially generated NiO is constrained to the anodic surface as an oxide overlayer, while the remainder acts as soluble NiO available for reduction and redeposition as nickel spots to catalyze the following CNT deposition. Solid oxides have a single thermodynamically stable M–O phase or are in low-valence states, and their electroreduction can be achieved through a one-pot electro-deoxidation.24 The direct electro-deoxidation of solid NiO at the cathode can be expressed by:| NiO + 2e− → Ni + O2−. | (7) |
Fig. 3 depicts the SEM images of the carbon product formed in Li–Ca–Na (66.7:20:13.3, wt%) and Li–Ca–K (66.7:20:13.3, wt%) carbonate electrolysis between a galvanized iron cathode and a nickel anode at 750 °C. Evidently, the observed carbon conformation is seen to consist of nano-scale CSs that take up a dominant fraction of ∼90% in the cathodically deposited carbon products in both Li–Ca–Na and Li–Ca–K carbonates. Compared with Li–Ca–K carbonate melts (Fig. 3c and d), CSs from the Li–Ca–Na system (Fig. 3a and b) exhibit a smaller size, only one half or even less than that generated from the Li–Ca–K system. During the electrolysis process, implementation of a low initial current density is evidenced by the recorded electrolysis voltage of ∼1 V at a current density of 10 mA cm−2, as shown in Fig. 4. This low current density step sustains continuous formation of nickel metal deposits at the cathode surface that subsequently results in structured carbon growth. Different from the previously reported pure Li2CO3 electrolysis with a nickel anode,26 in Li–Ca–Na and Li–Ca–K carbonate melts, metal nucleation sites promote a multidimensional carbon deposition, which leads to CSs rather than CNTs being the preferable structure. As to the applications of CSs, excellent thermal stability, unique electronic properties, and most importantly the tailored structure enable CSs to be applied in different technical fields, such as lithium batteries, as a catalyst support in drug delivery, encapsulation of active transition metals, etc.22 Besides, as previously reported, after being heated to high temperatures, the CSs become graphitic and exhibit an increasing capacity behaviour of 280 mA h g−1 compared with 220 mA h g−1 for normal spheres.45 Further investigations on the application of the prepared CSs are expected in future studies.
 | ||
| Fig. 3 Carbon products generated from ternary Li–Ca–Na and Li–Ca–K carbonate melts at 750 °C (a and b are SEM images of the Li–Ca–Na electrolyte; c and d are SEM images of the Li–Ca–K electrolyte). | ||
 | ||
| Fig. 4 Cell–voltage curves plotted during electrolysis in Li–Ca–Na and Li–Ca–K carbonate melts with gradually increasing current density (10 mA cm−2 for 12 min, 20 mA cm−2 for 9 min, 60 mA cm−2 for 5 min, and finally 200 mA cm−2 for 90 min). | ||
We have noted that Na2CO3 and K2CO3 are more corrosive to the nickel anode than molten Li2CO3, and in this manner, nickel release and redeposition as nickel nucleation sites at the cathode in Na/K-containing electrolytes is theoretically preferable to pure Li2CO3. However, as proved in Fig. 3, CSs instead of CNTs become the primary structure following Li–Ca–Na and Li–Ca–K molten carbonate electrolysis, indicative of visible interference from Na+, K+ or Ca2+ in CNT structure formation. However, as far as we know, Li–Ca carbonates also yield a large number of CNTs,40 and therefore the CS growth may be attributed to the presence of Na2CO3 and K2CO3. The potential needed by Na+ and K+ for reduction to the corresponding alkali metals may provide answers to the question how CNT growth is restrained and CS growth is facilitated. Compared with Li2CO3, the lower reduction potential required by Na2CO3 to deposit Na metal and K2CO3 to deposit K metal makes Na and K metals co-deposit on the cathode as one reduction product which is thermodynamically preferred. As calculated from the relevant thermodynamic data taken from the website of NIST,46 the reduction potential needed by Na2CO3 and K2CO3 to precipitate Na and K metals at 750 °C falls in the range of 2.2–2.4 V, lower than the initial cell voltage of more than 2.5 V during electrolysis at 200 mA cm−2. These data provide supporting evidence for the conjecture that carbon production is accompanied by alkali metal deposition. In fact, in the last century when the nature of the primary cathodic reaction in molten electrolytes was not definitely established, it had been widely suggested that the cathode process included alkali metal deposition and carbon generation possibly due to a series of secondary reactions.47 On the basis of the above analysis, we speculate that the CS structure is formed in Li–Ca–Na and Li–Ca–K eutectic carbonates as follows: carbon growth starts at nickel nucleation sites, but for later stages, the co-deposited alkali metal, coupled with the interface modification of CaO from CaCO3 splitting, interferes in the one-dimensional carbon growth to form CNTs and facilitates multi-dimensional carbon growth to generate the CS structure. In addition, the cell–voltage curves plotted in Li–Ca–Na melts and Li–Ca–K melts present a similar trend when an increasing current density is applied. In particular, the voltage of 200 mA cm−2 decreases with extended duration as the galvanized iron cathode gradually evolves into a graphite electrode with a larger active surface area (carbon deposits cover the original cathodic surface).
Besides the primary generation of CSs, bits of CNTs could still form at the cathode subsequent to Li–Ca–Na carbonate electrolysis, as proved in Fig. 5. Tangled CNTs intersperse among the CS structure, taking up an approximate fraction of 10%, illustrated by SEM images of low magnification (Fig. 5a, b and c). Fig. 5d presents a clear and magnified CNT structure, characterized by a diameter of 100–200 nm. Nickel nanoparticles originating from the low initial activating current step nucleate the CNT structure formation. It is found that except for useful nanoparticles located at CNT tips, there are still some nickel nanoparticles aside from the nanotube structure, useless for CNT formation and growth.34 Exclusion of Na2CO3 from Li–Ca–Na carbonate melts (i.e. eutectic Li–Ca carbonates), interestingly, provides a co-production of CNTs and cement (CaO).40 As further reported, CNTs synthesized from Li–Ca carbonate melts (with sufficient CaCO3 addition, 50 g Li2CO3/10 g CaCO3) possess a thin-walled structure, ∼50 nm wall thickness, compared with 200 nm wall thickness of CNTs derived from a pure Li2CO3 electrolyte.40 Thereby, selective synthesis of CNT and CS structures could be alternatively controlled by excluding/adding Na2CO3 and K2CO3, where the interference from Na+ and K+ seems to be favourable for CS structure formation.
 | ||
| Fig. 5 CNTs generated from Li–Ca–Na carbonate melt electrolysis. | ||
3.3 Co-production of CNTs and CSs in Li–K carbonate electrolytes
Li–Na carbonate composites mixed at 90:10, wt% and 50:50, wt%, however, still provide a carbon product containing >80% CNTs.26 The cell voltage recorded during Li–Na system electrolysis is lower than 2.2 V, which is not enough to deposit Na metal (the potential required by Na2CO3 to produce Na metal is 2.24–2.37 V at 750 °C), and this can be used to account for the vast CNT yield in Li–Na melts. In contrast, K2CO3 demonstrates enhanced interference in CNT production but a preference for CS structure formation, as is evident in Fig. 6.
 | ||
| Fig. 6 SEM of carbon products prepared in Li–K carbonates (80:20, wt%). | ||
As with electrolysis in Li–Ca–Na and Li–Ca–K melts, prior to high carbon growth currents, a low initial current is applied to form nickel nucleation sites. Fig. 6a and b show lower-magnification SEM images of a mixture of CNTs and CSs, while Fig. 6c and d show the micromorphologies of CNTs and CSs, respectively. Obviously, a yield of ∼50% but less than 80% CNTs (marked with orange arrows) with a diameter of ∼200 nm or larger is presented, comixing with clusters of CSs (marked with green arrows) and irregular carbon particles. It should be noted that the electrolysis is performed in a 30 mL nickel crucible with the inner wall acting as the anode rather than using nickel wire as the anode. This measure can effectively avoid anode fracture, often occurring at the interface between the electrolyte and the atmosphere, due to the severe corrosion caused by high temperature and the molten salt environment.
3.4 CNTs from Li–Ca–Ba and Li–Ba electrolytes
Replacement of Na2CO3 and K2CO3 by BaCO3 to form Li–Ca–Ba composites (66.7:16.6:16.6, wt%) provides an elevated fraction of CNTs in electrolytic carbon, as shown in Fig. 7a and b. During this synthesis process, the activating current step is still utilized to form nickel nanoparticles at the cathode. Approximately 70% tangled CNTs (shown in Fig. 7a and b) are observed in Li–Ca–Ba carbonate melts, far more than 10% CNTs prepared in the Li–Ca–Na system. Exclusion of CaCO3 from Li–Ca–Ba carbonate (i.e. Li–Ba (80:20, wt%)) melts also yields a large amount of CNTs, in excess of 80% in our lab, as proved in Fig. 7c. Fig. 7d clearly shows that the wall thickness of CNTs from the Li–Ba system falls in the range of 50–100 nm, similar to that synthesized in the Li–Ca electrolyte (50 g Li2CO3/10 g CaCO3) and thinner than CNTs in pure Li2CO3 (∼200 nm).40 An additional observation is that, compared to Li–Ba eutectic, CNTs grown in the Li–Ca–Ba system demonstrate a smaller diameter, ∼50 nm, merely a quarter of CNTs obtained from Li–Ba carbonates. As previously noted CaO originating from CaCO3 splitting has a low solubility in molten Li2CO3,48 and this provides an opportunity to adequately modify the interface between the electrolyte and cathode, leading to thinner CNTs’ growth. Using discarded brass and stainless steel as the cathode and Al2O3-coated nickel as the anode to electrolyze molten Li2CO3, Douglas observed a smaller and concentrated CNTs’ diameter, suggesting that besides the electrolyte composition, the CNT diameter is also significantly affected by electrode constituents.49 The clean, non-defect CNT wall structure shown in Fig. 7c and d indicates the formation of excellent CNTs, as it could enhance the van der Waals force among the tubes and electron transport in the tubes, which endows CNTs with satisfactory mechanical properties and conductivity behaviour. In the Li–Ca–Ba system, we observe a tangled CNT structure, while in the case of CNTs from Li–Ba binary composites, a straight CNT structure is observed. As previously noted, the curvature of these CO2-derived CNTs can be further controlled by introduction of Li2O, which leads to a yield of tangled CNTs with increasing synthetic sp3 content.34 Interestingly, these CNTs have been utilized to fabricate Li-ion battery and Na-ion battery electrode materials, and the capacity of the defective CNTs is found to steadily increase over the cycling process, from the initial 370 mA h g−1 to 460 mA h g−1 after 200 cycles, while straight CNTs show an unchanged capacity.13 Such an increased capacity could be attributed to the defect-induced modification in storage processes over cycling courses. In addition to batteries, CNTs also demonstrate broad application prospects in other fields, such as composite materials, coatings and films, microelectronics, biotechnology, etc.3
 | ||
| Fig. 7 Carbon products collected from Li–Ca–Ba carbonates (a and b) and Li–Ba carbonates (c and d). | ||
3.5 Characterization of the carbon materials
The two types of carbon structures, CSs and CNTs, are characterized by TEM to further study their structural features. Fig. 8a shows the TEM image of CNTs deposited in the Li–Ca–Ba system, which provides evidence for the hollow structure. Furthermore, the diameters of the CNTs fall in the range of 50 to 100 nm, agreeing well with the SEM data. It is observed from Fig. 8b that CSs of the Li–Ca–K system amalgamate together via sphere coalescence, presumably due to the high temperature environment.22 In comparison, the CS structure presented in Fig. 8c, prepared in Li–Ca–Ba composites, demonstrates a higher dispersion, which can be ascribed to the enhanced interface modification effect of CaO at the presence of BaCO3.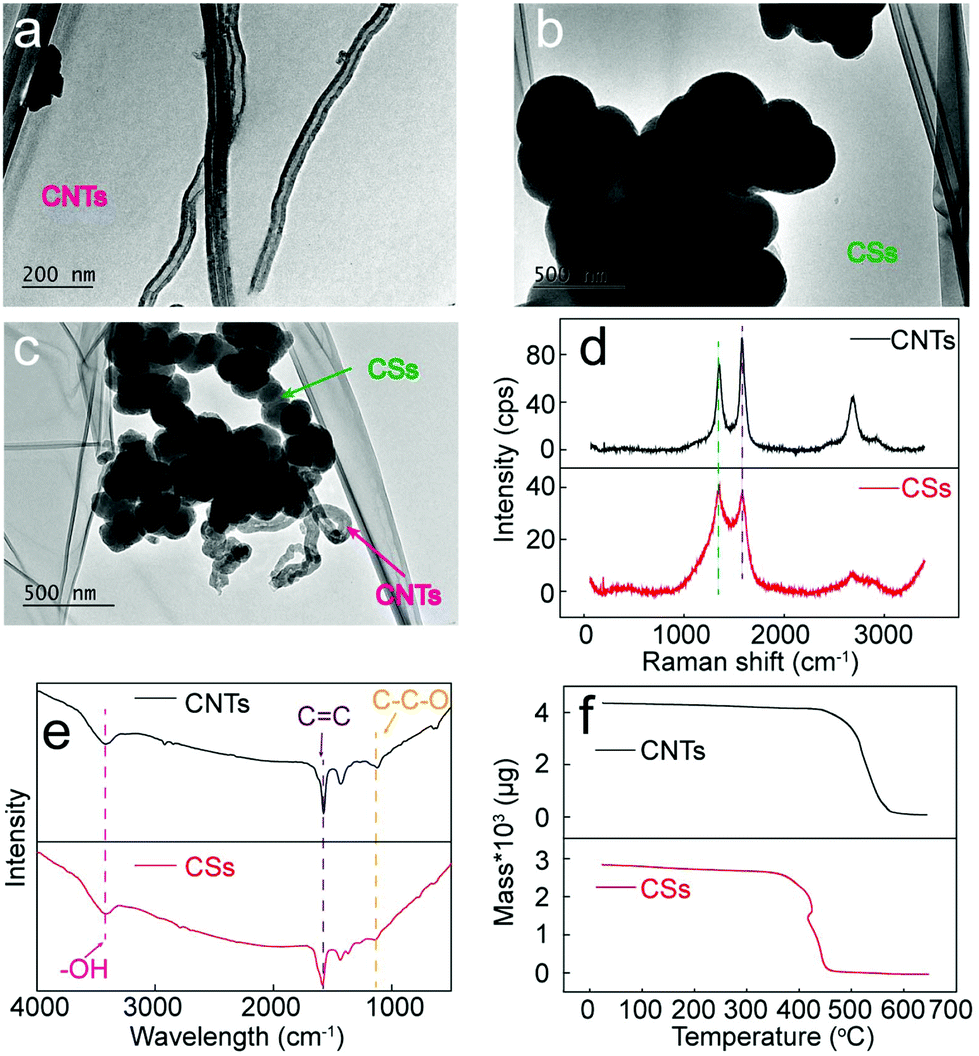 | ||
| Fig. 8 (a–c) TEM images of CNTs and CSs; (d) Raman spectrum of CNTs and CSs; (e) FTIR spectrum of CNTs and CSs; (f) TGA of CNTs and CSs. | ||
The Raman spectrum is recorded to evaluate the graphitization degree of the synthesized CSs and CNTs, as depicted in Fig. 8d. The Raman peaks arising from 1350 cm−1 and 1580 cm−1 correspond to the characteristic disorder-induced mode (D band) and the high frequency E2g first order mode (G band), respectively. The intensity ratio between the D band and G band (ID/IG) is cited as a significant parameter to evaluate graphitization. For CNTs of the Li–Ba system, the ID/IG value falls in the range of 0.7 to 0.8, well consistent with the commercial CNTs, while the ID/IG value of CSs formed in the Li–Ca–K system increases to ∼1.1, indicating higher surface disordering caused by the K+-induced interference and the CaO-induced interface modification.
Fig. 8e shows the FTIR spectrum of the CNTs (Li–Ba system) and CSs (Li–Ca–K system), which demonstrates a good conformance. Peaks at 3450 cm−1 and 1110 cm−1 correspond to the stretching vibration of –OH and C–C–O, respectively. The presence of the C–C–O group provides supporting evidence for the conclusion that O element of the EDS spectrum is related to the oxygen containing functional groups. Moreover, the FTIR peak at 1600 cm−1 signifies the unsaturation property of the CNTs and CSs, which may endow carbon materials with an excellent conductivity, but further relevant measurements are required to verify this assumption.
CNTs (Li–Ba system) and CSs (Li–Ca–K system) are further tested by TGA (air, 10 °C min−1) measurement to analyse their thermal oxidation temperature, as depicted in Fig. 8f. Initially, the minor weight loss below 350 °C might be due to the release of volatile matter, such as moisture. Then, compared with the mass loss temperature at approximately 350 °C of CSs, CNTs demonstrate a strengthened thermal stability of over 400 °C, evident in the top and bottom panels of Fig. 8f, respectively. An additional observation is that after being heated to 650 °C, almost nothing is left, suggesting that the carbon materials are carbon plus a few oxygen functional groups without any other impurities.
The surface area of the carbon structures synthesized by the indicated method, as we have previously noted, significantly depends on the applied temperature and cell voltage/current density.25,26 Generally, lower temperature and larger cell voltage/current density favour a higher BET surface area. Herein, the measured BET surface areas of CSs synthesized in Li–Ca–K carbonates and a mixture of CNTs and CSs deposited in Li–Ca–Ba carbonates are 18 and 11 m2 g−1, respectively. The low surface area value can be attributed to the higher applied temperature of 750 °C, which accelerates the carbon deposition and facilitates compact carbon structure formation. Moreover, according to a previous report, the surface area of CSs varies widely from less than 2 m2 g−1 to very high values, over 1200 m2 g−1, and hard spheres are associated with low surface area carbons, signifying that the CSs synthesized in this work are mainly hard spheres.22
To further reveal the structural features of these carbon materials, X-ray diffraction is employed to characterize their crystal structure. Graphene,50 fullerenes51 and CNTs52 are sp2 carbon bonded materials, and in particular, CNTs have an excellent laminar hexagonal graphite crystalline structure.53 X-ray diffraction patterns of the carbon product prepared in the Li–Ca–Na, Li–Ca–K, Li–Ca–Ba and Li–Ba carbonate systems are depicted in Fig. 9a–d.
 | ||
| Fig. 9 (a) XRD patterns of carbon products deposited in Li–Ca–Na carbonates; (b) XRD patterns of carbon products deposited in Li–Ca–K carbonates; (c) XRD patterns of carbon products deposited in Li–Ca–Ba carbonates; (d) XRD patterns of carbon products deposited in Li–Ba carbonates. | ||
For carbon products obtained from Li–Ca–Na and Li–Ca–K carbonates, a graphite peak (26°) with a large half-peak width is found, as evident in Fig. 9a and b, implying a messy arrangement of atoms and a lower graphite level. These random atoms may be related to the interference of Na+ and K+ that subsequently results in an uncontrolled, multidimensional growth orientation. In addition, compared with Li–Ca–K, carbon materials from Li–Ca–Na electrolysis confirm a stronger crystal degree as proved by the apparently enhanced peak intensity. This finding suggests that the CNT fraction in the Li–Ca–Na system is a bit larger than that in the Li–Ca–K system. It has been demonstrated that exclusion of Na2CO3 and K2CO3 from electrolytes endows the corresponding carbon material with an increased CNT fraction. The sharp and clear carbon characteristic peak at 26° (002) in the XRD patterns of Li–Ca–Ba and Li–Ba carbonates (shown in Fig. 9c and d) can be assigned to the hexagonal graphite and diffraction planes, and represents an improved crystallinity compared with that of Na/K-containing carbonates. Additionally, resolved XRD peaks at 43° and 44° (marked with a red arrow in Fig. 9c and d) are observed and provide supporting evidence for the homogeneity of the electrolytic CNTs formed in Li–Ca–Ba and Li–Ba composites.
4. Conclusions
In this paper, we introduce the continuous CO2 dissolution and subsequent electrochemical conversion to shaped carbon materials of CSs and CNTs in a molten salt electrolyzer. Ternary eutectic Li–Ca–Na and Li–Ca–K carbonates favor the CS structure formation presumably due to the presence of Na+ and K+ as well as the interface modification of CaO. It is also proved that K2CO3 exhibits stronger interference with one-dimensional CNT growth as only 50% CNTs are observed in the Li–K mixture, lower than >80% CNTs in either Li–Na (90:10, wt%) or Li–Na (50:50, wt%) carbonate systems. Replacing Na2CO3 and K2CO3 by BaCO3 (Li–Ca–Ba) provides carbon products with 70% CNT fraction, much higher than Na+ and K+-containing carbonates. Besides, the SEM and TEM data show that the diameter of CNTs generated in the Li–Ca–Ba system decreases to merely ∼50 nm due to the interface modification induced by insoluble CaO. The Li–Ba system provides a chemical environment for a larger fraction of CNT production as well, ∼80%, where the wall thickness of CNTs is seen to be thinner than that of pure Li2CO3 but thicker than that of Li–Ca–Ba. In conclusion, CNTs and CSs with varying structural parameters are synthesized through regulating the electrolyte composition. Further research on preparing CSs and CNTs with desirable size and exploring their utilization in diverse fields is expected.
Conflicts of interest
There are no conflicts to declare.Acknowledgements
This work was supported by the National Natural Science Foundation of China (No. 21476046, 21306022 and 51490650), the Science Fund for Distinguished Young Scholars of Heilongjiang Province of China (No. JC2017002), the China Postdoctoral Science Foundation (No. 2013M540269), the Postdoctoral Science Foundation of Heilongjiang Province of China (No. LBH-TZ0417), the Innovative Team of Science and Technology in Heilongjiang Higher Education Institutes (No. 2013TD004) and Northeast Petroleum University (No. SJQHB201602 and YJSCX2016-018 NEPU). We are grateful to Professor Stuart Licht (The George Washington University) for valuable contributions to this research.Notes and references
- S. Iijima, Nature, 1991, 354, 56–58 CrossRef CAS.
- C. Journet, W. Maser, P. Bernier, A. Loiseau, M. L. De La Chapelle, D. l. S. Lefrant, P. Deniard, R. Lee and J. Fischer, Nature, 1997, 388, 756–758 CrossRef CAS.
- M. F. De Volder, S. H. Tawfick, R. H. Baughman and A. J. Hart, Science, 2013, 339, 535–539 CrossRef CAS PubMed.
- D. Janas and K. K. Koziol, Nanoscale, 2014, 6, 3037–3045 RSC.
- X. Fang, J. Zang, X. Wang, M.-S. Zheng and N. Zheng, J. Mater. Chem. A, 2014, 2, 6191–6197 CAS.
- Q. Sun, B. He, X.-Q. Zhang and A.-H. Lu, ACS Nano, 2015, 9, 8504–8513 CrossRef CAS PubMed.
- Z. Su, J. Tao, J. Xiang, Y. Zhang, C. Su and F. Wen, Mater. Res. Bull., 2016, 84, 445–448 CrossRef CAS.
- J. Han, G. Xu, B. Ding, J. Pan, H. Dou and D. R. MacFarlane, J. Mater. Chem. A, 2014, 2, 5352–5357 CAS.
- R. Sattar, A. Kausar and M. Siddiq, J. Plast. Film Sheeting, 2015, 31, 186–224 CrossRef CAS.
- H. Kurita, H. Kwon, M. Estili and A. Kawasaki, Mater. Trans., 2011, 52, 1960–1965 CrossRef CAS.
- G. V. Ramana, M. Ali and V. V. Srikanth, J. Nanosci. Nanotechnol., 2015, 15, 715–720 CrossRef CAS PubMed.
- C. Yang, J. Shen, C. Wang, H. Fei, H. Bao and G. Wang, J. Mater. Chem. A, 2014, 2, 1458–1464 CAS.
- S. Licht, A. Douglas, J. Ren, R. Carter, M. Lefler and C. L. Pint, ACS Cent. Sci., 2016, 2, 162–168 CrossRef CAS PubMed.
- X.-F. Luo, C.-H. Yang, Y.-Y. Peng, N.-W. Pu, M.-D. Ger, C.-T. Hsieh and J.-K. Chang, J. Mater. Chem. A, 2015, 3, 10320–10326 CAS.
- Q. Cui, F. Gao, S. Mukherjee and Z. Gu, Small, 2009, 5, 1246–1257 CrossRef CAS PubMed.
- P. Kang, S. Zhang, T. J. Meyer and M. Brookhart, Angew. Chem., Int. Ed., 2014, 53, 8709–8713 CrossRef CAS PubMed.
- N. Arora and N. Sharma, Diamond Relat. Mater., 2014, 50, 135–150 CrossRef CAS.
- Y. Zhang, H. Gu and S. Iijima, Appl. Phys. Lett., 1998, 73, 3827–3829 CrossRef CAS.
- K. Moothi, G. S. Simate, R. Falcon, S. E. Iyuke and M. Meyyappan, Langmuir, 2015, 31, 9464–9472 CrossRef CAS PubMed.
- M. Gougis, A. Tabet-Aoul, D. Ma and M. Mohamedi, Sens. Actuators, B, 2014, 193, 363–369 CrossRef CAS.
- A. Eatemadi, H. Daraee, H. Karimkhanloo, M. Kouhi, N. Zarghami, A. Akbarzadeh, M. Abasi, Y. Hanifehpour and S. W. Joo, Nanoscale Res. Lett., 2014, 9, 393–405 CrossRef PubMed.
- A. A. Deshmukh, S. D. Mhlanga and N. J. Coville, Mater. Sci. Eng., R, 2010, 70, 1–28 CrossRef.
- H. Yin, X. Mao, D. Tang, W. Xiao, L. Xing, H. Zhu, D. Wang and D. R. Sadoway, Energy Environ. Sci., 2013, 6, 1538–1545 CAS.
- W. Xiao and D. Wang, Chem. Soc. Rev., 2014, 43, 3215–3228 RSC.
- H. Wu, Z. Li, D. Ji, Y. Liu, G. Yi, D. Yuan, B. Wang and Z. Zhang, RSC Adv., 2017, 7, 8467–8473 RSC.
- H. Wu, Z. Li, D. Ji, Y. Liu, L. Li, D. Yuan, Z. Zhang, J. Ren, M. Lefler and B. Wang, Carbon, 2016, 106, 208–217 CrossRef CAS.
- D. Ji, Y. Liu, Z. Li, D. Yuan, G. Yang, M. Jiang, Y. Wang, Y. Yu and H. Wu, Int. J. Hydrogen Energy, 2017, 42, 18156–18164 CrossRef CAS.
- Y. Liu, D. Ji, Z. Li, D. Yuan, M. Jiang, G. Yang, Y. Yu, Y. Wang and H. Wu, Int. J. Hydrogen Energy, 2017, 42, 18165–18173 CrossRef CAS.
- H. Wu, D. Ji, L. Li, D. Yuan, Y. Zhu, B. Wang, Z. Zhang and S. Licht, Adv. Mater. Technol., 2016, 1, 1600092–1600101 CrossRef.
- M. Mikkelsen, Energy Environ. Sci., 2010, 3, 43–81 CAS.
- H. V. Ijije, C. Sun and G. Z. Chen, Carbon, 2014, 73, 163–174 CrossRef CAS.
- B. Kaplan, H. Groult, A. Barhoun, F. Lantelme, T. Nakajima, V. Gupta, S. Komaba and N. Kumagai, J. Electrochem. Soc., 2002, 149, D72–D78 CrossRef CAS.
- I. A. Novoselova, N. F. Oliinyk, A. B. Voronina and S. V. Volkov, Z. Naturforsch., A: Phys. Sci., 2008, 63, 467–474 CrossRef CAS.
- J. Ren, F. F. Li, J. Lau, L. Gonzálezurbina and S. Licht, Nano Lett., 2015, 15, 6142–6148 CrossRef CAS PubMed.
- H. V. Ijije, R. C. Lawrence and G. Z. Chen, RSC Adv., 2014, 4, 35808–35817 RSC.
- S. Licht, B. Wang and H. Wu, J. Phys. Chem. C, 2011, 115, 11803–11821 CAS.
- S. Licht and H. Wu, J. Phys. Chem. C, 2011, 115, 25138–25147 CAS.
- S. Licht, Adv. Mater., 2011, 23, 5592–5612 CrossRef CAS PubMed.
- B. Deng, J. Tang, X. Mao, Y. Song, H. Zhu, W. Xiao and D. Wang, Environ. Sci. Technol., 2016, 50, 10588–10595 CrossRef CAS PubMed.
- S. Licht, M. Lefler, J. Ren and J. Vicini, 2016, arXiv preprint arXiv:1607.02220.
- D. Tang, H. Yin, X. Mao, W. Xiao and D. Wang, Electrochim. Acta, 2013, 114, 567–573 CrossRef CAS.
- P. Ramesh and S. Sampath, Anal. Chem., 2003, 75, 6949–6957 CrossRef CAS PubMed.
- F. Gao, X. Guo, J. Yin, D. Zhao, M. Li and L. Wang, RSC Adv., 2011, 1, 1301–1309 RSC.
- K. i. Ota, S. Mitsushima, S. Kato, S. Asano, H. Yoshitake and N. Kamiya, J. Electrochem. Soc., 1992, 139, 667–671 CrossRef CAS.
- Z. J. Yi, J. K. Yong, G. Chao, Q. Z. Yan, A. Huczko, M. Endo and H. W. Kroto, Carbon, 2006, 44, 724–729 CrossRef.
- M. W. Chase, Jr., J. Phys. Chem. Ref. Data, 1998, 9, 1–1951.
- G. Janz and A. Conte, Electrochim. Acta, 1964, 9, 1269–1278 CrossRef CAS.
- S. Licht, H. Wu, B. Wang, J. Lau and C. Hettige, ECS Trans., 2011, 41, 191–199 Search PubMed.
- A. Douglas, N. Muralidharan, R. E. Carter and C. L. Pint, ACS Sustainable Chem. Eng., 2017, 5(8), 7104–7110 CrossRef CAS.
- M. Ouyang, J.-L. Huang, C. L. Cheung and C. M. Lieber, Science, 2001, 291, 97–100 CrossRef CAS PubMed.
- H. Kim, J. Lee, S.-J. Kahng, Y.-W. Son, S. Lee, C.-K. Lee, J. Ihm and Y. Kuk, Phys. Rev. Lett., 2003, 90, 216107 CrossRef PubMed.
- L. Chico, V. H. Crespi, L. X. Benedict, S. G. Louie and M. L. Cohen, Phys. Rev. Lett., 1996, 76, 971–974 CrossRef CAS PubMed.
- Y. S. Song, J. R. Youn and T. G. Gutowski, Composites, Part A, 2009, 40, 1257–1265 CrossRef.
Footnote |
| † These authors contributed equally to this research work. |
| This journal is © the Partner Organisations 2018 |