 Open Access Article
A self-healable fluorescence active hydrogel based on ionic block copolymers prepared via ring opening polymerization and xanthate mediated RAFT polymerization†
Sovan Lal
Banerjee
a,
Richard
Hoskins
b,
Thomas
Swift
 b,
Stephen
Rimmer
 *b and
Nikhil K.
Singha
 *a
*a
aRubber Technology Centre, Indian Institute of Technology, Kharagpur-721302, India. E-mail: nks@rtc.iitkgp.ernet.in
bSchool of Chemistry and Biosciences, University of Bradford, Bradford, West Yorkshire BD7 1DP, UK. E-mail: s.rimmer@bradford.ac.uk
First published on 12th February 2018
Abstract
In this work we report a facile method to prepare a fluorescence active self-healable hydrogel via incorporation of fluorescence responsive ionic block copolymers (BCPs). Ionic block copolymers were prepared via a combined effect of ring opening polymerization (ROP) of ε-caprolactone and xanthate mediated reversible addition–fragmentation chain transfer (RAFT) polymerization. Here polycaprolactone (PCL) was modified with xanthate to prepare a PCL based macro-RAFT agent and then it was utilized to prepare block copolymers with cationic poly(2-(methacryloyloxy)ethyltrimethyl ammonium chloride) (PCL-b-PMTAC) and anionic poly(sodium 4-vinylbenzenesulfonate) (PCL-b-PSS). During the block formation, the cationic segments were randomly copolymerized with a trace amount of fluorescein O-acrylate (FA) (acceptor) whereas the anionic segments were randomly copolymerized with a trace amount of 9-anthryl methylmethacrylate (AMMA) (donor) to make both the segments fluorescent. The block copolymers form micelles in a DMF![[thin space (1/6-em)]](https://www.rsc.org/images/entities/char_2009.gif) :
:![[thin space (1/6-em)]](https://www.rsc.org/images/entities/char_2009.gif) water mixture (1
water mixture (1![[thin space (1/6-em)]](https://www.rsc.org/images/entities/char_2009.gif) :
:![[thin space (1/6-em)]](https://www.rsc.org/images/entities/char_2009.gif) 4 volume ratio). The ionic interaction of two BCPs was monitored via Förster resonance energy transfer (FRET) and zeta potential measurements. The oppositely charged BCPs were incorporated into a polyacrylamide (PAAm) based hydrogel that demonstrated self-healing behavior and is also highly fluorescent.
4 volume ratio). The ionic interaction of two BCPs was monitored via Förster resonance energy transfer (FRET) and zeta potential measurements. The oppositely charged BCPs were incorporated into a polyacrylamide (PAAm) based hydrogel that demonstrated self-healing behavior and is also highly fluorescent.
Introduction
After the invention of the first synthetic hydrogel in 1960 by Lim and Wichterle,1 they have been extensively used in different biomedical applications e.g. in tissue engineering,2 drug delivery,3 cell culture,4 and artificial organ development.5,6 The extensive use of different types of hydrogels in several potential fields is due to their high water content, elasticity, highly porous micro structure and 3D networks, which resemble biological tissues.7 Recently, fluorescence active hydrogels have been developed for use in several applications due to their optical response,8 which can be utilized in drug delivery systems, glucose sensors,9,10 thermoresponsive sensors,11 and insulin sensors,12 real time monitoring of the hydrogel behaviours like deformation, movement, and degradation, fluorescence guided monitoring of surgery etc.13–17 Many fluorescent materials such as conjugated conductive polymers,18,19 fluorescent nanoparticles (i.e. Ag NPs),20,21 fluorescent organic nanoparticles (FONs),22 carbon quantum dots (QDs), nanodots23–25 and fluorescent dyes26 are used to incorporate luminescent properties into the polymeric hydrogel system. However, these materials suffer from several issues including: (i) high probability of aggregation of the nanodots or nanomaterials, resulting in self-quenching of fluorescence, (ii) the possibility that leaching of the nano materials can cause a toxic effect on the environment, and (iii) low structural stability in the presence of physical and chemical impacts. These issues could be overcome by employing a functional organic polymer consisting of covalently bound fluorophore units.27 Incorporation of covalently bound fluorescent labels has been shown to be a powerful way of studying both the internal conformational changes of stimuli responsive polymers28,29 and the complexation of multiple polymers in solution,30,31 and FRET analysis using two chromophores can provide additional information on both systems.32,33 Recently, Ma et al. reported a protein based hydrogel that can show green and red fluorescence but this system exhibits fluorescence only in the UV range, which hinders their in vivo application, and they are of low mechanical strength.17 Along with the fluorescence properties it will be advantageous for a hydrogel to have self-healing behaviour. Self-healing is a biological phenomenon that provides a spontaneous recovery of the wound without any external stimuli. In a synthetic polymeric system self-healing can be of two types: (i) induced self-healing like pH,34 light,35 heat36etc. and (ii) non-induced self-healing via the formation of ionic interaction,34 H-bonding,37 π–π stacking,38 metal co-ordination,39etc. So far, reports on hydrogels having multifunctional ability like self-healing and fluorescent properties have been rare. So in this work, our aim is to synthesize tough, self-healable, fluorescence active and non-toxic multifunctional hydrogels. Labelling with fluorescent groups on the different polymers allowed us to use Förster resonance energy transfer (FRET) to study the interactions of the two oppositely charged blocks in aqueous media. The materials were also shown to be non-cytotoxic in cell culture.In this case we first synthesized oppositely charged block copolymers using polycaprolactone-RAFT (PCL-RAFT) as a macro RAFT agent. PCL-RAFT was synthesized via ring opening polymerization (ROP) of ε-caprolactone (CL) using butanol as a ring opening initiator followed by the modification of the end group to incorporate xanthate functionality. This macro RAFT agent was utilized to prepare positively and negatively charged ionic block copolymers (BCPs). During the formation of ionic block copolymers a trace amount of fluorescein O-acrylate (FA) and 9-anthryl methylmethacrylate (AMMA) was copolymerized with cationic and anionic segments, respectively, to make them fluorescent. The interaction of the BCPs was monitored via Förster resonance energy transfer (FRET) and zeta potential measurement. These two fluorescence active BCPs were incorporated into poly(acrylamide) based hydrogels and the self-healing property of the hydrogel was monitored using mechanical analysis.
Experimental
Materials
ε-Caprolactone (CL) (Aldrich, St Louis, USA, 99%) was dried over calcium hydride (CaH2) for 48 h at room temperature and then distilled under reduced pressure. Triethylamine (Et3N), 2-bromopropionyl bromide (97%) (BiBr), stannous 2-ethylhexanoate [Sn(Oct)2] (99%), 2-(methacryloyloxy)ethyltrimethyl ammonium chloride (MTAC) solution (80% in H2O) (monomer, purified by passing through a basic alumina column), 4-vinyl sodium styrenesulfonate (SS) (monomer), acrylamide (monomer), N,N,N′,N′-tetramethyl ethylenediamine (TEMED) (catalyst), ammonium persulfate (APS) (thermal initiator), 4,4′-azobis (4-cyanovaleric acid) (ABCVA) (thermal initiator), N,N′-methylene bisacrylamide (MBA) (crosslinker), fluorescein O-acrylate (FA), n-butanol (BuOH), carbon disulfide (CS2), potassium hydroxide (KOH), diethyl ether (Et2O), dicholoromethane (CH2Cl2, DCM), ethanol (EtOH), sodium hydrogen carbonate (NaHCO3) and anhydrous magnesium sulfate (MgSO4) were purchased from Sigma-Aldrich, USA. 9-Anthryl methylmethacrylate (AMMA) was purchased from TCI Chemicals, Japan. All the reagents for the in vitro MTT assay test were procured from Sigma Aldrich, USA. The NIH 3T3 fibroblast cell line was obtained from the National Centre for Cell Science, Pune, India.Methods
![[double bond, length as m-dash]](https://www.rsc.org/images/entities/char_e001.gif) S)) and mass spectra (the peak at 198.8 corresponds to the combined weight of the xanthate and potassium).
S)) and mass spectra (the peak at 198.8 corresponds to the combined weight of the xanthate and potassium).
![[thin space (1/6-em)]](https://www.rsc.org/images/entities/char_2009.gif) :
:![[thin space (1/6-em)]](https://www.rsc.org/images/entities/char_2009.gif) 4 volume ratio) for 16 h to make the hydrogel free from unreacted monomer and DMF. After that, the hydrogel was taken out of the solution and allowed to dry in a vacuum oven at 50 °C for 48 h. A polyacrylamide based hydrogel having no BCPs and a hydrogel that consists of only cationic and anionic BCP micelles were also prepared as a control sample. Details of the synthesis and formulation are summarized in Table 1.
4 volume ratio) for 16 h to make the hydrogel free from unreacted monomer and DMF. After that, the hydrogel was taken out of the solution and allowed to dry in a vacuum oven at 50 °C for 48 h. A polyacrylamide based hydrogel having no BCPs and a hydrogel that consists of only cationic and anionic BCP micelles were also prepared as a control sample. Details of the synthesis and formulation are summarized in Table 1.
| Batch | Cationic micellef | Anionic micellef |
|---|---|---|
a Amount of acrylamide = 4 g [total monomer concentration = 20 wt%].
b Amount of MBA = 0.04 g [1 wt% of monomer amount].
c Amount of APS = 0.04 g [1 wt% of monomer amount].
d Amount of TEMED = 0.08 g [2 wt% of monomer amount].
e Total batch volume = 20 ml.
f Conc. = 4 mg ml−1 in a 1![[thin space (1/6-em)]](https://www.rsc.org/images/entities/char_2009.gif) : :![[thin space (1/6-em)]](https://www.rsc.org/images/entities/char_2009.gif) 4 DMF : water mixture. 4 DMF : water mixture.
|
||
| S1 | 2 ml (FAPCL70-b-PMTAC48) | 2 ml (AMMAPCL70-b-PSS48) |
| S2 | 2 ml (FAPCL70-b-PMTAC97) | 2 ml (AMMAPCL70-b-PSS97) |
| S3 | 2 ml (FAPCL70-b-PMTAC48) | X |
| S4 | X | 2 ml (AMMAPCL70-b-PSS48) |
| S5 | 2 ml (FAPCL70-b-PMTAC97) | X |
| S6 | X | 2 ml (AMMAPCL70-b-PSS97) |
| S7 | X | X |
Characterisation
Fourier transform infrared spectroscopy (FTIR) (PerkinElmer; model: Spectrum-2) was used to characterize the prepared sample. FTIR was operated in an ATR mode and at a scanning range of 500–4000 cm−1. Diffusion ordered NMR spectroscopy (DOSY) spectra and proton nuclear magnetic resonance (1H NMR) spectra were recorded on a Bruker Avance III 400 MHz spectrometer at room temperature (25 ± 1 °C) using D2O as solvent.In the case of DOSY analysis the gradient strength was gradually increased from 2% to 95% in a sequence of 16 steps. Bipolar rectangular gradients were maintained for a duration of 2 ms and the gradient recovery delay was 200 ms. A maximum gradient strength of 0.535 T m−1 was used and the diffusion time was recorded between 0.5 s and 1.0 s. The obtained spectrum was analysed using Topspin 2.1.6 software (Bruker). The molar mass and polydispersity (Đ) were determined using a gel permeation chromatography (GPC) (a Viscotek gel permeation chromatograph equipped with a VE 1122 solvent delivery system, using narrow dispersed polystyrene as a standard) analysis at room temperature. Tetrahydrofuran (THF) was used as an eluent at a flow rate of 1 mL min−1 and the data were analysed using OmniSEC 4.2 software. Field emission scanning electron microscopy (ZEISS, FESEM), operated at an accelerating voltage of 5 kV, was used to analyse the surface morphology of the prepared samples. To analyse the BCP micelle, the dilute solution (1 mg mL−1) (DMF![[thin space (1/6-em)]](https://www.rsc.org/images/entities/char_2009.gif) :
:![[thin space (1/6-em)]](https://www.rsc.org/images/entities/char_2009.gif) water = 1
water = 1![[thin space (1/6-em)]](https://www.rsc.org/images/entities/char_2009.gif) :
:![[thin space (1/6-em)]](https://www.rsc.org/images/entities/char_2009.gif) 4 volume ratio) of BCPs was spin coated over a glass slide and allowed to dry at 40 °C inside a vacuum oven. To analyse the solid gel sample, the dried hydrogel was stuck over the tab using carbon adhesive tape. Before taking the images all the samples were gold coated. To examine the bulk morphology of the micelles, transmission electron microscopy (TEM) (JEOL, JEM-2000E7) was used. A dilute solution of micelles (1 mg mL−1) (DMF
4 volume ratio) of BCPs was spin coated over a glass slide and allowed to dry at 40 °C inside a vacuum oven. To analyse the solid gel sample, the dried hydrogel was stuck over the tab using carbon adhesive tape. Before taking the images all the samples were gold coated. To examine the bulk morphology of the micelles, transmission electron microscopy (TEM) (JEOL, JEM-2000E7) was used. A dilute solution of micelles (1 mg mL−1) (DMF![[thin space (1/6-em)]](https://www.rsc.org/images/entities/char_2009.gif) :
:![[thin space (1/6-em)]](https://www.rsc.org/images/entities/char_2009.gif) water = 1
water = 1![[thin space (1/6-em)]](https://www.rsc.org/images/entities/char_2009.gif) :
:![[thin space (1/6-em)]](https://www.rsc.org/images/entities/char_2009.gif) 4 volume ratio) was drop cast over a carbon coated TEM grid of 300 mesh size and dried at ambient temperature before imaging. Atomic force microscopy (AFM) (Agilent 5500, USA) was also used to analyse the surface morphology of the micelle. Samples were prepared using the same process as that used for FESEM analysis. Tapping mode was used during AFM analysis. X-ray diffraction analysis (XRD) was carried out (PANalytical, Netherlands) using a copper X-ray source (1.549 Å) with a standard angle of 0–80 degrees (2θ) and at a fixed scan rate of 1° per minute. A dynamic light scattering (DLS) instrument (Malvern Nano ZS) was used to analyse the particle size of the BCPs. A scattering angle of 90° and a He–Ne (4 mW, λ = 632.8 nm) laser was used for this experiment. Water contact angles (WCA) of the synthesized polymers were obtained at ambient temperature using a Rame-Hart 260 F4 standard goniometer. A drop of liquid was placed onto the surface of the polymer film and the contact angles were measured within 5–10 s. Fluorescence measurements were carried out on a Horiba Fluoromax-4 Luminescence Spectrometer with a xenon discharge lamp and Monk-Gillieson type monochromators. The monochromator has a wavelength accuracy of ±1.0 nm. Emission and excitation slit widths were maintained at 1 nm. The excitation scans were carried out by taking fixed excitation wavelengths of 365 nm and 475 nm for AMMA and FA tagged BCPs, respectively. For the FA labelled BCP, an emission wavelength of 480–800 nm and for the AMMA labelled BCP, an emission wavelength of 370–720 nm were fixed during the experiments. Tensile test analysis was carried out to confirm the self-healing ability of the hydrogel. Tensile testing was carried out in a Hounsfield H10KS tensile test machine by maintaining a crosshead speed of 10 mm min−1 and a load cell of 500 N at room temperature. During the tensile experiment the hydrogel samples were coated with silicon oil to prevent the elimination of entrapped water. The thermal properties of the block copolymer were analysed using differential scanning calorimetric analysis (DSC) (DSC 200 F3 instrument, Netzsch, Germany). The samples were heated from −100 °C to 200 °C under a nitrogen atmosphere at a heating rate of 20 °C min−1. The temperature against the heat flow was recorded.
4 volume ratio) was drop cast over a carbon coated TEM grid of 300 mesh size and dried at ambient temperature before imaging. Atomic force microscopy (AFM) (Agilent 5500, USA) was also used to analyse the surface morphology of the micelle. Samples were prepared using the same process as that used for FESEM analysis. Tapping mode was used during AFM analysis. X-ray diffraction analysis (XRD) was carried out (PANalytical, Netherlands) using a copper X-ray source (1.549 Å) with a standard angle of 0–80 degrees (2θ) and at a fixed scan rate of 1° per minute. A dynamic light scattering (DLS) instrument (Malvern Nano ZS) was used to analyse the particle size of the BCPs. A scattering angle of 90° and a He–Ne (4 mW, λ = 632.8 nm) laser was used for this experiment. Water contact angles (WCA) of the synthesized polymers were obtained at ambient temperature using a Rame-Hart 260 F4 standard goniometer. A drop of liquid was placed onto the surface of the polymer film and the contact angles were measured within 5–10 s. Fluorescence measurements were carried out on a Horiba Fluoromax-4 Luminescence Spectrometer with a xenon discharge lamp and Monk-Gillieson type monochromators. The monochromator has a wavelength accuracy of ±1.0 nm. Emission and excitation slit widths were maintained at 1 nm. The excitation scans were carried out by taking fixed excitation wavelengths of 365 nm and 475 nm for AMMA and FA tagged BCPs, respectively. For the FA labelled BCP, an emission wavelength of 480–800 nm and for the AMMA labelled BCP, an emission wavelength of 370–720 nm were fixed during the experiments. Tensile test analysis was carried out to confirm the self-healing ability of the hydrogel. Tensile testing was carried out in a Hounsfield H10KS tensile test machine by maintaining a crosshead speed of 10 mm min−1 and a load cell of 500 N at room temperature. During the tensile experiment the hydrogel samples were coated with silicon oil to prevent the elimination of entrapped water. The thermal properties of the block copolymer were analysed using differential scanning calorimetric analysis (DSC) (DSC 200 F3 instrument, Netzsch, Germany). The samples were heated from −100 °C to 200 °C under a nitrogen atmosphere at a heating rate of 20 °C min−1. The temperature against the heat flow was recorded.
Swelling study of the synthesized hydrogel
The swelling ratio of the prepared hydrogel was determined gravimetrically. To study the swelling behaviour of the individual hydrogels, a preweighed amount of cylindrical shaped hydrogel sample was dipped into the PBS buffer solution having a pH of 7.4. After a certain time interval the swollen hydrogel was taken out of the solution and the surface water was removed by gently pressing the hydrogel with tissue paper before being weighed. The swelling ratio was calculated using the following formula:where Wswell and Wdry are the swollen weight and dry weight of the hydrogel sample, respectively.
Dynamic mechanical analysis (DMA)
where σ0 and ε(t) are, respectively, the stress and strain on the samples.
where σt(t) and ε0 are, respectively, the stress and strain on the sample.
Results and discussion
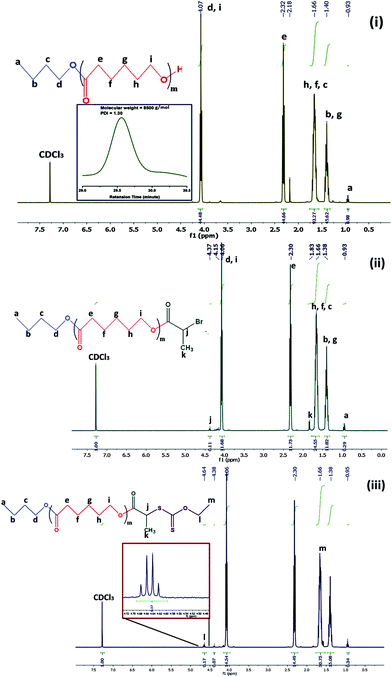
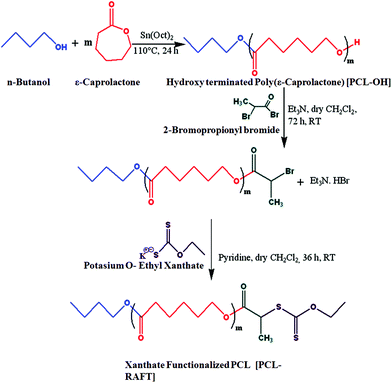
Cationic (PCL-b-PMTAC) and anionic (PCL-b-PSS) amphiphilic block copolymers (BCPs) with different block lengths of cationic and anionic segments were prepared using PCL-RAFT as a macro RAFT agent. The PCL based macro RAFT agent was synthesized via a successive ROP of ε-caprolactone (CL) and xanthation of the prepared PCL unit. ROP of ε-caprolactone was carried out using butanol as a ring opening initiator and stannous 2-ethylhexanoate [Sn(Oct)2] as a catalyst. The molecular weight of the PCL was determined from 1H NMR (Mn = 7800 g mol−1) and GPC analyses (Mn = 8500 g mol−1, Đ = 1.30). During the molecular weight calculations by 1H NMR, the characteristic peaks of PCL at δ = 0.98 ppm (a, –CH3 proton) and at δ = 2.4 ppm (e, –CO–CH2) were considered (Fig. 1(i)). The PCL was further utilized to prepare the macro-RAFT agent. To prepare the macro-RAFT agent, PCL was initially treated with BiBr and after that the obtained product was reacted with potassium O-ethyl xanthate. The successful bromination and xanthation of the PCL unit were verified by 1H NMR analysis. For the PCL-Br the characteristic peak appeared at δ = 1.9 ppm (k, –CH–CH3) and at δ = 4.4 ppm (j, –CO–CH) (Fig. 1(ii)). After xanthation a new resonance appeared at δ = 4.7 ppm (l, CS–O–CH2) (Fig. 1(iii)). Scheme 1 summarizes the preparation of PCL-OH, PCL-Br and PCL based macro-RAFT. For the xanthation reaction O-ethyl xanthate was prepared using a previous report and the purity of the sample was checked by determining the melting point of the light yellow coloured solid (m.p. = 210 °C), 1H NMR, 13C NMR and mass spectral analyses. 1H NMR (Fig. S1†) analysis of potassium O-ethyl xanthate provides characteristic peaks at δ = 1.27 ppm (–CH3) and at δ = 4.40 ppm (–CH2–). 13C NMR analysis of potassium O-ethyl xanthate provides characteristic peaks at δ = 13.65 ppm (–CH3), δ = 70.17 ppm (–CH2–) and δ = 207.17 ppm (C![[double bond, length as m-dash]](https://www.rsc.org/images/entities/char_e001.gif) S). The purity of the prepared xanthate was also checked with mass spectral analysis. The major peaks obtained are 95, 198.8, 258.8, 518.8 and 678.8. The peak at 198.8 corresponds to the combined weight of xanthate and potassium. Higher peaks might appear due to the presence of dimers etc.
S). The purity of the prepared xanthate was also checked with mass spectral analysis. The major peaks obtained are 95, 198.8, 258.8, 518.8 and 678.8. The peak at 198.8 corresponds to the combined weight of xanthate and potassium. Higher peaks might appear due to the presence of dimers etc.
The macro RAFT agent was utilized to prepare the ionic block copolymers via xanthate mediated RAFT polymerization. Both cationic and anionic block copolymers of different block lengths were prepared. The formed BCPs were analysed using 1H NMR analysis and differential scanning calorimetric (DSC) analysis. A summary of the BCP formation is presented in Table 2. The BCPs were prepared using DMF as a solvent and NMR was conducted using a mixture (1![[thin space (1/6-em)]](https://www.rsc.org/images/entities/char_2009.gif) :
:![[thin space (1/6-em)]](https://www.rsc.org/images/entities/char_2009.gif) 1 volume ratio) of D2O and d8-THF. A schematic representation of the preparation method of fluorescent tagged BCPs is summarized in Scheme 2. The molecular weight of the 2nd ionic block copolymers was determined by 1H NMR analysis. For PCL70-b-PMTAC48 (Fig. 2(i)) the molecular weight of the PMTAC unit was calculated by considering the characteristic peak of PMTAC at δ = 3.21 ppm (n, –R–N(CH3)3+) and the characteristic peak of PCL at δ = 2.4 ppm (e, –CO–CH2). Comparing the integral area of these two, the molecular weight of the ionic block was determined and it was 11
1 volume ratio) of D2O and d8-THF. A schematic representation of the preparation method of fluorescent tagged BCPs is summarized in Scheme 2. The molecular weight of the 2nd ionic block copolymers was determined by 1H NMR analysis. For PCL70-b-PMTAC48 (Fig. 2(i)) the molecular weight of the PMTAC unit was calculated by considering the characteristic peak of PMTAC at δ = 3.21 ppm (n, –R–N(CH3)3+) and the characteristic peak of PCL at δ = 2.4 ppm (e, –CO–CH2). Comparing the integral area of these two, the molecular weight of the ionic block was determined and it was 11![[thin space (1/6-em)]](https://www.rsc.org/images/entities/char_2009.gif) 270 g mol−1. The same method was applied for the anionic unit PCL70-b-PSS48 (Fig. 2(ii)). By comparing the integral area of the characteristic peak of the PSS unit (δ = 7.76 ppm (0, Ph–CH)) and the characteristic peak of PCL at δ = 2.4 ppm (e, –CO–CH2) the molecular weight of the PSS unit was 12
270 g mol−1. The same method was applied for the anionic unit PCL70-b-PSS48 (Fig. 2(ii)). By comparing the integral area of the characteristic peak of the PSS unit (δ = 7.76 ppm (0, Ph–CH)) and the characteristic peak of PCL at δ = 2.4 ppm (e, –CO–CH2) the molecular weight of the PSS unit was 12![[thin space (1/6-em)]](https://www.rsc.org/images/entities/char_2009.gif) 350 g mol−1. To confirm the BCP formation, we carried out a DOSY analysis, which gives the shift of protons in the polymer solution and can be used to obtain hydrodynamic radii of polymer systems.42 This technique was used to demonstrate efficient grafting and block copolymerization by producing a 2D correlation diagram of the chemical shifts on the horizontal axis and the diffusion coefficient on the vertical axis. From the DOSY analysis (Fig. 2(iii)a–c) it was observed that the distribution of diffusion coefficients of BCPs of PCL with the cationic segments (Fig. 2(iii)b) and anionic segments (Fig. 2(iii)c) was substantially different from that of pristine PCL (Fig. 2(iii)a). This indicates that both blocks are attached and diffuse as a single distribution of chains.
350 g mol−1. To confirm the BCP formation, we carried out a DOSY analysis, which gives the shift of protons in the polymer solution and can be used to obtain hydrodynamic radii of polymer systems.42 This technique was used to demonstrate efficient grafting and block copolymerization by producing a 2D correlation diagram of the chemical shifts on the horizontal axis and the diffusion coefficient on the vertical axis. From the DOSY analysis (Fig. 2(iii)a–c) it was observed that the distribution of diffusion coefficients of BCPs of PCL with the cationic segments (Fig. 2(iii)b) and anionic segments (Fig. 2(iii)c) was substantially different from that of pristine PCL (Fig. 2(iii)a). This indicates that both blocks are attached and diffuse as a single distribution of chains.
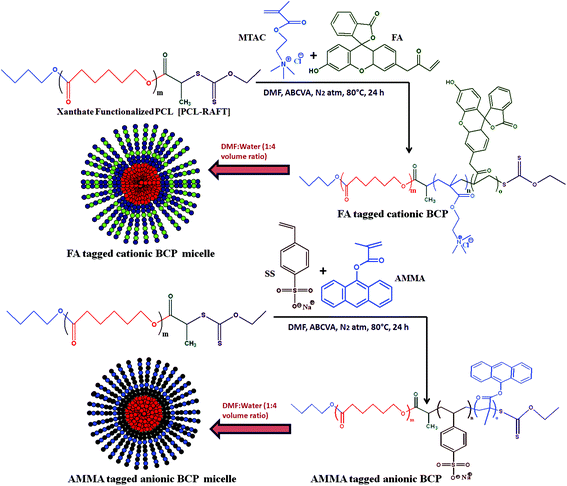 | ||
| Scheme 2 Synthesis of amphiphilic cationic (PCL-b-PMTAC) and anionic (PCL-b-PSS) diblock copolymers via ROP and xanthate mediated RAFT polymerization and their self-assembly in a DMF : water mixture. | ||
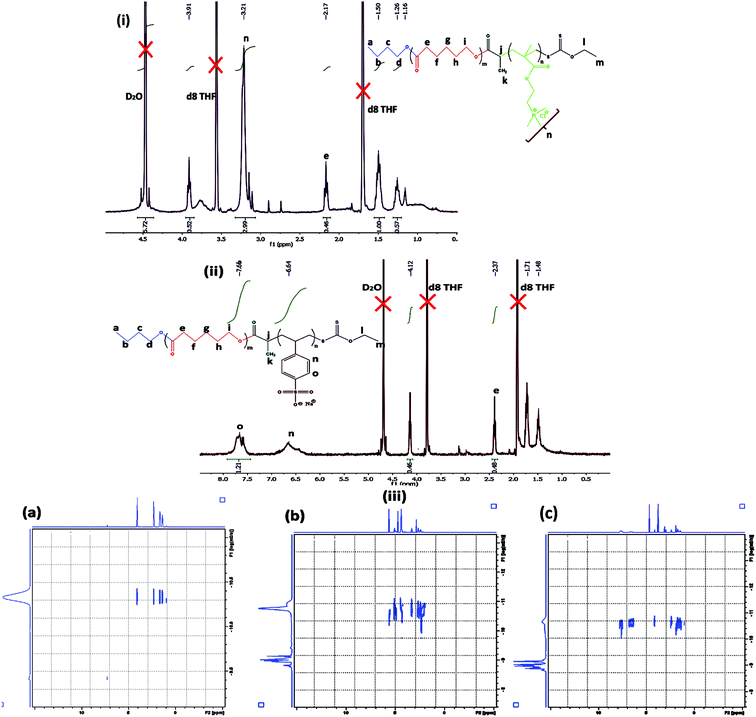 | ||
| Fig. 2 1H NMR analysis of (i) PCL70-b-PMTAC48 and (ii) PCL70-b-PSS48. (iii) DOSY analysis of (a) PCL70, (b) PCL70-b-PMTAC48 and (c) PCL70-b-PSS48. | ||
| Sample | Composition | [M]![[thin space (1/6-em)]](https://www.rsc.org/images/entities/char_2009.gif) : :![[thin space (1/6-em)]](https://www.rsc.org/images/entities/char_2009.gif) CTA-RAFT CTA-RAFT![[thin space (1/6-em)]](https://www.rsc.org/images/entities/char_2009.gif) : :![[thin space (1/6-em)]](https://www.rsc.org/images/entities/char_2009.gif) [I] [I] |
Conv. (%) | Target MW (g mol−1) |
M
n![[thin space (1/6-em)]](https://www.rsc.org/images/entities/char_2009.gif) a (g mol−1) a (g mol−1) |
PCL (mol %) |
|---|---|---|---|---|---|---|
| a Molecular weight was determined using 1H NMR. | ||||||
| PCL | PCL70 | — | 92 | 8000 | 7800 | 100 |
| PCLPM1 | PCL70-b-PMTAC48 | 50![[thin space (1/6-em)]](https://www.rsc.org/images/entities/char_2009.gif) : :![[thin space (1/6-em)]](https://www.rsc.org/images/entities/char_2009.gif) 1 1![[thin space (1/6-em)]](https://www.rsc.org/images/entities/char_2009.gif) : :![[thin space (1/6-em)]](https://www.rsc.org/images/entities/char_2009.gif) 0.25 0.25 |
97 | 17![[thin space (1/6-em)]](https://www.rsc.org/images/entities/char_2009.gif) 936 936 |
17![[thin space (1/6-em)]](https://www.rsc.org/images/entities/char_2009.gif) 559 559 |
59 |
| PCLPM2 | PCL70-b-PMTAC97 | 100![[thin space (1/6-em)]](https://www.rsc.org/images/entities/char_2009.gif) : :![[thin space (1/6-em)]](https://www.rsc.org/images/entities/char_2009.gif) 1 1![[thin space (1/6-em)]](https://www.rsc.org/images/entities/char_2009.gif) : :![[thin space (1/6-em)]](https://www.rsc.org/images/entities/char_2009.gif) 0.25 0.25 |
92 | 28![[thin space (1/6-em)]](https://www.rsc.org/images/entities/char_2009.gif) 079 079 |
27![[thin space (1/6-em)]](https://www.rsc.org/images/entities/char_2009.gif) 215 215 |
41 |
| PCLPM3 | PCL70-b-PMTAC194 | 200![[thin space (1/6-em)]](https://www.rsc.org/images/entities/char_2009.gif) : :![[thin space (1/6-em)]](https://www.rsc.org/images/entities/char_2009.gif) 1 1![[thin space (1/6-em)]](https://www.rsc.org/images/entities/char_2009.gif) : :![[thin space (1/6-em)]](https://www.rsc.org/images/entities/char_2009.gif) 0.25 0.25 |
90 | 48![[thin space (1/6-em)]](https://www.rsc.org/images/entities/char_2009.gif) 158 158 |
46![[thin space (1/6-em)]](https://www.rsc.org/images/entities/char_2009.gif) 839 839 |
26 |
| PCLPS1 | PCL70-b-PSS48 | 50![[thin space (1/6-em)]](https://www.rsc.org/images/entities/char_2009.gif) : :![[thin space (1/6-em)]](https://www.rsc.org/images/entities/char_2009.gif) 1 1![[thin space (1/6-em)]](https://www.rsc.org/images/entities/char_2009.gif) : :![[thin space (1/6-em)]](https://www.rsc.org/images/entities/char_2009.gif) 0.25 0.25 |
92 | 17![[thin space (1/6-em)]](https://www.rsc.org/images/entities/char_2009.gif) 888 888 |
17![[thin space (1/6-em)]](https://www.rsc.org/images/entities/char_2009.gif) 295 295 |
59 |
| PCLPS2 | PCL70-b-PSS97 | 100![[thin space (1/6-em)]](https://www.rsc.org/images/entities/char_2009.gif) : :![[thin space (1/6-em)]](https://www.rsc.org/images/entities/char_2009.gif) 1 1![[thin space (1/6-em)]](https://www.rsc.org/images/entities/char_2009.gif) : :![[thin space (1/6-em)]](https://www.rsc.org/images/entities/char_2009.gif) 0.25 0.25 |
88 | 27![[thin space (1/6-em)]](https://www.rsc.org/images/entities/char_2009.gif) 982 982 |
26![[thin space (1/6-em)]](https://www.rsc.org/images/entities/char_2009.gif) 327 327 |
42 |
| PCLPS3 | PCL70-b-PSS194 | 200![[thin space (1/6-em)]](https://www.rsc.org/images/entities/char_2009.gif) : :![[thin space (1/6-em)]](https://www.rsc.org/images/entities/char_2009.gif) 1 1![[thin space (1/6-em)]](https://www.rsc.org/images/entities/char_2009.gif) : :![[thin space (1/6-em)]](https://www.rsc.org/images/entities/char_2009.gif) 0.25 0.25 |
89 | 47![[thin space (1/6-em)]](https://www.rsc.org/images/entities/char_2009.gif) 964 964 |
44![[thin space (1/6-em)]](https://www.rsc.org/images/entities/char_2009.gif) 528 528 |
26 |
The amphiphilic BCP was further analysed by FTIR analysis. From Fig. S4(a)† it was observed that pristine PCL had characteristic absorption bands at 1722 cm−1 and 1180 cm−1 due to the presence of >C![[double bond, length as m-dash]](https://www.rsc.org/images/entities/char_e001.gif) O stretching and C–O–C stretching, respectively. In the case of cationic BCP, along with the vibrational peaks of PCL new peaks appeared at 1491 cm−1 and 942 cm−1 which were due to the presence of –CH3 bending vibration of [RN(CH3)3]+ and –CH3 stretching vibration of [RN(CH3)3]+, respectively.
O stretching and C–O–C stretching, respectively. In the case of cationic BCP, along with the vibrational peaks of PCL new peaks appeared at 1491 cm−1 and 942 cm−1 which were due to the presence of –CH3 bending vibration of [RN(CH3)3]+ and –CH3 stretching vibration of [RN(CH3)3]+, respectively.
The presence of the PSS unit in the BCP was confirmed by observing the presence of vibrational peaks at 1186 cm−1 and 1042 cm−1, which are due to anti-symmetric and symmetric vibrational peaks of the SO3− group.
The change in crystallinity of the PCL unit after the formation of the cationic and anionic BCPs was monitored through XRD analysis. The PCL homopolymer shows sharp crystalline peaks at 21° and 24°, which are due to scattering from the [110] and [200] crystallographic planes. Fig. S4(b)† shows that upon the formation of BCPs the crystalline component of the PCL was reduced and the peak becomes broader, indicating the introduction of amorphous characteristics in the BCP.43
Self-assembly of the ionic amphiphilic BCPs in a water![[thin space (1/6-em)]](https://www.rsc.org/images/entities/h3_char_2009.gif) :
:![[thin space (1/6-em)]](https://www.rsc.org/images/entities/h3_char_2009.gif) DMF mixture
DMF mixture
It is widely reported that BCPs with chemically distinct and immiscible segments combine to form immiscible self-assembled structures when they are dissolved in a solvent with different solubility for different blocks. The morphology of self-assembly depends on a number of factors.44 When the soluble block has dominancy over the insoluble block it forms a spherical core shell type of structure. In our case the PCL based amphiphilic ionic BCPs form a spherical morphology in a DMF![[thin space (1/6-em)]](https://www.rsc.org/images/entities/char_2009.gif) :
:![[thin space (1/6-em)]](https://www.rsc.org/images/entities/char_2009.gif) water mixture (1
water mixture (1![[thin space (1/6-em)]](https://www.rsc.org/images/entities/char_2009.gif) :
:![[thin space (1/6-em)]](https://www.rsc.org/images/entities/char_2009.gif) 4 volume ratio). To prepare a core–shell type morphology, initially the cationic and anionic BCPs were dissolved separately in DMF, which is a thermodynamically favourable solvent for both of the segments. After homogenization, the mentioned amount of water was added dropwise to the solution with continuous stirring; it was observed that in both cases the opaque BCP dispersion turned relatively transparent, indicating the formation of stable micelles. The formation of stable micellar structures depends on two factors: (i) the formation of stable aggregates by the insoluble part of the BCP and (ii) the repulsive and attractive forces present between the nearby polymer segments and between the polymer–solvent, respectively.45 The morphology of the formed “core–shell” BCPs was observed using different microscopic techniques like FESEM, HRTEM and AFM analyses and also by a DLS study. Light scattering analysis (Fig. S5(a)†) was utilized to monitor the hydrodynamic radius provided by different BCPs having different block lengths of cationic and anionic segments. It was observed that with an increase in the block length of the cationic segment from PCL70-b-PMTAC48 to PCL70-b-PMTAC97 to PCL70-b-PMTAC194, the hydrodynamic radius also increased gradually from 370 ± 5 nm (poly dispersity index (PDI) = 0.247) to 440 ± 5 nm (PDI = 0.348). The same phenomenon was also observed in the case of the anionic segment; when the anionic block length was varied from PCL70-b-PSS48 to PCL70-b-PSS97 to PCL70-b-PSS194, the hydrodynamic radius gradually increased from 325 ± 4 nm (PDI = 0.174) to 348 ± 5 nm (PDI = 0.298). This might be due to the greater solvation of the hydrophilic segments. Interestingly, it was observed that very high block lengths of cationic and anionic segments hinder the formation of micellar structures and no particle diameter was found. During the dynamic light scattering measurement a solution concentration of 1 mg mL−1 was maintained. From the water contact angle (WCA) analysis (Fig. S5(b)†), it was observed that the formation of the BCP results in a decrease in the WCA. For pristine PCL, the WCA value was 72° whereas the cationic and anionic BCPs showed a WCA value of 32° and 36°, respectively. The formation of ionic BCP aggregates further reduced the WCA value and it was 20°, which indicates hydrophilicity of the assembled complex.
4 volume ratio). To prepare a core–shell type morphology, initially the cationic and anionic BCPs were dissolved separately in DMF, which is a thermodynamically favourable solvent for both of the segments. After homogenization, the mentioned amount of water was added dropwise to the solution with continuous stirring; it was observed that in both cases the opaque BCP dispersion turned relatively transparent, indicating the formation of stable micelles. The formation of stable micellar structures depends on two factors: (i) the formation of stable aggregates by the insoluble part of the BCP and (ii) the repulsive and attractive forces present between the nearby polymer segments and between the polymer–solvent, respectively.45 The morphology of the formed “core–shell” BCPs was observed using different microscopic techniques like FESEM, HRTEM and AFM analyses and also by a DLS study. Light scattering analysis (Fig. S5(a)†) was utilized to monitor the hydrodynamic radius provided by different BCPs having different block lengths of cationic and anionic segments. It was observed that with an increase in the block length of the cationic segment from PCL70-b-PMTAC48 to PCL70-b-PMTAC97 to PCL70-b-PMTAC194, the hydrodynamic radius also increased gradually from 370 ± 5 nm (poly dispersity index (PDI) = 0.247) to 440 ± 5 nm (PDI = 0.348). The same phenomenon was also observed in the case of the anionic segment; when the anionic block length was varied from PCL70-b-PSS48 to PCL70-b-PSS97 to PCL70-b-PSS194, the hydrodynamic radius gradually increased from 325 ± 4 nm (PDI = 0.174) to 348 ± 5 nm (PDI = 0.298). This might be due to the greater solvation of the hydrophilic segments. Interestingly, it was observed that very high block lengths of cationic and anionic segments hinder the formation of micellar structures and no particle diameter was found. During the dynamic light scattering measurement a solution concentration of 1 mg mL−1 was maintained. From the water contact angle (WCA) analysis (Fig. S5(b)†), it was observed that the formation of the BCP results in a decrease in the WCA. For pristine PCL, the WCA value was 72° whereas the cationic and anionic BCPs showed a WCA value of 32° and 36°, respectively. The formation of ionic BCP aggregates further reduced the WCA value and it was 20°, which indicates hydrophilicity of the assembled complex.
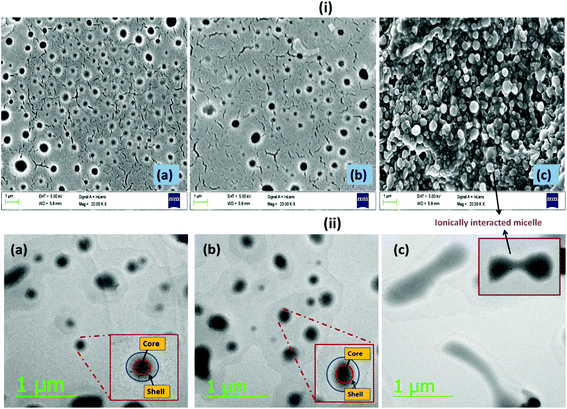
For all microscopic analyses, BCPs with poly(ionic) segments of Mn = 10 kg mol−1 were considered as they have a lower micellar size. Fig. 3(i) summarizes the microscopic images obtained in FESEM analysis. From the figure it was observed that both the cationic (Fig. 3(i)a) and the anionic BCPs (Fig. 3(i)b) formed spherical micelles. When both the BCPs were mixed together they formed an aggregate, as observed in the FESEM image (Fig. 3(i)c). A similar observation was also obtained in HRTEM analysis. From the HRTEM study it was observed that the PCL based BCPs formed a spherical “core–shell” morphology, whereas the PCL segment formed the dark core part and the lighter dark corona was formed by the PMTAC (Fig. 3(ii)a) and PSS (Fig. 3(ii)b) units in the cationic and anionic BCPs, respectively. The size obtained from the HRTEM analysis for both of the BCPs is in the range of 200 ± 10 nm. It was observed that when both of the oppositely charged BCPs were mixed at a lower concentration the obtained HRTEM image showed similarity to a worm like morphology. This might be due to the formation of a continuous structure by the ionic interaction between the cationic and the anionic BCPs.
The obtained AFM (Fig. 4) images also corroborate the results obtained from FESEM and HRTEM analyses. From the AFM image it was observed that both the cationic (Fig. 4a) and anionic (Fig. 4b) segments exhibit a spherical morphology having a “core–shell” structure. The average size obtained for both of the BCPs was in the range of 180 ± 10 nm. A mixture of the two polyelectrolyte BCPs results in aggregated structures (Fig. 4c) as obtained in FESEM and HRTEM.
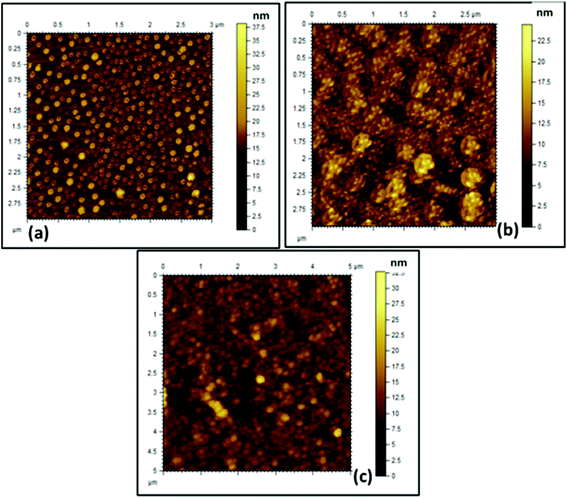 | ||
| Fig. 4 AFM images of the formed (a) PCL70-b-PMTAC48 micelle, (b) PCL70-b-PSS48 micelle, and (c) ionically interacted BCP micelle in aqueous solution (picture taken after drying the solvent). | ||
The interaction between the oppositely charged BCPs was further confirmed through additional fluorescence spectroscopy and zeta potential analyses.
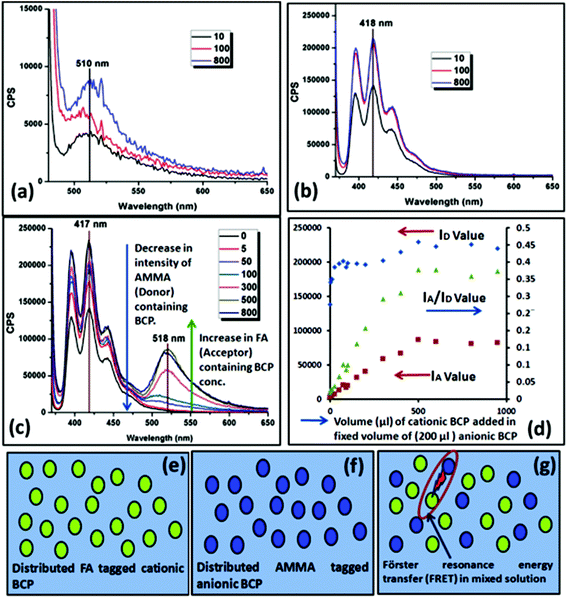
To measure the fluorescence activity of the positively and negatively charged BCPs, during the block copolymerization of cationic and anionic segments with the PCL unit a small amount (0.5% of the monomer) of fluorescein O-acrylate (FA) (acceptor) and 9-anthryl methylmethacrylate (AMMA) (donor) was copolymerized with PMTAC and PSS units, respectively. Fluorescence excitation scans were carried out by sample excitation at 365 nm and 475 nm for AMMA and FA tagged BCPs, respectively, in a dilute solution. Fig. 5a and b show the fluorescence emission graph of FA labelled PCL70-b-PMTAC48 and AMMA tagged PCL70-b-PSS48, respectively. Additional measurements were carried out and energy transfer between the two chromophores via a FRET mechanism was observed when the cationic and anionic polymers were mixed. In this study, 200 μL of an AMMA tagged PCL70-b-PSS48 solution (DMF![[thin space (1/6-em)]](https://www.rsc.org/images/entities/char_2009.gif) :
:![[thin space (1/6-em)]](https://www.rsc.org/images/entities/char_2009.gif) water = 1
water = 1![[thin space (1/6-em)]](https://www.rsc.org/images/entities/char_2009.gif) :
:![[thin space (1/6-em)]](https://www.rsc.org/images/entities/char_2009.gif) 4 volume ratio) (conc. = 10 mg mL−1) was mixed with different volumes of FA tagged PCL70-b-PMTAC48 solution and the total volume of the solution was maintained at 1 mL. As a result of the increasing concentration of FA (acceptor), the intensity of the AMMA (donor) decreased as shown in Fig. 5c. This demonstrates the increasing interaction between cationic and anionic segments bringing the two labels together. However, after a certain amount of acceptor containing cationic polymer, equilibrium was achieved and the IA/ID value stabilized, indicating a FRET neutralization point (300 μL of cationic BCP added to 200 μL of anionic BCP). After this value no additional FRET occurred with increasing cationic polymer addition. Fig. 5g presents a schematic of the FRET between cationic and anionic BCP. As FRET will only occur over a limited spatial distance this measurement indicates the critical ratio of anionic and cationic polymers required to achieve full complexation between the two polymers, and further increases in concentration do not lead to further supramolecular assembly.
4 volume ratio) (conc. = 10 mg mL−1) was mixed with different volumes of FA tagged PCL70-b-PMTAC48 solution and the total volume of the solution was maintained at 1 mL. As a result of the increasing concentration of FA (acceptor), the intensity of the AMMA (donor) decreased as shown in Fig. 5c. This demonstrates the increasing interaction between cationic and anionic segments bringing the two labels together. However, after a certain amount of acceptor containing cationic polymer, equilibrium was achieved and the IA/ID value stabilized, indicating a FRET neutralization point (300 μL of cationic BCP added to 200 μL of anionic BCP). After this value no additional FRET occurred with increasing cationic polymer addition. Fig. 5g presents a schematic of the FRET between cationic and anionic BCP. As FRET will only occur over a limited spatial distance this measurement indicates the critical ratio of anionic and cationic polymers required to achieve full complexation between the two polymers, and further increases in concentration do not lead to further supramolecular assembly.
The interaction of the oppositely charged micelles was also monitored by studying the variation of the zeta potential value upon the addition of one component (FA tagged PCL70-b-PMTAC48 solution, positively charged) into another (AMMA tagged PCL70-b-PSS48 solution, negatively charged). The obtained result is summarized in Table 3. As observed from the result a gradual increase in the zeta potential occurs upon addition of the positively charged micellar solution into the negatively charged micellar solution.
Amount of water![[thin space (1/6-em)]](https://www.rsc.org/images/entities/char_2009.gif) : :![[thin space (1/6-em)]](https://www.rsc.org/images/entities/char_2009.gif) DMF mixture (4 DMF mixture (4![[thin space (1/6-em)]](https://www.rsc.org/images/entities/char_2009.gif) : :![[thin space (1/6-em)]](https://www.rsc.org/images/entities/char_2009.gif) 1 volume ratio) (μl) 1 volume ratio) (μl) |
Amount of AMMA tagged PCL70-b-PMTAC48 solutiona,b (μL) | Zeta potential (mV) | I A/ID value acquired from FRET analysis |
|---|---|---|---|
a Amount of AMMA tagged PCL70-b-PSS48 solution = 200 μl.
b Base solvent was prepared by mixing water and DMF in 4![[thin space (1/6-em)]](https://www.rsc.org/images/entities/char_2009.gif) : :![[thin space (1/6-em)]](https://www.rsc.org/images/entities/char_2009.gif) 1 volume ratio. 1 volume ratio.
|
|||
| 798 | 2 | −44.3 ± 2.0 | 0.0283 |
| 795 | 5 | −39.1 ± 2.0 | 0.0246 |
| 790 | 10 | −37.2 ± 1.0 | 0.0293 |
| 775 | 25 | −34.5 ± 2.0 | 0.0382 |
| 750 | 50 | −31.9 ± 2.0 | 0.0666 |
| 720 | 75 | −31.5 ± 1.0 | 0.1012 |
| 710 | 90 | −30.8 ± 1.2 | 0.0865 |
| 700 | 100 | −30.1 ± 1.0 | 0.1006 |
| 650 | 150 | −28.7 ± 2.0 | 0.1617 |
| 600 | 200 | +1.56 ± 2.0 | 0.2076 |
| 500 | 300 | +17.2 ± 1.0 | 0.2926 |
| 400 | 400 | +19.2 ± 1.0 | 0.3104 |
| 300 | 500 | +22.5 ± 2.0 | 0.3781 |
| 200 | 600 | +27.4 ± 2.0 | 0.3782 |
| 0 | 800 | +32.5 ± 3.0 | 0.3597 |
| 0 | 950 | +41.2 ± 3.0 | 0.3736 |
The concentration of the prepared FAPCL70-b-PMTAC48 and AMMA PCL70-b-PSS48 was 10 mg mL−1. Interestingly, it was observed that a transition point appeared during the zeta potential titration when the system suddenly showed a high positively charge value from a high negatively charge value. The mid-point of these two transitions designates the charge neutrality point. The conditions under which charge neutrality is achieved are highlighted in Table 3.
Thermal analysis
Thermal analyses of the PCL homopolymer and the PCL based ionic block copolymers were carried out to determine the change in thermal behaviour of the PCL upon block copolymerization and also to determine the Tg of the segments. It is well known that PCL is a crystalline polymer, so a strong melting point peak appeared at 60 °C as shown in Fig. 6a. After copolymerization it was observed that the peak intensity was drastically reduced due to the disruption of the crystalline nature of the PCL unit (Fig. 6b).46 The Tg of the cationic and the anionic segment were determined using the DSC thermogram. Fig. 6c and d show that the Tg of the PMTAC and the PSS units are 35 °C and 92 °C, respectively.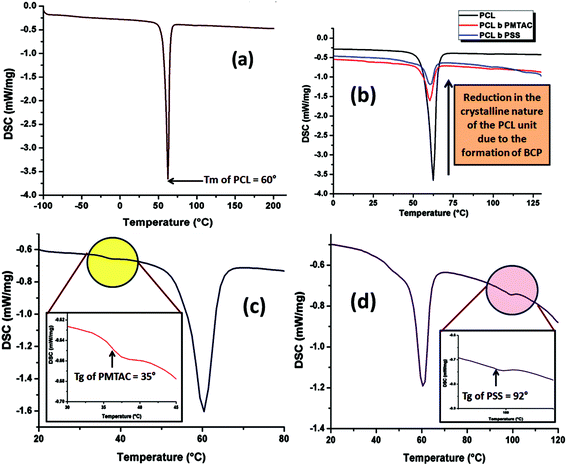 | ||
| Fig. 6 DSC analysis of (a) PCL-OH, (b) reduction in intensity of the endotherm of PCL upon block copolymer formation, (c) PCL70-b-PMTAC48 and (d) PCL70-b-PSS48. | ||
Preparation of a fluorescence active hydrogel and its swelling properties
As discussed in the Experimental section, both the BCP micelles (cationic and anionic) prepared in a 1![[thin space (1/6-em)]](https://www.rsc.org/images/entities/char_2009.gif) :
:![[thin space (1/6-em)]](https://www.rsc.org/images/entities/char_2009.gif) 4 volume ratio of a DMF
4 volume ratio of a DMF![[thin space (1/6-em)]](https://www.rsc.org/images/entities/char_2009.gif) :
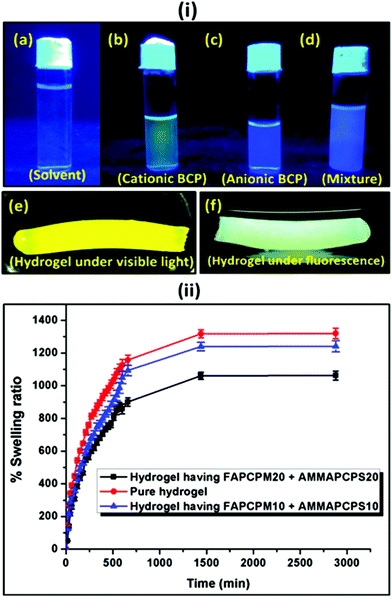
:![[thin space (1/6-em)]](https://www.rsc.org/images/entities/char_2009.gif) water mixture were incorporated into the poly(acrylamide) based hydrogel. The hydrogel was prepared using acrylamide as a monomer, MBA as a crosslinker and APS as a thermal initiator. TEMED was used as a room temperature gelator. As shown in Fig. 7(i), the cationic (Fig. 7(i)b) and the anionic (Fig. 7(i)c) BCPs were fluorescent and they provided a yellow and a blue colour emission under fluorescent light, respectively. A mixture of DMF
water mixture were incorporated into the poly(acrylamide) based hydrogel. The hydrogel was prepared using acrylamide as a monomer, MBA as a crosslinker and APS as a thermal initiator. TEMED was used as a room temperature gelator. As shown in Fig. 7(i), the cationic (Fig. 7(i)b) and the anionic (Fig. 7(i)c) BCPs were fluorescent and they provided a yellow and a blue colour emission under fluorescent light, respectively. A mixture of DMF![[thin space (1/6-em)]](https://www.rsc.org/images/entities/char_2009.gif) :
:![[thin space (1/6-em)]](https://www.rsc.org/images/entities/char_2009.gif) water (1
water (1![[thin space (1/6-em)]](https://www.rsc.org/images/entities/char_2009.gif) :
:![[thin space (1/6-em)]](https://www.rsc.org/images/entities/char_2009.gif) 4 volume ratio) was used as a control sample under fluorescence (Fig. 7(i)a). When both the micelles were mixed at an almost equal charge ratio, it resulted in a mixed colour where the intensity of the yellow and the blue colours was quenched to some extent. This mixture was further used to prepare the fluorescence active hydrogel. Fig. 7(i)e and f provide the images of the fluorescent hydrogel under visible and fluorescent light. To measure the extent of swelling of the synthesized hydrogel at pH = 7.4 buffer solution, each of the hydrogels was immersed in the buffer solution separately and after a predetermined time interval the swelling ratio was measured gravimetrically. It was observed that with an increase in the block length of the incorporated BCP the extent of swelling was reduced. As observed in Fig. 7(ii), the non-modified hydrogel (no BCP incorporation) showed (1300 ± 26)% swelling whereas the hydrogel with FAPCL70-b-PMTAC48 + AMMAPCL70-b-PSS48 showed (1200 ± 30)% swelling compared to the FAPCL70-b-PMTAC97 + AMMAPCL70-b-PSS97 incorporated hydrogel ((1000 ± 22)% swelling). The deviation in swelling can be explained by considering the ionic interlocking of the BCPs inside the hydrogel. The non-modified hydrogel has no such ionic interaction in the bulk so the free volume is comparatively higher compared to the ionic BCP incorporated hydrogel, which results in a higher degree of swelling. In the case of the FAPCL70-b-PMTAC48 + AMMAPCL70-b-PSS48 containing hydrogel the ionic block length is comparatively low compared to FAPCL70-b-PMTAC97 + AMMAPCL70-b-PSS97. It provides a higher degree of swelling as the extent of physical crosslinking (ionic interaction between two oppositely charged BCPs) is less. As a result, the inter-crosslinking volume is high, which results in a higher extent of swelling.
4 volume ratio) was used as a control sample under fluorescence (Fig. 7(i)a). When both the micelles were mixed at an almost equal charge ratio, it resulted in a mixed colour where the intensity of the yellow and the blue colours was quenched to some extent. This mixture was further used to prepare the fluorescence active hydrogel. Fig. 7(i)e and f provide the images of the fluorescent hydrogel under visible and fluorescent light. To measure the extent of swelling of the synthesized hydrogel at pH = 7.4 buffer solution, each of the hydrogels was immersed in the buffer solution separately and after a predetermined time interval the swelling ratio was measured gravimetrically. It was observed that with an increase in the block length of the incorporated BCP the extent of swelling was reduced. As observed in Fig. 7(ii), the non-modified hydrogel (no BCP incorporation) showed (1300 ± 26)% swelling whereas the hydrogel with FAPCL70-b-PMTAC48 + AMMAPCL70-b-PSS48 showed (1200 ± 30)% swelling compared to the FAPCL70-b-PMTAC97 + AMMAPCL70-b-PSS97 incorporated hydrogel ((1000 ± 22)% swelling). The deviation in swelling can be explained by considering the ionic interlocking of the BCPs inside the hydrogel. The non-modified hydrogel has no such ionic interaction in the bulk so the free volume is comparatively higher compared to the ionic BCP incorporated hydrogel, which results in a higher degree of swelling. In the case of the FAPCL70-b-PMTAC48 + AMMAPCL70-b-PSS48 containing hydrogel the ionic block length is comparatively low compared to FAPCL70-b-PMTAC97 + AMMAPCL70-b-PSS97. It provides a higher degree of swelling as the extent of physical crosslinking (ionic interaction between two oppositely charged BCPs) is less. As a result, the inter-crosslinking volume is high, which results in a higher extent of swelling.
Mechanical analysis of the hydrogel
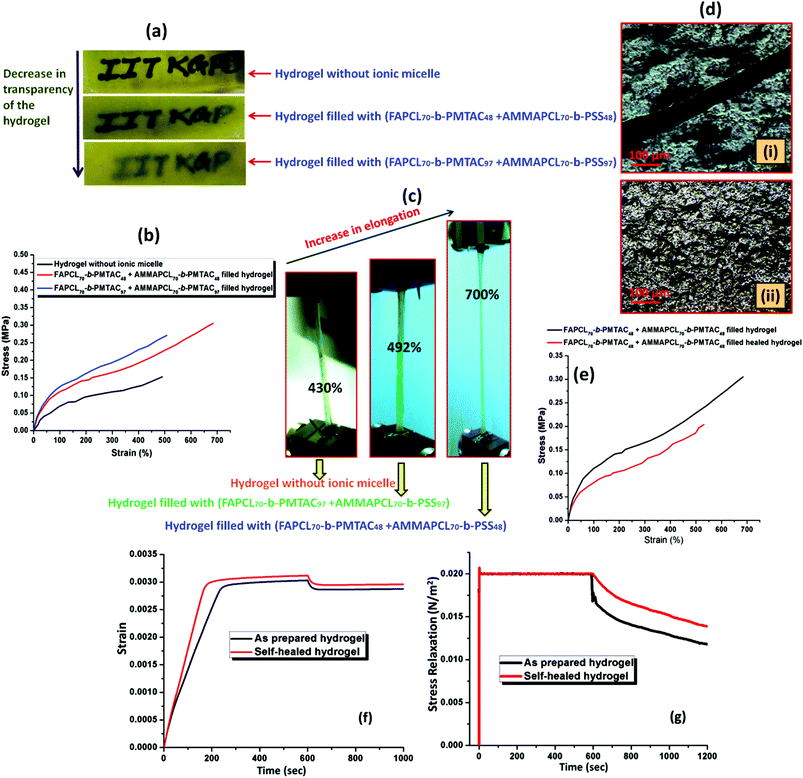
As mentioned in the swelling experiment the incorporation of the ionic BCP generates ionic crosslinking inside the hydrogel, which results in a lower degree of swelling compared to the non-modified hydrogel sample. The formation of ionic crosslinking also has an effect on the transparency of the hydrogel. As shown in Fig. 8a the incorporation of BCPs reduces the transparency of the hydrogel, which provides support to the idea that the formation of ionic crosslinking inside the hydrogel affects transparency. The results obtained from the tensile study are summarized in Fig. 8b.The data showed that the incorporation of BCPs of a specific block length can provide a higher extent of elongation and modulus compared to the non-modified hydrogel sample. Incorporation of FAPCL70-b-PMTAC48 + AMMA PCL70-b-PSS48 into the hydrogel provides (700 ± 10)% (p < 0.05) elongation before breaking as compared to the non-modified hydrogel ((430 ± 10)% elongation before breaking). This might be due to the presence of elastic ionic interactions between the oppositely charged BCPs.47 Interestingly, it was observed that the hydrogel with FAPCL70-b-PMTAC97 + AMMA PCL70-b-PSS97 showed a comparatively lower level of elongation (492 ± 10) % (p > 0.05) before breaking, but showed a higher modulus. This result can be explained by considering the transparency result. From the image it is clearly observed that the presence of FAPCL70-b-PMTAC97 + AMMA PCL70-b-PSS97 provides poor transparency, which means generation of higher ionic interaction between the BCPs, which leads to large ionic cluster formation. This provides greater stiffness to the FAPCL70-b-PMTAC97 + AMMA PCL70-b-PSS97 hydrogel, as compared to the FAPCL70-b-PMTAC48 + AMMA PCL70-b-PSS48 filled hydrogel. The tensile images of the sample are mentioned in Fig. 8c, which clearly makes sense about the extent of elongation of the prepared hydrogels.
Study of the self-healing property of the hydrogel
In our study we observed the self-healing ability of the BCP (FAPCL70-b-PMTAC48 + AMMA PCL70-b-PSS48) incorporated hydrogel at pH = 7.4 (physiological pH) by adopting the “scratch and heal” method. For this, we made a notch over the hydrogel surface having a depth of approximately 0.5 mm using a sharp knife. The image of the notched hydrogel sample is presented in Fig. 8d(i). After that a PBS buffer solution of pH = 7.4 was sprayed over it and kept for 30 minutes in that condition. After that, the image of the healed hydrogel sample was again obtained from an optical microscope and the image is presented in Fig. 8d(ii). Tensile testing of the healed hydrogel was performed to examine the retention of the mechanical properties of the hydrogel after healing. From the tensile testing results (Fig. 8e) it was observed that after being healed, the mechanical properties of the hydrogel were almost similar to those of the uncut hydrogel sample. The healed hydrogel showed (550 ± 10)% elongation (tensile strength = 0.19 ± 0.01 MPa), whereas the uncut hydrogel showed (700 ± 10)% elongation before breaking (0.32 ± 0.01 MPa). The probable reason for the self-healing can be explained by considering the ionic interaction phenomenon. In this case the presence of the oppositely charged BCPs played a role in the self-healing process. When the buffer solution of pH = 7.4 was sprayed over the cut, the polymeric segments became swollen, resulting in close contact of the cationic (containing –N(CH3)3+) and the anionic (containing –SO3−) BCPs. Due to the formation of the elastic ionic interaction between the two segments of the hydrogel, after the cut, the hydrogel surface became healed.where J(t) and J0 are the creep compliance after time t and instant compliance, respectively. J0 and τi are constant. From Fig. 8f, it was observed that compared to the as prepared hydrogel, the self-healed hydrogel responded faster to the applied stress. From the obtained result it can be said that due to the consecutive cut and healing process, an obvious loss of covalent bond (crosslinking by MBA) occurred in case of the self-healed hydrogel. As a result, a large amount of primary creep or transient creep was observed in the case of the self-healed hydrogel as compared to the as prepared hydrogel. It was observed that the rate of achieving the secondary creep or “steady-state-creep” was higher in the case of the self-healed gel as compared to the as prepared hydrogel. The data thus indicate that the only factor that resists the applied stress was the ionic interaction which acted between the ionic BCP micelles inside the hydrogel. This indeed supports the concept of ionic interactions as the main driver of self-healing.49 In contrast, in the as prepared hydrogel, due to the presence of both covalent bonds and ionic interactions, resistance against the applied stress was high. As a result, achievement of the secondary creep stage was delayed. Although both hydrogels showed a comparable creep compliance value (Fig. S6†), it was observed that both hydrogels had not experienced any tertiary stage creep in the presence of 0.1 MPa stress for a time period of 1200 s. An immediate drop in strain was observed after the withdrawal of the stress. As a result, a gradual recovery of the residual strain was witnessed. The extent of the immediate drop in strain was slightly increased in the case of the as prepared hydrogel compared to the self-healed hydrogel and this difference was ascribed to the synergistic contribution of both the covalent crosslinks and ionic crosslinks towards the elasticity.
where E(t) is the relaxation modulus at time (t) and Ei and τi are constants. SAs observed in the creep experiment from the stress relaxation curve (stress–time curve) showed that the response of the as prepared hydrogel was rapid compared to the self-healed hydrogel (relaxation of stress) after removal of the applied strain. This again proves the higher elasticity of the as prepared hydrogel due to the combined effect of covalent crosslinks and ionic interactions.50 In contrast, in the case of self-healed gel the relaxation only occurred due to the presence of ionic interaction, which also supports the concept of ionic interaction based healing.
Conclusions
PCL based fluorescently labelled cationic (FA tagged) and anionic (AMMA tagged) block copolymers were successfully prepared using consecutive ROP of ε-caprolactone and xanthate mediated RAFT polymerization. The BCPs are able to form micelles in a 1![[thin space (1/6-em)]](https://www.rsc.org/images/entities/char_2009.gif) :
:![[thin space (1/6-em)]](https://www.rsc.org/images/entities/char_2009.gif) 4 (volume ratio) DMF
4 (volume ratio) DMF![[thin space (1/6-em)]](https://www.rsc.org/images/entities/char_2009.gif) :
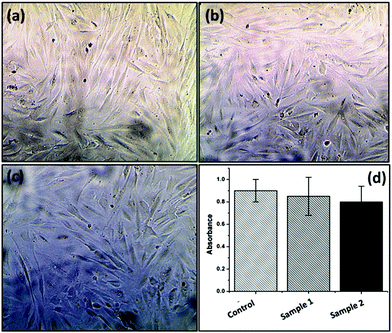
:![[thin space (1/6-em)]](https://www.rsc.org/images/entities/char_2009.gif) water mixture with core shell morphologies. The formed morphology was evaluated by using FESEM, HRTEM and AFM analyses. The size distribution and hydrodynamic diameter of the formed micelle were determined using DLS analysis. Water contact angle analysis also supports the formation of BCPs by showing a reduced water contact angle value as compared to PCL. After that, the oppositely charged BCPs were incorporated into a poly(acrylamide) based hydrogel. Importantly, this material showed fluorescence emission under visible light and fluorescent light. Along with the fluorescence phenomenon the modified hydrogel was able to self-heal at pH = 7.4. MTT assay experiment revealed that the synthesized fluorescence active hydrogels are non-toxic in nature. This type of fluorescence active self-healable, mechanically strong and non-toxic hydrogel may be a potentially smart material in the field of tissue engineering and sensing applications in the near future.
water mixture with core shell morphologies. The formed morphology was evaluated by using FESEM, HRTEM and AFM analyses. The size distribution and hydrodynamic diameter of the formed micelle were determined using DLS analysis. Water contact angle analysis also supports the formation of BCPs by showing a reduced water contact angle value as compared to PCL. After that, the oppositely charged BCPs were incorporated into a poly(acrylamide) based hydrogel. Importantly, this material showed fluorescence emission under visible light and fluorescent light. Along with the fluorescence phenomenon the modified hydrogel was able to self-heal at pH = 7.4. MTT assay experiment revealed that the synthesized fluorescence active hydrogels are non-toxic in nature. This type of fluorescence active self-healable, mechanically strong and non-toxic hydrogel may be a potentially smart material in the field of tissue engineering and sensing applications in the near future.
Conflicts of interest
There are no conflicts to declare.Acknowledgements
Funding for Mr Sovan Lal Banerjee's fellowship was kindly provided by the IIT Kharagpur. MRC (MR/N501888/2) for funding to allow Banerjee to visit and research at University of Bradford and for providing post-doctoral fellowship for Hoskins.Notes and references
- O. Wichterle and D. Lim, Hydrophilic Gels for Biological Use, Nature, 1960, 185(4706), 117–118 CrossRef
.
- K. Y. Lee and D. J. Mooney, Hydrogels for Tissue Engineering, Chem. Rev., 2001, 101(7), 1869–1880 CrossRef CAS PubMed
.
- H. Dai, Q. Chen, H. Qin, Y. Guan, D. Shen, Y. Hua, Y. Tang and J. Xu, A Temperature-Responsive Copolymer Hydrogel in Controlled Drug Delivery, Macromolecules, 2006, 39(19), 6584–6589 CrossRef CAS
.
- Y. Luo and M. S. Shoichet, A Photolabile Hydrogel for Guided Three-Dimensional Cell Growth and Migration, Nat. Mater., 2004, 3(4), 249 CrossRef CAS PubMed
.
- A. Hasan, A. Paul, N. E. Vrana, X. Zhao, A. Memic, Y.-S. Hwang, M. R. Dokmeci and A. Khademhosseini, Microfluidic Techniques for Development of 3D Vascularized Tissue, Biomaterials, 2014, 35(26), 7308–7325 CrossRef CAS PubMed
.
- S. J. Song, J. Choi, Y. D. Park, J. J. Lee, S. Y. Hong and K. Sun, A Three-Dimensional Bioprinting System for Use With a Hydrogel-Based Biomaterial and Printing Parameter Characterization, Artif. Organs, 2010, 34(11), 1044–1048 CrossRef PubMed
.
- A. S. Hoffman, Hydrogels for biomedical applications, Adv. Drug Delivery Rev., 2012, 64, 18–23 CrossRef
.
- X. Zhang, C. L. Pint, M. H. Lee, B. E. Schubert, A. Jamshidi, K. Takei, H. Ko, A. Gillies, R. Bardhan and J. J. Urban, Optically-and thermally-responsive Programmable Materials based on Carbon Nanotube-hydrogel Polymer Composites, Nano Lett., 2011, 11(8), 3239–3244 CrossRef CAS PubMed
.
- Y. J. Heo, H. Shibata, T. Okitsu, T. Kawanishi and S. Takeuchi, Long-term in vivo Glucose Monitoring using Fluorescent Hydrogel Fibers, Proc. Natl. Acad. Sci. U. S. A., 2011, 108(33), 13399–13403 CrossRef CAS PubMed
.
- J. T. Suri, D. B. Cordes, F. E. Cappuccio, R. A. Wessling and B. Singaram, Continuous glucose sensing with a fluorescent thin-film hydrogel, Angew. Chem., Int. Ed., 2003, 42(47), 5857–5859 CrossRef CAS PubMed
.
- Y. Gong, M. Gao, D. Wang and H. Möhwald, Incorporating Fluorescent CdTe Nanocrystals into a Hydrogel via Hydrogen Bonding: Toward Fluorescent Microspheres with Temperature-responsive Properties, Chem. Mater., 2005, 17(10), 2648–2653 CrossRef CAS
.
- B. HyeanáKim, An insulin-sensing sugar-based fluorescent hydrogel, Chem. Commun., 2006,(17), 1842–1844 Search PubMed
.
- N. Artzi, N. Oliva, C. Puron, S. Shitreet, S. Artzi, A. Bon Ramos, A. Groothuis, G. Sahagian and E. R. Edelman, In Vivo and in Vitro Tracking of Erosion in Biodegradable materials Using non-invasive Fluorescence Imaging, Nat. Mater., 2011, 10(9), 704 CrossRef CAS PubMed
.
- W. Wang, J. Liu, C. Li, J. Zhang, J. Liu, A. Dong and D. Kong, Real-time and Non-invasive Fluorescence Tracking of In Vivo Degradation of the Thermosensitive PEGlyated Polyester Hydrogel, J. Mater. Chem. B, 2014, 2(26), 4185–4192 RSC
.
- Y. Dong, G. Jin, C. Ji, R. He, M. Lin, X. Zhao, A. Li, T. J. Lu and F. Xu, Non-invasive tracking of Hydrogel Degradation Using Upconversion Nanoparticles, Acta Biomater., 2017, 55, 410–419 CrossRef CAS PubMed
.
- T. V. Shkand, M. O. Chizh, I. V. Sleta, B. P. Sandomirsky, A. L. Tatarets and L. D. Patsenker, Assessment of Alginate Hydrogel Degradation in Biological Tissue Using Viscosity-sensitive Fluorescent Dyes, Methods Appl. Fluoresc., 2016, 4(4), 044002 CrossRef PubMed
.
- X. Ma, X. Sun, D. Hargrove, J. Chen, D. Song, Q. Dong, X. Lu, T.-H. Fan, Y. Fu and Y. Lei, A Biocompatible and Biodegradable Protein Hydrogel with Green and Red Autofluorescence: preparation, Characterization and In vivo Biodegradation Tracking and Modeling, Sci. Rep., 2016, 6 Search PubMed
.
- T. Mako and M. Levine, Synthesis of a Fluorescent Conjugated Polymer in the Undergraduate Organic Teaching Laboratory, J. Chem. Educ., 2013, 90(10), 1376–1379 CrossRef CAS
.
- A. S. Ribeiro and R. J. Mortimer, Conjugated Conducting Polymers with Electrochromic and Fluorescent Properties. In Electrochemistry, 2015, pp. 21–49.
- O. G. Tovmachenko, C. Graf, D. J. van den Heuvel, A. van Blaaderen and H. C. Gerritsen, Fluorescence Enhancement by Metal-core/silica-shell Nanoparticles, Adv. Mater., 2006, 18(1), 91–95 CrossRef CAS
.
- J. Liu and R. H. Hurt, Ion Release Kinetics and Particle Persistence in Aqueous Nano-silver Colloids, Environ. Sci. Technol., 2010, 44(6), 2169–2175 CrossRef CAS PubMed
.
- X. Zhang, S. Wang, L. Xu, L. Feng, Y. Ji, L. Tao and Y. Wei, Biocompatible polydopamine fluorescent organic nanoparticles: facile preparation and cell imaging, Nanoscale, 2012, 4(18), 5581–5584 RSC
.
- A. H. Loo, Z. Sofer, D. Bouša, P. Ulbrich, A. Bonanni and M. Pumera, Carboxylic Carbon Quantum Dots as a Fluorescent Sensing Platform for DNA Detection, ACS Appl. Mater. Interfaces, 2016, 8(3), 1951–1957 CAS
.
- D. Chowdhury, N. Gogoi and G. Majumdar, Fluorescent carbon dots obtained from chitosan gel, RSC Adv., 2012, 2(32), 12156–12159 RSC
.
- A. Cayuela, M. L. Soriano, S. R. Kennedy, J. Steed and M. Valcárcel, Fluorescent Carbon Quantum Dot Hydrogels for Direct Determination of Silver Ions, Talanta, 2016, 151, 100–105 CrossRef CAS PubMed
.
- A. A. Neyfakh, Use of Fluorescent Dyes as Molecular Probes for the Study of Multidrug Resistance, Exp. Cell Res., 1988, 174(1), 168–176 CrossRef CAS PubMed
.
- X. Zhang, K. Wang, M. Liu, X. Zhang, L. Tao, Y. Chen and Y. Wei, Polymeric AIE-based nanoprobes for biomedical applications: recent advances and perspectives, Nanoscale, 2015, 7(27), 11486–11508 RSC
.
- T. Swift, L. Swanson, M. Geoghegan and S. Rimmer, The pH-responsive Behaviour of Poly(acrylic acid) in Aqueous Solution is Dependent on Molar Mass, Soft Matter, 2016, 12(9), 2542–2549 RSC
.
- L. Ruiz-Pérez, A. Pryke, M. Sommer, G. Battaglia, I. Soutar, L. Swanson and M. Geoghegan, Conformation of Poly(methacrylic acid) Chains in Dilute Aqueous Solution, Macromolecules, 2008, 41(6), 2203–2211 CrossRef
.
- T. Swift, L. Swanson and S. Rimmer, Poly(acrylic acid) Interpolymer Complexation: use of a Fluorescence Time Resolved Anisotropy as a Poly(acrylamide) Probe, RSC Adv., 2014, 4(101), 57991–57995 RSC
.
- J. J. Heyward and K. P. Ghiggino, Fluorescence Polarization study of the poly(acrylic acid)/poly(ethylene oxide) Interpolymer Complex in Aqueous Solution, Macromolecules, 1989, 22(3), 1159–1165 CrossRef CAS
.
- T. Swift, J. Lapworth, K. Swindells, L. Swanson and S. Rimmer, pH Responsive Highly Branched poly(N-isopropylacrylamide) with Trihistidine or Acid Chain Ends, RSC Adv., 2016, 6(75), 71345–71350 RSC
.
- T. Swift, N. Paul, L. Swanson, M. Katsikogianni and S. Rimmer, Förster Resonance Energy Transfer Across Interpolymer Complexes of Poly(acrylic acid) and Poly(acrylamide), Polymer, 2017, 123, 10–20 CrossRef CAS
.
- S. L. Banerjee, M. Khamrai, P. Kundu and N. K. Singha, Synthesis of a Self-healable and pH Responsive Hydrogel Based on an Ionic Polymer/clay Nanocomposite, RSC Adv., 2016, 6(85), 81654–81665 RSC
.
- D. Habault, H. Zhang and Y. Zhao, Light-triggered Self-healing and Shape-memory Polymers, Chem. Soc. Rev., 2013, 42(17), 7244–7256 RSC
.
- Y.-L. Liu and T.-W. Chuo, Self-healing polymers based on thermally reversible Diels–Alder chemistry, Polym. Chem., 2013, 4(7), 2194–2205 RSC
.
- H. Gao, N. Wang, X. Hu, W. Nan, Y. Han and W. Liu, Double Hydrogen-Bonding pH-Sensitive Hydrogels Retaining High-Strengths Over a Wide pH Range, Macromol. Rapid Commun., 2013, 34(1), 63–68 CrossRef CAS PubMed
.
- C. Li and G. Shi, Functional gels based on chemically modified graphenes, Adv. Mater., 2014, 26(24), 3992–4012 CrossRef CAS PubMed
.
- J. A. Foster, R. M. Parker, A. M. Belenguer, N. Kishi, S. Sutton, C. Abell and J. R. Nitschke, Differentially addressable cavities within metal–organic cage-cross-linked polymeric hydrogels, J. Am. Chem. Soc., 2015, 137(30), 9722–9729 CrossRef CAS PubMed
.
- S. W. Kuo, C. F. Huang, C. H. Lu, H. M. Lin, K. U. Jeong and F. C. Chang, Syntheses and Specific Interactions of Poly (ε-caprolactone)-block-poly (vinyl phenol) Copolymers Obtained via a Combination of Ring-Opening and Atom-Transfer Radical Polymerizations, Macromol. Chem. Phys., 2006, 207(21) CrossRef CAS
.
- V. K. Patel, A. K. Mishra, N. K. Vishwakarma, C. S. Biswas and B. Ray, (S)-2-(Ethyl propionate)-(O-ethyl xanthate) and (S)-2-(Ethyl isobutyrate)-(O-ethyl xanthate)-mediated RAFT polymerization of N-vinylpyrrolidone, Polym. Bull., 2010, 65(2), 97–110 CrossRef CAS
.
- T. Swift, R. Hoskins, R. Telford, R. Plenderleith, D. Pownall and S. Rimmer, Analysis Using Size Exclusion Chromatography of poly(N-isopropyl acrylamide) using Methanol as an Eluent, J. Chromatogr., A, 2017, 1508, 15–23 CrossRef PubMed
.
- K. K. Gupta, A. Kundan, P. K. Mishra, P. Srivastava, S. Mohanty, N. K. Singh, A. Mishra and P. Maiti, Polycaprolactone composites with TiO 2 for potential nanobiomaterials: tunable properties using different phases, Phys. Chem. Chem. Phys., 2012, 14(37), 12844–12853 RSC
.
- S. C. Owen, D. P. Chan and M. S. Shoichet, Polymeric Micelle Stability, Nano Today, 2012, 7(1), 53–65 CrossRef CAS
.
- G. Riess, Micellization of Block Copolymers, Prog. Polym. Sci., 2003, 28(7), 1107–1170 CrossRef CAS
.
- S. Zhai, Y. Ma, Y. Chen, D. Li, J. Cao, Y. Liu, M. Cai, X. Xie, Y. Chen and X. Luo, Synthesis of an Amphiphilic Block Copolymer Containing Zwitterionic Sulfobetaine as a Novel pH-sensitive Drug Carrier, Polym. Chem., 2014, 5(4), 1285–1297 RSC
.
- T. L. Sun, T. Kurokawa, S. Kuroda, A. B. Ihsan, T. Akasaki, K. Sato, M. A. Haque, T. Nakajima and J. P. Gong, Physical hydrogels Composed of Polyampholytes Demonstrate High Toughness and Viscoelasticity, Nat. Mater., 2013, 12(10), 932–937 CrossRef CAS PubMed
.
-
M. T. Shaw and W. J. MacKnight, Introduction to Polymer Viscoelasticity, John Wiley & Sons, Inc., Hoboken, New Jersey, 3rd edn, 2005, ch. 2, p. 51 Search PubMed
.
- S. N. Karobi, T. L. Sun, T. Kurokawa, F. Luo, T. Nakajima, T. Nonoyama and J. P. Gong, Creep Behavior and Delayed Fracture of Tough Polyampholyte Hydrogels by Tensile Test, Macromolecules, 2016, 49(15), 5630–5636 CrossRef CAS
.
- X. Zhao, N. Huebsch, D. J. Mooney and Z. Suo, Stress-relaxation behavior in gels with ionic and covalent crosslinks, J. Appl. Phys., 2010, 107(6), 063509 CrossRef PubMed
.
- S. Yuan, G. Xiong, X. Wang, S. Zhang and C. Choong, Surface modification of polycaprolactone substrates using collagen-conjugated poly (methacrylic acid) brushes for the regulation of cell proliferation and endothelialisation, J. Mater. Chem., 2012, 22(26), 13039–13049 RSC
.
Footnote |
| † Electronic supplementary information (ESI) available: Characterization data (NMR, FTIR, Mass Spec, DLS) for compounds. See DOI: 10.1039/c7py01883e |
| This journal is © The Royal Society of Chemistry 2018 |


