Synthesis of a sequence-controlled in-chain alkynyl/tertiary amino dual-functionalized terpolymer via living anionic polymerization†
Lincan
Yang
,
Hongwei
Ma
 *,
Li
Han
,
Xinyu
Hao
,
Pibo
Liu
,
Heyu
Shen
and
Yang
Li
*
State Key Laboratory of Fine Chemicals, Liaoning Key Laboratory of Polymer Science and Engineering, Department of Polymer Science and Engineering, School of Chemical Engineering, Dalian University of Technology, Dalian 116024, China. E-mail: mahw@dlut.edu.cn; liyang@dlut.edu.cn
First published on 29th November 2017
Abstract
The alkynyl-functionalized 1,1-diphenylethylene (DPE) derivative DPE-yne was incorporated into a polymer chain through living anionic polymerization (LAP). An unanticipated coupling reaction occurred and could be restrained by extra feeding of DPE derivatives. Investigating the mechanism of the side coupling indicated that excess P-SLi coupled with the DPE-yne units in the chain when the feed of DPE-yne was insufficient. Although the use of excess DPE-yne can effectively restrain the side coupling during the copolymerization, these conditions afford only an alternating polymer sequence. For the diversity of sequence structure and multi-functionalization, another DPE derivative, DPE-NMe2, was introduced into the polymerization, and the use of an appropriate amount of DPE-NMe2 effectively inhibited the side coupling. Additionally, two functional groups (alkynes and amines) can be incorporated into polymer chains, and their sequence distribution was investigated. The in situ1H NMR method was applied to monitor the chain propagation during the terpolymerization in real time. The in situ1H NMR results showed that the entire sequence is a gradient structure with compositional drift from a predominant St-(DPE-yne) fraction initially to a St-(DPE-NMe2) fraction finally, and the sequence between them is a gradual transition fraction. Consistent with the special sequence distribution in the polymer chain, the terpolymerization kinetic was investigated, and the apparent kinetic constants for each monomer were obtained. The corresponding reactivity ratios (rSt) were also calculated. The rSt-Dyne and rSt-Dnme were simulated as 0.08 and 5.8 during the terpolymerization, respectively. The terpolymerization investigated here not only inhibited the side coupling reaction but also allowed the introduction of a third functional monomer; moreover, its sequence structure shows potentially novel and intriguing properties that could further the applications of functionalized polymers.
Introduction
Recently, the ability to control the sequence structures of synthetic polymers has become a significant and attractive focus in polymer chemistry.1,2 Based on the specific roles that biopolymers (DNA, RNA and proteins) play in nature, synthetic polymers with a controlled sequence structure are expected to exhibit remarkable properties.3–11 The monomer sequence structure has been shown to substantially influence polymer behavior in both bulk and solution. For instance, in an investigation of the hydrolysis rate of poly(lactic-co-glycolic acid) derivatives with different structures, the alternating sequence showed dramatically different hydrolysis behaviors compared with its random analogues.8 Most interestingly, sequence-encoded polymers have been recently synthesized and applied to information storage because of their massive capacity for data storage and facile sequence analysis through tandem mass spectrometry.11To effectively control a monomer sequence during polymerization, polymer chemists have developed a wide range of synthetic methods.2,12–19 Among these methods, the chain propagation method definitely plays an irreplaceable role in achieving well-defined molecular weights, topological structures, etc. Controlled radical polymerization (CRP) methods have also been utilized to synthesize sequence-controlled polymers. Specifically, Lutz13 and Sawamoto20et al. have used CRP methods to establish an extensively applicable strategy and to prepare diverse sequence-controlled polymers. Because of its special characteristics regarding the construction of well-defined polymeric architectures, living anionic polymerization (LAP) was also used to synthesize sequence-controlled polymers from 1,1-diphenylethylene (DPE) derivatives. Based on the distinctive chemical characteristics of DPE units in copolymerization,21 copolymers with alternating and gradient sequence structures have been obtained and subsequently combined using coupling reactions.22–25
Furthermore, the successful introduction of functional groups into polymer chains has been verified as an effective strategy for improving polymer performance and applications. The chain-end- or in-chain-functionalized polymers endowed with unique characteristics by incorporating certain functional groups have been widely utilized for catalyst loading,26,27 controlled release,28,29 stimuli-responsive materials,30,31etc. Additionally, because of multiple functionalization, distributing more than one type of functional group in a polymer chain becomes very attractive. Among the functionalization strategies, the introduction of “clickable” units (such as alkynyl,32–35 vinyl,36,37 or azido groups34,38) is very significant because these moieties can be efficiently converted into other functionalized groups to avoid the synthesis or application of complicated and costly monomers. Thus, how to control the exquisite sequence of multifunctional units along a polymer chain has become an exciting subject for polymer chemists. We firmly believe that advancements in this field will be a powerful driving force toward both improving the synthetic methodology for sequence-controlled polymers and broadening the applications of functional materials. One of the multitudinous attempts toward the synthesis of sequence-defined multifunctional polymers was the preliminary investigation by Hutchings and coworkers39 of the anionic copolymerization of DPE and its derivatives with styrene (St). The authors anticipated that the controlled simultaneous polymerization of three or more monomers can provide a greater degree of monomer sequence control in functionalized polymers. We also investigated the sequence distribution of DPE derivatives along copolymer chains based on the LAP method and made some important progress.22–25
In this paper, we synthesize a dual-functionalized (alkyne and tertiary amino) sequence-defined terpolymer via the living anionic terpolymerization of St and the “clickable” DPE derivatives trimethyl((4-(1-phenylvinyl)phenyl)ethynyl)silane (DPE-yne) and 1-(4-dimethylaminophenyl)-1-phenylethylene (DPE-NMe2). Different substituent groups have been confirmed to be able to affect the copolymerization reactivity of DPE derivatives and thus result in variations in the sequence structure. Here, we intensely investigated the unique kinetic characteristics of the terpolymerization. Additionally, the sequence structure of the terpolymer was determined by the in situ1H NMR method and sequence-controlled in-chain alkynyl/tertiary amino dual-functionalized terpolymers were successfully synthesized.
Experimental
Materials
Tetrahydrofuran (THF) was dried by refluxing over a Na-benzophenone complex, and triethylamine (TEA) was dried by refluxing over CaH2, and both of them were under an argon atmosphere and then distilled. 4-Bromobenzophenone (Energy Chemical, 98.0%), methyltriphenylphosphonium bromide (Energy Chemical, 98.0%), potassium tert-butoxide (Energy Chemical, 98.0%), trimethylsilylacetylene (Energy Chemical, 98.0%), and n-butyllithium (n-BuLi, J&K Chemical, 2.5 M solution in hexanes) were used as purchased. Benzene (Certified ACS, EM Science), benzene-d6 (Aladdin, 99.5%) and styrene (Aldrich, 99%) were purified as previously described.34sec-Butyllithium (sec-BuLi) was prepared using 2-chlorobutane and lithium metal in benzene under high vacuum conditions and the concentration was double-titrated and determined to be 0.275 mol L−1. sec-BuLi dissolved in benzene-d6 was prepared in benzene-d6 and the concentration was determined to be 0.360 mol L−1. Trimethyl((4-(1-phenylvinyl)-phenyl)ethynyl)silane (DPE-yne) was prepared as described in the ESI.† 1-(4-Dimethylaminophenyl)-1-phenylethylene (DPE-NMe2) was prepared as described in the literature.24Measurements
Size exclusion chromatography (SEC) analyses of the copolymers were performed on a Viscotek TDA 305 equipped with tetra detectors [refractive index, viscosity, ultraviolet and two-angle laser light scattering (7° and 90°, laser wavelength, λ = 670 nm)] at a flow rate of 1.0 mL min−1 in THF at 35 °C. 1H NMR (5 wt%, CDCl3) spectra were recorded on a Bruker Avance II 400 M NMR spectrometer at ambient temperature using CDCl3 (tetramethylsilane, TMS) as the solvent. MALDI-ToF MS analysis was carried out on a Waters MALDI micro MX mass spectrometer. 2-[(2E)-3-(4-tert-Butylphenyl)-2-methylprop-2-enylidene]malononitrile (DCTB) and sodium trifluoro-acetate were used as dopants and details of the sample preparation are provided in a previous study.23Timing-sample during the copolymerization of St and DPE-yne and terpolymerization of St, DPE-yne and DPE-NMe2
All the polymerization processes were performed in a glovebox. For the copolymerization of St and DPE-yne, DPE-yne (1.73 g, 6.27 mmol) and dry benzene (10 w/v%) were added into a 100 mL flask. Then, the initiator sec-BuLi (3.26 mL, 0.9 mmol) was injected. After 20 min, St (2.80 g, 26.9 mmol) was also added to the flask. The solution was then distributed into thirteen 20 mL sealed vials using a glass syringe. At certain time points during the 72 h reaction, one sample was removed, terminated with an appropriate isopropanol and purified using the procedure described in the above section. For the terpolymerization, the 4![[thin space (1/6-em)]](https://www.rsc.org/images/entities/char_2009.gif) :
:![[thin space (1/6-em)]](https://www.rsc.org/images/entities/char_2009.gif) 1
1![[thin space (1/6-em)]](https://www.rsc.org/images/entities/char_2009.gif) :
:![[thin space (1/6-em)]](https://www.rsc.org/images/entities/char_2009.gif) 4 molar feed ratio of St, DPE-yne and DPE-NMe2 is provided here as a demonstration: DPE-yne (1.73 g, 6.27 mmol) and dry benzene (10 w/v%) were placed into a 250 mL flask. Then, sec-BuLi (3.26 mL, 0.9 mmol) was injected. After 20 min, DPE-NMe2 (6.00 g, 26.9 mmol) and St (2.80 g, 26.9 mmol) were added to the flask sequentially. In addition, the subsequent procedures, including aliquoting, termination and purification, were the same as the timing-sample of copolymerization.
4 molar feed ratio of St, DPE-yne and DPE-NMe2 is provided here as a demonstration: DPE-yne (1.73 g, 6.27 mmol) and dry benzene (10 w/v%) were placed into a 250 mL flask. Then, sec-BuLi (3.26 mL, 0.9 mmol) was injected. After 20 min, DPE-NMe2 (6.00 g, 26.9 mmol) and St (2.80 g, 26.9 mmol) were added to the flask sequentially. In addition, the subsequent procedures, including aliquoting, termination and purification, were the same as the timing-sample of copolymerization.
In situ 1H NMR kinetics studies of the St/DPE-yne copolymerization and St/DPE-yne/DPE-NMe2 terpolymerization
All preparatory work before carrying out the in situ1H NMR study was performed inside the glovebox. For the 1H NMR kinetics study of the St/DPE-yne copolymerization, benzene-d6 and DPE-yne (0.133 g, 0.48 mmol) were added to a 20 mL sealed vial, and then sec-BuLi dissolved in benzene-d6 (0.194 mL, 0.07 mmol) was injected. After 20 min, St (0.22 g, 2.11 mmol) was added to the vial. Then, 2 mL of the dark red solution was rapidly transferred to a sealed NMR tube using a glass syringe. To monitor the reaction by in situ1H NMR, all spectra were recorded at 400 MHz with 4 scans and a time interval of 1 min between each measurement. The total test time was approximately 9 h. For the 1H NMR kinetics study of the St/DPE-yne/DPE-NMe2 terpolymerization, DPE-NMe2 (0.47 g, 2.11 mmol) was added to the vial before St in the preparatory stage, and the time interval between each measurement was 5 min, and the total test time was approximately 1200 min. The other procedures were the same as those mentioned above.Results and discussion
Mechanism and control of the side coupling reaction in the copolymerization of St and DPE-yne
The specific reactivity of alkyne functional groups, which can be used in highly efficient “click” reactions with silanes,40,41 thiols42–44 and azides,45,46 enables the preparation of a range of functional polymers and might provide us with a series of new polymer materials. Alkyne-terminated polymers have been synthesized using LAP, and post-polymerization modifications have been accomplished via alkyne–azide cycloadditions. Müller and co-workers33 synthesized alkyne mid-functionalized diblock copolymers using a DPE derivative—“click DPE”—which featured a protected alkyne group, and then prepared ABC miktoarm star terpolymers using the azide–alkyne Huisgen cycloaddition. Hadjichristidis et al.35 developed a metal-free strategy for the synthesis of well-defined polypeptides bearing pendant alkyne groups using the hydrogen-bonding catalytic ring opening polymerization of alkyne-functionalized N-carboxy anhydrites of α-amino acids. Frey and co-workers32 also synthesized in-chain multi-alkyne-functionalized polyethylene glycol (PEG) derivatives via the direct copolymerization of ethylene oxide (EO) and glycidyl propargyl ether and then decorated these copolymers with multiple mannosyl units to generate PEG-based glycopolymers. Thus, the introduction of the multiple alkynes into polymer chains and the resulting sequence structures have become significant.Herein, as shown in Scheme 1, a series of P[St-co-(DPE-yne)]s with different feed ratios of [St]0/[DPE-yne]0 = 1![[thin space (1/6-em)]](https://www.rsc.org/images/entities/char_2009.gif) :
:![[thin space (1/6-em)]](https://www.rsc.org/images/entities/char_2009.gif) 1, 2
1, 2![[thin space (1/6-em)]](https://www.rsc.org/images/entities/char_2009.gif) :
:![[thin space (1/6-em)]](https://www.rsc.org/images/entities/char_2009.gif) 1 and 4
1 and 4![[thin space (1/6-em)]](https://www.rsc.org/images/entities/char_2009.gif) :
:![[thin space (1/6-em)]](https://www.rsc.org/images/entities/char_2009.gif) 1, as shown in C1, C2 and C3 in Table 1, were prepared through LAP initiated by sec-BuLi at room temperature in benzene for 3 days. The polymerization results are shown in Table 1, and the SEC curves and 1H NMR spectra of the copolymers are shown in Fig. 1a and 2a, respectively. The SEC curves show distinct double peaks (black) for the 4
1, as shown in C1, C2 and C3 in Table 1, were prepared through LAP initiated by sec-BuLi at room temperature in benzene for 3 days. The polymerization results are shown in Table 1, and the SEC curves and 1H NMR spectra of the copolymers are shown in Fig. 1a and 2a, respectively. The SEC curves show distinct double peaks (black) for the 4![[thin space (1/6-em)]](https://www.rsc.org/images/entities/char_2009.gif) :
:![[thin space (1/6-em)]](https://www.rsc.org/images/entities/char_2009.gif) 1 copolymer, a shoulder peak (red) in the high molecular weight region for the 2
1 copolymer, a shoulder peak (red) in the high molecular weight region for the 2![[thin space (1/6-em)]](https://www.rsc.org/images/entities/char_2009.gif) :
:![[thin space (1/6-em)]](https://www.rsc.org/images/entities/char_2009.gif) 1 copolymer, and a symmetric single peak (blue) for the 1
1 copolymer, and a symmetric single peak (blue) for the 1![[thin space (1/6-em)]](https://www.rsc.org/images/entities/char_2009.gif) :
:![[thin space (1/6-em)]](https://www.rsc.org/images/entities/char_2009.gif) 1 copolymer. The phenomena could indicate that an unanticipated coupling reaction between the copolymers occurs under high St ratio (4
1 copolymer. The phenomena could indicate that an unanticipated coupling reaction between the copolymers occurs under high St ratio (4![[thin space (1/6-em)]](https://www.rsc.org/images/entities/char_2009.gif) :
:![[thin space (1/6-em)]](https://www.rsc.org/images/entities/char_2009.gif) 1) conditions; however, the degree of coupling was considerably reduced by increasing the amount of DPE-yne (2
1) conditions; however, the degree of coupling was considerably reduced by increasing the amount of DPE-yne (2![[thin space (1/6-em)]](https://www.rsc.org/images/entities/char_2009.gif) :
:![[thin space (1/6-em)]](https://www.rsc.org/images/entities/char_2009.gif) 1) and was eliminated under equal feed (1
1) and was eliminated under equal feed (1![[thin space (1/6-em)]](https://www.rsc.org/images/entities/char_2009.gif) :
:![[thin space (1/6-em)]](https://www.rsc.org/images/entities/char_2009.gif) 1) conditions. This result further illustrates that the undesirable coupling could be regulated by feeding of DPE derivatives.
1) conditions. This result further illustrates that the undesirable coupling could be regulated by feeding of DPE derivatives.
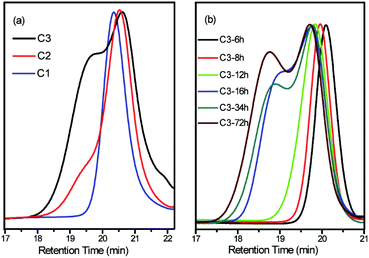 | ||
Fig. 1 SEC curves of the copolymers: (a) P[St-co-(DPE-yne)] at different feed ratios; (b) timing-samples of [St]0/[DPE-yne]0 = 4![[thin space (1/6-em)]](https://www.rsc.org/images/entities/char_2009.gif) : :![[thin space (1/6-em)]](https://www.rsc.org/images/entities/char_2009.gif) 1. 1. | ||
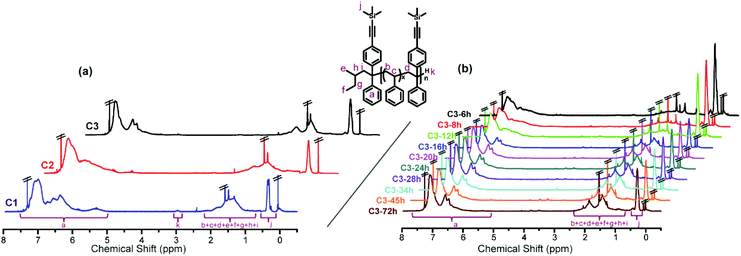 | ||
Fig. 2
1H NMR spectra (in CDCl3) of the copolymers: (a) P[St-co-(DPE-yne)] at different feed ratios; (b) timing-samples of [St]0/[DPE-yne]0 = 4![[thin space (1/6-em)]](https://www.rsc.org/images/entities/char_2009.gif) : :![[thin space (1/6-em)]](https://www.rsc.org/images/entities/char_2009.gif) 1. 1. | ||
| No.a | [St]0/[D]0![[thin space (1/6-em)]](https://www.rsc.org/images/entities/char_2009.gif) b b |
M
n![[thin space (1/6-em)]](https://www.rsc.org/images/entities/char_2009.gif) c [kg mol−1] c [kg mol−1] |
PDIc |
N
St/NDPE-yne![[thin space (1/6-em)]](https://www.rsc.org/images/entities/char_2009.gif) d d |
||
|---|---|---|---|---|---|---|
| M n | M n,coupling | PDI | PDIcoupling | |||
a C1–C3: different feed-ratios P[St-co-(DPE-yne)] were synthesized at r.t. for 72 h; C3-6h–C3-72h: the timing-sample of [St]0/[DPE-yne]0 = 4![[thin space (1/6-em)]](https://www.rsc.org/images/entities/char_2009.gif) : :![[thin space (1/6-em)]](https://www.rsc.org/images/entities/char_2009.gif) 1 copolymerization.
b The molar feed ratios of St over DPE-yne.
c Determined by SEC with tetra detectors.
d The ratio of the two monomer units in the final copolymer calculated from the 1H NMR spectra of the copolymers by eqn (S1).
e The coupling Mn and PDI cannot be obtained due to inseparable overlap in SEC. 1 copolymerization.
b The molar feed ratios of St over DPE-yne.
c Determined by SEC with tetra detectors.
d The ratio of the two monomer units in the final copolymer calculated from the 1H NMR spectra of the copolymers by eqn (S1).
e The coupling Mn and PDI cannot be obtained due to inseparable overlap in SEC.
|
||||||
| C1 | 1![[thin space (1/6-em)]](https://www.rsc.org/images/entities/char_2009.gif) : :![[thin space (1/6-em)]](https://www.rsc.org/images/entities/char_2009.gif) 1 1 |
3.4 | N/A | 1.20 | N/A | 1.1 |
| C2 | 2![[thin space (1/6-em)]](https://www.rsc.org/images/entities/char_2009.gif) : :![[thin space (1/6-em)]](https://www.rsc.org/images/entities/char_2009.gif) 1 1 |
3.2 | /e | 1.50 | /e | 2.2 |
| C3 | 4![[thin space (1/6-em)]](https://www.rsc.org/images/entities/char_2009.gif) : :![[thin space (1/6-em)]](https://www.rsc.org/images/entities/char_2009.gif) 1 1 |
3.1 | 11.7 | 1.40 | 1.20 | 5.4 |
| C3-6h | 4![[thin space (1/6-em)]](https://www.rsc.org/images/entities/char_2009.gif) : :![[thin space (1/6-em)]](https://www.rsc.org/images/entities/char_2009.gif) 1 1 |
1.8 | N/A | 1.33 | N/A | 1.9 |
| C3-8h | 2.6 | N/A | 1.14 | N/A | 1.9 | |
| C3-12h | 3.8 | N/A | 1.24 | N/A | 2.8 | |
| C3-16h | 3.7 | 11.6 | 1.27 | 1.12 | — | |
| C3-20h | 4.0 | 12.1 | 1.13 | 1.12 | ||
| C3-24h | 4.4 | 13.6 | 1.16 | 1.12 | ||
| C3-28h | 4.1 | 13.1 | 1.17 | 1.14 | ||
| C3-34h | 3.9 | 13.2 | 1.18 | 1.12 | ||
| C3-45h | 3.9 | 12.8 | 1.15 | 1.14 | ||
| C3-57h | 3.8 | 12.5 | 1.14 | 1.15 | ||
| C3-72h | 3.8 | 12.5 | 1.14 | 1.18 | ||
To investigate the high-St-feed copolymerization and monitor the unanticipated coupling reaction, timing-sample of the [St]0/[DPE-yne]0 = 4![[thin space (1/6-em)]](https://www.rsc.org/images/entities/char_2009.gif) :
:![[thin space (1/6-em)]](https://www.rsc.org/images/entities/char_2009.gif) 1 copolymerization was conducted. To ensure a high conversion, the copolymerization was allowed to undergo for 3 days. During the procedure, a range of samples were obtained and characterized. The detailed results are shown in lines C3-6h to C3-72h in Table 1, and the SEC curves and 1H NMR spectra of the copolymers are shown in Fig. 1b and 2b, respectively. The SEC curves of the samples display symmetrical and narrow single peaks for the first 12 h, and then notable shoulder peaks appeared after 16 h. The phenomenon of the shoulder peak intensified as the copolymerization progressed and ultimately converted into evident double peaks. These results show that the coupling reaction occurs during the later stage (after 16 h) rather than the early stage (before 12 h) of the copolymerization with [St]0/[DPE-yne]0 = 4
1 copolymerization was conducted. To ensure a high conversion, the copolymerization was allowed to undergo for 3 days. During the procedure, a range of samples were obtained and characterized. The detailed results are shown in lines C3-6h to C3-72h in Table 1, and the SEC curves and 1H NMR spectra of the copolymers are shown in Fig. 1b and 2b, respectively. The SEC curves of the samples display symmetrical and narrow single peaks for the first 12 h, and then notable shoulder peaks appeared after 16 h. The phenomenon of the shoulder peak intensified as the copolymerization progressed and ultimately converted into evident double peaks. These results show that the coupling reaction occurs during the later stage (after 16 h) rather than the early stage (before 12 h) of the copolymerization with [St]0/[DPE-yne]0 = 4![[thin space (1/6-em)]](https://www.rsc.org/images/entities/char_2009.gif) :
:![[thin space (1/6-em)]](https://www.rsc.org/images/entities/char_2009.gif) 1.
1.
As shown in lines C3-16h to C3-72h in Table 1, for the samples obtained from 16 h to 72 h exhibiting coupling, the SEC peaks corresponding to the unimer and the coupled part were integrated. The coupling product molecular weight was approximately 13k g mol−1, whereas the unimer molecular weight was approximately 4k g mol−1. This result indicates that in the putative side coupling, approximately 3 or 4 chains graft onto another chain during the copolymerization when the feed ratio was [St]0/[DPE-yne]0 = 4![[thin space (1/6-em)]](https://www.rsc.org/images/entities/char_2009.gif) :
:![[thin space (1/6-em)]](https://www.rsc.org/images/entities/char_2009.gif) 1. The ratios of the two monomer units (NSt/NDPE-yne) in the copolymer chains were calculated from the 1H NMR spectra using eqn (S1).† Although the ratios obtained from 16 h to 72 h are meaningless because of side coupling reactions, the NSt/NDPE-yne in the chains during the first 12 h are nearly equal to 2. Based on the special characteristics of DPE derivatives in LAP, this ratio illustrates that the dominantly average repeating unit of the copolymer chain was “two St units with one DPE-yne unit” during the initial 12 h when [St]0/[DPE-yne]0 = 4
1. The ratios of the two monomer units (NSt/NDPE-yne) in the copolymer chains were calculated from the 1H NMR spectra using eqn (S1).† Although the ratios obtained from 16 h to 72 h are meaningless because of side coupling reactions, the NSt/NDPE-yne in the chains during the first 12 h are nearly equal to 2. Based on the special characteristics of DPE derivatives in LAP, this ratio illustrates that the dominantly average repeating unit of the copolymer chain was “two St units with one DPE-yne unit” during the initial 12 h when [St]0/[DPE-yne]0 = 4![[thin space (1/6-em)]](https://www.rsc.org/images/entities/char_2009.gif) :
:![[thin space (1/6-em)]](https://www.rsc.org/images/entities/char_2009.gif) 1.
1.
The above discussion shows that the potential side coupling reaction during the copolymerization could be regulated through adjusting the feed ratios of St and DPE-yne. This indicates that the coupling reaction may be related to the intermediates. Thus, the end-capping of poly(styryl)lithium with DPE-yne or a mixture of DPE-yne and DPE-NMe2 was investigated to clarify the corresponding mechanism of the side coupling reaction. Poly(styryl)lithiums (Mn = 2000) obtained from the homopolymerization of styrene were then end-capped with different amounts of DPE-yne (examples no. 1 and no. 2 in Scheme 2). Controlling the feed ratios of the DPE derivatives in the end-capping allowed the composition of the living species to be regulated in order to simulate a similar existence of the living species in different copolymerization situations. Then, the mechanism of the side coupling can be affirmed by characterizing these polymer structures.
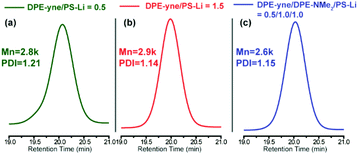
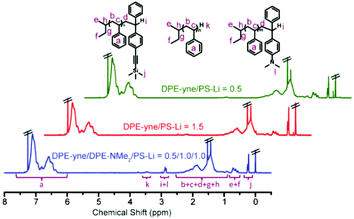
Analysis of the 1H NMR spectra shown in Fig. 4 using eqn (S2) and (S3)† provided end-capping efficiency (EDPE) values for samples no. 1 and no. 2 of 47% and 90% (ED-yne = 46%, ED-NMe2 = 44%), respectively, which were close to their theoretical values of 50% and 100%. The SEC curves of both samples are shown in Fig. 3a and b. The SEC curve of sample no. 1 (DPE-yne/PSLi = 0.5) shows a slight shoulder peak in the high molecular weight region, which may be caused by the side coupling reaction. However, the curve of sample no. 2 (DPE-yne/PSLi = 1.5) shows a symmetrical and narrow single peak. The above result indicates that the potential side coupling reaction could be restrained when the living species (PSLis) were completely end-capped by DPE-yne.
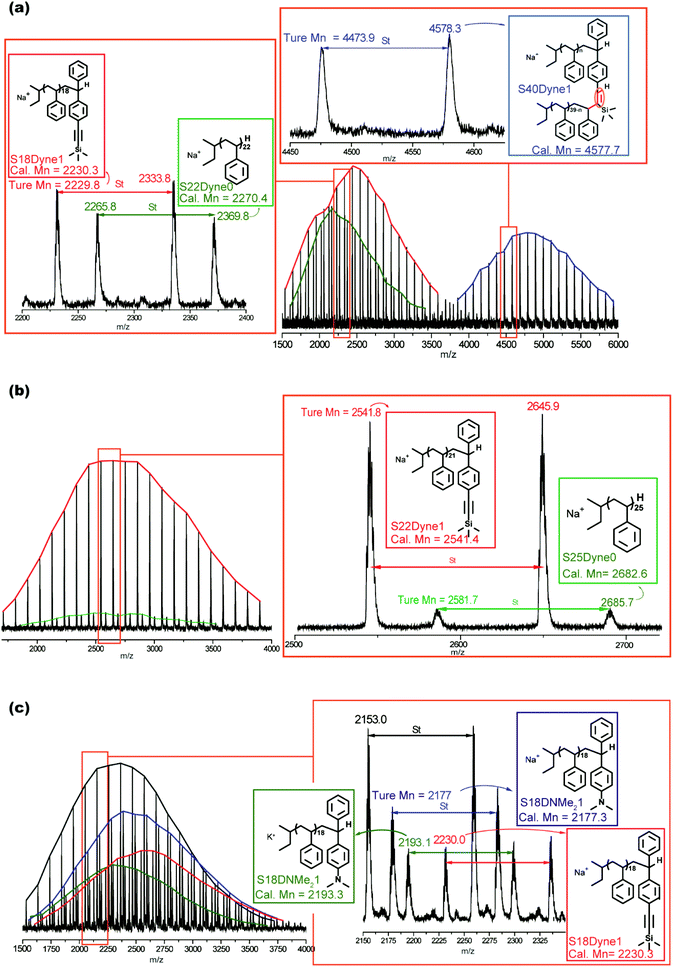
To investigate the possible mechanism for the side coupling reaction existing in PSLi to DPE-yne, all the samples were characterized by MALDI-ToF MS to analyze their accurate structures, and the corresponding curves are shown in Fig. 5. The full MALDI-ToF spectrum of sample no. 1 (DPE-yne/PSLi = 0.5) shown in Fig. 5a exhibits three different series of peaks, which are highlighted in red, green and blue. The difference between the adjacent peaks in each series was approximately 104, which corresponds to the St unit. The unimer peaks exhibited from the fragments of the spectrum for molar masses ranging from 2200 to 2400 were analysed and attributed to the chains of SnD0 and SnD1. SnD0 represents residual polystyrene without capping, and the representative structural formula is displayed in the green rectangle of Fig. 5a. SnD1 represents the mono-adduct of PSLi capped with a DPE-yne unit, and the corresponding structural formula is shown in the red rectangle. Additionally, the molar masses from 4450 to 4600 shown in the enlarged view could be attributed to dimers caused by the side coupling, and analysis of their structural formulas can lead to the determination of the corresponding mechanism. For example, 4578.3 u can be deduced as S40D1 (the calculated mass = 22.99 (Na+) + 57.07 × 2 (di-butyl) + 1.01 × 2 + 276.13 (DPE-yne) + 104.06 × 40 = 4577.7 u), and the deviation is 0.6 u. In the determined structure, the existence of the di-butyl and mono-DPE unit clearly demonstrates that residual PSLi coupled with the mono-adducts when the feed of DPE-yne was insufficient.
Furthermore, the most important evidence in the MALDI-ToF-MS peaks of sample no. 2 (DPE-yne/PSLi = 1.5), which are shown in Fig. 5b, is that only the unimer can be observed. The predominantly serial peaks (red marking) were attributed to the mono-adduct of PSLi with DPE-yne, and a small amount of residual PS was still present (green marking). The most significant difference between samples no. 1 and no. 2 is the complete disappearance of dimers when excess DPE-yne was added. This result shows that the side coupling reaction can be controlled via the feeding of DPE-yne and clearly illustrates the difference between copolymerizations C1 and C3 in Table 1. Based on the analysis of the end-capped structures, we propose the corresponding mechanism of the side coupling reaction shown in Scheme 3a and b.
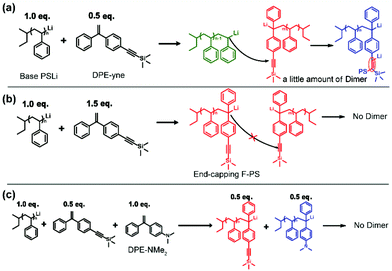 | ||
| Scheme 3 Reaction mechanisms: (a) coupling reaction between PSLi and the mono-adducts; (b) inhibiting coupling reaction by adding excess DPE-yne; (c) inhibiting coupling reaction by adding DPE-NMe2. | ||
The excess feeding of DPE-yne can effectively control the side coupling during the copolymerization, but in our previous work, only the alternating sequence can be obtained in this situation. Furthermore, only alkyne groups were dispersed along the copolymer chain, whereas variable sequences of functional groups introduced through the azido–alkyne click reaction can generate diverse features. Thus, another DPE derivative, DPE-NMe2, was introduced to resolve the side coupling and concurrently regulate the sequence structure. First, PSLi was end-capped with a mixture of DPE-yne and DPE-NMe2 (example no. 3 in Scheme 2). The SEC curve of sample no. 3 shows a narrow peak (see Fig. 3c). Additionally, sample no. 3 was characterized by MALDI-ToF-MS to analyze its structural formula. In Fig. 5c, PS end-capped with DPE-yne and PS end-capped with DPE-NMe2 can be found. Additionally, some PS end-capped with DPE-NMe2 whose metal counter ion is potassium (K+) also can be observed. One important thing is that there are no dimers as expected, indicating that the addition of DPE-NMe2 as the third monomer can definitely inhibit the side coupling. The mechanism for the formation of these species is also deduced and displayed in Scheme 3c.
Considering the low activity of DPE-NMe2, the amount of this monomer to add to the terpolymerization with St and DPE-yne in order to restrain the side coupling reaction should be investigated further. To determine the adequate amount of DPE-NMe2 to eliminate the coupling reaction, the terpolymerizations of St, DPE-yne and DPE-NMe2 at different feed ratios were performed. A range of samples were obtained during each terpolymerization procedure. The first feed ratio evaluated was [St]0/[DPE-yne]0/[DPE-NMe2]0 = 4![[thin space (1/6-em)]](https://www.rsc.org/images/entities/char_2009.gif) :
:![[thin space (1/6-em)]](https://www.rsc.org/images/entities/char_2009.gif) 1
1![[thin space (1/6-em)]](https://www.rsc.org/images/entities/char_2009.gif) :
:![[thin space (1/6-em)]](https://www.rsc.org/images/entities/char_2009.gif) 1, and the SEC curves and 1H NMR spectra of the corresponding samples are shown in Fig. S5.† After 12 h, the SEC curves display shoulder peaks, which implies that the side coupling reaction still occurs under these conditions. For the samples obtained when the feed ratio of monomers was changed to 4
1, and the SEC curves and 1H NMR spectra of the corresponding samples are shown in Fig. S5.† After 12 h, the SEC curves display shoulder peaks, which implies that the side coupling reaction still occurs under these conditions. For the samples obtained when the feed ratio of monomers was changed to 4![[thin space (1/6-em)]](https://www.rsc.org/images/entities/char_2009.gif) :
:![[thin space (1/6-em)]](https://www.rsc.org/images/entities/char_2009.gif) 1
1![[thin space (1/6-em)]](https://www.rsc.org/images/entities/char_2009.gif) :
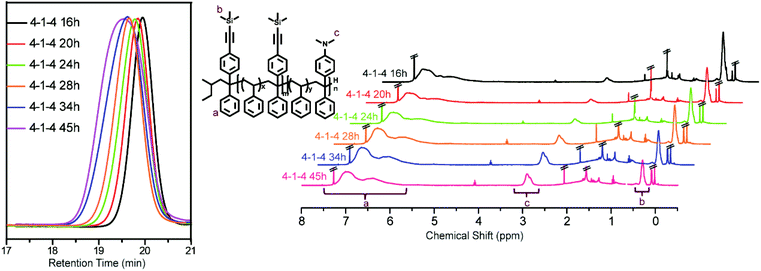
:![[thin space (1/6-em)]](https://www.rsc.org/images/entities/char_2009.gif) 4 to increase the amount of DPE-NMe2, the SEC curves and 1H NMR spectra are shown in Fig. 6 and the corresponding structural characteristics for all obtained samples are presented in Table 2. This result adequately indicates that the side coupling reaction disappears when 4 times more DPE-NMe2 than DPE-yne was used in the terpolymerization. Based on the results obtained from the above two attempts, we confirmed that an appropriate amount of DPE-NMe2 is necessary to restrain the unexpected side coupling reaction; the corresponding mechanism is displayed in Scheme 3c.
4 to increase the amount of DPE-NMe2, the SEC curves and 1H NMR spectra are shown in Fig. 6 and the corresponding structural characteristics for all obtained samples are presented in Table 2. This result adequately indicates that the side coupling reaction disappears when 4 times more DPE-NMe2 than DPE-yne was used in the terpolymerization. Based on the results obtained from the above two attempts, we confirmed that an appropriate amount of DPE-NMe2 is necessary to restrain the unexpected side coupling reaction; the corresponding mechanism is displayed in Scheme 3c.
![[thin space (1/6-em)]](https://www.rsc.org/images/entities/char_2009.gif) :
:![[thin space (1/6-em)]](https://www.rsc.org/images/entities/char_2009.gif) 1
1![[thin space (1/6-em)]](https://www.rsc.org/images/entities/char_2009.gif) :
:![[thin space (1/6-em)]](https://www.rsc.org/images/entities/char_2009.gif) 4 feed ratio
4 feed ratio
| Timea [h] |
M
n![[thin space (1/6-em)]](https://www.rsc.org/images/entities/char_2009.gif) b [kg mol−1] b [kg mol−1] |
PDIb |
N
St/NDPE-yne/NDPE-NMe2![[thin space (1/6-em)]](https://www.rsc.org/images/entities/char_2009.gif) c c |
N
St![[thin space (1/6-em)]](https://www.rsc.org/images/entities/char_2009.gif) d d |
Conv.St![[thin space (1/6-em)]](https://www.rsc.org/images/entities/char_2009.gif) e [%] e [%] |
N
DPE-yne![[thin space (1/6-em)]](https://www.rsc.org/images/entities/char_2009.gif) d d |
Conv.DPE-yne![[thin space (1/6-em)]](https://www.rsc.org/images/entities/char_2009.gif) f [%] f [%] |
NDPE-NMe2![[thin space (1/6-em)]](https://www.rsc.org/images/entities/char_2009.gif) d d |
|---|---|---|---|---|---|---|---|---|
| a The terpolymerization was initiated by sec-BuLi at r.t. in benzene. No sample was obtained before 16 h. b Determined by SEC with tetra detectors. c The ratio of the three monomer units in the final terpolymer, calculated from the 1H NMR spectra of the terpolymer using eqn (S4) and (S5). d The average numbers of three monomer units in the final terpolymer chain using eqn (S4)–(S6). e The conversion ratio of St. f The conversion ratio of DPE-yne. | ||||||||
| 16 | 3.1 | 1.13 | 1.78/1.0/0.25 | 10.7 | 32.9 | 6.0 | 85.7 | 1.5 |
| 20 | 3.2 | 1.21 | 1.82/1.0/0.30 | 10.9 | 40.0 | 6.0 | 78.5 | 1.8 |
| 24 | 3.7 | 1.26 | 2.50/1.0/0.42 | 14.7 | 45.4 | 5.9 | 84.3 | 2.5 |
| 28 | 4.2 | 1.40 | 2.91/1.0/0.60 | 17.2 | 54.6 | 5.9 | 75.5 | 3.5 |
| 34 | 5.8 | 1.29 | 4.24/1.0/1.13 | 25.4 | 78.1 | 6.0 | 85.7 | 6.8 |
| 45 | 7.6 | 1.39 | 4.62/1.0/1.41 | 32.8 | 99.7 | 7.1 | 100.0 | 10.0 |
Sequence control in the terpolymerization of St, DPE-yne and DPE-NMe2
As discussed above, the addition of an excess amount of the third monomer DPE-NMe2 can effectively restrain the unexpected side coupling reaction, which was inherent in the copolymerization of St and DPE-yne. Additionally, in the terpolymer of St, DPE-yne and DPE-NMe2, two functional groups (i.e., alkynes and amines) were incorporated into the polymer chains; therefore, how these functional groups are dispersed along the polymers becomes a very attractive and interesting problem. In the terpolymer that we synthesized, the alkynyl groups can be conjugated with other functional molecules or macromolecules via CuAAC click chemistry,32–35 meanwhile, amine moieties exhibit stimuli-responsive behavior because of their distinct electronic structure.47,48 Thus, we believe that the confirmed sequence of these two functional moieties in the polymer chain can effectively endow the polymer with enhanced synergistic effects. Consequently, we analyzed the monomer sequence distribution along the terpolymeric chains. In previous studies, MALDI-ToF mass spectrometry has been effectively applied to analyze the samples obtained from the living anionic copolymerization of dienes and DPE derivatives in order to determine the sequence structure.49,50 However, to achieve the exquisite analyses of sequence distribution during terpolymerization, the application of MALDI-ToF-MS is ill-suited because of the complexity of the chain propagation when two kinds of monomers are present.More recently, in situ1H NMR spectroscopy has enabled the analysis of the sequence structure during LAP. For the non-existence of chain transfer or termination in LAP,51 the in situ1H NMR method can effectively follow the monomer incorporation in real time during chain propagation. The consumption of each monomer can directly reflect their incorporation into the polymer chain, thus allowing their relative positions to be determined. Frey51,52 and Wurm53et al. have applied the in situ1H NMR method to monitor anionic copolymerization and provided detailed insights into the propagation behavior and sequence distribution. The in situ1H NMR method has been shown to facilitate precise understanding of the resulting polymer structures. Herein, we applied in situ1H NMR to monitor the chain propagation during the terpolymerization of St, DPE-yne and DPE-NMe2 in real time and then precisely analyzed the sequence structure and kinetics during the terpolymerization with [St]0/[DPE-yne]0/[DPE-NMe2]0 = 4![[thin space (1/6-em)]](https://www.rsc.org/images/entities/char_2009.gif) :
:![[thin space (1/6-em)]](https://www.rsc.org/images/entities/char_2009.gif) 1
1![[thin space (1/6-em)]](https://www.rsc.org/images/entities/char_2009.gif) :
:![[thin space (1/6-em)]](https://www.rsc.org/images/entities/char_2009.gif) 4.
4.
The monitoring of the copolymerization with [St]0/[DPE-yne]0 = 4![[thin space (1/6-em)]](https://www.rsc.org/images/entities/char_2009.gif) :
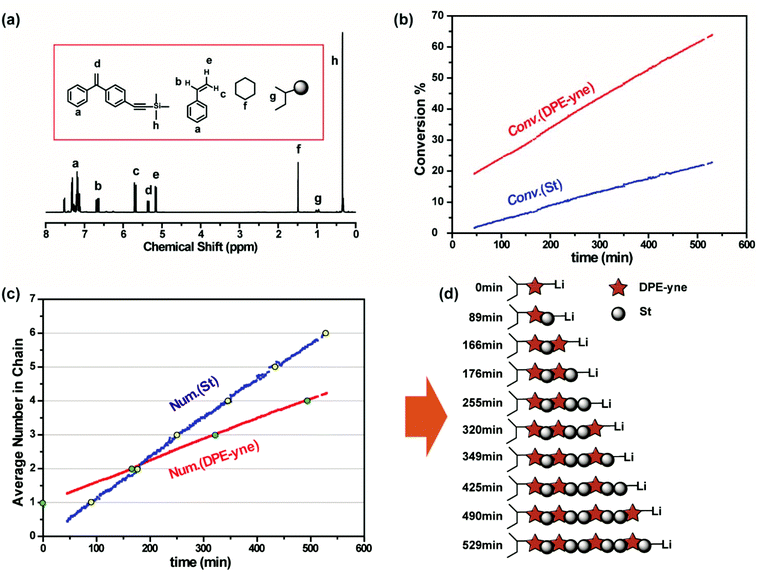
:![[thin space (1/6-em)]](https://www.rsc.org/images/entities/char_2009.gif) 1 was monitored using in situ1H NMR in the first 9 h to confirm whether the in situ1H NMR method can be applied to analyze the sequence distribution of DPE units in the chain. The copolymerization was monitored in situ for only approximately 9 h to avoid the potential side coupling reaction. After the dissolution of sec-BuLi and DPE-yne in C6D6, St was added to the NMR tube, and a 1H NMR spectrum was recorded immediately to determine the initial monomer ratio. The particular signals attributed to the protons from the double bonds in DPE-yne (δ = 5.69, dd, J = 17.6, 1.0 Hz) and St (δ = 6.66, dd, J = 17.6, 10.9 Hz; 5.35 dd, J = 15.4, 1.2 Hz; 5.20–5.12, m) are contrasted in Fig. 7a. The stacked overlay of all the in situ1H NMR spectra shown in Fig. S6† displays the continuous consumption of the monomers during the copolymerization over 9 h. The instantaneous consumption of the two monomers was calculated based on the continuous changes in the integral ratios of the characteristic peaks (δ = 5.36 and δ = 5.16 in Fig. S6†) to the trimethylsilyl group (–Si(CH3*)3) of the internal standard, and the corresponding curves of Conv. vs. time are plotted in Fig. 7b. Consequently, the average number of monomers incorporated into the chain with time was determined and is shown in Fig. 7c. The statistical sequence structure for the copolymerization of St and DPE-yne in the first 9 h can also be deduced before the side coupling reaction arises.
1 was monitored using in situ1H NMR in the first 9 h to confirm whether the in situ1H NMR method can be applied to analyze the sequence distribution of DPE units in the chain. The copolymerization was monitored in situ for only approximately 9 h to avoid the potential side coupling reaction. After the dissolution of sec-BuLi and DPE-yne in C6D6, St was added to the NMR tube, and a 1H NMR spectrum was recorded immediately to determine the initial monomer ratio. The particular signals attributed to the protons from the double bonds in DPE-yne (δ = 5.69, dd, J = 17.6, 1.0 Hz) and St (δ = 6.66, dd, J = 17.6, 10.9 Hz; 5.35 dd, J = 15.4, 1.2 Hz; 5.20–5.12, m) are contrasted in Fig. 7a. The stacked overlay of all the in situ1H NMR spectra shown in Fig. S6† displays the continuous consumption of the monomers during the copolymerization over 9 h. The instantaneous consumption of the two monomers was calculated based on the continuous changes in the integral ratios of the characteristic peaks (δ = 5.36 and δ = 5.16 in Fig. S6†) to the trimethylsilyl group (–Si(CH3*)3) of the internal standard, and the corresponding curves of Conv. vs. time are plotted in Fig. 7b. Consequently, the average number of monomers incorporated into the chain with time was determined and is shown in Fig. 7c. The statistical sequence structure for the copolymerization of St and DPE-yne in the first 9 h can also be deduced before the side coupling reaction arises.
As shown in Fig. 7c, the average number of St and DPE-yne units in each propagating polymer chain was calculated from the conversion vs. time curves. The integer values of the St and DPE-yne units in the polymer chain are highlighted with yellow and green dots, respectively. These dots were arranged in chronological order and the average numbers of inserted St between two adjacent DPE-yne units in the chain can be confirmed. Then a sketch (Fig. 7d) of the statistical sequence structure was deduced. As we can see, the structure before the appearance of a long PS block is a quasi-alternating sequence, although the concentration of St is much higher than that of DPE-yne in feed. This result shows that the reactivity of DPE-yne is far more than the one of St, and shows priority in participating in the polymerization even in a poor feed ratio. As reported in our previous studies,25 because of the high activity exhibited by DPE-SiH, the alternating structure can be formed in the initial propagation during the copolymerization of St and DPE-SiH, even when more St was fed into the reaction. The DPE-yne showed high activity due to the introduction of an electron withdrawing group into the structure and the sequence distribution in the chain was still consistent with the rule that we had previously discovered.
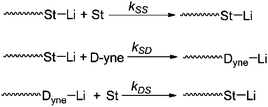
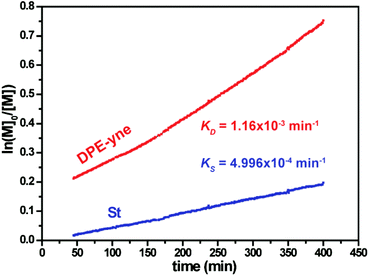
The kinetics during the copolymerization without the side coupling reaction was also investigated using the in situ1H NMR method. According to eqn (S9) and (S10),† the corresponding curves of ln([M]0/[M]) vs. time are shown in Fig. 8. The apparent rate constants of St and DPE-yne, i.e., KSt and KDPE-yne, were obtained from the tangent slopes. After linear fitting from 45 to 150 min (Conv.(DPE-yne) < 30%, Conv.(St) < 10%), KSt and KDPE-yne were calculated to be 4.996 × 10⁻⁴ min−1 and 1.16 × 10⁻³ min−1, respectively. The kinetic results show that KDPE-yne is much higher than KSt, as mentioned, which suggests that DPE-yne is more reactive than St during copolymerization and can be rapidly incorporated into polymer chains. Meanwhile, the lower value of KSt in the copolymerization implies that the crossover of living species from P-DLi to P-SLi (see Scheme 4) becomes the rate determining step in the chain propagation. Additionally, the reactivity ratio of St (rSt) during the copolymerization with DPE derivatives is significant for kinetic investigations of LAP. The Mayo–Lewis equation can be used to calculate the rSt in the copolymerization of St with low-reactivity DPE derivatives21 but is not suited for DPE derivatives with high reactivity. Here, we adopted the least-squares analysis and according to eqn (S11),†rSt is 0.05 after calculation (the detailed process is shown in the ESI†). It is close to 0 because the kSD-yne was very high. This result can explain the reason why quasi-alternating structure still appears even in poor DPE-yne feed: rSt is too small to form a long PS block in initial polymerization!
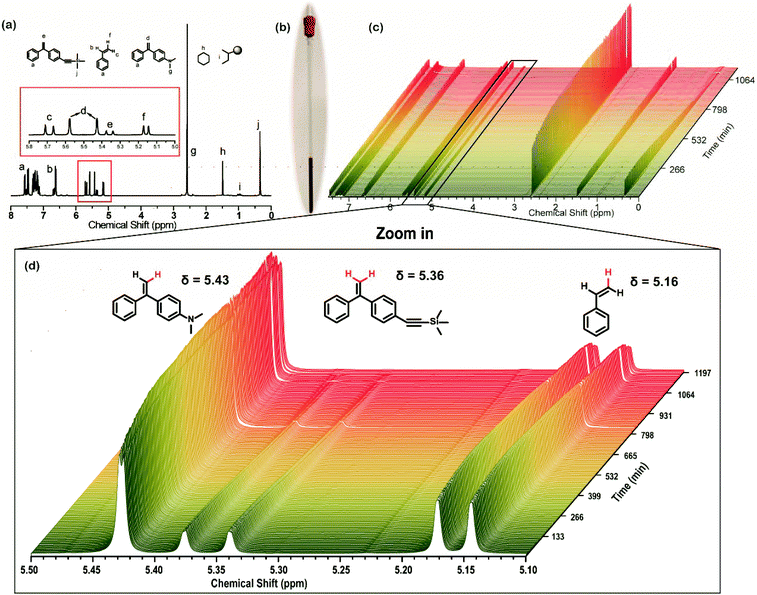
The in situ1H NMR method was also used to monitor the chain propagation during the terpolymerization and to deduce the sequence distribution of the functional groups in the chain. As discussed above, the sequence structure of the in-chain dual-functionalized polymers is a worthwhile research area in the context of both in-chain functionalized polymers and sequence-controlled synthesis. Only the sequence of all multiple functional groups (in this paper, alkynyl and amino groups) is under control and the deep insight into correlation between polymer structures and properties can be generated in the applications. The process of in situ1H NMR monitoring during the terpolymerization of St, DPE-yne and DPE-NMe2 was similar to that during the copolymerization of St and DPE-yne. After the addition of St and DPE-NMe2 into the NMR tube (see Fig. 9b), in which the sec-BuLi and DPE-yne have already formed DPELi, a 1H NMR spectrum was recorded immediately to determine the initial monomer ratio. Moreover, the specific signals from the double bonds in DPE-yne (δ = 5.36, d, J = 14.3 Hz), St (δ = 6.76–6.54, m; 5.69, d, J = 17.6 Hz; d, 5.16, d, J = 10.9 Hz) and DPE-NMe2 (δ = 5.50, dd, J = 60.0, 1.2 Hz) are contrasted in Fig. 9a. The SEC curve of the terpolymer obtained after the in situ1H NMR monitoring is shown in Fig. S7,† revealing the presence of a single narrow peak. This result also indicates that the side coupling reaction does not occur during the in situ monitoring of the terpolymerization.
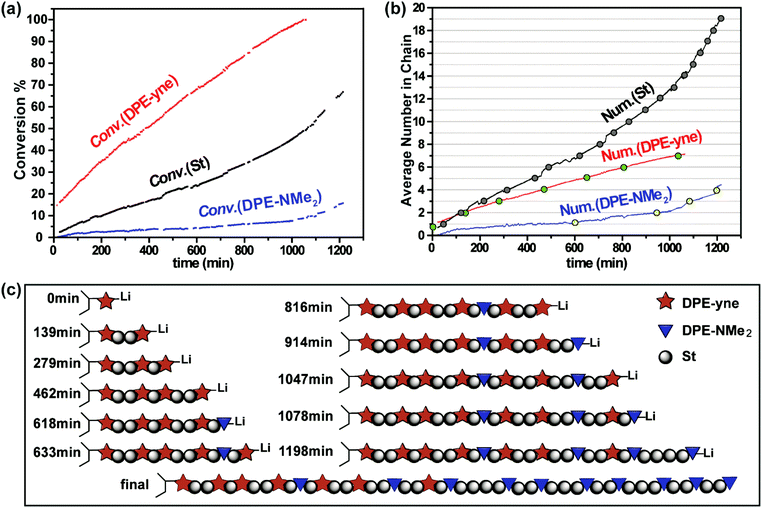
Fig. 9c shows the stacked overlay of all the 1H NMR spectra of the propagation of the terpolymerization over 20 h. The chart below (see Fig. 9d) shows a partially zoomed-in region containing the peaks attributed to the double bonds in DPE-NMe2, DPE-yne and St (5.10–5.50 ppm). As shown in Fig. 9d, the intensity of the characteristic peaks in DPE-yne (5.30–5.40 ppm) and St (5.10–5.20 ppm) obviously decreased, while that of the peaks in DPE-NMe2 (5.40–5.50 ppm) was nearly unchanged during the first 20 h. Based on the continuous change in the integral ratios of the characteristic peaks (δ = 5.43, δ = 5.36 and δ = 5.16 in Fig. 9d) to the –Si(CH3*)3 group from the internal standard, the instantaneous consumption of each monomer was calculated, and the corresponding three Conv. vs. time curves are plotted in Fig. 10a. After 20 h of in situ monitoring, the final conversions of DPE-yne, St and DPE-NMe2 were 100%, 66.8% and 15.7%, respectively. Consequently, the statistical sequence structure was obtained when all three monomers were incorporated into the polymer chain, as determined by the proportion from Fig. 10a.
As shown in Fig. 10b, the average number of each monomer incorporated into the propagating chains was calculated from the initial feed ratio and the obtained conversion. The integer values of St, DPE-yne and DPE-NMe2 are highlighted in gray, green and yellow, respectively. These dots were arranged together in chronological order and the average numbers of inserted St between two adjacent DPE derivatives in the chain can be deduced. Then the sketch of the statistical sequence structure is visualized in Fig. 10c. The entire sequence is a gradient structure with compositional drift from a predominant St-(DPE-yne) fraction initially to a St-(DPE-NMe2) fraction finally and the sequence between them is a transition fraction. Moreover, two DPE derivatives keep their original distribution in their respective fraction with St. In the St-(DPE-yne) fraction, the statistical sequence presents a quasi-alternating structure which is consistent with the characteristics during the copolymerization of St and DPE-yne investigated above. This result also indicates that the presence of DPE-NMe2 has little effects on the initial propagation of the terpolymerization, and the copolymerization of DPE-yne with St was primarily proceeding in this period. In the St-(DPE-NMe2) fraction, the sequence presents a tail-gathering tendency which means that DPE-NMe2 noticeably participates in the polymerization only when its relative concentration is high enough. This is consistent with our previous work.24 Additionally, the transition sequence exists where the DPE units (DPE-yne and DPE-NMe2) are dispersed with St. This phenomenon is interesting and can provide further prospects if we can regulate its sequence. The reason why this special sequence structure with compositional drift from the predominant St-(DPE-yne) fraction initially to the St-(DPE-NMe2) fraction finally mainly happened is that the DPE-yne is more reactive than DPE-NMe2. DPE-yne can react with St firstly even if there is 4 times more DPE-NMe2 and St than DPE-yne. Thus, the St-(DPE-yne) fraction formed. With the gradual consumption of DPE-yne, DPE-NMe2 became more active due to its increasing relative concentration and was incorporated and dispersed into the polymer chain. After the complete consumption of DPE-yne, the copolymerization of St and DPE-NMe2 can be observed, and the St-(DPE-NMe2) fraction was formed. Here, we have obtained the entire sequence structure of the terpolymer of DPE-yne, DPE-NMe2 and St, allowing the determination of the controlled distribution of the alkynyl and amine functional groups in the chain. We do believe that our effort to determine and control the sequence distribution of in-chain dual-functionalized polymers will stimulate further investigations on the application of sequence-controlled structures.
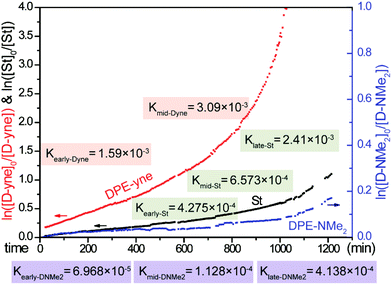
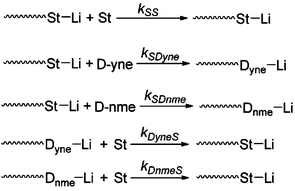
Meanwhile, the detailed kinetics of the terpolymerization were investigated and all the chain propagation processes are shown in Scheme 5. According to eqn (S15)–(S17),† the apparent kinetic curves of the terpolymerization propagation were obtained by plotting ln([M]0/[M]) vs. time (see Fig. 11). In the initial stage of polymerization, the slope of DPE-yne is far larger than that of St and St is larger than DPE-NMe2. The linear fitting is actualized from 0 min to 400 min to obtain the early apparent rate constants (Kearly): Kearly-Dyne is 1.59 × 10⁻³ min−1, Kearly-St is 4.275 × 10⁻⁴ min−1, and Kearly-DNMe2 is 6.968 × 10⁻⁵ min−1. Because Kearly-DNMe2 is much lower than Kearly-Dyne and Kearly-St, the amount of DPE-NMe2 incorporated can be neglected, and only the propagation of DPE-yne and St was observed. Based on this assumption, the calculated value of early rSt-yne is 0.08 which is consistent with the copolymerization result. When the DPE-yne is completely consumed, the slopes of St and DPE-NMe2 are remarkably increased. Similarly, the linear fitting is actualized from 1000 min to 1200 min to obtain their apparent rate constants (Klate): Klate-St is 2.4 × 10⁻³ min−1 and Klate-DNMe2 is 4.138 × 10⁻⁴ min−1, and they are considerably increased compared with the ones in the initial stage (see Kearly). This is mainly because DPE-yne has been consumed and there is no P-(DPE-yne)-Li species to limit the propagation. Due to the relatively small amount and high reactivity of DPE-yne, the effect of DPE-yne on the polymerization of DPE-NMe2 and St can be neglected and then the corresponding rSt-NMe2 was about 5.8 after calculation. Compared with the value in our previous work,24 the rSt was calculated as 9.1 with the Mayo–Lewis equation and the calculated method for rSt in this paper was also revised (see the ESI†). However, the tendency of the incorporation of DPE-NMe2 can still be confirmed. In a medium-term reaction, the linear fitting from 600 to 800 min is actualized to illustrate the kinetics. Kmid-Dyne is 3.09 × 10⁻³ min−1, Kmid-St is 6.573 × 10⁻⁴ min−1 and Kmid-DNMe2 is 1.128 × 10⁻⁴ min−1. Kmid-DNMe2 is obviously increased compared to Kearly-DNMe2, which indicates that the incorporation of DPE-NMe2 into the polymer chain becomes perceptible and the terpolymeric transition sequence begins to form.
Conclusions
The alkynyl-functionalized DPE derivative DPE-yne was incorporated into a polymer chain through LAP. An unanticipated coupling reaction occurred and could be regulated by extra feeding of DPE derivatives. The degree of side coupling was notably reduced by increasing the feed amount of DPE-yne, and the coupling reaction was completely eliminated under equal feeding conditions. Investigating the side coupling mechanism further indicated that excess PSLi coupled with the DPE-yne units in the chain when insufficient DPE-yne was added. Although the excess feeding of DPE-yne can effectively inhibit the side coupling during the copolymerization, only an alternating sequence can be prepared in this situation. Further studies conclusively showed that introducing an appropriate amount of another DPE derivative, DPE-NMe2, into the polymerization could effectively restrict the side coupling. Additionally, this strategy enabled the incorporation of two functional groups (alkynyl and amines) into the polymer chains, making their sequence distribution more interesting.Thus, the in situ1H NMR method was applied to monitor the chain propagation during the terpolymerization in real time. As a comparison, in situ1H NMR monitoring was used to monitor the first 9 h of the copolymerization with [St]0/[DPE-yne]0 = 4![[thin space (1/6-em)]](https://www.rsc.org/images/entities/char_2009.gif) :
:![[thin space (1/6-em)]](https://www.rsc.org/images/entities/char_2009.gif) 1. The in situ1H NMR results show that the entire sequence is a gradient structure with compositional drift from a predominant St-(DPE-yne) fraction initially to a St-(DPE-NMe2) fraction finally and the sequence between them is a transition fraction. Consistent with special sequence distribution in the polymer chain, the terpolymerization kinetic was investigated, and the apparent kinetic constant (K) of each monomer at a representative reaction period was obtained. In the initial stage of polymerization, Kearly-DNMe2 is much lower than Kearly-Dyne and Kearly-St, thus only the copolymerization of DPE-yne and St was observed. In the medium-term reaction, Kmid-DNMe2 is increased compared to Kearly-DNMe2, which indicates that the incorporation of DPE-NMe2 into the polymer chain becomes perceptible and the terpolymerization occurs. In the late period, the DPE-yne is completely consumed and Klate-DNMe2 and Klate-St are obviously increased to form the copolymerization of St and DPE-NMe2. The corresponding reactivity ratios were also obtained. The rSt-Dyne and rSt-Dnme were calculated as 0.08 and 5.8 in the terpolymerization, respectively.
1. The in situ1H NMR results show that the entire sequence is a gradient structure with compositional drift from a predominant St-(DPE-yne) fraction initially to a St-(DPE-NMe2) fraction finally and the sequence between them is a transition fraction. Consistent with special sequence distribution in the polymer chain, the terpolymerization kinetic was investigated, and the apparent kinetic constant (K) of each monomer at a representative reaction period was obtained. In the initial stage of polymerization, Kearly-DNMe2 is much lower than Kearly-Dyne and Kearly-St, thus only the copolymerization of DPE-yne and St was observed. In the medium-term reaction, Kmid-DNMe2 is increased compared to Kearly-DNMe2, which indicates that the incorporation of DPE-NMe2 into the polymer chain becomes perceptible and the terpolymerization occurs. In the late period, the DPE-yne is completely consumed and Klate-DNMe2 and Klate-St are obviously increased to form the copolymerization of St and DPE-NMe2. The corresponding reactivity ratios were also obtained. The rSt-Dyne and rSt-Dnme were calculated as 0.08 and 5.8 in the terpolymerization, respectively.
Additionally, the terpolymerization conditions investigated here not only inhibit the side coupling reaction but also lead to the introduction of a third functional monomer; its sequence structure shows potentially novel and intriguing properties that can further the applications of functionalized polymers. This research can also provide new insights into improved sequence control in the synthesis of multifunctional polymers, which will be the focus of our future research.
Conflicts of interest
There are no conflicts to declare.Acknowledgements
This work was financially supported by the National Key R&D Program of China, Grant No. 2017YFB0307100 (2017YFB0307101), and the National Natural Science Foundation of China (No. 21674017 and U1508204).References
- J. F. Lutz, M. Ouchi, D. R. Liu and M. Sawamoto, Science, 2013, 341, 628–638 CrossRef CAS PubMed.
- N. Badi and J. F. Lutz, Chem. Soc. Rev., 2009, 38, 3383–3390 RSC.
- R. K. Roy and J. F. Lutz, J. Am. Chem. Soc., 2014, 136, 12888–12891 CrossRef CAS PubMed.
- H. Qiu, Z. M. Hudson, M. A. Winnik and I. Manners, Science, 2015, 347, 1329–1332 CrossRef CAS PubMed.
- H. K. Murnen, A. R. Khokhlov, P. G. Khalatur, R. A. Segalman and R. N. Zuckermann, Macromolecules, 2012, 45, 5229–5236 CrossRef CAS.
- H. K. Murnen, A. M. Rosales, A. V. Dobrynin, R. N. Zuckermann and R. A. Segalman, Soft Matter, 2013, 9, 90–98 RSC.
- A. M. Rosales, B. L. McCulloch, R. N. Zuckermann and R. A. Segalman, Macromolecules, 2012, 45, 6027–6035 CrossRef CAS.
- J. Li, R. M. Stayshich and T. Y. Meyer, J. Am. Chem. Soc., 2011, 133, 6910–6913 CrossRef CAS PubMed.
- E. F. Palermo and A. J. McNeil, Macromolecules, 2012, 45, 5948–5955 CrossRef CAS.
- S. Srichan, N. Kayunkid, L. Oswald, B. Lotz and J.-F. Lutz, Macromolecules, 2014, 47, 1570–1577 CrossRef CAS.
- N. Zydziak, W. Konrad, F. Feist, S. Afonin, S. Weidner and C. Barner-Kowollik, Nat. Commun., 2016, 7, 13672 CrossRef CAS PubMed.
- P. Espeel, L. L. Carrette, K. Bury, S. Capenberghs, J. C. Martins, F. E. Du Prez and A. Madder, Angew. Chem., Int. Ed., 2013, 52, 13261–13264 CrossRef CAS PubMed.
- M. Zamfir and J.-F. Lutz, Nat. Commun., 2012, 3, 1138 CrossRef.
- C. Zhang, J. Ling and Q. Wang, Macromolecules, 2011, 44, 8739–8743 CrossRef CAS.
- Y. Hibi, S. Tokuoka, T. Terashima, M. Ouchi and M. Sawamoto, Polym. Chem., 2011, 2, 341–347 RSC.
- A. M. Rosales, R. A. Segalman and R. N. Zuckermann, Soft Matter, 2013, 9, 8400–8414 RSC.
- Y. Ji, L. Zhang, X. Gu, W. Zhang, N. Zhou, Z. Zhang and X. Zhu, Angew. Chem., Int. Ed., 2017, 56, 2328–2333 CrossRef CAS PubMed.
- T. Soejima, K. Satoh and M. Kamigaito, J. Am. Chem. Soc., 2016, 138, 944–954 CrossRef CAS PubMed.
- T. Soejima, K. Satoh and M. Kamigaito, ACS Macro Lett., 2015, 4, 745–749 CrossRef CAS.
- Y. Hibi, M. Ouchi and M. Sawamoto, Nat. Commun., 2016, 7, 11064 CrossRef PubMed.
- H. Yuki, J. Hotta, Y. Okamoto and S. Murahashi, Bull. Chem. Soc. Jpn., 1967, 40, 2659–2663 CrossRef CAS.
- P. Liu, H. Ma, W. Huang, H. Shen, L. Wu, Y. Li and Y. Wang, Polymer, 2016, 97, 167–173 CrossRef CAS.
- W. Sang, H. Ma, Q. Wang, X. Hao, Y. Zheng, Y. Wang and Y. Li, Polym. Chem., 2016, 7, 219–234 RSC.
- P. Liu, H. Ma, W. Huang, L. Han, X. Hao, H. Shen, Y. Bai and Y. Li, Polym. Chem., 2017, 8, 1778–1789 RSC.
- H. Ma, Q. Wang, W. Sang, L. Han, P. Liu, J. Chen, Y. Li and Y. Wang, Macromol. Rapid Commun., 2015, 36, 726–732 CrossRef CAS PubMed.
- Q. M. Kainz and O. Reiser, Acc. Chem. Res., 2014, 47, 667–677 CrossRef CAS PubMed.
- R. Haag, Chem. – Eur. J., 2001, 7, 327–335 CrossRef CAS.
- S. Martins, J. P. Farinha, C. Baleizao and M. N. Berberan-Santos, Chem. Commun., 2014, 50, 3317–3320 RSC.
- J. Dong, Y. Wang, J. Zhang, X. Zhan, S. Zhu, H. Yang and G. Wang, Soft Matter, 2013, 9, 370–373 RSC.
- J. Chen, M. Liu, H. Gong, G. Cui, S. Lü, C. Gao, F. Huang, T. Chen, X. Zhang and Z. Liu, Polym. Chem., 2013, 4, 1815 RSC.
- S. Li, H.-Y. Lu, Y. Shen and C.-F. Chen, Macromol. Chem. Phys., 2013, 214, 1596–1601 CrossRef CAS.
- J. Herzberger, D. Leibig, J. Langhanki, C. Moers, T. Opatz and H. Frey, Polym. Chem., 2017, 8, 1882–1887 RSC.
- A. Hanisch, H. Schmalz and A. H. E. Müller, Macromolecules, 2012, 45, 8300–8309 CrossRef CAS.
- H. Ma, Q. Wang, W. Sang, L. Han, P. Liu, H. Sheng, Y. Wang and Y. Li, Macromol. Rapid Commun., 2016, 37, 168–173 CrossRef CAS PubMed.
- W. Zhao, Y. Gnanou and N. Hadjichristidis, Polym. Chem., 2016, 7, 3487–3491 RSC.
- A. Gress, A. Völkel and H. Schlaad, Macromolecules, 2007, 40, 7928–7933 CrossRef CAS.
- Y. H. Lim, G. S. Heo, Y. H. Rezenom, S. Pollack, J. E. Raymond, M. Elsabahy and K. L. Wooley, Macromolecules, 2014, 47, 4634–4644 CrossRef CAS PubMed.
- H. He, S. Averick, E. Roth, D. Luebke, H. Nulwala and K. Matyjaszewski, Polymer, 2014, 55, 3330–3338 CrossRef CAS.
- A. Natalello, J. N. Hall, E. A. Eccles, S. M. Kimani and L. R. Hutchings, Macromol. Rapid Commun., 2011, 32, 233–237 CrossRef CAS PubMed.
- T. K. Purkait, M. Iqbal, M. H. Wahl, K. Gottschling, C. M. Gonzalez, M. A. Islam and J. G. Veinot, J. Am. Chem. Soc., 2014, 136, 17914–17917 CrossRef CAS PubMed.
- T. T. L. Kwan, O. Boutureira, E. C. Frye, S. J. Walsh, M. K. Gupta, S. Wallace, Y. Wu, F. Zhang, H. F. Sore, W. R. J. D. Galloway, J. W. Chin, M. Welch, G. J. L. Bernardes and D. R. Spring, Chem. Sci., 2017, 8, 3871–3878 RSC.
- A. Al Samad, Y. Bakkour, C. Fanny, F. El Omar, J. Coudane and B. Nottelet, Polym. Chem., 2015, 6, 5093–5102 RSC.
- W. Wang, Y. Shi, X. Wang, A. Qin, J. Z. Sun and B. Z. Tang, Polym. Chem., 2017, 8, 2630–2639 RSC.
- V. X. Truong and A. P. Dove, Angew. Chem., Int. Ed., 2013, 52, 4132–4136 CrossRef CAS PubMed.
- J. S. Oakdale, L. Kwisnek and V. V. Fokin, Macromolecules, 2016, 49, 4473–4479 CrossRef CAS.
- N. F. Konig, A. Al Ouahabi, S. Poyer, L. Charles and J. F. Lutz, Angew. Chem., Int. Ed., 2017, 56, 7297–7301 CrossRef PubMed.
- L. Zhang, X. Lou, Y. Yu, J. Qin and Z. Li, Macromolecules, 2011, 44, 5186–5193 CrossRef CAS.
- A. P. Majewski, A. Schallon, V. Jerome, R. Freitag, A. H. Muller and H. Schmalz, Biomacromolecules, 2012, 13, 857–866 CrossRef CAS PubMed.
- L. R. Hutchings, P. P. Brooks, D. Parker, J. A. Mosely and S. Sevinc, Macromolecules, 2015, 48, 610–628 CrossRef CAS.
- H. Ma, L. Han and Y. Li, Macromol. Chem. Phys., 2017, 218, 1600420 Search PubMed.
- A. Natalello, M. Werre, A. Alkan and H. Frey, Macromolecules, 2013, 46, 8467–8471 CrossRef CAS.
- D. Leibig, A. H. E. Müller and H. Frey, Macromolecules, 2016, 49, 4792–4801 CrossRef CAS.
- E. Rieger, A. Alkan, A. Manhart, M. Wagner and F. R. Wurm, Macromol. Rapid Commun., 2016, 37, 833–839 CrossRef CAS PubMed.
Footnote |
| † Electronic supplementary information (ESI) available: Synthetic routes for monomers and (co)polymers; 1H NMR spectra and MS-EI spectrum of monomers; unimportant SEC curves and 1H NMR spectra of (co)polymers; in situ1H NMR spectra stacked overlay of copolymerization; equations list. See DOI: 10.1039/c7py01837a |
| This journal is © The Royal Society of Chemistry 2018 |


