Rosindone revisited: a computational and photophysical study of 7-phenylbenzo[a]phenazine-5(7H)-one (PBP)†
Dumitru
Sirbu
 a,
Rebecca
Wales
a,
David R.
Geary
a,
Paul G.
Waddell
b and
Andrew C.
Benniston
a,
Rebecca
Wales
a,
David R.
Geary
a,
Paul G.
Waddell
b and
Andrew C.
Benniston
 *a
*a
aMolecular Photonics Laboratory, Chemistry-School of Natural and Environmental Sciences, Newcastle University, Newcastle upon Tyne, NE1 7RU, UK. E-mail: andrew.benniston@ncl.ac.uk
bCrystallography Laboratory, Chemistry-School of Natural and Environmental Sciences, Newcastle University, Newcastle upon Tyne, NE1 7RU, UK
First published on 22nd October 2018
Abstract
A reasonable gram quantity of the crystalline red dye 7-phenylbenzo[a]phenazine-5(7H)-one (PBP) was synthesised by the condensation of N-phenylbezene-1,2-diamine with 2-hydroxynaphthalene-1,4-dione in acetic acid (58% yield). The molecular structure of the dye, as determined by single-crystal X-ray crystallography, reveals a near planar phenazinone-like core, and an N-phenyl group twisted out of this plane by around 85°. The CO bond length of 1.241(2) Å is consistent with double bond character, which supports minor ground state zwitterionic character to the compound. The wavelength maximum for the observed partially structured low-energy absorption band is relatively insensitive to changes in the solvent polarity and polarizability. TD-DFT calculations predict that the long wavelength absorption envelope originates from localised π–π* transitions with no contribution from an n–π* state. The fluorescence quantum yield and singlet lifetime of the dye in MeCN are 0.12 and 3.0 ns, respectively. Fluorescence maxima are slightly sensitive to the solvent and changes in the Stokes shifts for a small series of alkanols were fitted to the Lippert–Mataga equation to afford a change in dipole moment of 8 ± 2 D. Calculations also reveal that full rotation of the N-phenyl group is severely restricted in the ground state (ΔEGS = 29 kcal mol−1) and in the first-excited singlet state (ΔEES = 34 kcal mol−1). The rocking back and forth of the phenyl group distorts the phenazinone-like backbone as it becomes co-planar and a minor solvent viscosity effect was observed in hydrogen bonding alkanol solvents.
Introduction
Rosinduline, or azocarmine G, is a doubly sulfonated water soluble red dye that has been recognised for well over 100 years, and has found numerous applications including the staining of cells for microscopy studies,1 as a redox titration indicator,2 a metal ion and poisons detector3 and a food dye (Fig. 1). Despite the fact that rosinduline is a well-established commercial dye the lack of photophysical and photochemical data on the material is surprising. Most in-depth search results are focussed on rosinduline preparation details or its derivatives4 and quantitative data are conspicuously absent. Photodegradation of the dye by UV-photo Fenton chemistry,5 or its photooxidation over hydroxyl iron–aluminium pillared bentonite using hydrogen peroxide6 would appear to suggest the compound can be degraded. The fundamental core to the dye is primarily based on a phenazinone-like moiety and is identified as 7-phenylbenzo[a]phenazine-5(7H)-one (PBP), or rosindone, as shown in Fig. 1. Again, any specific fundamental data for PBP was sparse and whether or not the compound even displayed fluorescence was hard to track down. Whereas oxidation of the dye looked reasonable because of the amine feature, the conjugated carbonyl unit also seemed a facile sight for reduction to a ketyl-like radical. Certainly this latter facet was considered appealing in regard to the use of PBP as a photooxidant, providing the compound performed in a similar manner to H-abstraction agents such as benzophenone.7 Noting the photoxidant capability of benzophenone is primarily driven from its triplet n–π* state,8 the practical question of what the energy level diagram for PBP resembled seemed pertinent. Hence, given the lack of quality data for PBP a detailed photophysical investigation of the compound was undertaken coupled to a predictive DFT computational study. The dye exhibits modest fluorescence in MeCN with a quantum yield of 0.12. Identification of the triplet state and its quantum yield was problematic pointing to poor intersystem crossing of the singlet and triplet states. This observation is attributed to the spin and orbitally forbidden intersystem crossing of the first-excited singlet (S1) π–π* state to the near isoenergetic second-excited triplet (T2) π–π* state. The low fluorescence quantum yield is somewhat linked to the moderately efficient non-radiative deactivation of S1 caused by distortion of the phenazinone-like backbone facilitated by rocking of the N-phenyl group.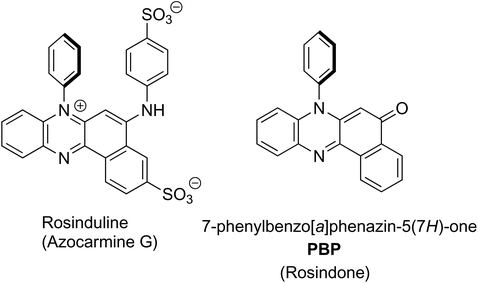 | ||
| Fig. 1 The chemical structure of rosinduline (left) and the basic starting material core 7-phenylbenzo[a]phenazine-5(7H)-one (PBP) (right). | ||
Results and discussion
Synthesis and characterisation
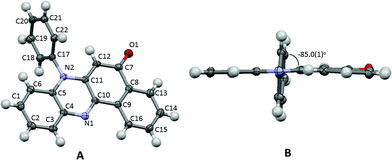
The title compound 7-phenylbenzo[a]phenazine-5(7H)-one (PBP) was synthesised in an unoptimised yield of 58% by the condensation of N-phenylbezene-1,2-diamine with 2-hydroxynaphthalene-1,4-dione in acetic acid and precipitation. Despite the modest yield the compound can be prepared on a multi-gram scale. The crude dark red solid, as evidenced by 1H NMR spectroscopic analysis, was around 95% pure but further purification by recrystallization afforded a red crystalline material. Both 1H and 13C NMR spectra were fully consistent with the structure, and the modest band at 1613 cm−1 in the FT-IR spectrum confirmed the presence of the carbonyl unit. The dye is soluble, to various degrees, in most organic protic and aprotic solvents at room temperature, but it is completely insoluble in water. Single crystals of PBP grown from a chloroform/hexane solution by slow evaporation were of suitable quality for an X-ray structure determination, and the molecular structure is illustrated in Fig. 2. Selected bond lengths and angles are shown in Table 1. Considering the structure of PBP some degree of zwitterionic character might be expected, so as to generate more single bond character in the carbonyl subunit (eqn (1)) | (1) |
| Atoms | Bond lengtha/Å | Atoms | Bond anglea /° |
|---|---|---|---|
| a DFT calculated bond lengths and angles given in brackets for the gas phase structure of PBP as determined using Gaussian 09 (B3LYP) and a 6-311G+(d) basis set.9 | |||
| O1–C7 | 1.241(2) | O1–C7–C8 | 120.39(11) |
| (1.231) | (121.03) | ||
| N1–C4 | 1.381(2) | O1–C7–C12 | 122.31(11) |
| (1.376) | (121.96) | ||
| N1–C10 | 1.304(2) | N2–C11–C12 | 122.69(11) |
| (1.299) | (122.80) | ||
| N2–C5 | 1.390(2) | C4–N1–C10 | 118.86(10) |
| (1.394) | (119.80) | ||
| N2–C11 | 1.380(2) | C5–N2–C11 | 121.96(10) |
| (1.393) | (121.60) | ||
| N2–C17 | 1.451(2) | C11–N2–C17 | 117.86(10) |
| (1.443) | (119.02) | ||
| C7–C12 | 1.431(2) | C5–N2–C17 | 120.08(10) |
| (1.447) | (119.38) | ||
| C11–C12 | 1.368(2) | ||
| (1.368) | |||
| C7–C8 | 1.491(2) | ||
| (1.494) | |||
The O1–C7 bond length is certainly more in fitting with formal double bond character and this, coupled with the quinoidal bond length pattern of the C7–C8–C9–C10–C11–C12 ring and the comparable N2–C11/N2–C5 bond lengths, would suggest there is little ground-state zwitterionic character. The short N1–C10 bond is also as expected for a phenazinone-based ring. The phenazinone-like unit is almost planar with a root mean square deviation of 0.060 Å (Fig. 2B), though a small deviation from planarity is observed in the C8–C9–C13–C14–C15–C16 ring, which is folded ca. 1.4° towards the adjacent quinoidal ring. The N-phenyl group is as might be expected twisted out of plane by 85° (torsion angle C11–N2–C17–C22) to alleviate unfavourable H–H steric interactions. There are no exceptional crystal packing features.
Molecular modelling and predictions
The gas-phase structure for PBP as calculated using DFT (B3LYP) and a 6-311G+(d) basis set is in fairly good agreement with the X-ray crystal structure; calculated bond lengths and angles (Table 1) are in some cases well within 3σ. The N-phenyl twist angle is 89.9° (cf. 85° for the X-ray structure). The HOMO is almost exclusively localized on the phenazinone-like moiety with notable electron density residing along the C1–C6–C5–N2–C11–C12–C7–O1 backbone. In comparison the LUMO is more uniformly distributed over the entire molecular framework including the C8–C9–C13–C14–C15–C16 aromatic ring. The charge distribution within the molecular scaffold is manifest in a modest ground-state dipole moment of 5.6 D. Calculated ground-state dipole moments for PBP immersed in a solvent matrix using an integral equation formalism polarizable continuum model (IEFPCM) with various dielectric constants displayed modest alterations (see ESI†). The longest wavelength absorption maximum (λmax) calculated for the gas phase structure using a time-dependent DFT (TD-DFT) approach is located at 463 nm, and shifts to 475 (2.61 eV) when the molecule is fully immersed in a MeCN solvent bath. The major contribution to the absorption envelop arises from the HOMO to LUMO electronic transition (see ESI†) which is essentially π–π*. There is no indication of an n–π* transition contributing to the long wavelength absorption envelope. Other calculated values of λmax for solvents of diverse polarity do not vary by more than 2 nm, which would suggest that solvent interactions with PBP do not affect the energy of electronic transitions to any major extent. Comparison of the TD-DFT calculated first-excited singlet state and ground-state structures in a MeCN solvent bath reveals that the molecule remains planar, but the zwitterionic character perturbs bond lengths of the central diazo ring and the keto-ene containing ring (see ESI†). The structural change is accompanied by a small change in the dipole moment (0.8 D) (Fig. 3).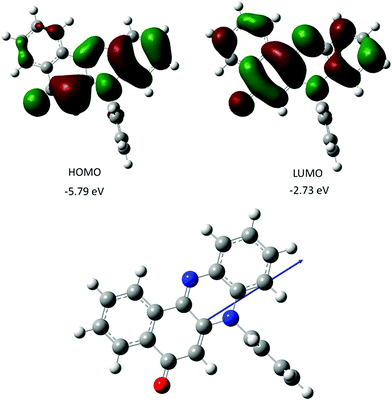 | ||
| Fig. 3 Representation of selected DFT calculated Kohn–Sham frontier molecular orbitals for PBP (top), and the calculated ground-state structure showing the direction of the dipole moment (bottom). | ||
Calculated energies for the triplet states of PBP are enlightening in as much that the lowest-energy triplet state (T1) is located at ca. 1.7 eV, and is associated with unpaired electrons in a π–π* state. A higher lying triplet π–π* (T2) state at around 2.5 eV is very close in energy to the S1 state (2.6 eV). We might expect that any S1 to T2 intersystem crossing, despite the small energy gap, to be slow since the transition is both spin and orbitally forbidden (El Sayed's Rule10). Intersystem crossing S1 to T1 is also likely to be slow based on a similar argument and the large energy gap. Of course, the T2 to T1 transition is both spin and orbitally allowed which might presuppose fast interconversion, but it is noted that considerable energy must be dissipated during the process. Given the probable small reorganisation that would accompany the transition, the rate for such a non-radiative process might be actually slower than expected (energy gap law11).
Focussing on the N-phenyl as a conceivable rotor subunit within the structure, potential energy calculations using Gaussian 099 (B3LYP, 6-311G+(d)) were performed on the gas-phase ground-state structure as the phenyl group was rotated through 360° (Fig. 4). The phenyl unit becomes more aligned with the phenazinone-like ring as the dihedral angle approaches zero, which causes the group to bow and lose planarity (see ESI†).12 In an extreme conformation the nitrogen atom at the N-phenyl takes on more of a pyramidal feature. The energy barrier to full rotation of ca. 29 kcal mol−1 (121 kJ mol−1) is substantial and on par with hindered rotation of the phenyl group in methaqualone and mecloqualone.13 Complementary TD-DFT potential energy calculations performed on the first excited-state structure reveal that the barrier to rotation is still significant (ca. 34 kcal mol−1). Based on these calculations no so-termed molecular rotor effect14 would be expected, such that viscosity of the surrounding medium should not affect localised fluorescence to any great extent.
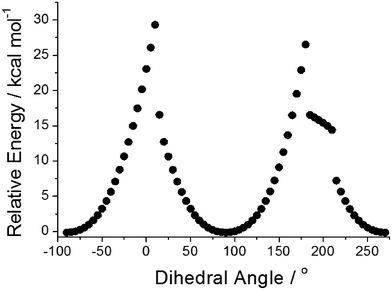 | ||
| Fig. 4 Relative energies of PBP in the ground state versus the dihedral angle at the N-phenyl subunit. Each point represents a change in angle of 5°. | ||
Electrochemistry
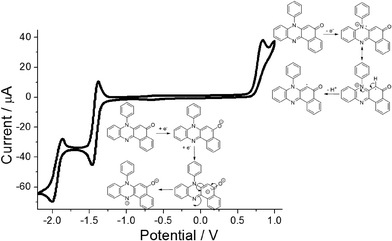
Cyclic voltammetry performed on PBP in dry N2-purged MeCN (0.2 M TBATFB background electrolyte) revealed a straightforward redox chemistry in both the oxidation and reduction segments of the voltammogram (Fig. 5). Scanning to oxidative potentials produced an irreversible wave located at E1 = +0.83 vs. Fc+/Fc which is taken to be removal of an electron from the HOMO. The irreversibility of the wave is correlated to breakdown of the cation radical, possibly the result of deprotonation at the aromatic ring and then dimerization or solvent addition. Upon reductive scanning a reversible wave was seen at E2 = −1.43 V (ΔE = 60 mV) vs. Fc+/Fc which corresponds to radical anion formation at the carbonyl group. Further scanning produced a quasi-reversible wave at E3 = −1.94 V (ΔE = 130 mV) vs. Fc+/Fc and is associated with dianion formation. The major peak separation E2–E3 of ca. 0.5 V likely arises from the unfavourable electrostatic repulsion created by addition of an electron to the anion radical, since protons are lacking in the dry solvent to neutralise the charge. The energy gap E1–E2 of ca. 2.2 eV is considerably smaller than the DFT calculated HOMO–LUMO energy gap (3.05 eV) which is not uncommon, and similar findings were reported previously for other unrelated molecular systems.15Spectroscopic studies
The representative electronic absorption spectrum for PBP in MeCN is illustrated in Fig. 6. The lowest energy absorption envelope is partly structured comprising of two clear peaks located at 475 nm, 498 nm and a partial shoulder at ca. 527 nm. There is also sign of an additional shoulder at the short wavelength side of the absorption band. The deconvoluted absorption envelope using five constant half-width Gaussian profiles (fwhm = 1317 cm−1) locates this high energy band at 440 nm (see ESI†). The molar absorption coefficient (εmax) measured at 498 nm is 13![[thin space (1/6-em)]](https://www.rsc.org/images/entities/char_2009.gif) 000 mol−1 dm3 cm−1 corresponding to an oscillator strength (f) of 0.17. It is worth noting that DFT calculations suggest the absorption profile comprises primarily of a π–π* electronic transition. Below 400 nm the absorption profile is dominated by two sharp peaks located at 309 nm and 255 nm. Absorption spectra recorded for PBP in solvents of various polarity and polarizability were essentially similar in appearance and only minor changes (ca. 6 nm) were observed in peak maxima; the overall effect was satisfactorily predicted from the TD-DFT calculations.
000 mol−1 dm3 cm−1 corresponding to an oscillator strength (f) of 0.17. It is worth noting that DFT calculations suggest the absorption profile comprises primarily of a π–π* electronic transition. Below 400 nm the absorption profile is dominated by two sharp peaks located at 309 nm and 255 nm. Absorption spectra recorded for PBP in solvents of various polarity and polarizability were essentially similar in appearance and only minor changes (ca. 6 nm) were observed in peak maxima; the overall effect was satisfactorily predicted from the TD-DFT calculations.
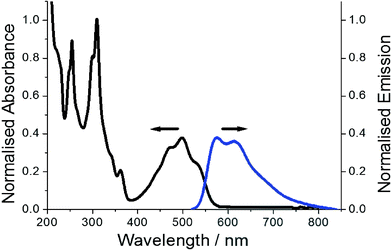 | ||
| Fig. 6 Normalised absorption profile (black) for PBP and fluorescence spectrum (blue) in dilute MeCN. Excitation wavelength = 490 nm. | ||
Red emission from a dilute MeCN solution of PBP is evident even by eye upon UV excitation. The collected excitation independent low-energy fluorescence spectrum does not mirror perfectly the absorption profile, but it is partially structured with peaks located at 575 nm and 613 nm (Fig. 6). A broad tail to the emission stretches to around 800 nm. The crossing point of the normalised absorption and fluorescence spectra is located at 548 nm (2.26 eV). The Stokes’ shift (SS) of 2689 cm−1, calculated from the difference between the absorption and fluorescence maxima, does suggest that there is displacement along the reaction coordinate for the ground- and excited-state potential energy surfaces. The partial structured nature of the absorption spectrum is consistent with Berlman's protocol16 that the ground state is planar. DFT calculations suggest that alterations in bond-lengths within the phenazinone-like molecular framework occur upon formation of the first-excited state but it essentially remains planar. The partial structured nature of the emission profile is consistent with this notion, but the major reorganisation is likely related to rocking of the N-phenyl group. This latter idea was supported by a variable low-temperature study in EtOH in which fluorescence spectra were recorded from 290 K to 80 K. Between 290 K and 160 K where the EtOH remained fluidic the ϕFLU steadily increased and was analysed in terms of the Arrhenius equation (see ESI†). The small ΔE of only 3 kJ mol−1 supports a weakly activated process consistent with libration of the phenyl group. It is also noted that at the glass transition temperature of EtOH (ca. 100 K) the ϕFLU increased significantly as molecular motions were curtailed in the solid glass. In addition, the SS at 80 K reduced significantly to 428 cm−1.
Fluorescence excitation spectra recorded at disparate emission wavelengths are an acceptable match to the absorption profile. The fluorescence quantum yield (ϕFLU) of 0.12 is rather modest, and fluorescence decays were strictly mono-exponential at all monitoring wavelengths to afford a singlet lifetime (τS) of 3.0 ns. The radiative decay constant (kRAD) calculated using the Strickler–Berg expression17 of 1.1 × 10⁸ s−1 is considerably larger (ca. 3 fold) than the measured value of 4 × 10⁷ s−1 (kRAD = ϕFLU/τS). Such a disparity is not too surprising considering the assumption of a small structural alteration in the Strickler–Berg model and the displaced potential energy surfaces for PBP. Non radiative decay is clearly dominant in deactivation of the first-excited singlet state, the measured non-radiative decay constant (kNR = 1/τS − kRAD) is 2.9 × 10⁸ s−1.
In an attempt to try and shed more light onto the efficiency of intersystem crossing and the nature of the triplet states nanosecond flash photolysis experiments were performed. Excitation of a sample of PBP in N2-purged MeCN with a 10 ns laser pulse delivered at 532 nm produced clear ground-state bleaching at around 500 nm, and a weak transient profile centred at 800 nm (Fig. 7). A major problem was the rapid degradation of the sample after repetitive laser excitation shots. An acceptable fit to the transient signals at 800 nm to a single exponential was possible to afford a lifetime of 16 μs. A similar experiment performed with addition of a heavy atom perturber to the solution (10% EtI) did result in a slight signal enhancement to the long wavelength profile; the introduction of oxygen into the solution resulted in its complete removal of the signal. Based on these findings the long wavelength transient signal is assigned to the T1–Tn absorption spectrum.
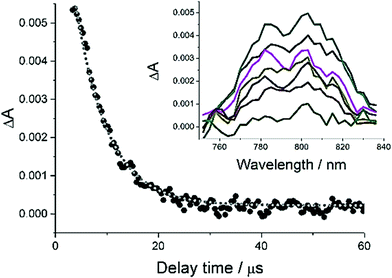 | ||
| Fig. 7 Transient spectra recorded at 800 nm after excitation of a sample of PBP in N2-purged MeCN with a 10 ns laser pulse delivered at 532 nm. | ||
Very weak partially structured phosphorescence was observed at around 12![[thin space (1/6-em)]](https://www.rsc.org/images/entities/char_2009.gif) 790 cm−1 (1.6 eV) from an ethanol glass containing PBP at 80 K (see ESI†). The calculated energy of the triplet (ca. 1.7 eV) is remarkably similar to this value but some caution is noted: the phosphorescence spectrum shape was not dependable over several runs and the measured intensity was very low. The difficulty in collecting a clear phosphorescence spectrum is consistent with poor intersystem crossing.18
790 cm−1 (1.6 eV) from an ethanol glass containing PBP at 80 K (see ESI†). The calculated energy of the triplet (ca. 1.7 eV) is remarkably similar to this value but some caution is noted: the phosphorescence spectrum shape was not dependable over several runs and the measured intensity was very low. The difficulty in collecting a clear phosphorescence spectrum is consistent with poor intersystem crossing.18
Fluorescence measurements in various solvents
No distinct dependence of ϕFLU with solvent viscosity was anticipated as established by the phenyl rotation computational calculations and predictions. The envisaged modest change in the dipole moment upon the ground-state to first-excited state transition also hinted at limited dependency of the Stokes’ shift (SS) with solvent polarity. Hence, fluorescence spectra were recorded in a small range of alkanol and aprotic solvents and the results are collected in Table 2. Given the presence of a carbonyl group within PBP intermolecular hydrogen bonding was likely to be integrated into any overall solvent effect in the alkanol series. The change in solvent from methanol to pentan-1-ol is accompanied by a modest increase in ϕFLU, but essentially values plateau across the series. Analysis of the alterations in ϕFLU in terms of the Förster–Hoffmann19 equation produced an adequate linear relationship (see ESI†), but the modest slope (α = 0.13) suggests a weak viscosity dependency as predicted. Presumably the rocking back and forth of the phenyl subunit and the distortion it causes in the phenazinone, coupled to solvent hydrogen bonding to the carbonyl is just sufficient to produce the effect.20 The variation of ϕFLU within the solvent series is also worth noting in terms of the dielectric constant (ε) (see ESI†). The high ϕFLU are generally associated with the low polarity solvents. A focus on the linear alkanols again demonstrates that the ϕFLU reaches a limiting value of ca. 11%. The destabilisation of the excited state in the low polarity alkanols is presumably sufficient to reduce the rate of non-radiative decay in line with the energy-gap law.11 An interesting result is seen for the diol ethylene glycol which is highly viscous with a concomitant high ε, but PBP has a low ϕFLU in the solvent. The potential hydrogen-bonding viscosity enhancement is suppressed by a polarity effect. The highest ϕFLU observed in toluene can be attributed to two factors; namely, the low polarity of the solvent and high refractive index since kRAD ∝ n2 (Strickler–Berg equation).17| Solvent | ε | n | η (cP) |
λ
MAX![[thin space (1/6-em)]](https://www.rsc.org/images/entities/char_2009.gif) d (cm−1) d (cm−1) |
λ
FLU![[thin space (1/6-em)]](https://www.rsc.org/images/entities/char_2009.gif) e (cm−1) e (cm−1) |
SS (cm−1) | ϕ FLU |
|---|---|---|---|---|---|---|---|
| a Dielectric constant (ref. 23). b Refractive index. c Bulk solvent viscosity. d Absorption wavelength maximum. e Corrected fluorescence wavelength maximum. f Dichloromethane. g Tetrahydrofuran. h Ethyl acetate. | |||||||
| MeOH | 32.6 | 1.327 | 0.54 | 19![[thin space (1/6-em)]](https://www.rsc.org/images/entities/char_2009.gif) 960 960 |
17![[thin space (1/6-em)]](https://www.rsc.org/images/entities/char_2009.gif) 422 422 |
2538 | 0.070 |
| EtOH | 24.6 | 1.360 | 0.69 | 19![[thin space (1/6-em)]](https://www.rsc.org/images/entities/char_2009.gif) 920 920 |
17![[thin space (1/6-em)]](https://www.rsc.org/images/entities/char_2009.gif) 668 668 |
2252 | 0.094 |
| Propan-1-ol | 20.5 | 1.384 | 1.95 | 19![[thin space (1/6-em)]](https://www.rsc.org/images/entities/char_2009.gif) 960 960 |
17![[thin space (1/6-em)]](https://www.rsc.org/images/entities/char_2009.gif) 606 606 |
2354 | 0.105 |
| Butan-1-ol | 17.5 | 1.397 | 2.54 | 20![[thin space (1/6-em)]](https://www.rsc.org/images/entities/char_2009.gif) 000 000 |
17![[thin space (1/6-em)]](https://www.rsc.org/images/entities/char_2009.gif) 637 637 |
2363 | 0.108 |
| Pentan-1-ol | 13.9 | 1.407 | 3.62 | 19![[thin space (1/6-em)]](https://www.rsc.org/images/entities/char_2009.gif) 920 920 |
17![[thin space (1/6-em)]](https://www.rsc.org/images/entities/char_2009.gif) 637 637 |
2283 | 0.113 |
| Hexan-1-ol | 13.3 | 1.414 | 4.58 | 19![[thin space (1/6-em)]](https://www.rsc.org/images/entities/char_2009.gif) 881 881 |
17![[thin space (1/6-em)]](https://www.rsc.org/images/entities/char_2009.gif) 699 699 |
2182 | 0.110 |
| Heptan-1-ol | 12.1 | 1.424 | 5.81 | 19![[thin space (1/6-em)]](https://www.rsc.org/images/entities/char_2009.gif) 920 920 |
17![[thin space (1/6-em)]](https://www.rsc.org/images/entities/char_2009.gif) 668 668 |
2252 | 0.110 |
| Octan-1-ol | 10.3 | 1.429 | 7.29 | 19![[thin space (1/6-em)]](https://www.rsc.org/images/entities/char_2009.gif) 920 920 |
17![[thin space (1/6-em)]](https://www.rsc.org/images/entities/char_2009.gif) 730 730 |
2190 | 0.113 |
| Nonan-1-ol | 8.83 | 1.433 | 8.97 | 19![[thin space (1/6-em)]](https://www.rsc.org/images/entities/char_2009.gif) 881 881 |
17![[thin space (1/6-em)]](https://www.rsc.org/images/entities/char_2009.gif) 762 762 |
2119 | 0.124 |
| Decan-1-ol | 7.2 | 1.435 | 12.0 | 19![[thin space (1/6-em)]](https://www.rsc.org/images/entities/char_2009.gif) 881 881 |
17![[thin space (1/6-em)]](https://www.rsc.org/images/entities/char_2009.gif) 762 762 |
2119 | 0.110 |
| Ethylene glycol | 37.7 | 1.431 | 16.9 | 19![[thin space (1/6-em)]](https://www.rsc.org/images/entities/char_2009.gif) 841 841 |
17![[thin space (1/6-em)]](https://www.rsc.org/images/entities/char_2009.gif) 241 241 |
2600 | 0.064 |
| Toluene | 2.38 | 1.496 | 0.59 | 20![[thin space (1/6-em)]](https://www.rsc.org/images/entities/char_2009.gif) 000 000 |
17![[thin space (1/6-em)]](https://www.rsc.org/images/entities/char_2009.gif) 668 668 |
2332 | 0.160 |
| MeCN | 37.5 | 1.344 | 0.33 | 20![[thin space (1/6-em)]](https://www.rsc.org/images/entities/char_2009.gif) 080 080 |
17![[thin space (1/6-em)]](https://www.rsc.org/images/entities/char_2009.gif) 391 391 |
2689 | 0.120 |
| DCMf | 8.93 | 1.421 | 0.41 | 19![[thin space (1/6-em)]](https://www.rsc.org/images/entities/char_2009.gif) 841 841 |
17![[thin space (1/6-em)]](https://www.rsc.org/images/entities/char_2009.gif) 483 483 |
2358 | 0.126 |
| THFg | 7.58 | 1.405 | 0.48 | 19![[thin space (1/6-em)]](https://www.rsc.org/images/entities/char_2009.gif) 841 841 |
17![[thin space (1/6-em)]](https://www.rsc.org/images/entities/char_2009.gif) 606 606 |
2235 | 0.100 |
| EAh | 6.02 | 1.370 | 0.46 | 20![[thin space (1/6-em)]](https://www.rsc.org/images/entities/char_2009.gif) 000 000 |
17![[thin space (1/6-em)]](https://www.rsc.org/images/entities/char_2009.gif) 575 575 |
2425 | 0.090 |
| CHCl3 | 4.81 | 1.443 | 0.54 | 19![[thin space (1/6-em)]](https://www.rsc.org/images/entities/char_2009.gif) 920 920 |
17![[thin space (1/6-em)]](https://www.rsc.org/images/entities/char_2009.gif) 606 606 |
2314 | 0.144 |
| Et2O | 4.33 | 1.350 | 0.22 | 20![[thin space (1/6-em)]](https://www.rsc.org/images/entities/char_2009.gif) 040 040 |
17![[thin space (1/6-em)]](https://www.rsc.org/images/entities/char_2009.gif) 889 889 |
2151 | 0.113 |
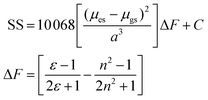
The change in the SS for the entire solvent series, as analysed using the Lippert–Mataga equation21 (eqn (2)), was limited, but again a focus on the alkanols provided a clear dependency with the solvent function (ΔF) as shown in Fig. 8. The difference in dipole moment of 8 ± 2 D using a = 5.8 Å is again indicative of only partial increased transfer of charge upon excitation.
 | (2) |
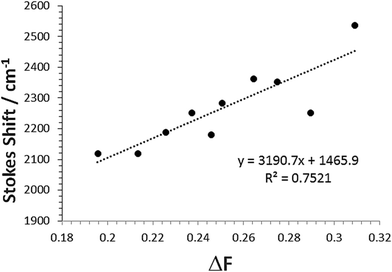 | ||
| Fig. 8 Relationship between Stokes shift (SS) and the solvent Pekar function ΔF for the linear mono-protic alkanol series. The linear equation and goodness-of-fit is shown in the insert. | ||
Here a (in Å) represents the radius of the spherical cavity in which the molecule resides and is provided by a solvent dielectric continuum, and the difference between the ground and excited state dipole moments (μes − μgs) is in Debye.22
Conclusions
Using a one-pot reaction it is straightforward to prepare multi-gram quantities of the red fluorescent dye 7-phenylbenzo[a]phenazine-5(7H)-one. The interaction of mono-protic hydrogen bonding solvents at the carbonyl group coupled to rocking of the N-phenyl group is important in influencing the level of fluorescence from the dye. However, the small increase in the ϕFLU for a ca. 20-fold increase in solvent viscosity rules out the usefulness of the dye as a fluorescent rheology probe. There appears no clear way to drastically enhance the fluorescence viscosity response since there is also a prominent polarity effect which can dominate in solvents with a low dielectric constant. The dye does however contain several sites for further functionalisation or modification which could perturb the excited state properties in a positive manner. Preliminary findings have shown that nucleophiles add adjacent to the N-phenyl group in a reaction similar to Michael addition to an α,β unsaturated ketone. New molecular systems are in development based on this finding, especially chiral dimers that facilitate exciton coupling and exhibit polarised luminescence. Considering the N-phenyl group in PBP does play a pivotal role in excited state deactivation its removal may also have a positive effect.Experimental
1H and 13C NMR spectra were recorded on a Bruker 700 MHz spectrometer. FT-IR spectrum was recorded on a PerkinElmer FT-IR Spectrum Two spectrometer. Absorption spectra were obtained using a Shimadzu UV-1800 spectrophotometer. Corrected emission and excitation spectra were obtained using a Shimadzu RF-6000 spectrofluorophotometer. The spectra were not corrected again to take into account that bandpass in wavenumbers is not constant when the spectrum is recorded in constant wavelength resolution by using I(ṽ) = λ2I(λ). Quantum yields were calculated using Rhodamine 6G (ϕFLU = 0.95 EtOH)24 as a standard and by the comparison method, and the fluorescence lifetime was measured using a PTI EasyLife apparatus. Nanosecond flash photolysis experiments were carried out using an Applied Photophysics LKS50 instrument.Crystal structure data for PBP were collected at 150 K on a Xcalibur, Atlas, Gemini ultra-diffractometer equipped with a fine-focus sealed X-ray tube (λ CuKα = 1.54184 Å) and an Oxford Cryosystems CryostreamPlus open-flow N2 cooling device. Cell refinement, data collection and data reduction were undertaken via the software CrysAlisPro (Rigaku OD, 2015). An analytical numeric absorption correction was applied to the intensities using a multifaceted crystal model based on expressions derived by Clark & Reid.25 The structure was solved using ShelXT (Sheldrick, 2015)26 and refined by XL (Sheldrick, 2008).27 All non-hydrogen atoms were refined as anisotropic and hydrogen atoms were place with idealised geometry and Uiso set to 1.2 times that of the parent atom.
Computational calculations were performed using a 32-bit version of Gaussian09 on a quadruple-core Intel Xeon system with 4GB RAM. The calculations were run in parallel, fully utilising the multi-core processor. To reduce computational time low-level calculations were carried out to minimise structures using Hartree–Fock and a low basis set. Energy-minimised structures were then used to feed high-level density functional theory (DFT) calculations starting firstly with B3LYP and the 3-21G basis set. The complexity of the basis set was increased and results from calculations compared. The 6-311G+(d) basis set was deemed sufficient for comparison purposes. Calculations in a solvent medium were carried out using the integral equation formalism polarization continuum model (IEFPCM). Phenyl rotation calculations were performed in Gaussian 09 using DFT and the scan method with the relaxed potential energy surface option where geometry optimization at each step was carried out while maintaining the scanned variable constant. Excited-state calculations were performed using the time-dependent DFT method. Calculations during refinement were monitored using the program Molden and by visualising the geometrical convergence at each step.
Preparation of PBP
A 50 ml two-necked round-bottom flask was charged with 2-hydroxy-1,4-naphthoquinone (3.48 g, 20 mmol,) and N-phenylene-o-phenylenediamine (3.69 g, 20 mmol,) which was then purged with nitrogen. N2-purged glacial acetic acid (100 ml) was added and the reaction mixture was stirred for 60 minutes at room temperature. The temperature was raised to 60 °C and then stirred for a further 60 minutes. The reaction mixture was left to cool and a TLC was taken (95![[thin space (1/6-em)]](https://www.rsc.org/images/entities/char_2009.gif) :
:![[thin space (1/6-em)]](https://www.rsc.org/images/entities/char_2009.gif) 5, DCM
5, DCM![[thin space (1/6-em)]](https://www.rsc.org/images/entities/char_2009.gif) :
:![[thin space (1/6-em)]](https://www.rsc.org/images/entities/char_2009.gif) methanol) to check the extent of the reaction. The mixture was then added to distilled water and the crimson red precipitate filtered through a Büchner funnel. The solid was washed with water to remove residual acetic acid followed by diethyl ether to remove the unreacted materials. The product was dried overnight under vacuum and by NMR spectroscopy was ca. 95% pure. The sample was purified by recrystallisation from ethanol and water to give a red microcrystalline solid. Yield: 3.7 g, 11.5 mmol, 58%. Mp 263–265 °C. FT-IR (cm−1) 749 (s), 776 (m), 830 (m), 856 (w), 949 (w), 1000 (w), 1030 (w), 1120 (w), 1131 (w), 1157 (w), 1244 (s), 1310 (s), 1355 (w), 1454 (w), 1473 (s), 1536 (s), 1587 (s), 1614 (w), 3063 (w). 1H NMR (CDCl3, 700 MHz) δ 8.99 (dd, 1H, J = 7.8 Hz, J = 1.1 Hz), 8.37 (dd, 1H, J = 7.6 Hz, J = 1.2 Hz), 8.05–8.08 (m, 1H), 7.76–7.82 (m, 2H), 7.72 (tt, 2H, J = 7.8 Hz, J = 1.9 Hz), 7.65 (tt, 1H, J = 7.6 Hz, J = 1.3 Hz), 7.37–7.40 (m, 2H), 7.33–7.35 (m, 2H), 6.67–6.70 (m, 1H), 5.61 (s, 1H). 13C NMR (CDCl3, 176 MHz) δ 182.0, 147.4, 140.9, 137.0, 134.8, 133.1, 132.8, 131.9, 131.7, 131.5, 131.1, 131.0, 130.6, 130.4, 128.5, 125.6, 125.1, 124.1, 115.3, 101.1. HRMS nanoESI m/z calculated for C22H15N2O 323.1179, found 323.1184 [M + H]+.
methanol) to check the extent of the reaction. The mixture was then added to distilled water and the crimson red precipitate filtered through a Büchner funnel. The solid was washed with water to remove residual acetic acid followed by diethyl ether to remove the unreacted materials. The product was dried overnight under vacuum and by NMR spectroscopy was ca. 95% pure. The sample was purified by recrystallisation from ethanol and water to give a red microcrystalline solid. Yield: 3.7 g, 11.5 mmol, 58%. Mp 263–265 °C. FT-IR (cm−1) 749 (s), 776 (m), 830 (m), 856 (w), 949 (w), 1000 (w), 1030 (w), 1120 (w), 1131 (w), 1157 (w), 1244 (s), 1310 (s), 1355 (w), 1454 (w), 1473 (s), 1536 (s), 1587 (s), 1614 (w), 3063 (w). 1H NMR (CDCl3, 700 MHz) δ 8.99 (dd, 1H, J = 7.8 Hz, J = 1.1 Hz), 8.37 (dd, 1H, J = 7.6 Hz, J = 1.2 Hz), 8.05–8.08 (m, 1H), 7.76–7.82 (m, 2H), 7.72 (tt, 2H, J = 7.8 Hz, J = 1.9 Hz), 7.65 (tt, 1H, J = 7.6 Hz, J = 1.3 Hz), 7.37–7.40 (m, 2H), 7.33–7.35 (m, 2H), 6.67–6.70 (m, 1H), 5.61 (s, 1H). 13C NMR (CDCl3, 176 MHz) δ 182.0, 147.4, 140.9, 137.0, 134.8, 133.1, 132.8, 131.9, 131.7, 131.5, 131.1, 131.0, 130.6, 130.4, 128.5, 125.6, 125.1, 124.1, 115.3, 101.1. HRMS nanoESI m/z calculated for C22H15N2O 323.1179, found 323.1184 [M + H]+.
Conflicts of interest
There are no conflicts to declare.Acknowledgements
We thank the EPSRC sponsored mass spectrometry service at Swansea for collecting mass spectra and Newcastle University for financial support. Dr Joshua Karlsson is thanked for help in the nanosecond flash photolysis experiments.References
- S. Hayashi, T. Takamatsu and S. Fujita, Cytofluorometric nuclear-DNA determinations on the atrioventricular nodel cells in human hearts, Histochemistry, 1986, 85, 111 CAS.
- L. Michaelis, Rosinduline as oxidation-reduction indicator, J. Biol. Chem., 1931, 91, 369 CAS.
- S. Abbasi, H. Barzegaramiri and A. Farmany, Determination of trace amounts of silver(I) in the presence of an activator with a kinetic method, Rare Met., 2014, 33, 731 CrossRef CAS; H.-Y. Wang, Special analysis of dissolved copper in wastewater with azocarmine B by light absorption ratio variation combined with continuous analysis, J. Chin. Chem. Soc., 2008, 55, 1338 CrossRef.
- O. Fischer and E. Hepp, The induline group, Liebigs Ann. Chem., 1891, 262, 237 CrossRef.
- T. Xu, Y. Liu, F. Ge and Y. Ouyang, Application of surface methodology for optimization of azocarmine B removal by photo-Fenton process using hydroxyl-iron-aluminium bentonite, Appl. Surf. Sci., 2013, 280, 926 CrossRef CAS.
- T. Xu, Y. Liu, F. Ge and Y. Ouyang, Simulated solar light photooxidation of azocarmine B over hydroxyl iron-aluminium pillared bentonite, Appl. Clay Sci., 2014, 100, 35 CrossRef CAS.
- G. Dormán, H. Nakamura, A. Pulsipher and G. D. Prestwich, The life of pi-star: Exploring the exciting and forbidden worlds of the benzophenone photophore, Chem. Rev., 2016, 116, 15284 CrossRef PubMed.
- G. Dormán and G. D. Prestwich, Benzophenone photophores in biochemistry, Biochemistry, 1994, 33, 5661 CrossRef.
- M. J. Frisch, G. W. Trucks, H. B. Schlegel, G. E. Scuseria, M. A. Robb, J. R. Cheeseman, G. Scalmani, V. Barone, B. Mennucci, G. A. Petersson, H. Nakatsuji, M. Caricato, X. Li, H. P. Hratchian, A. F. Izmaylov, J. Bloino, G. Zheng, J. L. Sonnenberg, M. Hada, M. Ehara, K. Toyota, R. Fukuda, J. Hasegawa, M. Ishida, T. Nakajima, Y. Honda, O. Kitao, H. Nakai, T. Vreven, J. A. Montgomery, Jr., J. E. Peralta, F. Ogliaro, M. Bearpark, J. J. Heyd, E. Brothers, K. N. Kudin, V. N. Staroverov, T. Keith, R. Kobayashi, J. Normand, K. Raghavachari, A. Rendell, J. C. Burant, S. S. Iyengar, J. Tomasi, M. Cossi, N. Rega, J. M. Millam, M. Klene, J. E. Knox, J. B. Cross, V. Bakken, C. Adamo, J. Jaramillo, R. Gomperts, R. E. Stratmann, O. Yazyev, A. J. Austin, R. Cammi, C. Pomelli, J. W. Ochterski, R. L. Martin, K. Morokuma, V. G. Zakrzewski, G. A. Voth, P. Salvador, J. J. Dannenberg, S. Dapprich, A. D. Daniels, O. Farkas, J. B. Foresman, J. V. Ortiz, J. Cioslowski and D. J. Fox, Gaussian 09, Revision D.01, Gaussian, Inc., Wallingford CT, 2013 Search PubMed.
- M. A. El-Sayed, Triplet state. Its radiative and non radiative properties, Acc. Chem. Res., 1968, 1, 8 CrossRef CAS.
- R. Englman and J. Jortner, Energy gap law for radiationless transitions in large molecules, Mol. Phys., 1970, 18, 145 CrossRef CAS.
- The hysteresis and shoulder seen in the figure may be explained by the fact that at the point where the N-phenyl group adopts a pyramidal geometry it can point up or down. The bowing of the structure need not be identical for the two cases leading to a loss of mirror symmetry between the two conformations. Semi-empirical calculations (AM1) performed on the ground- and excited-state structures showed the same effect albeit with slightly different energies to the rotation barriers (see ESI†). The barrier to rotation in the excited state was still around 5 kcal mol−1 larger than in the ground state and identical to the value from the DFT calculations. There are limitations to the method of using a single-coordinate in driving the energy minimization at each step change. The energy minimized structure may get trapped in a valley on the potential energy surface and not be able to “slip” to another structure. It is noted that the shoulder observed is not reproduced in a simple MM+ calculation, but the barrier to rotation is still significant (24 kcal mol−1).
- E. Azanli, R. Rothchild and A.-M. Sapse, Ab-initio studies of hindered aryl rotations of methaqualone, mecloqualone and 3-(2,6-difluorophenyl)-2-methyl-4(3H)-quinazolinone, Spectrosc. Lett., 2002, 35, 257 CrossRef CAS.
- R. A. Loutfy and B. A. Arnold, Effect of viscosity and temperature on torsional relaxation of molecular rotors, J. Phys. Chem., 1982, 86, 4205 CrossRef CAS.
- J. Conradie, A frontier orbital energy approach to redox potentials, J. Phys.: Conf. Ser., 2015, 633, 012045 CrossRef.
- I. B. Berlman, On an empirical correlation between nuclear conformation and certain fluorescence and absorption characteristics of aromatic compounds, J. Phys. Chem., 1970, 74, 3085 CrossRef CAS.
- S. J. Strickler and R. A. Berg, Relationship between absorption intensity and fluorescence lifetime of molecules, J. Chem. Phys., 1962, 37, 814 CrossRef CAS.
- At 80 K in EtOH the ϕFLU is ca. 60% meaning the quantum yield of intersystem crossing (ϕISC) plus the quantum yield for internal conversion (ϕIC) is about 40%. From comparison of the fluorescence area to the phosphorescence area at 80 K the ϕISC is only at best 1%.
- T. Förster and G. Hoffmann, Viscosity dependence of fluorescent quantum yields of some dye systems, Z. Phys. Chem., 1971, 75, 63 CrossRef.
- G. B. Dutt, Rotational dynamics of nondipolar probes in alkane-alkanol mixtures: Microscopic friction on hydrogen bonding and nonhydrogen bonding solute molecules, J. Chem. Phys., 2000, 113, 11154 CrossRef CAS.
- E. Z. Lippert, Dipolmoment und electronenstruktur von angeregten molekülen, Naturforscher, 1955, 10a, 541 Search PubMed; N. Mataga, Y. Kaifu and M. Koizumi, Solvent effects upon fluorescence spectra and the dipole moments of excited molecules, Bull. Chem. Soc. Jpn., 1956, 29, 465 CrossRef CAS.
- The equation is more commonly written containing several terms including Planck's constant (h), speed of light (c) and the permittivity of free space (ε0). The terms and corrections for the units are all collected in the 10
![[thin space (1/6-em)]](https://www.rsc.org/images/entities/char_2009.gif) 068 number for simplicity. The equation can also be rewritten as
068 number for simplicity. The equation can also be rewritten as  where m is the slope of the Lippert–Mataga plot (see ref. 21).
 - A. R. Maryott and E. R. Smith, Table of dielectric constants of pure liquids, U.S. Govt. Print. Off., 1951 Search PubMed.
- A. M. Brouwer, Standards of photoluminescence quantum yields in solution, Pure Appl. Chem., 2011, 83, 2213 CAS.
- R. C. Clark and J. S. Reid, The analytical calculation of absorption in multifaceted crystals, Acta Crystallogr., Sect. A: Found. Crystallogr., 1995, 51, 887 CrossRef.
- G. M. Sheldrick, SHELXT-integrated space-group and crystal structure determination, Acta Crystallogr., Sect. A: Found. Adv., 2015, 71, 3 CrossRef PubMed.
- G. M. Sheldrick, A short history of SHELX, Acta Crystallogr., Sect. A: Found. Crystallogr., 2008, 64, 112 CrossRef CAS PubMed.
Footnote |
| † Electronic supplementary information (ESI) available: Computational calculations, deconvoluted spectrum, crystal packing diagram, additional graphs and NMR spectra. CCDC 1852962. For ESI and crystallographic data in CIF or other electronic format see DOI: 10.1039/c8pp00279g |
| This journal is © The Royal Society of Chemistry and Owner Societies 2019 |

