
 Open Access Article
 This Open Access Article is licensed under a
 Creative Commons Attribution 3.0 Unported Licence
Substrate-led cholesterol extraction from supported lipid membranes†
Ethan J.
Miller
 ,
Kislon
Voïtchovsky
* and
Margarita
Staykova
*
,
Kislon
Voïtchovsky
* and
Margarita
Staykova
*
Department of Physics, Durham University, Durham, UK. E-mail: kislon.voitchovsky@durham.ac.uk; margarita.staykova@durham.ac.uk
First published on 22nd August 2018
Abstract
The lipid membrane is a principal building block in biology, technology and industry, where it often occurs supported by other hydrophilic structures. Interactions with the support can affect the physical behavior of the membrane from the local organization and diffusion of lipids and proteins, to phase transitions, and the local mechanical properties. In this study we show that supporting substrates textured with nanoscale hydrophilic and hydrophobic domains can modify the membrane's chemical composition by selectively extracting cholesterol molecules without affecting the remaining phospholipids. Using polydimethylsiloxane (PDMS) substrates with various degrees of plasma oxidation, we are able to trigger dramatic changes in the membrane morphology and biophysical properties, and relate them to the amount of extracted cholesterol. We also show that it is possible to control the cholesterol extraction through mechanical extension of the flexible PDMS support. Given the ubiquity of bio-substrates with textured surface properties and the wide use of PDMS we expect that our results will have implications not only in biological and chemical sciences but also in nanotechnologies such as organ on a chip technologies, biosensors, and stretchable bio-electronics.
Introduction
Lipid membranes are naturally coupled to various supporting structures. In biology, the cell membrane is attached to the actin cortex, the extracellular basal lamina or to a cell substrate, all of which strongly modify the membrane properties and function. The detailed molecular mechanism relating the overall membrane behaviour to the local contacts formed with the support are only just coming to light.1,2Artificial membrane systems, commonly used for biophysical characterization of the complex cell interface or as technological platforms are likewise often created on top of a substrate.3 The substrate increases the stability of the membrane, controls its location and interactions with the surroundings, and enables easy manipulation and characterization with experimental techniques such as optical, electrical and atomic force microscopy.4 In recent years, the utilization of more advanced substrates with tuneable chemistry, topography and mechanical properties5–7 has greatly helped to rationalize our understanding of the membrane–substrate coupling and its consequences on the properties and function of lipid membranes. For example, we are now able to analyse, reproduce and explain the anomalous diffusion of lipids and proteins observed in membranes coupled to substrates.8–11 Studies using topographical features and actin or glycan filament networks have shown that local topography and curvature can induce lipid sorting and phase separation.12–14
The current biophysical notion holds that the interaction between the membrane and its adjacent structures induces physical alterations in the membrane, such as changes in the membrane fluidity, tension, shape and molecular configuration. These physical changes activate subsequent biochemical cascades in cells that determine the resultant response and adaptation.
Here we show that modified polydimethylsiloxane (PDMS) substrates can not only affect the physical properties of the adjacent membrane but also modify the membrane lipid composition. This is highly significant because no specific chemical interactions are at play and the effect may hence be widespread across various membranes and substrates. PDMS is a popularly used membrane-supporting material given its biocompatibility and the ease with which its surface chemistry and topography can be modified.15–18 Additionally the elasticity of PDMS makes it an ideal candidate for mechanical studies of cells and artificial membranes,6,19,20 the development of organ on a chip devices,21 and flexible bio-electronics.22–24
Experimental
Substrate preparation
Cover glasses from (VWR) were sonicated in isopropanol (Sigma-Aldrich) and ultrapure water (18.2 MΩ, 0.5 ppm organics, Merck Millipore), and subsequently dried with nitrogen flow. The PDMS elastomer (Sylgard 184 Silicone Elastomer Kit; Dow Corning Corp.) was mixed with the curing agent in a 10![[thin space (1/6-em)]](https://www.rsc.org/images/entities/char_2009.gif) :1 ratio, degassed for 30 minutes and spin coated onto the cleaned glass slides at 500 RPM for 10 seconds, followed by 1000 RPM for 5 minutes. This produced a uniform coating of PDMS of around ∼100 μm thickness. The slides were then baked at 60 °C overnight, ensuring they were fully cured.20 The PDMS coated slides were then exposed to low-pressure air plasma, at a pressure of 1 mbar and power of 300 Watts (VacuLAB Plasma Treater, Tantec), for 3–4 seconds or 30 seconds. Depending on the length of plasma exposure the surface was partially plasma-oxidized (3–4 seconds exposure) or fully plasma-oxidized (30 seconds). For the imaging experiments, a custom made acrylic ring was attached to the PDMS with vacuum grease (High vacuum grease; Dow Corning Corp.). This created a circular chamber which held the aqueous solutions in place.
:1 ratio, degassed for 30 minutes and spin coated onto the cleaned glass slides at 500 RPM for 10 seconds, followed by 1000 RPM for 5 minutes. This produced a uniform coating of PDMS of around ∼100 μm thickness. The slides were then baked at 60 °C overnight, ensuring they were fully cured.20 The PDMS coated slides were then exposed to low-pressure air plasma, at a pressure of 1 mbar and power of 300 Watts (VacuLAB Plasma Treater, Tantec), for 3–4 seconds or 30 seconds. Depending on the length of plasma exposure the surface was partially plasma-oxidized (3–4 seconds exposure) or fully plasma-oxidized (30 seconds). For the imaging experiments, a custom made acrylic ring was attached to the PDMS with vacuum grease (High vacuum grease; Dow Corning Corp.). This created a circular chamber which held the aqueous solutions in place.
Bilayer formation
1,2-Dioleoyl-sn-glycero-3-phosphocholine (DOPC), 1,2-dipalmitoyl-sn-glycero-3-phosphocholine (DPPC), cholesterol and 1,2-dipalmitoyl-sn-glycero-3-phosphoethanolamine-N-(lissamine rhodamine B sulfonyl) (ammonium salt) (Rh-DPPE) were obtained from Avanti Polar Lipids. All lipid bilayers used in fluorescence imaging were doped with 0.1 mol% Rh-DPPE. Giant unilamellar vesicles were formed via electro-formation in 300 mM sucrose solution, using standard protocols.25–27 Around 0.5–2 μL of GUV solution was pipetted onto the PDMS substrate, previously wetted with 500 μL trizma buffer (10 mM trizma base, 150 mM NaCl, 2 mM CaCl2). Within two minutes, the vesicles fused to the PDMS substrates (both partially and fully oxidized) and formed membrane patches. The remaining unfused vesicles were gently washed away with 500 μL trizma buffer.Fluorescence imaging
Imaging of the supported lipid bilayers was performed with a ×20 or ×40 objectives on the Nikon Eclipse Ti-E inverted fluorescence microscope and recorded using an ANDOR camera Neo 5.5 sCMOS (Oxford Instruments).Fluorescence recovery after photobleaching (FRAP) measurements and analysis
The FRAP measurements were taken using a EZ-C1 Nikon confocal microscope (Nikon UK Limited). The recovery of a 10 × 10 μm bleach spot in a 500 × 500 μm patch was imaged. The recovery curves for DPPC:cholesterol bilayers on fully oxidized PDMS samples were analysed using the Image J plug-in simFRAP,28 which allowed us to extract the lateral lipid diffusivity. The experiment was repeated on 3 independent samples and an average lateral diffusivity with its corresponding error in the mean was quoted in the text. DPPC:cholesterol bilayers on partially-oxidized PDMS substrates showed a negligible fluorescent recovery, which was too small to extract meaningful information about the recovery time scales.
AFM tip functionalization
The tips were first bathed in acetone for 20 minutes then cleaned UV/ozone for 20 minutes before bathing them in ethanol solution containing 5 mM of either hexanethiol(C6H14S) or thiocholesterol (C27H46S). After 24 hours in the thiol solution the tips were removed and washed with ethanol and Milli-Q water before measurement. A newly functionalized tip was used for each experiment.Atomic force measurements and chemical force mapping
The surface characterization of the PDMS surface and the chemical force mapping measurements were taken with a Nanowizard ultra (JPK Systems), using gold-coated Olympus TR400PB tips (Olympus) with a nominal cantilever spring constant of 0.09 N m−1. All chemical force mapping measurements were performed in trizma buffer in contact mode. Each force map was created from 1024 force curves (32 × 32) over a 1 μm2 area. AFM images of the surface cracks following strain application were conducted on MFP-3D in tapping mode using lever 3 of the silicon nitride RC800PSA (Olympus), with a nominal cantilever spring constant of 0.76 N m−1. To mechanically strain the PDMS under AFM and obtain AFM images of the surface cracks, we used the NanoRack sample stretching stage (Asylum Research), designed to work in conjunction with the MFP-3D infinity.Contact angle measurements
5 μL droplets of Milli-Q water were deposited onto the plasma-oxidized PDMS substrates and their contact angles with the surface were imaged with Canon 1000D. All measurements were taken within 5 minutes of plasma exposure to reduce differences due to hydrophobic recovery of PDMS.29 Images were later analysed using ImageJ plug-in Dropsnake.30Stretching device
For the membrane strain experiments we use the same device as described in previous works.19,27 A microfluidic channel was made by sealing a PDMS mould to a glass. The inlet of the channel was connected to a machine driven syringe pump (Harvard PhD apparatus). A thin flexible sheet of PDMS, ∼25 μm thick, covered the circular outlet, of ∼1 mm diameter. A positive or negative pressure applied to the microfluidic channel via the syringe pump results in the stretching/compression of the PDMS sheet from a flat to hemispherical cap geometry or vice versa. In that way a biaxial stretch/compression was exerted onto the lipid patches deposited onto the PDMS sheet. A strain rate of ∼0.0005% s−1 was used for both expansion and compression of substrate. The substrate strain was quantified by tracking the displacement of selected PDMS surface features.Data analysis
Image analysis was performed using the open-source image processing package FIJI. The time series of epifluorescence images were converted into binary images via Otsu thresholding. The ImageJ plug-ins simFRAP28 and Dropsnake30 were used to analyse the FRAP measurements and the contact angle measurements, respectively. The change in patch area was measured using Fiji's Analyse Particles function. For the extraction of the parameters defined in our model, we used the curve fitting tool in the CFTOOL application in MATLAB.Results and discussion
Changes in lipid membranes supported on PDMS substrates
Supported lipid membrane patches offer a convenient system for studying membrane–substrate interactions because they allow for simultaneous microscopic observation of the in-plane membrane changes and for a quantitative analysis of the membrane surface area.31,32 The patches can be routinely formed by fusing giant unilamellar lipid vesicles to a substrate (see Methods for further details). The substrate must be hydrophilic enough to interact with the lipid headgroups, but the interaction is usually non-specific and mediated by the thin interstitial water layer. Here we use PDMS substrates hydrophilized by plasma oxidation. This approach creates a thin hydrophilic silica-like layer on the PDMS surface, chemically similar to glass.7,33Typical examples of lipid patches formed on hydrophilized PDMS are presented in Fig. 1. When the PDMS is fully hydrophilic, the membrane remains stable regardless of its cholesterol composition (Fig. 1a–c), in line with previous observations.19,27,34 This result is achieved with PDMS substrates plasma-oxidized for 30 seconds (Fig. S1†). In contrast, the same lipid membranes behave very differently when coupled to partially hydrophilic PDMS substrates, obtained following a short 3 seconds plasma exposure (Fig. S1†). Partially hydrophilic PDMS substrates stably support pure phospholipid membranes (Fig. 1d); however severe morphological changes are observed in cholesterol-containing membranes, such as shrinkage in area and formation of microscopic pores (Fig. 1e).
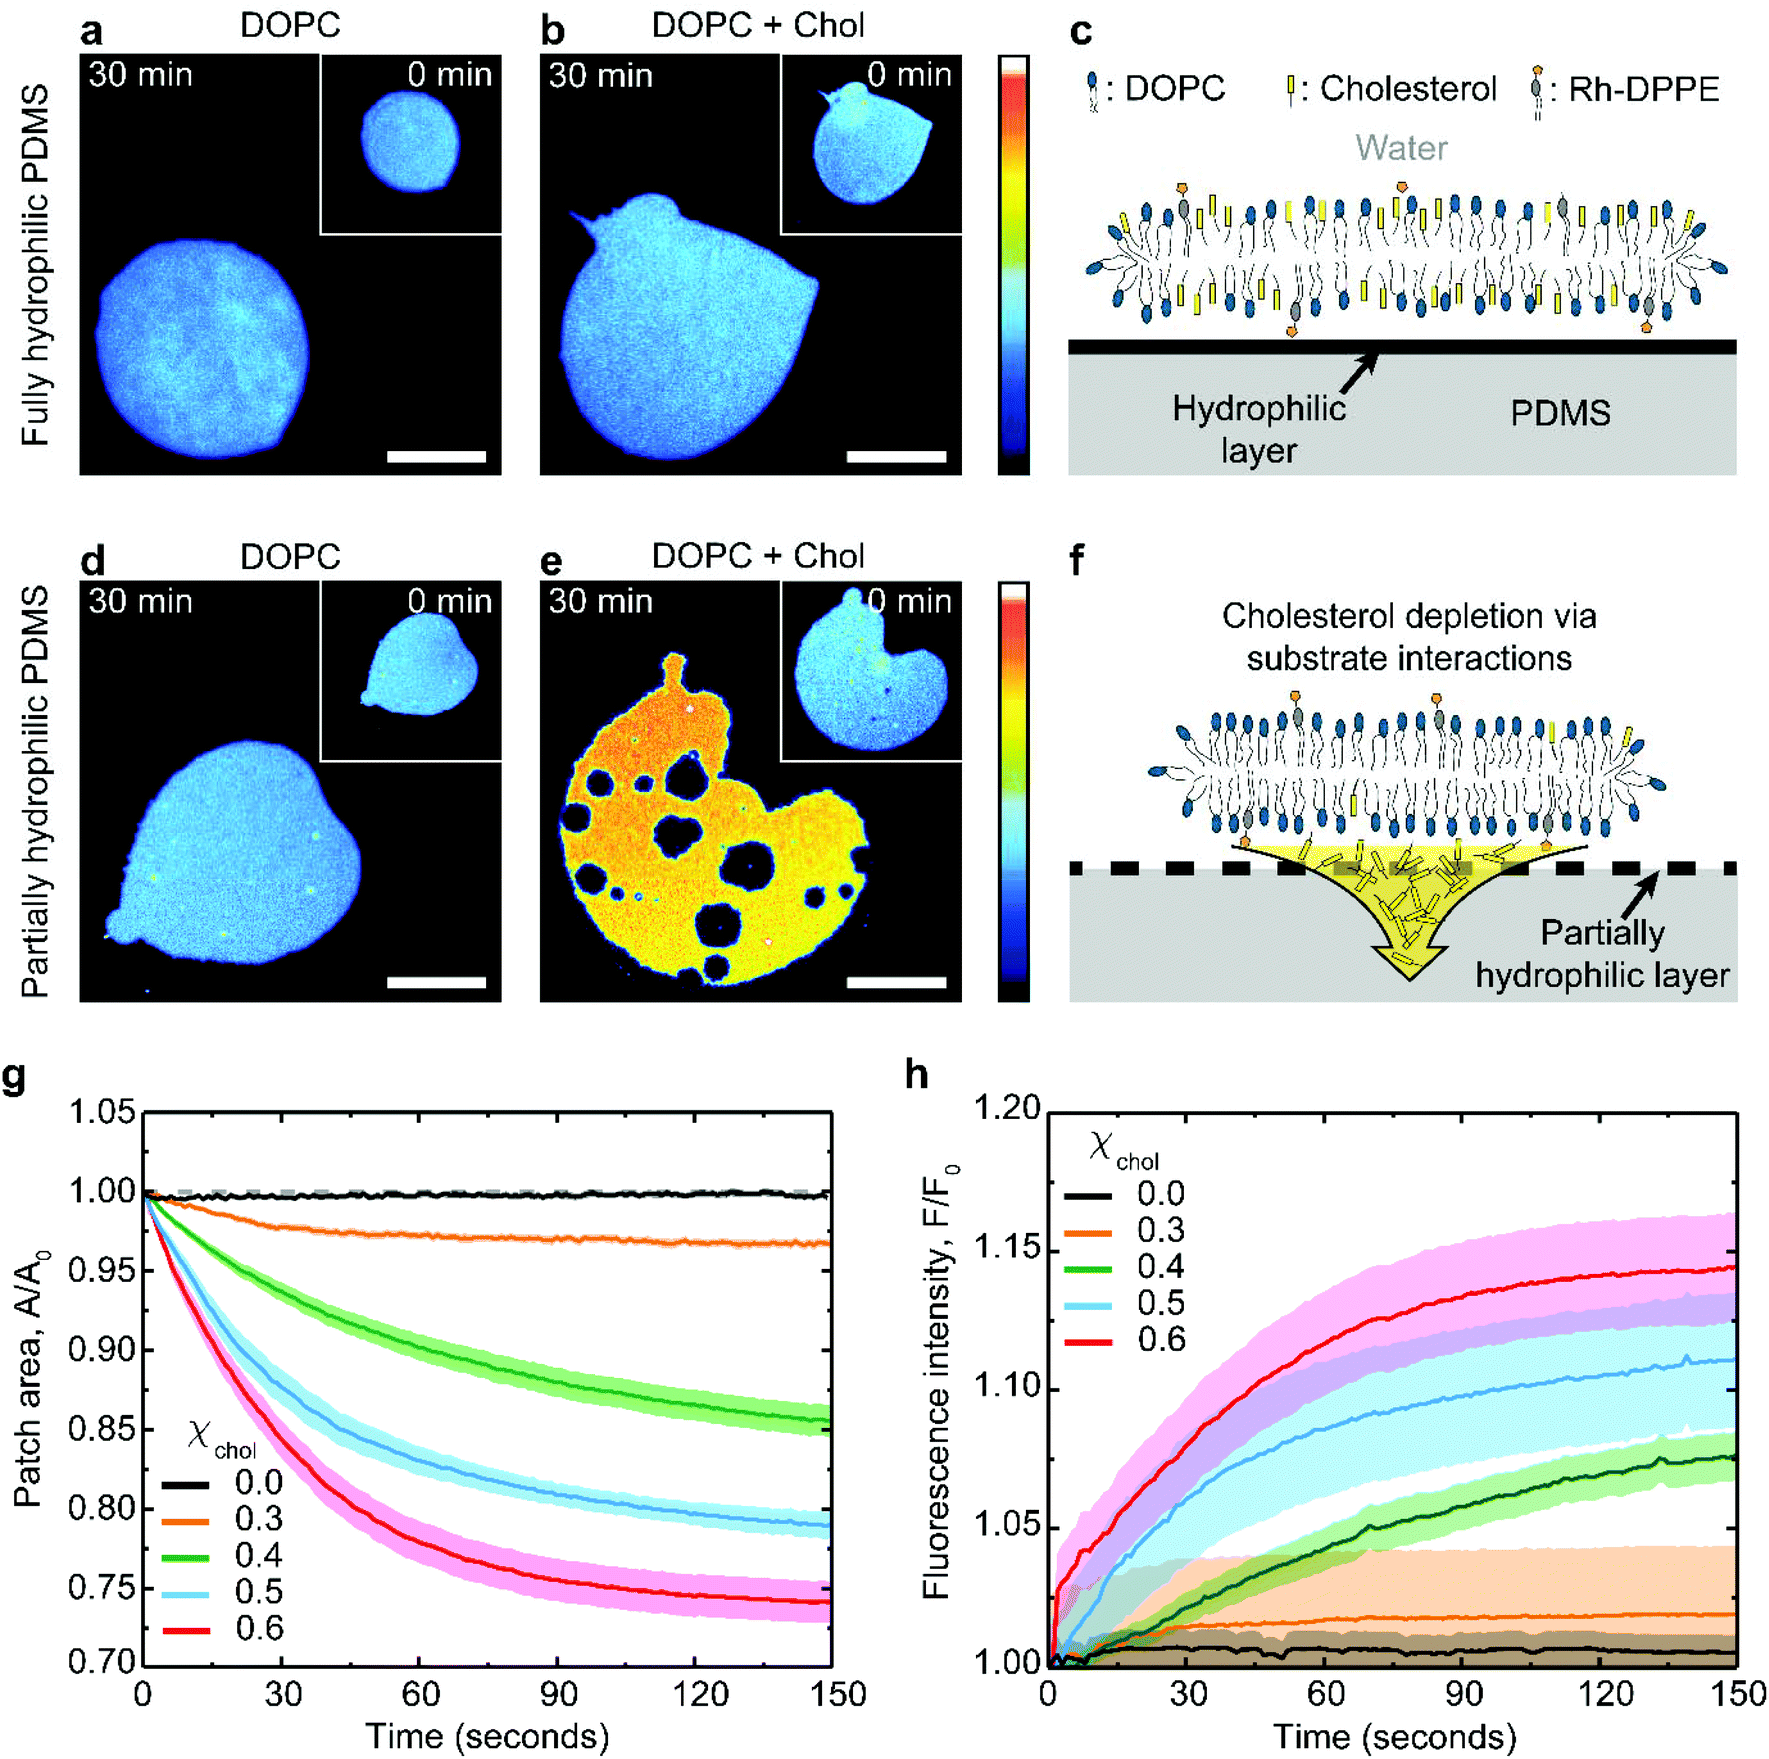 | ||
| Fig. 1 Substrate-induced changes in PDMS-supported lipid bilayers. Fluorescence images of lipid bilayer patches composed of (a) pure DOPC and (b) DOPC:cholesterol (40:60 mol%), supported on fully hydrophilic PDMS. (c) These patches are stably supported. On partially hydrophilic PDMS, (d) DOPC patches remain stable, but (e) DOPC:cholesterol (40:60 mol%) patches undergo changes, due to (f) extraction of cholesterol by the substrate. The scale bar is 50 μm in (a, b, d, e) and the patches are shown at 0 min (inset) and 30 min (main) after formation. The colour scale represents the fluorescence intensity (arbitrary units). Relative changes in (g) the surface area and (h) the fluorescence intensity of the lipid patches supported on partially oxidized PDMS substrate as a function of time, for selected cholesterol mole fractions, χchol = 0.6, 0.5, 0.4, 0.3 and 0.0. The data was statistical averaged from n = 20, 15, 15, 16, 26 different patches for cholesterol mole fractions, χchol = 0.6, 0.5, 0.4, 0.3, and 0.0 respectively, and the error boundaries in (e–f). | ||
The extent of the patch area loss is related to the cholesterol mole fraction in the membrane: bilayers containing 0.6 cholesterol mole fraction lose about 25% of their surface area after about 1 minute whereas only 3% loss is observed for membranes with 0.3 cholesterol mole fraction (Fig. 1g). The changes in the membrane lipid composition induced by the substrate can be independently verified by monitoring the relative increase in fluorescence intensity of the shrinking bilayer (Fig. 1h). This is consistent with the idea that membrane shrinking on partially oxidized PDMS is induced by specific depletion of the non-fluorescent cholesterol (Fig. 1e and f), thereby concentrating both the DOPC and the rhodamine-DPPE fluorescent label within the remaining bilayer. Consistently, fluorescently-labelled DOPC bilayers, either pure or cholesterol containing, remain unaffected on fully oxidized PDMS (Fig. 1a–c).
While our fluorescence results unequivocally indicate that partially hydrophilic PDMS is able to specifically deplete cholesterol from the adjacent lipid membrane, the molecular mechanism of this process are not obvious. For cholesterol extraction to take place via substrate contact, it must be shown that cholesterol–substrate interactions are at least as strong as the cohesive interactions between a cholesterol molecule and its surrounding lipids within the membrane.
Nanoscale characterization of PDMS substrates and PDMS–membrane interactions
In order to gain molecular-level insights into the extraction mechanism and test the hypothesis that partially oxidized PDMS is able to extract cholesterol from the supported lipid bilayer, we conducted single-molecule atomic force microscopy (AFM) and force spectroscopy measurements. We started with a nanoscale characterization of the relative hydrophilicity of the different PDMS substrates with ∼30 nm lateral resolution (Fig. 2a–c). To do so, we systematically measured the adhesion force between a hydrophobized hexanethiol-coated AFM tip and the substrate immersed in an aqueous solution (see Methods for further details). This strategy enables direct comparison between the lateral distributions of hydrophobic domains on the surface of fully (30 seconds) and partially (3 seconds) plasma-oxidized PDMS. | ||
| Fig. 2 Force spectroscopy measurements of PDMS–cholesterol interactions. Adhesion force maps using hydrophobic AFM tips on (a) fully and (b) partially plasma-oxidized PDMS reveal differences in hydrophobicity at the nanoscale. Each pixel represents ∼30 nm × 30 nm. (c) A histogram of the measured adhesion forces taken over n = 1024 curves (for each population) indicates means and standard deviation of 0.05 ± 0.04 nN for fully oxidized PDMS, 0.63 ± 0.23 nN for partially oxidized PDMS, and 2.00 ± 0.11 nN for native PDMS (Gaussian fitting). (d–i) Force spectroscopy of the forces required to extract single cholesterol molecules from DOPC bilayers. (d–f) Au-coated AFM tips bind specifically to the thiocholesterol in DOPC:thiocholesterol (40:60 mol%) bilayers supported on glass. (e) Typical extraction curve with multiple adhesion events (red arrows). (f) Resulting statistical histogram of measured extraction forces reveals distinct peaks (labelled 1–6), located at: F1 = 9 ± 6 pN, F2 = 30 ± 12 pN, F3 = 65 ± 8 pN, F4 = 87 ± 8 pN, F5 = 127 ± 17 pN, and F6 = 172 ± 17 pN (Gaussian fitting). (g–i) Au-coated AFM tips on DOPC:cholesterol (40:60 mol%) bilayers supported on glass. (h) Force curve reveals far fewer extraction events due to a lack of specific tip-cholesterol binding. (i) Histogram analysis of the data, shown in grey, shows a similar distribution to (f), replicated by the black curve for comparison. (j–l) Force spectroscopy on partially plasma-oxidized PDMS with thiocholesterol directly tethered to an Au-coated AFM tip. (k) Extraction curves exhibit multiple steps (blue arrows). (l) Statistical histogram of thiocholesterol extraction forces on PDMS shown in blue with (f) superimposed as a solid curve for comparison. Histograms (f, i, l) have been normalized so that their total area is 1. The extraction probability (fraction of curves exhibiting steps) is ∼0.3 for (d–f), and 0.03 for (g–i), each evaluated from n = 1000 curves selected randomly. In (a, b) the scalebar represents 250 nm and the colour bar 1 nN. | ||
A representative map acquired over fully oxidized PDMS (Fig. 2a) shows uniformly low adhesion forces across the sample. This is in line with reports of extended air plasma oxidation generating a thin, hydrophilic silica-like layer on the PDMS surface.35 In comparison, the adhesion force map acquired over partially oxidized PDMS exhibits a high degree of lateral heterogeneity across the surface (Fig. 2b), indicating a mixture of hydrophilic and hydrophobic nanoscale domains. The adhesion force on partially oxidized PDMS is on average higher than on fully oxidized PDMS (signifying a more hydrophobic surface), but there still exists regions with adhesion forces as low as ≤0.1 nN that correspond to strongly hydrophilic domains. The latter are absent from native PDMS (Fig. 2c). These results confirm that partially oxidized PDMS surfaces are hydrophilic enough to support lipid bilayers (unlike the native PDMS) but the existence of nanoscale hydrophobic domains may be responsible for the specific extraction of small hydrophobic molecules such as cholesterol.
To measure the force required for specific removal of single cholesterol molecules from lipid bilayers we conducted force spectroscopy measurements on DOPC lipid bilayers containing thiocholesterol. This cholesterol analogue possesses an exposed thiol group at one extremity, which is able to bind covalently to Au-coated AFM tips.36 As the tip retracts from the membrane, the tethered cholesterol molecule is extracted while simultaneously recording the associated forces (Fig. 2d). Generally multiple step-like events are present in the extraction curves (red arrows, Fig. 2e) due to multiple binding events and extraction of more than one cholesterol molecule from the bilayer. Statistical analysis (Fig. S2†) over a large number (>1000) of extraction curves reveals distinct extraction forces illustrated in a histogram (Fig. 2f). Immediate interpretation of the different force maxima is not obvious. However, complementary information can be obtained by repeating the experiment in different configurations: first by measuring the non-specific extraction of lipids from the membrane (Fig. 2g–i), and second the direct adhesion between cholesterol molecules and PDMS (Fig. 2j–l). Comparison of the results from the initial thiocholesterol force spectroscopy experiment with those from the complementary experiments reveals both similarities and differences between the prevalent extraction forces. The first force maximum (F1 = 9 ± 6 pN) and the third maximum (F3 = 65 ± 8 pN) are only observed in measurements carried out on fully formed DOPC bilayers (Fig. 2d–f and g–i). We interpret these maxima as characteristic extraction forces to remove cholesterol molecules from the DOPC membrane. We note that these values are also in agreement with previous reports using similar techniques.37 The F1 peak is the dominant event in the DOPC/thiocholesterol system (Fig. 2d–f), where the Au-coated AFM tip binds specifically to cholesterol. Hence, we interpret the small magnitude force at F1 as the force required to extract single cholesterol molecules. F1 is also visible in the DOPC:cholesterol system (Fig. 2g–i), where nonspecific binding occurs. However, the uncoated AFM tip in this system is, in principle, able to remove both cholesterol and DOPC molecules and the F3 maximum becomes the most common event observed, albeit with a much lower probability than when specific binding is present. The second maximum at F2 = 30 ± 12 pN is present in all three situations, being most pronounced in Fig. 2l, where the tethered thiocholesterol molecules directly adhere to the partially oxidized PDMS. A similar interpretation can be made for the maximum F6 = 172 ± 5 pN, but the relatively large force suggests that more lipid molecules are involved.
Taken together, the spectroscopy measurements demonstrate that the forces measured between single cholesterol molecules and silica (present on both glass and plasma-oxidized PDMS) are comparable to the cholesterol–lipid interactions within the bilayer. This hints to local hydrophobic interactions providing a molecular mechanism for substrate-induced cholesterol extraction. Significantly, we expect that only porous substrates will be able to mediate lipid extraction. Unlike dense glass, the porous interior of the PDMS can function as a sink for cholesterol, as previously shown for solutions containing small hydrophobic molecules.38
The existence of different force maxima and the dependence of the prevalent extraction force measured on the cholesterol environment further suggest an important role of the surrounding lipids in the overall membrane stability, and potentially in the extraction efficiency. We therefore quantitatively investigated the cholesterol extraction from DOPC bilayers containing different mole fractions of cholesterol using florescence microscopy.
Quantification of cholesterol extraction
Provided only cholesterol molecules are extracted from the bilayer (Fig. 1), it is possible to directly correlate the relative changes in the membrane surface area to the changes in the membrane cholesterol mole fraction. To do this, we adapted the model proposed by Litz et al.32 for cyclodextrin-mediated cholesterol extraction: the relative patch area Ar(t) = A(t)/A(t0) is related to the time-dependent cholesterol mole fraction, χchol(t), according to: | (1) |
| χchol(t) = χacc(t0)e−kt + χinacc | (2) |
Eqn (1) fits the experimental data on the changes of patch area remarkably well (Fig. S3†), yielding χacc, χinacc and k for each cholesterol mole fractions (Table S1†). Cholesterol extraction occurs fast, with a characteristic time varying between 25–30 seconds for the various membrane preparations (Fig. 3a). Interestingly the amount of extracted cholesterol does not increase monotonically with the initial mole fraction (Fig. 3b); the relative cholesterol loss is significantly lower for membranes with initial 30% cholesterol content. This is consistent with the widely accepted idea of a critical cholesterol mole fraction, below which cholesterol molecules are distributed differently among the surrounding lipids, consequently becoming less accessible for depletion.40,44,45
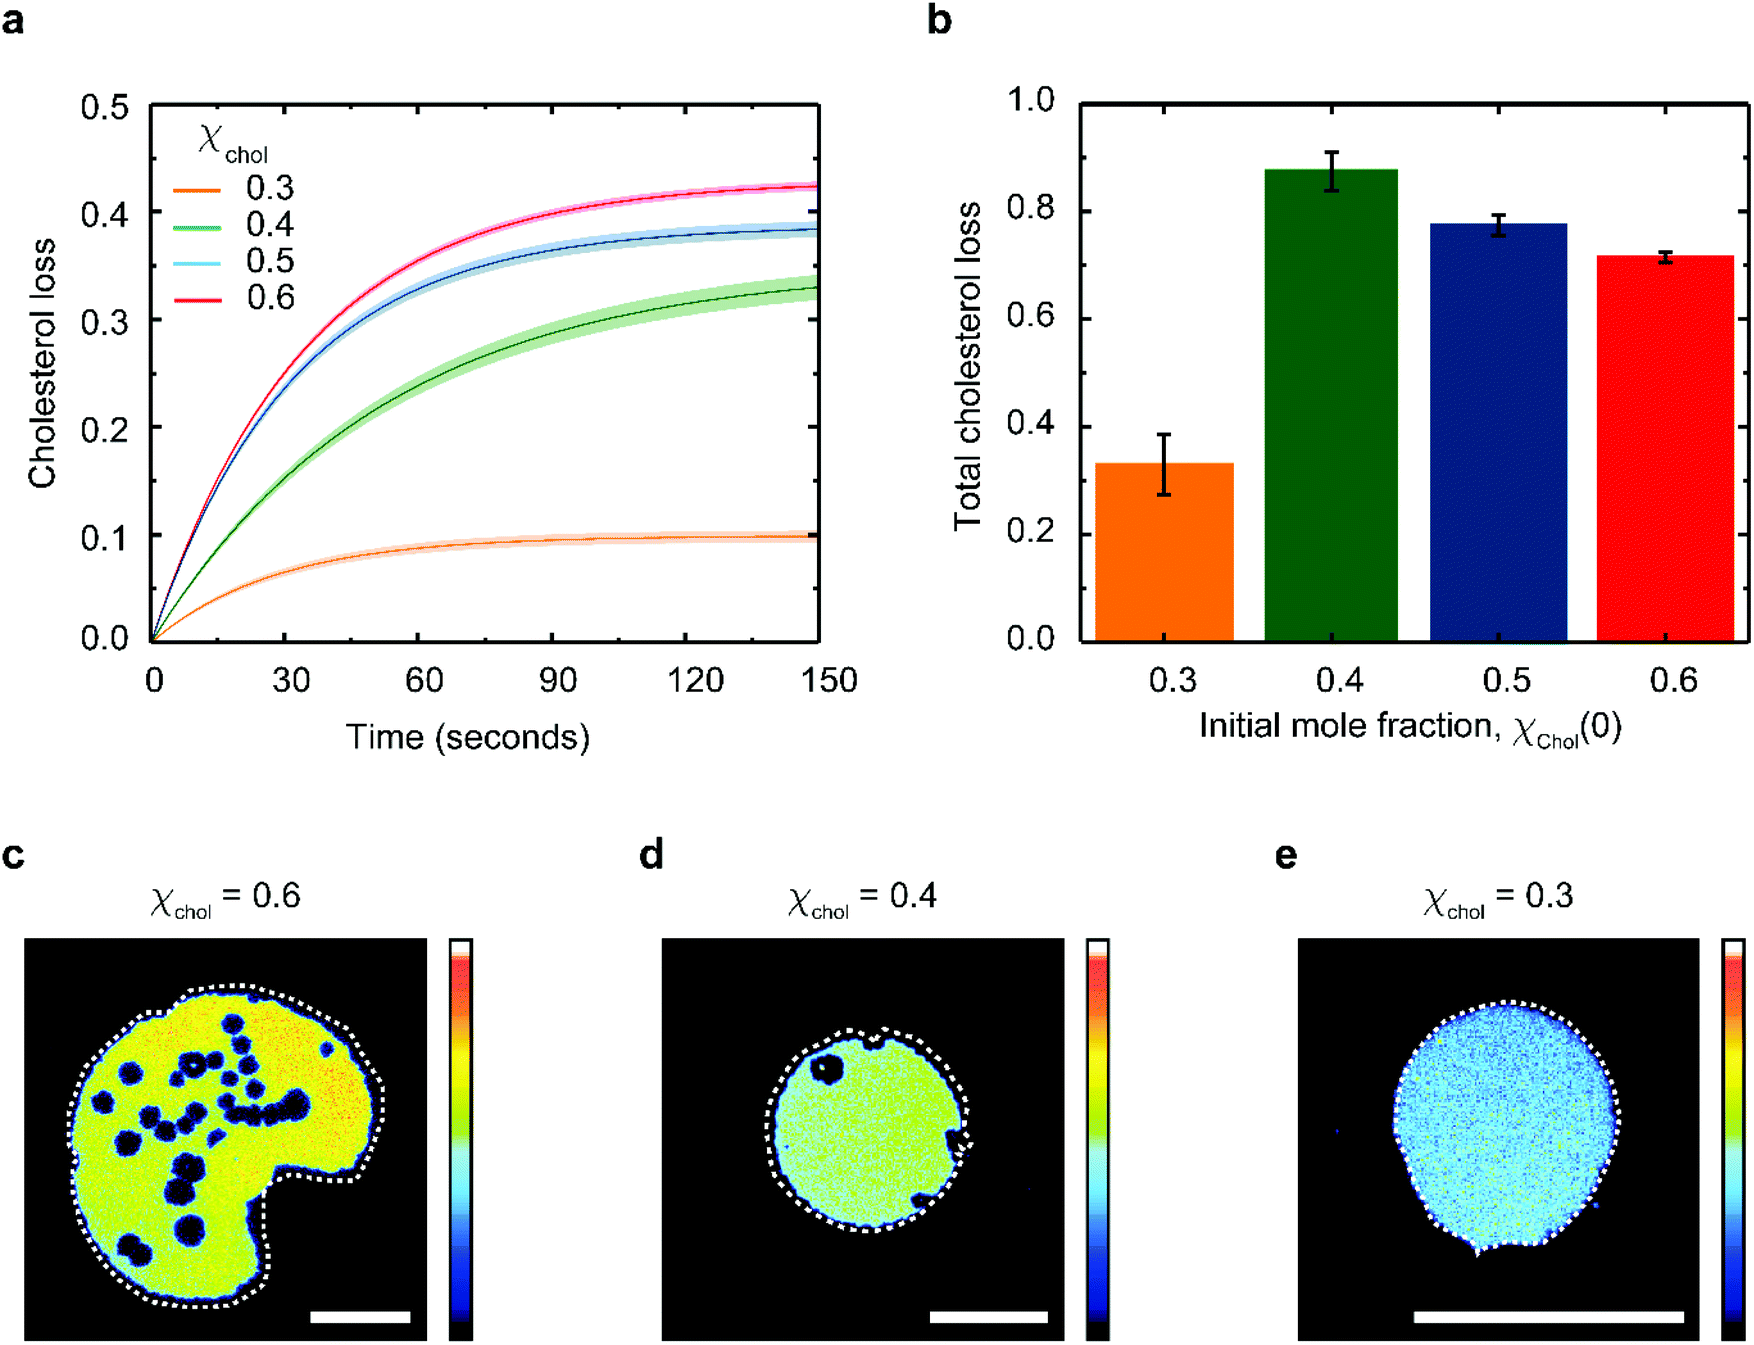 | ||
| Fig. 3 Analysis of cholesterol extraction as a function of cholesterol concentration. (a) Time dependent cholesterol loss, defined as (χchol(t0) − χchol(t)) in DOPC:cholesterol lipid bilayers supported on partially oxidized PDMS. (b) Total percentage of cholesterol loss, (1 − χchol(tend)/χchol(t0)) as a function of the initial cholesterol mole fraction. Fluorescence images of DOPC:cholesterol lipid patches containing (c) 0.6, (d) 0.4 and (e) 0.3 cholesterol mole fraction 150 seconds after deposition on partially plasma-oxidized PDMS. The original patch perimeter is shown as a dotted white line on each image to mark the extent of patch shrinking. Errors in (a–b) are estimated using the 95% confidence bounds from the fits. The scalebars in (c–e) are 50 μm and the colour scale of the fluorescence intensity is in arbitrary units. | ||
The extent of cholesterol depletion determines the magnitude of the morphological changes observed in the lipid patch. Patches with larger initial cholesterol mole fractions lose a greater portion of their lipids. As a result, they typically shrink and form pores at the same time (Fig. 3c and d). In contrast, patches containing 0.3 cholesterol mole fraction retain more than 90% of their lipids and experience only minor shrinking (Fig. 3e). Below 0.3 cholesterol mole fraction, it becomes difficult to assess the extent of PDMS cholesterol depletion using our microscopy method.
Cholesterol extraction from saturated lipid membranes on PDMS substrates induces lipid phase change
Cholesterol is known to interact more strongly with saturated than with unsaturated lipids. This renders saturated lipid bilayers more resistant to typical means of cholesterol extraction.37,46,47 To examine whether the partially oxidized PDMS substrates are capable of extracting cholesterol from saturated lipid membranes we used lipid patches composed of DPPC:cholesterol (60:40 mol%) (Fig. 4).
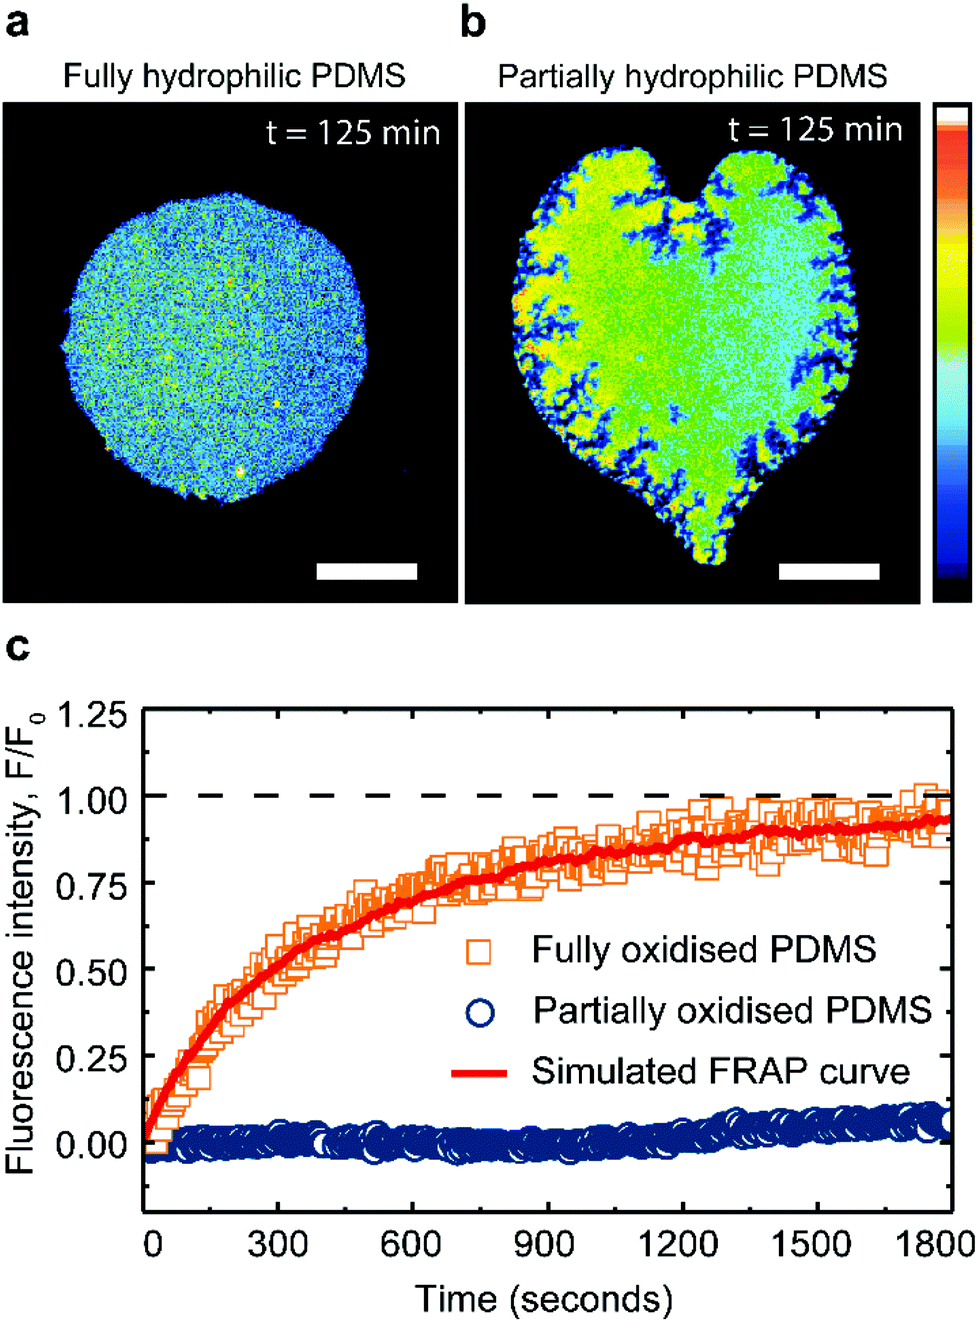 | ||
| Fig. 4 Saturated lipid membranes on PDMS substrates. Fluorescence images of DPPC:cholesterol lipid bilayers (60:40 mol%) on (a) fully and (b) partially plasma-oxidized PDMS substrates, 125 min after deposition on the substrate. The scalebars are 50 μm and the color scale of the fluorescence intensity is in arbitrary units. (c) Typical FRAP recovery curves for DPPC:cholesterol (60:40 mol%) lipid bilayers supported on fully and partially plasma-oxidized PDMS. Simulated FRAP curve (see Methods) fitted to our data (red curve) returns the lateral lipid diffusivity. | ||
Pure DPPC membranes are in gel phase at room temperature but the addition of cholesterol disrupts the tight DPPC hydrocarbon chain packing and fluidizes the membrane. Hence at room temperature, DPPC:cholesterol (60:40 mol%) membranes exist in a fully stable liquid-ordered phase, free of solid domains.26,48,49 Consistently, our DPPC:cholesterol (60:40 mol%) membrane patches remain fluid and stable for hours, when supported on fully oxidized PDMS (Fig. 4a). However, when in contact with a partially oxidized PDMS surface, the patches lose a significant portion of their area, while simultaneously increasing their fluorescence intensity (Fig. 4b). These observations confirm that PDMS is able to extract cholesterol from saturated lipid membranes, albeit at a rate 180 times slower compared to unsaturated lipid membranes. Moreover, the cholesterol extraction from the DPPC membranes induces cracks at the patch's edges (Fig. 4b), contrasting with the round pores and the smooth edges characteristic of shrinking fluid DOPC membranes (Fig. 3c).27 Cracks have been previously observed in supported lipid bilayers in the gel phase,50,51 prompting us to explore whether the PDMS could induce a transition in the supported lipid bilayer, from a liquid ordered phase to a more gel-like phase.
FRAP measurements confirm the fluidity of DPPC:cholesterol (60:40 mol%) patches on hydrophilic PDMS with a recovery after photo-bleaching yielding a lateral lipid diffusivity of 0.06 ± 0.004 μm2 s−1 (see Methods). This fluorescent recovery is incomplete due to the finite size of the patch; however the magnitude of the diffusion constant obtained from our analysis (see Methods) is in good agreement with literature49 (Fig. 4c). In contrast, after cholesterol extraction on partially oxidized PDMS substrate, the saturated membranes exhibit little to no recovery after bleaching (Fig. 4c).
The drastic reduction in the lipid mobility confirms that the DPPC:cholesterol patches have solidified. With these results we demonstrate that partially oxidized PDMS can induce both chemical and physical changes in lipid membranes, manifested here by lipid phase change.
Mechanically triggered cholesterol extraction
In all of the preceding experiments, the extraction of cholesterol starts as soon as the lipid membrane is brought in contact with the substrate. This limits the degree of control over the extraction process and hence its potential for practical applications. We explored the possibility of triggering the cholesterol extraction from the lipid membrane by stretching a fully oxidized PDMS substrate. Previous studies show that when oxidized PDMS substrates are subject to tensile strains, the brittle silica-like surface layer forms nanoscale cracks, partially exposing the underlying hydrophobic bulk PDMS.52,53To test whether we can trigger mechanically the extraction of cholesterol we used the stretching device described elsewhere19 to apply a biaxial strain on the substrate. During the initial stretching phase, the lipid patches exhibit negligible changes in their surface area (Fig. 5). Although the applied strain reaches 15%, which is an order of magnitude larger than the critical rupture strain for lipid bilayers,54 the patches are able to maintain their integrity by decoupling and sliding over the hydrated PDMS substrate, in agreement with previous observations.27 However, once the substrate is sufficiently stretched and held in that position, we observe a rapid area loss in the patch, with an associated increase in the fluorescence intensity (Fig. 5b and d), both indicative of cholesterol loss.
 | ||
| Fig. 5 Mechanically triggered extraction of cholesterol from supported lipid bilayers. Fluorescence images of a DOPC:cholesterol (40:60 mol%) lipid patch, adhered to fully plasma-oxidized PDMS: (a) before expansion, (b) while stretched, and (c) after compression. The exact location of the images is indicated on the strain cycle in (d). To highlight the surface area changes in the patch, the initial patch perimeter is highlighted with a dashed white line. (d) Normalized average surface area of n = 7 independent lipid patches with respective standard errors as a function of the substrate strain. The red data points correspond to the stretch phase from 0 to 15%, the grey ones are taken while the substrates is held stretched, and the blue indicate compression from 15% to 0%. Scalebars 20 μm and colour scale in fluorescence arbitrary units (a–c). | ||
AFM scans of a PDMS substrate subject to 15% tensile strain verify the existence of surface nano-cracks in the otherwise hydrophilic silica layer (Fig. S5a–c†). Upon relaxing the substrate to its original dimensions, the patches appear stable again but much smaller and brighter than they initially were (Fig. 5c). This experiment, while simplistic, demonstrates that it is possible to initiate cholesterol extraction in a controlled manner from otherwise stably supported membranes, by subjecting the PDMS substrate to tensile strain. In our particular setup, once the hydrophilic silica layer has been sufficiently cracked the extraction of cholesterol continues until all the accessible cholesterol has been depleted from the membrane.
It is worth noting that during the strain cycle shown in Fig. 5, the lipid patches lose on average 2–5% more area than when statically supported on partly oxidized PDMS (Fig. 5d). The reason for this is not entirely clear (see discussion in ESI, Fig. S4 and 5†). While the presence of hydrophobic nano-domains on the partially plasma oxidized PDMS substrates (Fig. 2b) is associated with the specific extraction of cholesterol, the relatively larger hydrophobic cracks obtained by stretching the fully hydrophilic PDMS substrates (Fig. S5c†) can occasionally pull out DOPC molecules and even the much larger rhodamine-DPPC fluorophores if wide enough. This clearly plays a role at extreme strain magnitudes (>35%) where we occasionally observe the formation of micron scale fissures in the PDMS surface, which subsequently fill up with fluorescent membrane from the contacted patch and fully disrupt it (Fig. S5d–f†). Although undesired, the minor loss of PC-lipids is not uncommon even when using conventional cholesterol extraction agents such as cyclodextrin,55,56 and in our setup it can be minimized by reducing the magnitude of the tensile strain.
Conclusions
Cholesterol is a highly dynamic membrane constituent, often contributing 20% to 50% of the lipid content in mammalian cell plasma membrane.45 It is an important regulator of membrane properties and function, including the membrane fluidity,57 lateral phase organization,58,59 and interaction with the cell cytoskeleton.60,61 Cholesterol levels need to be finely controlled both in living cells and in artificial membrane systems, a task usually achieved by molecular transporters, such as biological lipoproteins or artificial cyclodextrins.55 Here we show that plasma modified PDMS substrates can specifically extract cholesterol directly from the adjacent supported lipid bilayer through simple physical contact. The presence of nanoscale hydrophilic and hydrophobic domains at the PDMS interface appears to be the key to the specific cholesterol extraction, while leaving the other bilayer components stably supported. Although our current results do not allow for a definitive answer regarding the detailed extraction mechanism, it is likely to be driven by direct interactions of cholesterol with the hydrophobic nanodomains at the PDMS substrate surface. A parallel can be drawn with the well-known methyl-β-cyclodextrin extraction method, where methyl-β-cyclodextrin exhibiting a hydrophilic surface and a sub-nanoscale hydrophobic cavity can selectively remove cholesterol from bilayers to the solution.62 It should be pointed out that the exact mechanism of cholesterol extraction via cyclodextrin is also unclear.63Currently, PDMS remains one of the most popular substrates for biotechnological investigations, including development of biomedical devices, organ-on-a-chip and flexible bio-electronic technologies, due to its robustness, low-cost, and ease of use.24 However, while PDMS’ field of applications steadily grows, a need for understanding its nanoscale interfacial properties beyond current passivation approaches64 is of key importance. Our observations offer the unique opportunity for utilising the substrate interaction to controllably modify the biophysical properties of a supported lipid membrane, hence opening new avenues for developing functional substrates for bio-interfaces. We expect our findings to have significant implications first for biotechnological developments relying on PDMS, but also to further our understanding of the impact of supporting substrates in the biological and technological context.
Conflicts of interest
The authors declare no competing financial interest.Acknowledgements
L. Stubbington is acknowledged for help with the stretching experiments; P. Cubillas is acknowledged for providing access to Nanowizard ultra AFM, and Q. He is acknowledged for providing access to MFP-3D AFM. We acknowledge D. Moore, E. Welfare, and M. Thompson for useful discussion. The authors acknowledge Asylum/Oxford Instruments for the opportunity to use the NanoRack instrument. The authors acknowledge financial support from GlaxoSmithKlein and the Engineering and Physical Sciences Research Council (grant EP/L015536/1), and M. Staykova acknowledges support from Engineering and Physical Sciences Research Council (grant EP/P024092/1).References
- D. E. Discher, Science, 2005, 310, 1139–1143 CrossRef PubMed.
- K. Gowrishankar, S. Ghosh, S. Saha, C. Rumamol, S. Mayor and M. Rao, Cell, 2012, 149, 1353–1367 CrossRef PubMed.
- E. T. Castellana and P. S. Cremer, Surf. Sci. Rep., 2006, 61, 429–444 CrossRef.
- R. Tero, Materials, 2012, 5, 2658–2680 CrossRef.
- S. Boxer, Curr. Opin. Chem. Biol., 2000, 4, 704–709 CrossRef PubMed.
- R. N. Palchesko, L. Zhang, Y. Sun and A. W. W. Feinberg, PLoS One, 2012, 7, e51499 CrossRef PubMed.
- Y. Zhang, X. Wang and S. Ma, RSC Adv., 2016, 6, 11325–11328 RSC.
- L. Zhang and S. Granick, Proc. Natl. Acad. Sci. U. S. A., 2005, 102, 9118–9121 CrossRef PubMed.
- C. Scomparin, S. Lecuyer, M. Ferreira, T. Charitat and B. Tinland, Eur. Phys. J. E, 2009, 28, 211–220 CrossRef PubMed.
- A. Martiniere, I. Lavagi, G. Nageswaran, D. J. Rolfe, L. Maneta-Peyret, D.-T. Luu, S. W. Botchway, S. E. D. Webb, S. Mongrand, C. Maurel, M. L. Martin-Fernandez, J. Kleine-Vehn, J. Friml, P. Moreau and J. Runions, Proc. Natl. Acad. Sci. U. S. A., 2012, 109, 12805–12810 CrossRef PubMed.
- K. M. Spillane, J. Ortega-Arroyo, G. De Wit, C. Eggeling, H. Ewers, M. I. Wallace and P. Kukura, Nano Lett., 2014, 14, 5390–5397 CrossRef PubMed.
- A. B. Subramaniam, G. Guidotti, V. N. Manoharan and H. A. Stone, Nat. Mater., 2013, 12, 128–133 CrossRef PubMed.
- A. Honigmann, S. Sadeghi, J. Keller, S. W. Hell, C. Eggeling and R. Vink, eLife, 2014, 2014, 1–16 Search PubMed.
- L. Feriani, L. Cristofolini and P. Cicuta, Chem. Phys. Lipids, 2015, 185, 78–87 CrossRef PubMed.
- J. T. Groves and S. G. Boxer, Acc. Chem. Res., 2002, 35, 149–157 CrossRef PubMed.
- S. F. Gilmore, H. Nanduri and A. N. Parikh, PLoS One, 2011, 6, 1–8 Search PubMed.
- A. B. Subramaniam, S. Lecuyer, K. S. Ramamurthi, R. Losick and H. A. Stone, Adv. Mater., 2010, 22, 2142–2147 CrossRef PubMed.
- J. P. Frimat, J. Sisnaiske, S. Subbiah, H. Menne, P. Godoy, P. Lampen, M. Leist, J. Franzke, J. G. Hengstler, C. van Thriel and J. West, Lab Chip, 2010, 10, 701 RSC.
- M. Staykova, D. P. Holmes, C. Read and H. A. Stone, Proc. Natl. Acad. Sci. U. S. A., 2011, 108, 9084–9088 CrossRef PubMed.
- A. J. Kosmalska, L. Casares, A. Elosegui-Artola, J. J. Thottacherry, R. Moreno-Vicente, V. González-Tarragó, M. Á. del Pozo, S. Mayor, M. Arroyo, D. Navajas, X. Trepat, N. C. Gauthier and P. Roca-Cusachs, Nat. Commun., 2015, 6, 7292 CrossRef PubMed.
- D. Huh, B. D. Matthews, A. Mammoto, M. Montoya-Zavala, H. Y. Hsin and D. E. Ingber, Science, 2010, 328, 1662–1668 CrossRef PubMed.
- S. Gong, W. Schwalb, Y. Wang, Y. Chen, Y. Tang, J. Si, B. Shirinzadeh and W. Cheng, Nat. Commun., 2014, 5, 3132 CrossRef PubMed.
- G. Schwartz, B. C.-K. Tee, J. Mei, A. L. Appleton, D. H. Kim, H. Wang and Z. Bao, Nat. Commun., 2013, 4, 1859 CrossRef PubMed.
- J. A. Rogers, T. Someya and Y. Huang, Science, 2010, 327, 1603–1607 CrossRef PubMed.
- T. Bhatia, P. Husen, J. Brewer, L. A. Bagatolli, P. L. Hansen, J. H. Ipsen and O. G. Mouritsen, Biochim. Biophys. Acta, Biomembr., 2015, 1848, 3175–3180 CrossRef PubMed.
- S. L. Veatch and S. L. Keller, Biophys. J., 2003, 85, 3074–3083 CrossRef PubMed.
- L. Stubbington, M. Arroyo and M. Staykova, Soft Matter, 2017, 13, 181–186 RSC.
- D. Blumenthal, L. Goldstien, M. Edidin and L. A. Gheber, Sci. Rep., 2015, 5, 11655 CrossRef PubMed.
- H. Hillborg, N. Tomczak, A. Olàh, A. Holger Schönherr and G. J. Vancso, Langmuir, 2003, 20, 785–794 CrossRef.
- A. F. Stalder, G. Kulik, D. Sage, L. Barbieri and P. Hoffmann, Colloids Surf., A, 2006, 286, 92–103 CrossRef.
- M. Rahimi, D. Regan, M. Arroyo, A. B. Subramaniam, H. A. Stone and M. Staykova, Biophys. J., 2016, 111, 2651–2657 CrossRef PubMed.
- J. P. Litz, N. Thakkar, T. Portet and S. L. Keller, Biophys. J., 2016, 110, 635–645 CrossRef PubMed.
- P. Lenz, C. M. Ajo-Franklin and S. G. Boxer, Langmuir, 2004, 20, 11092–11099 CrossRef PubMed.
- K. M. R. Faysal, J. S. Park, J. Nguyen, L. Garcia and A. B. Subramaniam, PLoS One, 2017, 12, 1–16 CrossRef PubMed.
- M. J. Owen and P. J. Smith, J. Adhes. Sci. Technol., 1994, 8, 1063–1075 CrossRef.
- Z. P. Yang, I. Engquist, J.-M. Kauffmann and B. Liedberg, Langmuir, 1996, 12, 1704–1707 CrossRef.
- F. W. S. Stetter, L. Cwiklik, P. Jungwirth and T. Hugel, Biophys. J., 2014, 107, 1167–1175 CrossRef PubMed.
- M. W. Toepke and D. J. Beebe, Lab Chip, 2006, 6, 1484 RSC.
- W. C. Hung, M. T. Lee, F. Y. Chen and H. W. Huang, Biophys. J., 2007, 92, 3960–3967 CrossRef PubMed.
- M. R. Ali, K. H. Cheng and J. Huang, Proc. Natl. Acad. Sci. U. S. A., 2007, 104, 5372–5377 CrossRef PubMed.
- M. Alwarawrah, J. Dai and J. Huang, J. Phys. Chem. B, 2010, 114, 7516–7523 CrossRef PubMed.
- M. P. Beseničar, A. Bavdek, A. Kladnik, P. Maček and G. Anderluh, Biochim. Biophys. Acta, Biomembr., 2008, 1778, 175–184 CrossRef PubMed.
- J. A. Hamilton, Curr. Opin. Lipidol., 2003, 14, 263–271 CrossRef PubMed.
- B. N. Olsen, A. A. Bielska, T. Lee, M. D. Daily, D. F. Covey, P. H. Schlesinger, N. A. Baker and D. S. Ory, Biophys. J., 2013, 105, 1838–1847 CrossRef PubMed.
- A. Parker, K. Miles, K. H. Cheng and J. Huang, Biophys. J., 2004, 86, 1532–1544 CrossRef PubMed.
- J. R. Silvius, Biochim. Biophys. Acta, Biomembr., 2003, 1610, 174–183 CrossRef.
- H. Ohvo-Rekilä, B. Ramstedt, P. Leppimäki and J. Peter Slotte, Prog. Lipid Res., 2002, 41, 66–97 CrossRef.
- K. J. Tierney, D. E. Block and M. L. Longo, Biophys. J., 2005, 89, 2481–2493 CrossRef PubMed.
- J. L. R. Rubenstein, B. A. Smith and H. M. Mcconnell, Chemistry, 1979, 76, 15–18 Search PubMed.
- Z. V. Feng, T. A. Spurlin and A. A. Gewirth, Biophys. J., 2005, 88, 2154–2164 CrossRef PubMed.
- R. Knorr, M. Staykova, R. Gracià and R. Dimova, Soft Matter, 2010, 6, 1990 RSC.
- X. Zhu, K. L. Mills, P. R. Peters, J. H. Bahng, E. H. Liu, J. Shim, K. Naruse, M. E. Csete, M. D. Thouless and S. Takayama, Nat. Mater., 2005, 4, 403–406 CrossRef PubMed.
- D. Huh, K. L. Mills, X. Zhu, M. A. Burns, M. D. Thouless and S. Takayama, Nat. Mater., 2007, 6, 424–428 CrossRef PubMed.
- D. Needham and R. S. Nunn, Biophys. J., 1990, 58, 997–1009 CrossRef PubMed.
- R. Zidovetzki and I. Levitan, Biochim. Biophys. Acta, Biomembr., 2007, 1768, 1311–1324 CrossRef PubMed.
- M. C. Giocondi, P. E. Milhiet, P. Dosset and C. Le Grimellec, Biophys. J., 2004, 86, 861–869 CrossRef PubMed.
- R. S. Gracià, N. Bezlyepkina, R. L. Knorr, R. Lipowsky and R. Dimova, Soft Matter, 2010, 6, 1472 RSC.
- B. L. Stottrup, S. L. Veatch and S. L. Keller, Biophys. J., 2004, 86, 2942–2950 CrossRef PubMed.
- M. Hao, S. Mukherjee and F. R. Maxfield, Proc. Natl. Acad. Sci. U. S. A., 2001, 98, 13072–13077 CrossRef PubMed.
- M. Qi, Y. Liu, M. R. Freeman and K. R. Solomon, J. Cell. Biochem., 2009, 106, 1031–1040 CrossRef PubMed.
- B. van Deurs, K. Roepstorff, A. M. Hommelgaard and K. Sandvig, Trends Cell Biol., 2003, 13, 92–100 CrossRef PubMed.
- M. di Cagno and M. Pio, Molecules, 2016, 22, 1 CrossRef PubMed.
- C. A. López, A. H. de Vries and S. J. Marrink, PLoS Comput. Biol., 2011, 7, 1002020 CrossRef PubMed.
- B. J. van Meer, H. de Vries, K. S. A. Firth, J. van Weerd, L. G. J. Tertoolen, H. B. J. Karperien, P. Jonkheijm, C. Denning, A. P. IJzerman and C. L. Mummery, Biochem. Biophys. Res. Commun., 2017, 482, 323–328 CrossRef PubMed.
Footnote |
| † Electronic supplementary information (ESI) available: Characterization of the PDMS substrate (Fig. S1), statistical procedure for the analysis of the cholesterol extraction events (Fig. S2), quality of model fits used to quantify the extraction of cholesterol from DOPC:Chol bilayers (Fig. S3), extracted values for accessible cholesterol mole fraction and cholesterol depletion rate constant (Table S1), changes in the lipid patches and the PDMS substrates during mechanical strain cycles (Fig. S4), evidence of nanoscale and microscale surface cracking on PDMS substrates (Fig. S5). See DOI: 10.1039/c8nr03399d |
| This journal is © The Royal Society of Chemistry 2018 |