 Open Access Article
Creative Commons Attribution 3.0 Unported Licence
Kinetic monitoring of glutathione-induced silver nanoparticle disintegration†
Claudia
Kästner
 ,
Patrick E. J.
Saloga
 and
Andreas F.
Thünemann
 *
*
Federal Institute for Materials Research and Testing (BAM), Unter den Eichen 87, 12205 Berlin, Germany. E-mail: andreas.thuenemann@bam.de
First published on 11th June 2018
Abstract
We report on etching of polyacrylic acid-stabilised silver nanoparticles in the presence of glutathione (GSH). The initial particles with a radius of 3.2 nm and consisting of ∼8100 silver atoms dissolve in a two-step reaction mechanism while in parallel smaller silver particles with a radius of 0.65 nm and consisting of 60 to 70 silver atoms were formed. The kinetics of the etching of the initial particles, accompanied by formation of smaller silver particles was interpreted based on in situ, time-resolved small-angle X-ray scattering (SAXS) experiments.
Introduction
Today the commercial, societal, and environmental impacts of a wide range of emerging silver nanoparticle technologies is under highly controversial dispute as reviewed recently by Calderón-Jiménez et al.1 The pivotal point of this debate is the release of large amounts of silver ions from silver nanoparticles, which in turn show complex chemical transformations in biological environments.2 An intriguing work of the transformation of silver nanoparticles is a study of Glover et al.3 who have shown that new silver nanoparticles can be generated spontaneously from “parent” nanoparticles and from manmade macroscopic silver objects. These findings are of general importance because nowadays the typical dietary intake of humans is estimated at 70 to 90 μg silver per day.4 In contrast to the unintentional ingestion of silver in different chemical and physical forms, the controlled release of biologically active silver from “nanosilver” surfaces is of great interest in a multitude of antibacterial applications.5 It should be noted that the appearance of bacterial resistance to silver nanoparticles and strategies how to overcome this issue are under debate.6When considering properties of silver nanoparticles, type and amount of coating ligands are of paramount importance. Ligands enable the setting of tailor-made properties such as colloidal stability, antibacterial behaviour, silver ion release kinetics and accessibility of particles’ surfaces for substrates in catalytic reactions. An example for adjusting catalytic activity via choice of the ligand is the application of small silver nanoparticles with different coatings in the reduction of 4-nitrophenol. Here, the activity can be tuned from 436 to 77.6 L g−1 s−1 if the ligand polyacrylic acid (PAA) is replaced by glutathione (GSH).7
In nanoparticle research, GSH is of great interest because it is highly biocompatible and has a strong binding affinity to metal surfaces. As a natural tripeptide GSH is the most abundant intracellular thiol with several biological functions and is the major antioxidant in liver.8 Probably because of its low molar mass of 307 g mol−1, GSH is capable of effectively stabilising small silver nanoparticles down to radii of about 0.5 to 1 nm.9 These so-called silver clusters are not only of fundamental scientific interest, but are also useful for many applications10 such as fluorescent labels in bioimaging.9 But apart from its undeniable advantages, GSH has some contradictory properties: under ambient conditions, a spontaneous formation of silver nanoparticles was observed when GSH is in contact with silver nitrate solutions. Furthermore, GSH was also found to induce the disintegration of silver nanoparticles.11 Unfortunately, the role of GSH in particle formation, stabilisation, and disintegration is presently unclear and, therefore, a subject of current research.
In this context, it is the aim of our study to understand the fate of silver nanoparticles in the presence of GSH. We utilised well defined spherical silver nanoparticles for this purpose, which were employed as performance test material in a recent interlaboratory comparison on nanoparticles size distribution quantification.12 We incubated these particles with GSH in aqueous environment and monitored changes of particles characteristics with SAXS. Within this investigation, we provide a detailed insight into the disintegration of silver nanoparticles and formation of new smaller particles.
Results and discussion
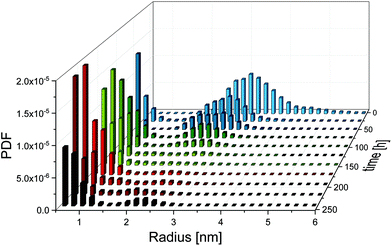
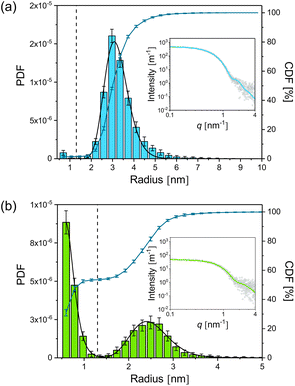
For the synthesis of the initial silver nanoparticles, stabilised by PAA, we used a variation of the widely used polyol synthesis13 as described in the Experimental section. After adding GSH to the silver nanoparticles in a molar ratio of 1 to 5 (silver atoms to GSH molecules), the mixture was incubated at a temperature of 21 °C. According to literature,11 we expected that GSH continuously etches the silver nanoparticles, resulting in a decreasing radius and finally in their dissolution. SAXS was employed to follow the etching process over a period of 240 h. Radii distributions of the particles and their volume concentrations were determined from SAXS data with the help of a Monte Carlo method.14A comprehensive overview on the particle population as a function of incubation time is provided in Fig. 1. Therein, the initial radii distribution is monomodal while, surprisingly, the radii distribution of the incubated particles is bimodal. Radii and volume fractions of the larger particles continuously decreased while a population of small particles emerged. Examples of two typical scattering curves – one measured directly after addition of GSH and a second curve measured after 66 h incubation time – are displayed in Fig. 2. The distributions are slightly asymmetric around their maxima, with tails decaying more slowly towards larger radii. Therefore, symmetric functions such as a Gaussian profile cannot be considered for their description, but a lognormal function describes the distribution sufficiently well as confirmed earlier for the pristine particles.12 When employing the lognormal distribution for interpretation, we found a volume-weighted mean particle radius of R = (3.22 ± 0.02) nm and a width of σ = (0.56 ± 02) nm for the pristine particles. This is in accordance with the results from our recent inter-laboratory comparison.12 These particles consist of ca. 8100 silver atoms if a single silver atom requires a space of 0.0171 nm3 as in bulk silver. In contrast, after 66 h of incubation we determined a population of particles (plarge) with a mean radius of R = (2.51 ± 0.01) nm and a width of σ = (0.43 ± 0.01) nm and a second population of smaller particles (psmall) with a mean radius of R = (0.65 ± 0.02) nm and a width of σ = (0.18 ± 0.01) nm. The corresponding numbers of silver atoms per particle are ca. 4000 and 60 to 70, respectively. Both particle populations psmall and plarge have a relative volume fraction of 50% as can be seen from the CDF and are well separated with a minimum in the PDF at about 1.3 nm. Attempts in using TEM to reveal the particle structure after incubation with GSH confirm that the particles are in the size range derived from SAXS. Unfortunately, only the particle population plarge is clearly visible in the micrographs, while the population psmall is below the resolution of the TEM instrument (see ESI, Fig. S1†). To elucidate whether the small particle population is significant, we performed SAXS measurements with extended measurement times of 24 h. This provides higher quality data statistics to confirm the bimodal size distribution (see ESI, Fig. S2†). Indeed, we found no significant difference in the resultant bimodal size distributions when short and long time SAXS measurements were used for data evaluation.
Based on the SAXS data, we can draw the hypothesis that incubation with GSH leads to the formation of “new”, very small silver particles at the expense of the “old”, larger particles. Two different pathways are conceivable: (i) the larger particles are “etched” and simply decrease in radius, or (ii) two parallel processes take place – the etching of the larger particles and coincidently the formation of new small particles. To reveal the reaction pathway, detailed evaluations of time-dependent changes of particle radii, particle mass concentrations, particle surface areas and particle numbers are provided in the following.
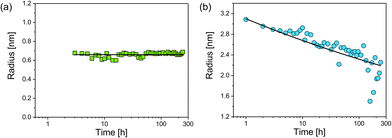
As a first parameter changes of the radii of both particle populations in dependence of incubation time were evaluated (Fig. 3). The psmall were first observed at an incubation time of three hours. Their median radius Rsmall = (0.66 ± 0.02) nm was constant over time and showed a size distribution of moderate width (Fig. 3a). In contrast, the radius of plarge decreased continuously according to a power law (Fig. 3b):
| Rlarge = (3.1 ± 0.1 nm)t−(0.063±0.003) |
While a decrease of Rlarge was expected, the finding of a constant value of Rsmall was surprising. Typically, a coalescence of particles or an Ostwald ripening occurs after nucleation of particles,15,16 whereas in the present study particle growth stopped at a very early stage. The reason for this is unclear, but we speculate that these newly formed smaller nanoparticles are energetically preferred, since GSH seems to efficiently stabilise silver nanoparticles of this selected size. Our finding is consistent with results of Desireddy et al.17 who investigated highly stable thiolate-protected silver nanoclusters. We assume that also silver glutathione clusters containing only a few silver atoms (sub-nanometer particles) could be present during our etching experiment. In literature, clusters of 11 silver atoms are reported by Baksi et al.18 and clusters of 9 and 16 silver atoms are described by Yuan et al.19 Observation of sub-nanometer particles containing only a few silver atoms is below the size detection limit of SAXS. Therefore, these sub-nanometer particles remain “invisible” for SAXS and are not included in the resulting size distribution.
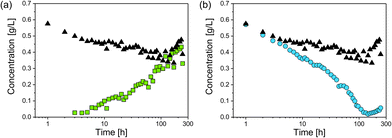
For investigation of the reaction pathway, determination of changes in particle concentration of plarge and psmall is inevitable. Based on that, conclusions can also be drawn about the concentration of the non-detectable sub-nanometer particles. Particle concentrations were determined from SAXS data according to the procedure evaluated in our recent interlaboratory comparison.12 Values for psmall, plarge and the total particle concentration psmall + plarge are shown in Fig. 4. The concentration of psmall increased continuously while that of plarge decreased. For plarge, the concentration is reduced from an initial value of ca. 0.7 g L−1 to a minimum concentration of 0.04 g L−1 at 100–150 h. This corresponds to a mass shrinkage of plarge by 94%. In contrast, the concentration of psmall reaches a limit in the range of 0.4 to 0.5 g L−1 at times longer than 150 h. It should be noted that a small amount of plarge could still be found after an incubation period of 240 h, indicating that the particle population plarge was not completely dissolved. In addition to ambient conditions, the experiment was also carried out in absence of oxygen by using argon gas as protecting atmosphere, which resulted in no significantly different outcome. Therefore, we exclude that the presence of oxygen has a substantial influence on changes of the radii distributions. Instead, GSH seems to predominately promote the transformation process of the particles size distribution. This finding is in accordance with a recent study of Baksi et al.20 who investigated the reactivity of GSH stabilised silver clusters Ag11(GSH)7 and Ag32(GSH)32. They show that oxygen has no major influence on the degradation of these clusters by an excess of GSH. Conclusively, the initial concentration of plarge was 0.7 g L−1 and the final concentration of psmall is around 0.5 g L−1, whereas the final concentration of plarge is 0.04 g L−1. Therefore, we assume that about 0.2 g L−1 of silver was present in form of “invisible” sub-nanometer particles.
An appropriate assumption is that the etching kinetics of the particles plarge are strongly influenced by particles’ surface area exposed to GSH molecules. Therefore, the specific surface area of the particles per volume (SV,small and SV,large) was determined as a function of time from the volume fraction of the particles (φsmall and φlarge) and the particles’ median radius (RV,smll and RV,large) as
 | (1) |
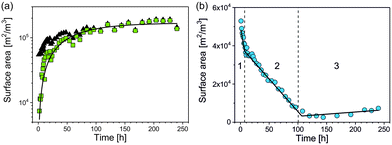
We found that SV,small of psmall increases continuously with time while SV,large of plarge can be divided into three periods that change approximately linearly with time as shown in Fig. 5. SV,large decreases fast within period 1, slowly in period 2 and stays approximately constant in period 3 (Fig. 5b). Linear functions were fitted for quantification of the three periods, each with a reaction constant ki and SV,i(0) – the specific surface area extrapolated to t = 0 – with i = 1, 2, 3:
| SV,large,i(t) = SV,large,i(0) − ki·t | (2) |
![[thin space (1/6-em)]](https://www.rsc.org/images/entities/char_2009.gif) 000 ± 1000) m2 m−3. The SV,large,1(t) decreased with a rate constant of k1 = (1850 ± 180) m2 m−3 h−1 to SV,large,1(t1) = (39
000 ± 1000) m2 m−3. The SV,large,1(t) decreased with a rate constant of k1 = (1850 ± 180) m2 m−3 h−1 to SV,large,1(t1) = (39![[thin space (1/6-em)]](https://www.rsc.org/images/entities/char_2009.gif) 900 ± 3400) m2 m−3 at t1 = (7.1 ± 0.6) h (Fig. 5b). This corresponds to a surface area reduction of 25% within period 1. SV,large was further reduced in period 2 with a lower rate constant of k2 = (350 ± 10) m2 m−3 h−1 down to SV,large,2(t2) = (5400 ± 2100) m2 m−3 at t2 = (100.5 ± 1.7) h. Therefore, about 10% of the initial surface area remains at the end of period 2. This value is almost constant in period 3 with a slight trend of increase with a rate constant of k3 = (−23 ± 9) m2 m−3 h−1. All fitting parameters are summarised in Table 1. For interpretation of the different etching kinetics in period 1 and 2, we assumed that polyacrylic acid was firstly exchanged by GSH in period 1 because binding of the SH group of GSH to silver is much stronger than that of the carboxylic acid groups of polyacrylic acid.21 It is reasonable that GSH acts as etching agent but also passivates the silver nanoparticle surface. An overlay of passivation and etching provides a possible explanation why the etching process was significantly slower in period 2 than in 1. Since plarge did not disappear completely at the end of the measurement time, we conclude that a more complex reaction scenario than simple etching is present.
900 ± 3400) m2 m−3 at t1 = (7.1 ± 0.6) h (Fig. 5b). This corresponds to a surface area reduction of 25% within period 1. SV,large was further reduced in period 2 with a lower rate constant of k2 = (350 ± 10) m2 m−3 h−1 down to SV,large,2(t2) = (5400 ± 2100) m2 m−3 at t2 = (100.5 ± 1.7) h. Therefore, about 10% of the initial surface area remains at the end of period 2. This value is almost constant in period 3 with a slight trend of increase with a rate constant of k3 = (−23 ± 9) m2 m−3 h−1. All fitting parameters are summarised in Table 1. For interpretation of the different etching kinetics in period 1 and 2, we assumed that polyacrylic acid was firstly exchanged by GSH in period 1 because binding of the SH group of GSH to silver is much stronger than that of the carboxylic acid groups of polyacrylic acid.21 It is reasonable that GSH acts as etching agent but also passivates the silver nanoparticle surface. An overlay of passivation and etching provides a possible explanation why the etching process was significantly slower in period 2 than in 1. Since plarge did not disappear completely at the end of the measurement time, we conclude that a more complex reaction scenario than simple etching is present.
| Region | Time interval [h] | S v(0) [m2 m−3] | k [m2 m−3 h−1] |
|---|---|---|---|
| 1 | 0 < t < t1 = 7.1 ± 0.6 | 53![[thin space (1/6-em)]](https://www.rsc.org/images/entities/char_2009.gif) 000 ± 1000 000 ± 1000 |
1850 ± 180 |
| 2 | t 1 < t < t2 = 100.5 ± 1.7 | 40![[thin space (1/6-em)]](https://www.rsc.org/images/entities/char_2009.gif) 600 ± 500 600 ± 500 |
350 ± 10 |
| 3 | t 2 < t < t3 = 240 | 800 ± 400 | −23 ± 9 |
It has been reported in literature that silver nanoparticles can be nucleated from silver-GSH salts, which are formed by combination of silver ions and GSH in aqueous solution.11 Similarly, this model can be adapted for the generation of GSH-stabilised silver particles through etching of plarge and subsequent silver nanoparticle formation of psmall. The change of the specific surface area of psmall as a function of time can be quantified with the exponential function
| SV,small(t) = SV,small(∞)·(1−e−k·t) | (3) |
 | (4) |
![[thin space (1/6-em)]](https://www.rsc.org/images/entities/char_2009.gif) :
:![[thin space (1/6-em)]](https://www.rsc.org/images/entities/char_2009.gif) 1 of GSH to silver with the aim to completely dissolve plarge, led to formation of a black precipitate.
1 of GSH to silver with the aim to completely dissolve plarge, led to formation of a black precipitate.
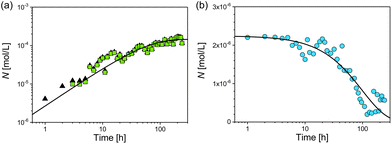
Finally, we consider the number of particles psmall and the total number of particles psmall + plarge (Fig. 6). After 7 h the number of psmall was closely identical to the total number of particles. At this stage of reaction and later the contribution of psmall was determinant for the total particle number. The increase of the number of psmall can be described by an exponential growth function as
| Nsmall = ΔNsmall(1 − exp[−ksmallt]), | (5) |
Nlarge = ΔNlarge![[thin space (1/6-em)]](https://www.rsc.org/images/entities/char_2009.gif) exp[−klarge(t − t0)], exp[−klarge(t − t0)], | (6) |
From combination of both processes for plarge and psmall we conclude that ΔNsmall/ΔNlarge = −66, which means that for each disappearing particle plarge 66 new particles of psmall are formed. The ratio of the reaction constants ksmall/klarge shows that the formation of psmall is significantly faster than the reduction of plarge. The k-values can be utilised to calculate the time τi required to form/dissolve 50% of the final number of particles (eqn (7)).
| τi = ln(2)ki−1 | (7) |
For the formation of psmall this results in τsmall = (37 ± 4) h. Similarly, we calculated the time τlarge required to dissolve 50% of the initial number of particles plarge, which gives τlarge = (136 ± 9) h.
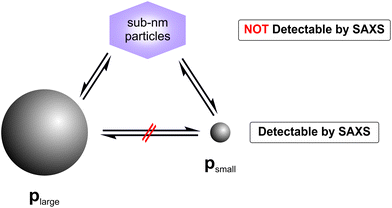
By combining all data derived above, we make a hypothesis for the mechanism of the observed particle transformation as sketched in Fig. 7. Therein, the transformation of plarge to psmall is assumed to be mediated by complexes of Ag and GSH. These sub-nanometer particles may be present in form of GSH stabilised Ag clusters, which contain only a few number of Ag atoms. A direct transformation of plarge to psmall must be considered as extremely unlikely because the total number of the particles did not stay constant. Therefore, we conclude that the reaction pathway (ii), consisting of two parallel processes – dissolution and formation of plarge and psmall, respectively – corresponds to the most likely reaction mechanism.
Conclusions
The etching process of polyacrylic acid-stabilised silver nanoparticles with concurrent formation of new smaller silver nanoparticles was characterised with the help of SAXS measurements. The etching process follows zero order kinetics and can be divided in three periods: a fast etching in period one which is based on the exchange of PAA with GSH, a slow etching in period two where passivation through GSH hinders etching, and a steady-state situation in period three. In parallel, the formation of very small nanoparticles is observed which follows first order kinetics.Experimental
Materials
All chemicals were used as received without further purification. Silver nitrate was purchased from AppliChem, polyacrylic acid (PAA) with a molar mass of Mw = 1800 g mol−1 (catalog number 323667-250 g) from Sigma-Aldrich, and ethylene glycol, glutathione (reduced) and sodium hydroxide from Merck. For purification, Milli-Q grade water (18.2 MΩ at 25 °C) was used.Synthesis and etching
Silver nanoparticles were produced according to an earlier described procedure.23 Briefly, solutions of silver nitrate (833 μL, 0.19 M) and PAA (4.167 mL, 0.03 M) in ethylene glycol were mixed and heated to 200 °C for 15 min. The resulting particles were purified by threefold addition of 11.4 mL of water followed by sedimentation. An aqueous sodium hydroxide solution (1 w/v %) was added dropwise for redispersion.The glutathione-induced etching process was studied in an aqueous solution containing 0.7 g L−1 silver nanoparticles, 10 g L−1 glutathione and 0.25 w/v % sodium hydroxide. This corresponds to a molar ratio of 5 glutathione molecules per silver atom.
SAXS measurements
SAXS measurements were performed in a flow through capillary with a Kratky-type instrument (SAXSess from Anton Paar, Austria) at 21 ± 1 °C. Samples analysed with SAXS were used as prepared and measured for 20 minutes (120 measurement frames averaged over 10 s) The measured intensity was converted to absolute scale according to Orthaber et al.24 The scattering vector q depends on the wavelength λ of the radiation (λ = 0.154 nm): q = 4π/λ![[thin space (1/6-em)]](https://www.rsc.org/images/entities/char_2009.gif) sin
sin![[thin space (1/6-em)]](https://www.rsc.org/images/entities/char_2009.gif) θ. Deconvolution (slit length desmearing) of the SAXS curves was performed with the SAXS-Quant software (Anton Paar, Austria). Curve fitting was conducted with the software McSAS (version 1.0.1).14 Since the scattering intensity was measured on an absolute scale the volume fraction of the particles was determined in addition to the particles’ volume weighted radii distribution when applying McSAS. The yields were calculated as the ratio of the experimentally determined volume fraction to the maximal possible volume fraction. The latter is calculated from the mass of silver which forms if all silver ions would have been reduced. Further, we assumed that the density of the silver particles is the same as silver in bulk form (10.49 g cm−3).
θ. Deconvolution (slit length desmearing) of the SAXS curves was performed with the SAXS-Quant software (Anton Paar, Austria). Curve fitting was conducted with the software McSAS (version 1.0.1).14 Since the scattering intensity was measured on an absolute scale the volume fraction of the particles was determined in addition to the particles’ volume weighted radii distribution when applying McSAS. The yields were calculated as the ratio of the experimentally determined volume fraction to the maximal possible volume fraction. The latter is calculated from the mass of silver which forms if all silver ions would have been reduced. Further, we assumed that the density of the silver particles is the same as silver in bulk form (10.49 g cm−3).
(HR)TEM-imaging
(HR)TEM images were obtained from a FEI Tecnai TF 20 X-TWIN transmission electron microscope operating at an acceleration voltage of 200 kV.Conflicts of interest
There are no conflicts to declare.Acknowledgements
We greatly thank M. Gajewska for the TEM pictures.References
- B. Calderón-Jiménez, M. E. Johnson, A. R. Montoro Bustos, K. E. Murphy, M. R. Winchester and J. R. Vega Baudrit, Front. Chem., 2017, 5, 1–26 CrossRef PubMed.
- J. Liu, Z. Wang, F. D. Liu, A. B. Kane and R. H. Hurt, ACS Nano, 2012, 6, 9887–9899 CrossRef PubMed.
- R. D. Glover, J. M. Miller and J. E. Hutchison, ACS Nano, 2011, 5, 8950–8957 CrossRef PubMed.
- S. W. P. Wijnhoven, W. J. G. M. Peijnenburg, C. A. Herberts, W. I. Hagens, A. G. Oomen, E. H. W. Heugens, B. Roszek, J. Bisschops, I. Gosens, D. Van De Meent, S. Dekkers, W. H. De Jong, M. van Zijverden, A. J. A. M. Sips and R. E. Geertsma, Nanotoxicology, 2009, 3, 109–138 CrossRef.
- J. Liu, D. A. Sonshine, S. Shervani and R. H. Hurt, ACS Nano, 2010, 4, 6903–6913 CrossRef PubMed.
- A. Panáček, L. Kvítek, M. Smékalová, R. Večeřová, M. Kolář, M. Röderová, F. Dyčka, M. Šebela, R. Prucek, O. Tomanec and R. Zbořil, Nat. Nanotechnol., 2018, 13, 65–71 CrossRef PubMed.
- C. Kästner and A. F. Thünemann, Langmuir, 2016, 32, 7383–7391 CrossRef PubMed.
- Y. Chen, Y. Yang, M. L. Miller, D. Shen, H. G. Shertzer, K. F. Stringer, B. Wang, S. N. Schneider, D. W. Nebert and T. P. Dalton, Hepatology, 2007, 45, 1118–1128 CrossRef PubMed.
- X. Le Guével, C. Spies, N. Daum, G. Jung and M. Schneider, Nano Res., 2012, 5, 379–387 CrossRef.
- A. Desireddy, B. E. Conn, J. Guo, B. Yoon, R. N. Barnett, B. M. Monahan, K. Kirschbaum, W. P. Griffith, R. L. Whetten, U. Landman and T. P. Bigioni, Nature, 2013, 501, 399–402 CrossRef PubMed.
- K. Siriwardana, N. Suwandaratne, G. S. Perera, W. E. Collier, F. Perez and D. Zhang, J. Phys. Chem. C, 2015, 119, 20975–20984 Search PubMed.
- B. R. Pauw, C. Kästner and A. F. Thünemann, J. Appl. Crystallogr., 2017, 50, 1280–1288 Search PubMed.
- Y. Hu, J. Ge, D. Lim, T. Zhang and Y. Yin, J. Solid State Chem., 2008, 181, 1524–1529 CrossRef.
- I. Bressler, B. R. Pauw and A. F. Thünemann, J. Appl. Crystallogr., 2015, 48, 962–969 CrossRef PubMed.
- J. Polte, X. Tuaev, M. Wuithschick, A. Fischer, A. F. Thuenemann, K. Rademann, R. Kraehnert and F. Emmerling, ACS Nano, 2012, 6, 5791–5802 CrossRef PubMed.
- T. R. Bartlett, S. V. Sokolov, B. J. Plowman, N. P. Young and R. G. Compton, Nanoscale, 2016, 8, 16177–16181 RSC.
- A. Desireddy, S. Kumar, J. S. Guo, M. D. Bolan, W. P. Griffith and T. P. Bigioni, Nanoscale, 2013, 5, 2036–2044 RSC.
- A. Baksi, M. S. Bootharaju, X. Chen, H. Häkkinen and T. Pradeep, J. Phys. Chem. C, 2014, 118, 21722–21729 Search PubMed.
- X. Yuan, M. I. Setyawati, A. S. Tan, C. N. Ong, D. T. Leong and J. Xie, NPG Asia Mater., 2013, 5, e39 CrossRef.
- A. Baksi, M. S. Bootharaju, P. K. Chhotaray, P. Chakraborty, B. Mondal, S. Bhat, R. Gardas and T. Pradeep, J. Phys. Chem. C, 2017, 121, 26483–26492 Search PubMed.
- R. A. Sperling and W. J. Parak, Philos. Trans. R. Soc., A, 2010, 368, 1333 CrossRef PubMed.
- S. Özkar and R. G. Finke, J. Phys. Chem. C, 2017, 121, 27643–27654 Search PubMed.
- P. E. J. Saloga, C. Kästner and A. F. Thünemann, Langmuir, 2018, 34, 147–153 CrossRef PubMed.
- D. Orthaber, A. Bergmann and O. Glatter, J. Appl. Crystallogr., 2000, 33, 218–225 CrossRef.
Footnote |
| † Electronic supplementary information (ESI) available: TEM images and long-time SAXS data. See DOI: 10.1039/c8nr02369g |
| This journal is © The Royal Society of Chemistry 2018 |

