
 Open Access Article
 This Open Access Article is licensed under a Creative Commons Attribution-Non Commercial 3.0 Unported Licence
Selective counting and sizing of single virus particles using fluorescent aptamer-based nanoparticle tracking analysis†
Zoltán
Szakács
 a,
Tamás
Mészáros
b,
Marien I.
de Jonge
c and
Róbert E.
Gyurcsányi
*a
a,
Tamás
Mészáros
b,
Marien I.
de Jonge
c and
Róbert E.
Gyurcsányi
*a
aMTA-BME Lendület Chemical Nanosensors Research Group, Department of Inorganic and Analytical Chemistry, Budapest University of Technology and Economics, Szt. Gellert tér 4, H-1111 Budapest, Hungary. E-mail: robertgy@mail.bme.hu
bDepartment of Medical Chemistry, Molecular Biology and Pathobiochemistry, Semmelweis University, Budapest, Hungary
cSection Pediatric Infectious Diseases, Laboratory of Medical Immunology, Radboud University Medical Center, Nijmegen, Netherlands
First published on 26th April 2018
Abstract
Detection and counting of single virus particles in liquid samples are largely limited to narrow size distribution of viruses and purified formulations. To address these limitations, here we propose a calibration-free method that enables concurrently the selective recognition, counting and sizing of virus particles as demonstrated through the detection of human respiratory syncytial virus (RSV), an enveloped virus with a broad size distribution, in throat swab samples. RSV viruses were selectively labeled through their attachment glycoproteins (G) with fluorescent aptamers, which further enabled their identification, sizing and counting at the single particle level by fluorescent nanoparticle tracking analysis. The proposed approach seems to be generally applicable to virus detection and quantification. Moreover, it could be successfully applied to detect single RSV particles in swab samples of diagnostic relevance. Since the selective recognition is associated with the sizing of each detected particle, this method enables to discriminate viral elements linked to the virus as well as various virus forms and associations.
Introduction
Viruses can be detected either directly or indirectly through the host immune response (e.g. detection of virus-specific antibodies generated in response to the infection).1 Direct detection certainly prevails to characterize and standardize virus preparations, and is also used for medical diagnostics because it enables genotyping and is more specific than the measurement of host immune responses (e.g. it is not restricted by seroconversion times, co-morbidities or treatments).1 However, the majority of direct detection methodologies target only a single component of the virus, i.e., characteristic nucleic acids and proteins even though virus pathogenesis involves whole virus particles.2 Therefore, the interpretation of the results may be complicated if the detected viral elements are not linked to intact viral particles but originate from disintegrated viruses or contaminations. A major step in discriminating between the free and virus integrated proteins was made by introducing a dedicated flow cytometry technique3 based on the concomitant detection of stained viral proteins and nucleic acids, which increases the likelihood of detecting viral components integrated in virus particles. However, in this respect, the most comforting would be if the selective detection of particular virus components is associated with the size of the measured entity as well. Virus sizing in the submicron range has been demonstrated with a wide range of techniques including electron microscopy,4 atomic force microscopy,5 various light scattering6,7 and interferometric techniques,8 nanoparticle tracking analysis9,10 and resistive pulse sensing.11–13 These techniques, if used self-standing, are able to size and in some cases even count viruses in properly purified samples such as vaccines, but even their excellent size resolution may not be sufficient to unambiguously identify and quantify viruses in complex biological samples. Therefore, attempts have been made to combine high resolution sizing with specific detection of a viral component mainly by antibodies raised against viral coat proteins to selectively detect virus particles. Techniques capable of detecting and counting single virus particles in liquids were realized both in heterogeneous and homogeneous formats. Thus, surface-immobilized antibodies could be used to capture viruses in predefined spots to be consecutively revealed by AFM imaging.5 Alternatively, antibodies were added to the sample to selectively increase the size of the viruses that could be detected by resistive pulse sensing.14 However, despite the maturity of single virus detection methodologies, these are still largely limited to purified virus formulations. Moreover, detection methods that rely, at least partially, on the size of the particles mostly target viruses of well-defined size and difficulties are foreseen if applied for viruses that feature an inherently broad size distribution. Therefore, we were interested to address these limitations by developing a fluorescent nanoparticle tracking analysis methodology that enables the selective detection and counting of single viruses with a broad size distribution.Nanoparticle tracking analysis (NTA) was introduced as a general method to size and count biological and synthetic nanoparticles in solutions by taking advantage of their light scattering properties.15–17 The motion of individual nanoparticles is tracked to provide their diffusion coefficient which is further used to calculate their size using the Stokes–Einstein equation. Furthermore, nanoparticles can be tracked also by their fluorescence if adequate wavelength excitation lasers and emission filters are applied. Considering this possibility, we hypothesized that upon adding fluorescently labeled receptors, selective for a surface exposed viral protein, the fluorescent receptor concentration will locally increase around the virus to a sufficient extent to enable its differentiation from the fluorescent background. Accordingly, the virus particles can be identified as fluorescent particles, sized and quantified (Scheme 1). Currently, there is strong interest in synthetic receptors for viruses as alternatives to antibodies1,18 due to their better stability and versatility in terms of custom chemical modification. Therefore, for the fluorescence detection of virus particles, we took advantage of monovalent fluorescently labeled aptamers to rule out virus aggregation. For proof of concept, we used respiratory syncytial virus A2 (RSV), an enveloped virus that shows not only a very broad size distribution (ca. 100–1000 nm)19 but also a variation in shape that includes spherical and filamentous particles.20 RSV is one of the most common pathogens to cause lower respiratory tract infections that affect all age groups but most severely children younger than 2 years of age as well as elderly and immunocompromised patients. These patients may develop complications and it was estimated that RSV is responsible for up to 35% of pneumonia cases.21 Given the high diagnostic relevance of RSV detection,22 we explored the application of the single virus detection methodology in throat swab-based samples.
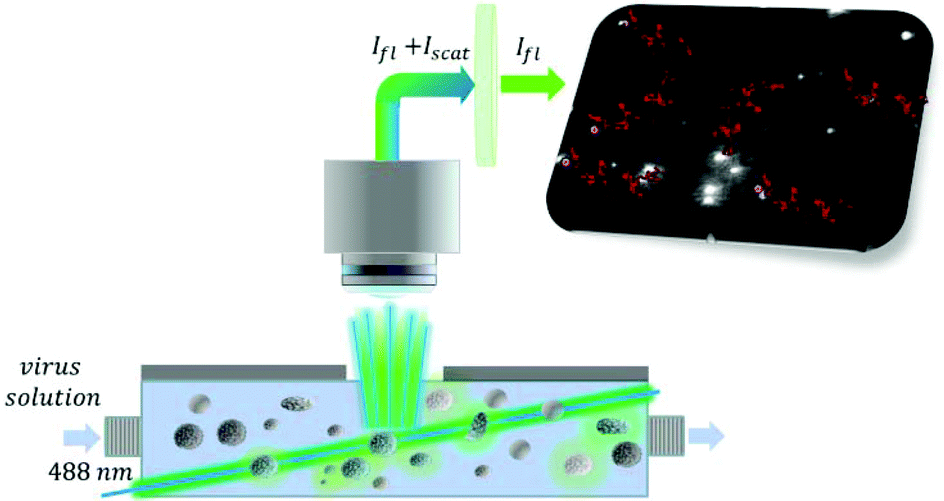 | ||
| Scheme 1 Schematic of the selective virus sizing and counting by fluorescent nanoparticle tracking. The RSV containing sample incubated with the fluorescently labeled aptamer is flown through the thin layer cell illuminated by a 488 nm laser beam. Using a cut-off filter of 495 nm the scattered light is removed and solely the fluorescently labeled virus particles are tracked (red lines). The speed of their motion provides the equivalent diameter of the viruses while the virus count is given by the average number of virus particles detected in the sensing volume. | ||
Experimental section
Chemicals and reagents
DNA aptamers labelled with Alexa Fluor 488 at their 5′-ends were custom synthesized by Sigma-Aldrich and formulated as 100 μM solutions in pH = 8.0 Tris-EDTA buffer. The variable 30-mer nucleotide regions of the RSV aptamers were flanked by two constant (16-mer) sequences 5′-TAG GGA AG AGA AGG ACA TAT GAT-30 N- TTGACTAGTACATGACCACTTGA-3′ (TCC ATA TCG TTT AGC GTA CGG TGG CAG TCT (B10); ACC CGT CGG ACT CGG CCA TAA ATT AAA GGC (E6); GTG TCC GTT CTT ATT GGC GGC TCC CAA TGT (E10), TCA TTA GGT GAG TGT CCG TTC TAC ACT ATA (E11); AGT GCG GTG AGC CGT CGG ACA TAC AAA TAC (H8)). As a control, a random 76-mer DNA sequence (randomDNA) was used (5′-ATC CAG AGT GAC GCA GCA TAT TTC GAC CTT CTA CCT TTG ATT TTT GTG GTC CTC AGT GTG GAC ACG GTG GCT TAG T-3′). All solutions were prepared or diluted with a pH = 7.4 phosphate buffered saline (PBS, P4417, Sigma-Aldrich). To prepare solutions for the NTA experiments, the PBS was filtered through 50 nm pore diameter polycarbonate membranes (Osmonics Inc.). The FITC labelled anti-respiratory syncytial virus polyclonal antibody (FITC-antiRSV, ab156657) and the FITC-labeled anti-nucleoprotein (FITC-ab25849) were purchased from Abcam. Human rhinovirus (HRV) was kindly provided by Kjerstin Lanke (Department of Medical Microbiology, Radboud Medical University).RSV culturing and formulation
For RSV cultivation, RSV A2 infected HeLa cells were used as described in detail previously.23 The extraction and purification of the RSV followed a previously reported standard procedure.23,24 In brief, the cell suspension was subjected to a first centrifugation step of 1800g for 10 min to remove the rough cell debris, followed by ultracentrifugation over a 30% sucrose layer at 72![[thin space (1/6-em)]](https://www.rsc.org/images/entities/char_2009.gif) 000g for 1.5 h. Titration on HeLa cells was followed by a permeabilization and fixation step using Perm/Fix buffers (Becton Dickinson). The cells were incubated with FITC-ab25849 for 30 min on ice, washed with Perm/Wash buffers (Becton Dickinson) and measured on a flow-cytometer (LSR II, Becton Dickinson). The concentration of infectious particles (plaque forming unit equivalents, PFUe) was determined as the number of positive cells per volume. For laboratory use, RSV A2 was inactivated by incubation with β-propiolactone (0.025%) under continuous slow shaking at 4 °C for 16 h.25 The excess of the reagent was left to hydrolyse for 4 h by increasing the temperature to 37 °C and the resulting formulation was stored at −80 °C.
000g for 1.5 h. Titration on HeLa cells was followed by a permeabilization and fixation step using Perm/Fix buffers (Becton Dickinson). The cells were incubated with FITC-ab25849 for 30 min on ice, washed with Perm/Wash buffers (Becton Dickinson) and measured on a flow-cytometer (LSR II, Becton Dickinson). The concentration of infectious particles (plaque forming unit equivalents, PFUe) was determined as the number of positive cells per volume. For laboratory use, RSV A2 was inactivated by incubation with β-propiolactone (0.025%) under continuous slow shaking at 4 °C for 16 h.25 The excess of the reagent was left to hydrolyse for 4 h by increasing the temperature to 37 °C and the resulting formulation was stored at −80 °C.
Throat swab sample collection
Throat swab samples were taken from healthy volunteers using medical swab sticks (Meus S.r.L). The swabs were immediately soaked in 2 mL PBS (pH = 7.4; 1.37 M NaCl, 27 mM KCl, 20 mM KH2PO4, 100 mM Na2HPO4), vortexed, and then centrifuged at room temperature (19060g) for 2 min to transfer the throat sample from the swab into a centrifuge tube. The collected liquid was stored at −20 °C.
NTA experiments
The NTA experiments were performed using a NanoSight LM10-HS instrument (Malvern) equipped with a 488 nm laser light source and a sCMOS camera (Hamamatsu Photonics) triggered by the laser. In fluorescence mode, a 495 nm cut-off filter was used to eliminate the scattered light. Samples of 200–500 μl were flown through the thin layer cell at 6.5 μL min−1 flow rate using a syringe pump (Harvard Apparatus). The particle tracks were recorded and analysed using the NanoSight NTA 2.3 software package. Of note, the NTA software automatically corrects the random particle motion with the unidirectional movement generated by the sample flow. The particle concentrations were calculated as the average of either at least 5 one-minute measurements or at least 50 particle tracks. The throat swab samples were diluted 10-fold and spiked with various RSV concentrations. The samples were further centrifuged at 2500g for 15 min to remove large sized debris and 800 μL aliquots were used for each NTA measurement. The different RSV samples, both formulated in PBS and in diluted throat swab samples, were fluorescently labelled with 25 nM AlexaFluor488–aptamer conjugates (or 25 nM FITC-antiRSV antibody) and subjected to NTA detection in fluorescence mode without separation.Fluorescence and fluorescence polarization measurements
The fluorescence emission spectra were recorded on a PerkinElmer LS50B luminescence spectrometer. To this end, samples were introduced into fluorescence microcuvettes (105.251 QS Hellma) and excited at 490 nm. A 510 nm cut-off filter was used to avoid the detection of scattered light from the throat swab samples. Fluorescence polarization (FP) experiments were performed using a BioTek Synergy 2 microplate reader equipped with a xenon flash lamp and a polarizer set using a 485/20 nm bandpass filter for excitation, a 528/20 nm bandpass filter for emission and a 510 nm dichroic mirror. During FP, a plane polarized light is used to excite the fluorescent aptamers with the emitted fluorescent light detected in the same plane (I∥) and a plane perpendicular to it (I⊥). The fluorescent aptamer binding to the virus was detected through an increase in the fluorescence polarization calculated as FP = (I∥ − I⊥ × G)/(I∥ + I⊥ × G), where G is an instrument specific correction factor that was determined according to the instructions of the instrument manufacturer by using 1 nM fluorescein solution. FP experiments were performed in 96 well, flat bottom, black microtiter plates (CLS3694, Corning) blocked previously with Pierce Protein-Free (TBS) Blocking Buffer (37570, ThermoFisher Scientific) for 1 h. The sum of volumes was 60 μl and the fluorescently labelled aptamer concentration was 0.5 nM in each well. The FP values were reported as the average of 10 consecutive measurements after the binding equilibrium was reached (up to 1 h), which was confirmed by no change in the measured fluorescence intensities.
Results and discussion
Selective fluorescent labelling of RSV particles
Selective fluorescent labelling of RSV can be most straightforwardly achieved by using a fluorescent dye conjugated to a specific receptor which binds to a viral protein on the virus envelope. The use of aptamers, besides their robustness and easy conjugation with fluorescent dyes, was also motivated by their monovalency. We expected that this will rule out virus aggregation during their selective labelling. Furthermore, the ca. an order of magnitude smaller molecular weight of the aptamers (ca. 22 kDa) than that of conventional antibodies may lead to larger surface coverage of virus particles and may thus provide higher sensitivity in this type of application. We have previously selected and reported a large batch of aptamers for RSV with the H8 aptamer exhibiting the best performance in the proximity based luminescence assay of RSV.24 However, as the suitability of aptamers may depend on a particular application, we have selected further aptamer candidates for this study. Their relative affinity for RSV was tested using a competitive fluorescence polarization assay in which fluorescent aptamer candidates (B4, E6, E10, E11, H8) at a constant concentration of 0.5 nM competed for RSV (1.2 × 10⁵ PFU mL−1) with the unlabelled H8 aptamer. Fluorescence polarization is a homogeneous assay, i.e., it does not require the immobilization of the aptamer and the separation of the free and virus bound aptamer. The fluorescence polarization scales inversely with the rate at which a fluorescent molecule rotates. Therefore, the binding of the aptamers to the large virus particles, which decreases significantly their rotational rate, can be easily followed through the increased FP.26 The competitive FP format imposes further stringency to the binding process minimizing non-specific binding. The decrease in the fluorescence polarization upon increasing the unlabelled H8 aptamer concentration indicates the degree of displacement of the respective fluorescently labelled aptamers from the RSV, i.e., their relative affinity for RSV.As can be seen in Fig. 1, aptamers H8 and E10 showed the highest relative affinity, followed closely by E6 and E11, with B10 exhibiting significantly poorer performance. Based on this result, the H8 aptamer was used for most of the follow up measurements.
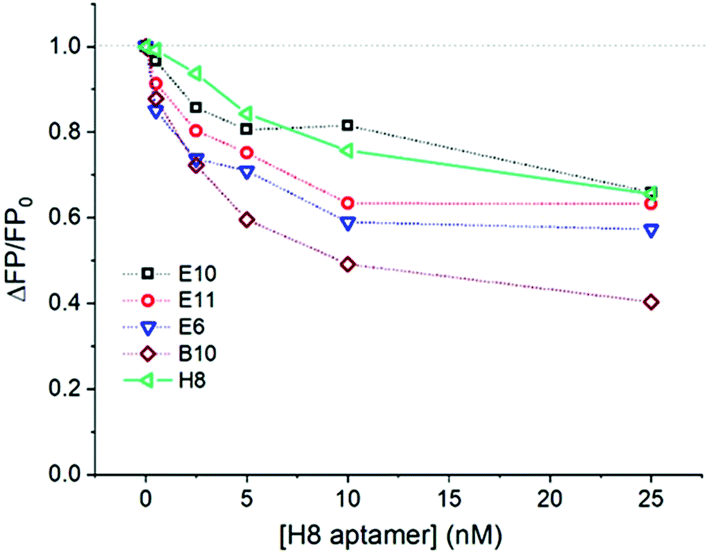 | ||
| Fig. 1 Competitive homogeneous FP experiments performed by keeping the concentration of fluorescently labelled aptamers and that of the RSV virus constant at 0.5 nM and 1.2 × 10⁵ PFU mL−1, respectively, while varying the concentration of the unlabelled H8 aptamer. The curves were normalized with the FP value measured in the absence of the competing aptamer (FP0). | ||
Fluorescence polarization experiments were carried out to confirm the selective labelling of the RSV virus. Human rhinovirus, a likely coexisting pathogen in the RSV containing swab throat samples, was used for this purpose and both virus formulations were incubated with the AlexaFluor488–H8 aptamer. At low virus concentrations (<106 PFU mL−1) no association with the HRV could be observed while the binding to the RSV was detected at almost two orders of magnitude lower concentrations (Fig. 2A). It is likely that the significant aptamer binding at higher HRV concentrations is due to the non-specific electrostatic interaction27,28 between the negatively charged aptamer and positively charged target domains. This is likely to occur as the homogeneous FP assay lacks a stringent washing step that would disrupt non-specific interactions. If this scenario applies, adding an unlabelled random sequence DNA at a sufficiently large concentration should displace, by competitive action, the aptamer from the HRV. We found that already a 10-fold excess (5 nM) random DNA background confirms this hypothesis, i.e. no HRV–aptamer complexes could be detected, while the fluorescent labelling of RSV was barely affected (Fig. 2B).
 | ||
| Fig. 2 Binding of the AlexaFluor488–H8 aptamer (0.5 nM) to RSV and HRV in the absence (A) and in the presence (B) of randomDNA (10 nM) followed by FP. | ||
Sizing and counting of fluorescently labelled RSV particles
First the RSV virus formulations were investigated in the light scattering mode by NTA to assess the total number of particles. As expected, we found a rather broad size distribution, from ca. 40 nm to 1500 nm equivalent diameter (Fig. S1†) with a total concentration of (2.4 ± 0.19) × 1011 particles per mL (for the stock solution). The largest fraction of the detected particles fell in the 100–200 nm range and tailed towards larger sizes (Fig. S1†), however, this formulation may still include cell debris and other membrane or molecular aggregates. To reveal RSV viruses among these by selective fluorescent labelling, we used the H8 aptamer that we found earlier to possess the highest affinity towards attachment glycoprotein (G) of the RSV.24 The RSV sample (10× diluted stock solution) was incubated for 1 h with 625-fold excess of the aptamer (25 nM) with respect to the total particle concentration and the counting was performed in fluorescence mode. To avoid photobleaching, the labelled virus formulations were flown continuously through the sensing zone to reduce their residence in the laser beam.It should be stressed that in contrast to the nanoparticle tracking analysis of fluorescent particles with “whole volume fluorescence” (e.g. fluorescent polymer beads) in our case only the surface of the virus particles is fluorescently labelled. The challenge is further increased by the fact that after labelling, the free fluorescent aptamers are not separated from the virus particles. Such a separation-free detection clearly adds to the convenience of the method as the separation may affect both the size and concentration of the virus samples.29 Since the size of the free fluorescent aptamer is much smaller than the lower detection limit of NTA in terms of size (∼40 nm for these types of particles) they cannot be detected as separate fluorescent entities, but only as an increase in the fluorescent background. In contrast, we expected a significantly higher local concentration of the fluorescent aptamers binding to the RSV surface than that of the free aptamer concentration (Fig. S2B and C†). While accurate surface densities of glycoprotein G were not reported when considering a 100 nm diameter virus particle and only 100 aptamers per virus that would amount to a local concentration of fluorescent aptamers of ca. 320 nM, which is already more than an order of magnitude larger than that of the free aptamer. Indeed, while the unlabelled virus gave no fluorescence signal, the fluorescently labelled formulation provided clearly detectable fluorescent particles, i.e., (5.8 ± 0.15) × 109 particles per mL (for the stock solution). This count however is significantly lower than that measured in light scattering mode. To rule out that this lower number of fluorescent particles is caused by any deficiency of the aptamer binding to the glycoprotein G or lack of these proteins on some of the viral particles as suggested earlier,19 the same experiment was repeated using fluorescent polyclonal antibodies specific to all RSV viral antigens. The size distribution histograms for both aptamer- and polyclonal antibody-based fluorescent labeling of virus particles were comfortingly identical (Fig. 3A).
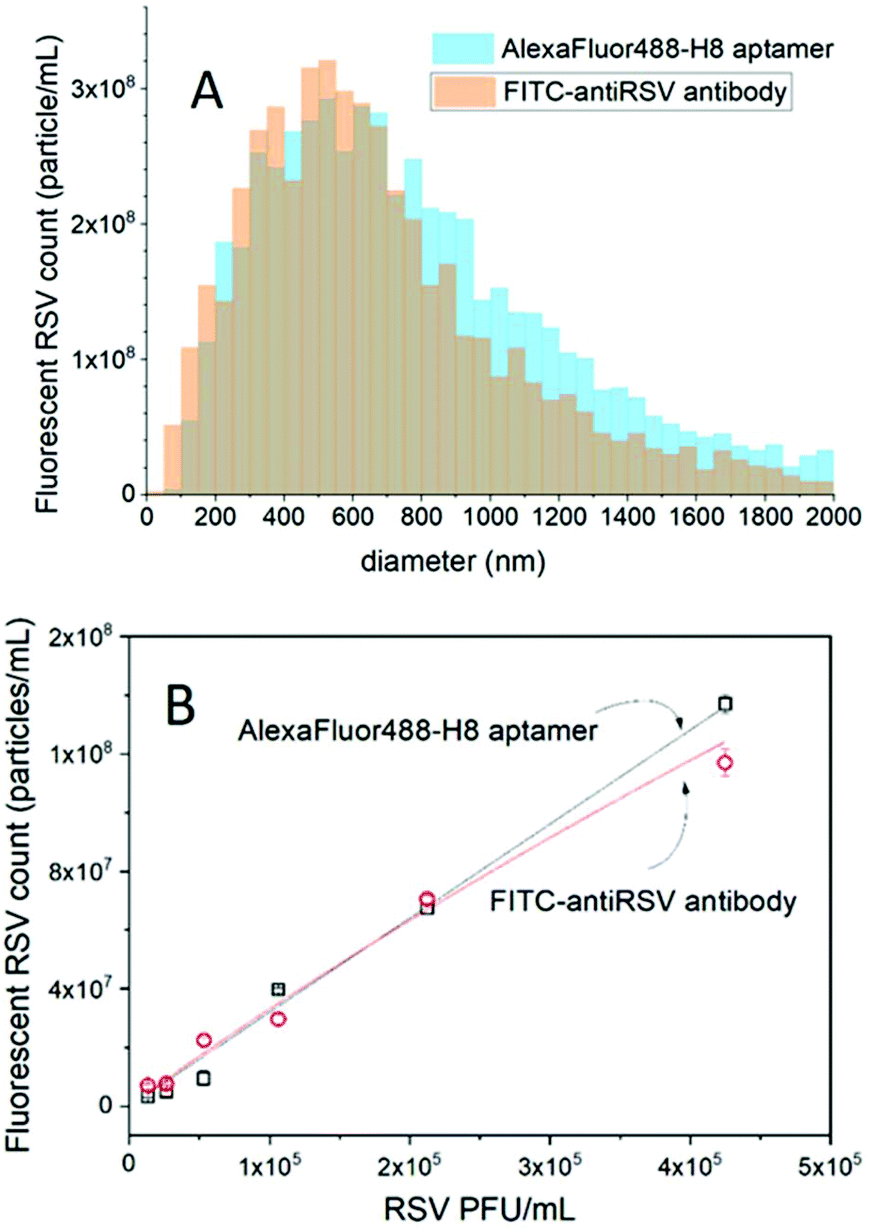 | ||
| Fig. 3 (A) Size distribution of RSV viruses detected by NTA in fluorescence mode after labelling with fluorescent H8 aptamer and polyclonal RSV antibody. (B) NTA determined fluorescent RSV concentrations upon dilution of the RSV formulation. | ||
Owing to the very large heterogeneity of RSV in terms of the size and packing density of glycoproteins,19 it is difficult to estimate the number of glycoproteins (G) that need to be saturated by the fluorescent labeled aptamers. Increasing the aptamer concentration is not a reasonable option because it also elevates the fluorescent background that makes the fluorescent RSV particle detection difficult. However, by diluting the virus formulation a close to linear relationship was obtained between the number of detected virus particles and the viral concentration expressed in PFU mL−1. At the highest dilution, the aptamer is ∼3.2 × 10⁶-fold excess in respect of the virus particles, thus the obtained linear relationship suggests that sufficient aptamers are available throughout the studied concentration range for the fluorescence visualization of the virus particles. The number of polyclonal antibody- and aptamer-labeled virus particles was found to be in excellent agreement, with the aptamer prevailing in terms of larger linear range at higher virus concentrations (Fig. 3B).
Thus, after we ruled out contingent deficiencies of the aptamer binding and virus labelling, the most likely explanation for the much lower particle count in fluorescence than in light scattering remains that the RSV preparations even after the purification steps contain a large quantity of cell debris. This assumption is also supported by the much smaller concentration of the infectious particles (PFUe) than the total RSV particles given by the fluorescent counting providing a particle-to-PFU ratio of 3200. These findings show clearly the utility and importance of the selective virus counting methodology proposed here in terms of virus standardization and characterization.
Detection of RSV in throat swab samples
To investigate the feasibility of the selective detection of RSV in clinically relevant matrices, throat swab samples collected from healthy individuals were used. First, it was demonstrated that the throat swab sample without the virus spiking does not contain any detectable fluorescent particles and does not affect the fluorescence of the Alexa488 labelled aptamer (Fig. S3†). Next, the 10-fold diluted throat swab samples were spiked with various concentrations of RSV. These samples were incubated with H8, B10 and E10 aptamers to investigate the influence of their relative affinity on the fluorescent RSV count. The results of the fluorescent NTA measurements performed on throat swab samples were compared with RSV samples formulated solely in PBS (Fig. 4A). We found a close to linear dependence between the fluorescent RSV count and the virus concentration for both PBS and throat swab samples with an insignificant effect of the choice of aptamers on the sensitivity. Although, the slope of the response in throat swab samples was ca. 1/3 of that of solely PBS-based formulations, the results show clearly that RSV particles can be detected even in complex throat swab samples. Of note, since this method is capable of detecting single RSV particles, the limit of detection in terms of concentration is in fact solely determined by the analysis time, i.e., for smaller concentrations, larger sample volumes need to be passed through the cell, but for this proof of concept study we limited the analysis time to max. 20 min. There is no change in the size distribution of the RSV viruses detected in the two media (Fig. 4B), which rules out contingent aggregation or selective loss of a size fraction. Since the throat swab sample was found to not affect the fluorescence of the aptamers, the most likely reason for the lower fluorescence RSV count is the competitive displacement of the aptamers by constituents of the sample matrix, in particular the DNA background present in physiological samples.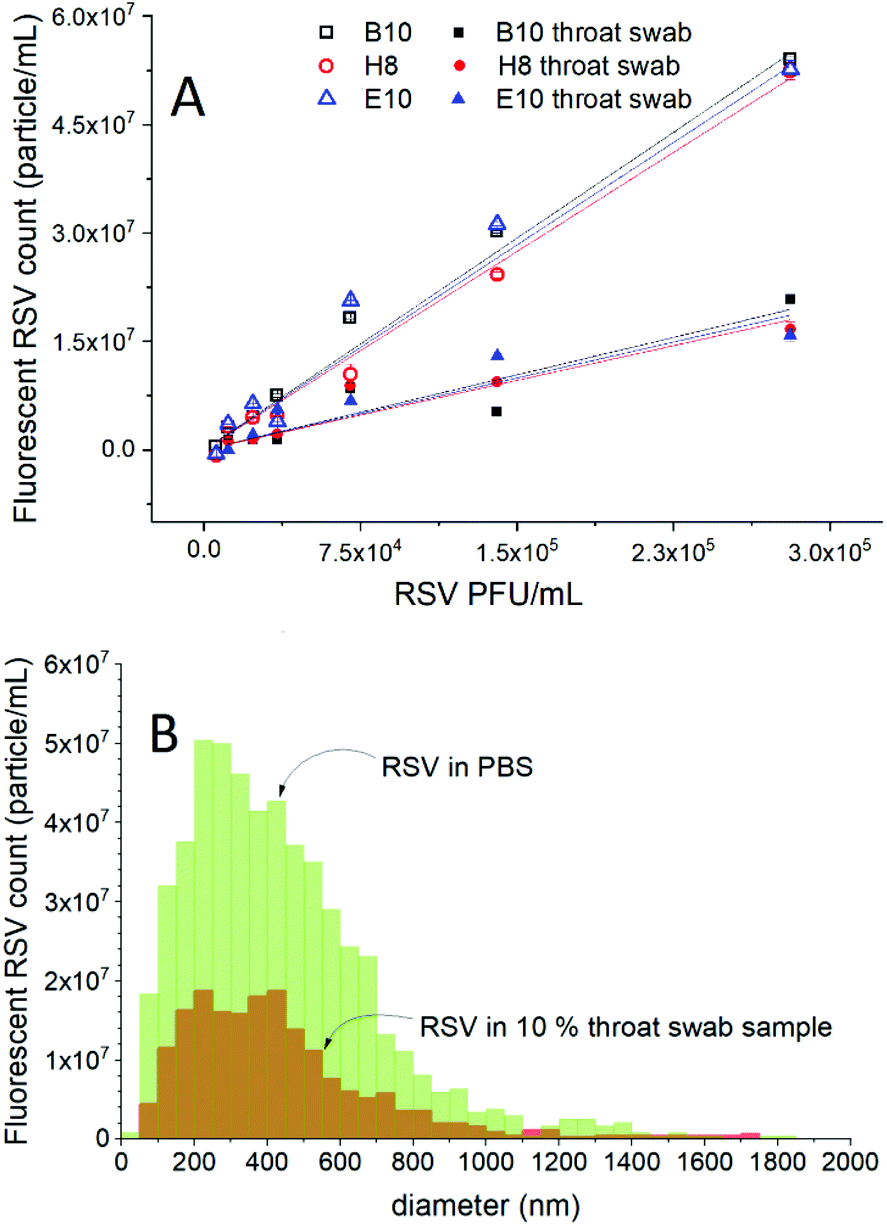 | ||
| Fig. 4 Comparison of the fluorescent RSV count (A) and size distributions (B) detected after selective fluorescent labelling using different aptamers (25 nM) in PBS formulated RSV and 10-fold diluted throat swab samples. | ||
This assumption seems to be confirmed by fluorescence polarization assays in which different DNA backgrounds were established using salmon sperm DNA and the increasing DNA concentration led to decreasing FP values, i.e., removal of the fluorescent aptamers from RSV (Fig. S4†). The lower number of aptamers that bind to a virus particle as a result of competitive action of the sample matrix may reduce the number of detectable RSV particles, which could explain the sensitivity discrepancy of RSV determination in “pure” formulations and throat swab samples. However, even at DNA concentrations as high as 4 μg mL−1 the aptamer could not be fully displaced from the RSV indicating clinical applicability of the presented method.
In terms of virus counting, the matrix effect of the throat swab samples clearly results in a negative bias. Therefore, while fluorescent nanoparticle tracking analysis is an absolute method and requires no calibration standards, its direct use for such sample matrices makes the quantitation of RSV to be associated with a high level of uncertainty. This problem can be circumvented if the matrix effect on the RSV count is determined by standard addition, i.e., after the fluorescent RSV count is determined in the throat swab sample, the sample is spiked with RSV standards of known concentrations. The ratio of the detected and nominal concentration of the RSV standard can be used as a correction factor to adjust the RSV concentration determined in throat swab samples. Given the variability of the throat swab samples among individuals, this procedure is best to be applied for each individual throat swab sample. Table 1 demonstrates that using this standard addition technique the error in the quantification of RSV in throat swab samples can be reduced to ca. 25%.
| RSV count (particles per mL) | Recovery (%) | |
|---|---|---|
| Spiked | Measured | |
| 5.53 × 10⁷ | 5.74 × 10⁷ (±5.62 × 10⁶) | 103.8 |
| 8.43 × 10⁷ | 6.37 × 10⁷ (±7.84 × 10⁶) | 75.6 |
Conclusions
In summary, here we show that single RSV particle detection is feasible by fluorescent nanoparticle tracking analysis following their selective labelling with fluorescent aptamers. Given the size discrimination capability of the method, the detection of fluorescently labelled RSV could be achieved even without separating the labelled virus from the free fluorescent aptamer. Thus this calibration-free counting and sizing method with little sample preparation is expected to be very appealing for virologists in terms of virus standardization. Moreover, given the single species detection ability of the proposed methodology, the selective detection of RSV was straightforward even in clinically relevant complex samples, such as diluted throat swab samples. However, the quantification of RSV in throat swab samples is complicated by a matrix effect (most likely a competitive effect) that results in a reduction of the fluorescent RSV count. We could circumvent this problem by correcting the matrix effect using standard addition, but we foresee other possibilities in terms of improved receptor design. The very promising results for RSV, which is a difficult target, owing to its heterogeneity and variability in size and shape, suggest that the methodology may be generally applicable for viruses larger than ca. 80–100 nm. Certainly, the application of this method requires a sufficiently low background fluorescence of the sample matrix for the detection of the virus particles. However, this may be addressed by using fluorophores and spectral ranges that minimize the autofluorescence of the sample.Conflicts of interest
The authors declare no conflicts of interest.Acknowledgements
This work was supported by the Lendület program of the Hungarian Academy of Sciences (LP2013-63), ERA-Chemistry (OTKA NN117637) and the BME-Nanotechnology FIKP grant of EMMI (BME FIKP-NAT). Marc Eleveld is gratefully acknowledged for the production of the RSV stocks.References
- C. H. van den Kieboom, S. L. van der Beek, T. Meszáros, R. E. Gyurcsányi, G. Ferwerda and M. I. de Jonge, TrAC, Trends Anal. Chem., 2015, 74, 58–67 CrossRef.
- D. Raoult and P. Forterre, Nat. Rev. Microbiol., 2008, 6, 315 CrossRef PubMed.
- C. A. Rossi, B. J. Kearney, S. P. Olschner, P. L. Williams, C. G. Robinson, M. L. Heinrich, A. M. Zovanyi, M. F. Ingram, D. A. Norwood and R. J. Schoepp, Viruses, 2015, 7, 857–872 CrossRef PubMed.
- P. Roingeard, Biol. Cell., 2008, 100, 491–501 CrossRef PubMed.
- J. L. Huff, M. P. Lynch, S. Nettikadan, J. C. Johnson, S. Vengasandra and E. Henderson, J. Biomol. Screening, 2004, 9, 491–497 CrossRef PubMed.
- S. Faez, Y. Lahini, S. Weidlich, R. F. Garmann, K. Wondraczek, M. Zeisberger, M. A. Schmidt, M. Orrit and V. N. Manoharan, ACS Nano, 2015, 9, 12349–12357 CrossRef PubMed.
- I. Makra, P. Terejánszky and R. E. Gyurcsányi, MethodsX, 2015, 2, 91–99 CrossRef PubMed.
- S. M. Scherr, G. G. Daaboul, J. Trueb, D. Sevenler, H. Fawcett, B. Goldberg, J. H. Connor and M. S. Unlu, ACS Nano, 2016, 10, 2827–2833 CrossRef PubMed.
- B. Carr, A. Siupa, P. Hole, A. Malloy and C. Hannell, Hum. Gene Ther., 2012, 23, A8–A9 CrossRef PubMed.
- P. Kramberger, M. Ciringer, A. Strancar and M. Peterka, Virol. J., 2012, 9 Search PubMed.
- P. Terejánszky, I. Makra, P. Fürjes and R. E. Gyurcsányi, Anal. Chem., 2014, 86, 4688–4697 CrossRef PubMed.
- Z. D. Harms, K. B. Mogensen, P. S. Nunes, K. M. Zhou, B. W. Hildenbrand, I. Mitra, Z. N. Tan, A. Zlotnick, J. P. Kutter and S. C. Jacobson, Anal. Chem., 2011, 83, 9573–9578 CrossRef PubMed.
- K. M. Zhou, L. C. Li, Z. N. Tan, A. Zlotnick and S. C. Jacobson, J. Am. Chem. Soc., 2011, 133, 1618–1621 CrossRef PubMed.
- J. D. Uram, K. Ke, A. J. Hunt and M. Mayer, Small, 2006, 2, 967–972 CrossRef PubMed.
- B. Carr, A. Malloy and J. Warren, IPT, 2008, 38–40 Search PubMed.
- B. Carr, Bio. Tech. Int., 2009, 21, 23–25 Search PubMed.
- D. Griffiths, P. Hole, J. Smith, A. Malloy and B. Carr, Nanotech, 2010, 3, 176–179 Search PubMed.
- O. Hayden, P. A. Lieberzeit, D. Blaas and F. L. Dickert, Adv. Funct. Mater., 2006, 16, 1269–1278 CrossRef.
- L. Liljeroos, M. A. Krzyzaniak, A. Helenius and S. J. Butcher, Proc. Natl. Acad. Sci. U. S. A., 2013, 110, 11133–11138 CrossRef PubMed.
- T. Bachi and C. Howe, J. Virol., 1973, 12, 1173–1180 Search PubMed.
- L. S. Eiland, J. Pediatr. Pharmacol. Ther., 2009, 14, 75–85 Search PubMed.
- T. Popow-Kraupp and J. H. Aberle, Open Microbiol. J., 2011, 5, 128–134 CrossRef PubMed.
- M. Vissers, M. N. Habets, I. M. L. Ahout, J. Jans, M. I. de Jonge, D. A. Diavatopoulos and G. Ferwerda, J. Visualized Exp., 2013, 50766, DOI:10.3791/50766.
- K. Percze, Z. Szakács, E. Scholz, J. András, Z. Szeitner, C. H. van den Kieboom, G. Ferwerda, M. I. de Jonge, R. E. Gyurcsányi and T. Meszáros, Sci. Rep., 2017, 7 Search PubMed.
- M. Shafique, J. Wilschut and A. de Haan, Vaccine, 2012, 30, 597–606 CrossRef PubMed.
- D. M. Jameson and W. H. Sawyer, in Methods in Enzymology, Academic Press, 1995, vol. 246, pp. 283–300 Search PubMed.
- G. Lautner, Z. Balogh, V. Bardoczy, T. Mészáros and R. E. Gyurcsányi, Analyst, 2010, 135, 918–926 RSC.
- M. Menger, A. Yarman, J. Erdőssy, H. B. Yildiz, R. E. Gyurcsányi and F. W. Scheller, Biosensors, 2016, 6 Search PubMed.
- P. Terejánszky, I. Makra, A. Lukács and R. E. Gyurcsányi, Electroanalysis, 2015, 27, 595–601 CrossRef.
Footnote |
| † Electronic supplementary information (ESI) available: Size distribution of the virus formulation in light scattering mode, snapshots of NTA measurements, fluorescence quenching and competition experiments. See DOI: 10.1039/c8nr01310a |
| This journal is © The Royal Society of Chemistry 2018 |