Pseudocapacitance-boosted ultrafast Na storage in a pie-like FeS@C nanohybrid as an advanced anode material for sodium-ion full batteries†
Bao-Hua
Hou
a,
Ying-Ying
Wang
a,
Jin-Zhi
Guo
a,
Qiu-Li
Ning
a,
Xiao-Tong
Xi
a,
Wei-Lin
Pang
a,
An-Min
Cao
 b,
Xinlong
Wang
 a,
Jing-Ping
Zhang
 a and
Xing-Long
Wu
 *ab
*ab
aNational & Local United Engineering Laboratory for Power Batteries, Faculty of Chemistry, Northeast Normal University, Changchun, Jilin 130024, P. R. China. E-mail: xinglong@nenu.edu.cn
bBeijing National Laboratory for Molecular Sciences (BNLMS), Key Laboratory of Molecular Nanostructure and Nanotechnology, Institute of Chemistry, Chinese Academy of Sciences (CAS), Beijing 100190, PR China
First published on 12th April 2018
Abstract
In order to develop promising anode materials for sodium-ion batteries (SIBs), a novel pie-like FeS@C (P-FeS@C) nanohybrid, in which all ultrasmall FeS nanocrystals (NCs) are completely embedded into the carbon network and sealed by a protective carbon shell, has been prepared. The unique pie-like structure can effectively speed up the kinetics of electrode reactions, while the carbon shell stabilizes the FeS NCs inside. Studies show that the electrochemical reaction processes of P-FeS@C electrodes are dominated by the pseudocapacitive behavior, leading to an ultrafast Na+-insertion/extraction reaction. Hence, the prepared P-FeS@C nanohybrid exhibits superior Na-storage properties especially high rate capability in half cells. For example, it can deliver reversible capacities of 555.1 mA h g−1 at 0.2 A g−1 over 150 cycles and about 60.4 mA h g−1 at 80 A g−1 (an ultrahigh current density even higher than that of the capacitor test). Furthermore, an advanced P-FeS@C//Na3V2(PO4)2O2F full cell has been assembled out, which delivers a stable specific capacity of 441.2 mA h g−1 after 80 cycles at 0.5 A g−1 with a capacity retention of 91.8%.
Introduction
In recent years, sodium-ion batteries (SIBs) have attracted a great deal of attention as a promising alternative for lithium-ion batteries (LIBs) towards stationary energy storage because of the high natural abundance of Na resources in the Earth's crust and much lower prices.1–4 However, the ionic radius of Na is larger than that of Li, which leads to a much more sluggish Na-diffusion kinetics and makes it difficult to match with some traditional anode materials of LIBs, such as the market-dominant graphite anode.5–7 Therefore, it is highly imperative to develop superior anode materials with high Na-storage capacity, high rate capability and long-term cycle life.8–10 To date, various anode materials have been studied, including alloying elements, metal oxides and transition-metal chalcogenides.1,11–13 Among them, transition-metal chalcogenides based on conversion reactions are attracting more and more attention owing to their high theoretical Na-storage capacity.Considering its high abundance in nature, cheap raw materials and environmental benignity, FeS has been proposed as a promising anode material for batteries.11 Previously, FeS has been extensively studied in LIBs for a long time. Nevertheless, less reports are majored on SIBs, which should be mainly due to the huge volume variation during the successive de-/sodiation processes and its low electronic conductivity, leading to the poor cycling stability and rate capability.14,15 To solve these problems, preparing nanometer-sized structures and constructing hybrid electrodes with an appropriate carbon network have been proven to be two effective methods.16,17 While the nanometer-sized materials can relax the strain caused by the volume variation and shorten the diffusion pathway of sodium ions to improve the rate capability, the appropriate carbon networks provide fast electron conducting pathways and serve as a skeleton to improve the structural stability of the whole electrodes.18,19 Thus, it is crucial to design an ideal FeS/C hybrid structure which can combine the advantages of both methods.20–22
Herein, we have successfully prepared a novel pie-like FeS@C (P-FeS@C) nanohybrid, in which all ultrasmall FeS nanocrystals (NCs) are totally embedded into the carbon network and sealed by a protective carbon shell with the existence of rich mesopores. It was found that the unique pie-like structure can effectively speed up the electrochemical reaction kinetics and stabilize the active FeS NCs, thereby making the prepared FeS@C nanohybrid exhibit a pseudocapacitance-boosted ultrafast sodium storage performance and superior cycling stability when used as an anode material in SIBs. It delivers high reversible Na-storage capacities of 547.1 mA h g−1 at 0.05 A g−1 and 206.2 mA h g−1 at a high current density of 35 A g−1. More surprisingly, even at an ultrahigh current density of 80 A g−1, a value higher than is mostly used for the capacitor test, the delivered specific capacity is still 60.4 mA h g−1. Meanwhile, a high cycling stability was also exhibited, e.g., a Na-storage capacity of 555.1 mA h g−1 at 0.2 A g−1 over 150 cycles without any capacity decay. Moreover, an advanced P-FeS@C//NVPOF (here, NVPOF represents a high-voltage cathode of Na3V2(PO4)2O2F recently developed by us)23 full cell was further assembled, which delivers a reversible capacity of 441.2 mA h g−1 after 80 cycles based on the mass of the P-FeS@C anode material at 0.5 A g−1.
Experimental
Preparation of P-FeS@C
Briefly, Tween-80 surfactant (5 mL) and deionized water (150 mL) were mixed together by ultrasonication. Meanwhile, FeCl3·6H2O (2 g) and CO(NH2)2 (4.5 g) were dissolved into 10 mL ethanol and 10 mL deionized water, respectively. Next, the FeCl3 solution and the CO(NH2)2 solution were added into Tween-80 containing solution to form a homogeneous suspension by ultrasonication. After another stirring of 6 hours at 120 °C in an oil bath, the resulting precursors were centrifuged, washed with ethanol (thrice) and dried at 80 °C for 10 h. Finally, the as-prepared precursor was mixed with S powders by grinding and then annealing at 500 °C for 4 h in a quartz tube under an inert N2 atmosphere with a heating rate of 2 °C min−1. The mass ratio of the as-prepared precursor and S powders was 1![[thin space (1/6-em)]](https://www.rsc.org/images/entities/char_2009.gif) :
:![[thin space (1/6-em)]](https://www.rsc.org/images/entities/char_2009.gif) 1.
1.
Material characterization
The morphologies of all products were characterized by scanning electron microscopy (SEM, HITACHI-SU8010, 10 kV) and transmission electron microscopy (TEM, JEOL-2100 F, 200 kV) with an energy dispersive X-ray spectroscopy (EDX) analysis. X-ray diffraction patterns (XPS) were collected on a Rigaku D/max200PC diffractometer using Cu Kα radiation (λ = 1.5406 Å). X-ray photoelectron spectroscopy data (XRD) were obtained using an ESCALab220i-XL electron spectrometer from VG Scientific using 300 W Al Kα radiation. The N2 adsorption–desorption curve was obtained from an Automatic Micropore and Mesopore Analyzer (ASAP 2020M). The thermogravimetric analysis (TGA) curve was obtained under an air atmosphere with a heating rate of 10 °C min−1.Electrochemical measurements
Electrochemical performances were analyzed in the CR2032 coin-type cells. The working electrodes were prepared by mixing the active material, acetylene black and carboxymethylcellulose sodium (CMC) in a weight ratio of 80![[thin space (1/6-em)]](https://www.rsc.org/images/entities/char_2009.gif) :
:![[thin space (1/6-em)]](https://www.rsc.org/images/entities/char_2009.gif) 10
10![[thin space (1/6-em)]](https://www.rsc.org/images/entities/char_2009.gif) :
:![[thin space (1/6-em)]](https://www.rsc.org/images/entities/char_2009.gif) 10 in deionized water. Then the as-obtained mixture was coated on copper foil followed by vacuum-drying at 60 °C for 12 h before assembly and test. The loading density of the active material on the work electrodes is about 1.5–2.0 mg cm−2. The electrolyte solution was 1.0 mol L−1 NaClO4 in ethylene carbonate (EC)/propylene carbonate (PC) (1
10 in deionized water. Then the as-obtained mixture was coated on copper foil followed by vacuum-drying at 60 °C for 12 h before assembly and test. The loading density of the active material on the work electrodes is about 1.5–2.0 mg cm−2. The electrolyte solution was 1.0 mol L−1 NaClO4 in ethylene carbonate (EC)/propylene carbonate (PC) (1![[thin space (1/6-em)]](https://www.rsc.org/images/entities/char_2009.gif) :
:![[thin space (1/6-em)]](https://www.rsc.org/images/entities/char_2009.gif) 1 by volume), plus 5 wt% FEC. Glass fiber (GF/D) from Whatman were used as a separator and pure sodium foils were used as a counter electrode. The cell assembly was conducted in an Ar-filled glovebox followed by an overnight aging before test. For full-cell assembly, Na3V2(PO4)2O2F was used instead of the metallic sodium. The Na3V2(PO4)2O2F electrodes were prepared using the same procedures as the preparation of Fe3O4@FeS anodes. In order to match the cathode/anode capacity, there is a slight excess capacity of anode compared with the cathode, and the mass ratio of P-FeS@C to Na3V2(PO4)2O2F was about 1
1 by volume), plus 5 wt% FEC. Glass fiber (GF/D) from Whatman were used as a separator and pure sodium foils were used as a counter electrode. The cell assembly was conducted in an Ar-filled glovebox followed by an overnight aging before test. For full-cell assembly, Na3V2(PO4)2O2F was used instead of the metallic sodium. The Na3V2(PO4)2O2F electrodes were prepared using the same procedures as the preparation of Fe3O4@FeS anodes. In order to match the cathode/anode capacity, there is a slight excess capacity of anode compared with the cathode, and the mass ratio of P-FeS@C to Na3V2(PO4)2O2F was about 1![[thin space (1/6-em)]](https://www.rsc.org/images/entities/char_2009.gif) :
:![[thin space (1/6-em)]](https://www.rsc.org/images/entities/char_2009.gif) 4. Prior to the fabrication of full cells, chemical pre-sodiation for the P-FeS@C anode was performed to activate the material and stabilize the electrode surface. Cyclic voltammograms (CVs) were performed on the CHI 606E electrochemical workstation at different scan rates from 0.01 to 2.8 V. The galvanostatic charge/discharge tests were carried out on the LAND-CT2001A battery-testing system in the voltage range of 0.01–2.8 V vs. Na+/Na at various current densities. Electrochemical impedance spectroscopy (EIS) was performed with an amplitude voltage of 5 mV in the frequency range from 1 MHz to 100 mHz by using a PMC2000 (Princeton Applied Research).
4. Prior to the fabrication of full cells, chemical pre-sodiation for the P-FeS@C anode was performed to activate the material and stabilize the electrode surface. Cyclic voltammograms (CVs) were performed on the CHI 606E electrochemical workstation at different scan rates from 0.01 to 2.8 V. The galvanostatic charge/discharge tests were carried out on the LAND-CT2001A battery-testing system in the voltage range of 0.01–2.8 V vs. Na+/Na at various current densities. Electrochemical impedance spectroscopy (EIS) was performed with an amplitude voltage of 5 mV in the frequency range from 1 MHz to 100 mHz by using a PMC2000 (Princeton Applied Research).
Results and discussion
The P-FeS@C nanohybrid was successfully prepared by a simple solution reaction followed by an annealing process with sulfur (S) powder as shown in Fig. 1a. Fig. 1b is the XRD pattern of the prepared product, showing that all the peaks are well indexed to the standard card of FeS (PDF#65-9124),24 except for the very broad peak centered at 23° assigned to amorphous carbon in the nanohybrid. Meanwhile, the TGA was carried out to determine the FeS content of around 85 wt% (Fig. S1†) in the P-FeS@C.25 The preparation procedures for the products are further discussed in detail. Firstly, the Fe-containing precursor (a coordination compound of [Fe{OC(NH2)2}6]Cl3) was derived from the solution reaction by in situ nucleation growth under the induction of the surfactant (Tween-80). Fig. 1c is the SEM image of such an Fe-containing precursor which is composed of urchin-like particles with a diameter of about 500 nm. After annealing with S powder, a pie-like particle was formed under the effect of high temperature and the stress caused by rapid vaporization of sulfur powder, as shown in Fig. 1d and S2.† In this procedure, the S powder plays two roles, viz., (1) the sulfur sources were used to sulfurize the Fe-containing precursor to form FeS; (2) the raw materials to produce sulfur vapor quickly to promote the formation of P-FeS@C nanohybrids. The SEM image (Fig. 1d) of P-FeS@C shows that the diameter of the pie-like particles was about 200 nm and the thickness was about 60 nm. In addition, in the process of sulfurization, the carbon from the precursor has a great effect on the performance of the SIBs, which limits the growth of FeS, resulting in the formation of ultrasmall FeS NCs.20,26,27 The HRTEM image of P-FeS@C (Fig. 2a) demonstrates the presence of a lot of ultrasmall FeS NCs (about 4–10 nm), which are fully embedded in the conductive carbon networks and covered by a protective carbon shell with a thickness of 1–2 nm. The ultrasmall FeS NCs and the pie-like structure can shorten the transfer distance of sodium ions, suggesting the enhanced Na-diffusion kinetics.28,29 Furthermore, it can be found that the carbon shell outside has some obvious lattice fringes as shown in Fig. 2a, which indicates that the carbon network has a certain degree of graphitization. In order to further illustrate this point, Raman spectroscopy of P-FeS@C was carried out as shown in Fig. S3.† The Raman spectra present prominent D-bands at about 1330 cm−1 (the defect-induced band) and G-bands at about 1560 cm−1 (the crystalline graphite band), respectively. The value of ID/IG was 1.1, which means that the carbon networks in P-FeS@C do have a certain degree of graphitization which is highly beneficial for improving the electronic conductivity and structural stability.26,30Fig. 2b shows the element mappings of C, O, S and Fe in the P-FeS@C, where the uniform distribution of each element demonstrated the homogeneity of the as-prepared materials.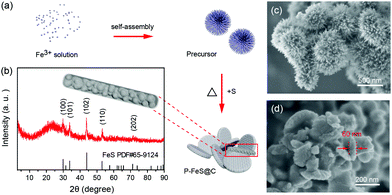 | ||
| Fig. 1 (a) The preparation procedures, (b) XRD pattern, and (d) SEM image of the P-FeS@C nanohybrid. (c) SEM image of the precursor for the preparation of P-FeS@C. | ||
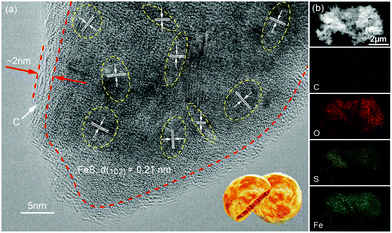 | ||
| Fig. 2 (a) HRTEM image and (b) the elemental (C, O, S and Fe) mapping images of the P-FeS@C nanohybrid. | ||
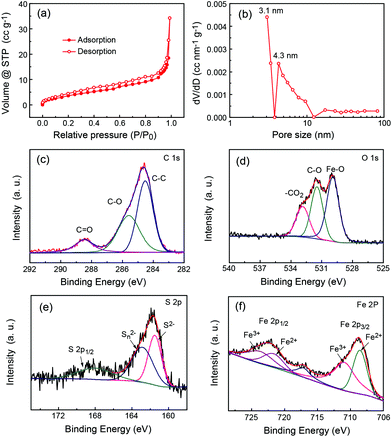
The isothermal nitrogen adsorption/desorption measurement was further carried out to study the pore properties. Fig. 3a shows the typical nitrogen sorption isotherms of P-FeS@C which are type IV adsorption isotherms, indicating the existence of many mesopores in them as reported previously.2,31,32 The fitting results (Fig. 3b and S4†) show that the mesopore size in P-FeS@C is concentrated at 3 nm, which should be caused by the sulphur vapour. The rich pore structure is helpful to alleviate the volume change during charging and discharging, and meanwhile they can improve the migration speed of the Na ion.10,33,34 The chemical state and molecular environment of P-FeS@C were characterized by XPS. XPS full spectra confirm the presence of C, O, S and Fe as shown in Fig. S5.† In the C 1s spectrum (shown in Fig. 3c), the peaks present at binding energies of 284.6 eV, 285.6 eV, and 288.5 eV correspond to the C–C, C–O, and C![[double bond, length as m-dash]](https://www.rsc.org/images/entities/char_e001.gif) O functional groups, respectively.35–37 Small amounts of C–O and C
O functional groups, respectively.35–37 Small amounts of C–O and C![[double bond, length as m-dash]](https://www.rsc.org/images/entities/char_e001.gif) O functional groups are in favor of providing active sites to immobilize FeS. Fig. 3d shows the O 1s XPS spectrum of P-FeS@C, the peaks at 529.9, 531.5 and 532.8 eV correspond to the Fe–O, C–O and O–C
O functional groups are in favor of providing active sites to immobilize FeS. Fig. 3d shows the O 1s XPS spectrum of P-FeS@C, the peaks at 529.9, 531.5 and 532.8 eV correspond to the Fe–O, C–O and O–C![[double bond, length as m-dash]](https://www.rsc.org/images/entities/char_e001.gif) O functional groups, respectively.38–40 The presence of Fe–O proves that there is an interaction between FeS and the carbon shell in the materials. In the S 2p spectrum (Fig. 3e), the peak at 161.5 eV is the characteristic peak of FeS corresponding to S2−, whereas the polysulfide (Sn2−) is detected following oxidation, and the peak at 168.1 eV is the spin–orbit of S 2p1/2.41Fig. 3f shows the Fe 2p XPS spectrum of P-FeS@C. The peaks observed at the binding energies of 708.7 eV and 722.4 eV can be ascribed to the Fe2+ states of FeS. And the peaks at binding energies of 711.2 eV and 724.2 eV can be ascribed to Fe3+ states which are characteristic of Fe2O3 rather than FeS, this is because the surface of FeS is converted into Fe2O3 due to its high reactivity towards oxygen.42
O functional groups, respectively.38–40 The presence of Fe–O proves that there is an interaction between FeS and the carbon shell in the materials. In the S 2p spectrum (Fig. 3e), the peak at 161.5 eV is the characteristic peak of FeS corresponding to S2−, whereas the polysulfide (Sn2−) is detected following oxidation, and the peak at 168.1 eV is the spin–orbit of S 2p1/2.41Fig. 3f shows the Fe 2p XPS spectrum of P-FeS@C. The peaks observed at the binding energies of 708.7 eV and 722.4 eV can be ascribed to the Fe2+ states of FeS. And the peaks at binding energies of 711.2 eV and 724.2 eV can be ascribed to Fe3+ states which are characteristic of Fe2O3 rather than FeS, this is because the surface of FeS is converted into Fe2O3 due to its high reactivity towards oxygen.42
The electrochemical properties of the P-FeS@C nanohybrid for Na storage were discussed in the half cell in detail. The annealing temperature and time were optimized firstly. Fig. S6† shows the XRD patterns of P-FeS@C with different annealing temperatures (450, 500 and 600 °C). It reveals that FeS can only be formed in more than 500 °C. P-FeS@C at 500 °C shows a better rate capability and cycling stability compared to P-FeS@C at 600 °C (Fig. S7†), owing to the pie-like structure formed at 500 °C rather than the bulk at 600 °C as shown in Fig. S8.† The XRD patterns (Fig. S9†), SEM images (Fig. S10†) and sodium storage performance (Fig. S11†) of P-FeS@C prepared at 500 °C with different times were analysed. The results show that the P-FeS@C can be obtained only by annealing at 500 °C for more than 4 h. When the annealing time is 2 h, although the pie-like structure was formed, Fe2O3 was not fully converted into FeS according to the XRD patterns. And when the annealing time was 8 h, the pie-like structure was destroyed. Thus, it is foreseeable that the FeS@C prepared at 500 °C for 4 h shows the best sodium storage performance, and it is the best condition to obtain P-FeS@C.
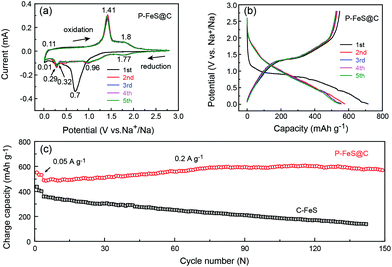
Fig. 4a presents the cyclic voltammograms (CVs) of P-FeS@C with the best performance for the first 5 cycles in a voltage range of 0.01–2.8 V. The first cathodic scan of P-FeS@C shows a large peak at 0.7 V and a small peak at 0.32 V which are probably related to the formation of solid-electrolyte interphase (SEI) layers and the conversion reactions from FeS to Fe and Na2S.26,41 During the anodic scans, two oxidation peaks are observed at 1.41 and 1.8 V, attributable to the formation of NaxFeS and FeS, respectively. From the second cathodic scan, the peak at 1.77 V is attributed to the insertion reaction of FeS + xNa + xe− → NasFeS and the peaks at 0.96 and 0.29 V correspond to the conversion reaction of NaxFeS into NaxS and Fe. It should be noted that the reductive/oxidation peaks at 0.01 and 0.11 are attributed to the insertion/extraction of Na+ into the carbon shell of P-FeS@C.14,43 The subsequent four CV curves show good repetition, indicating the good stability of P-FeS@C for Na-ion storage.14,44Fig. 4b shows the galvanostatic charge/discharge curves of P-FeS@C for the initial 5 cycles at a current density of 0.05 A g−1. The voltage plateau features are consistent with the CV curves. The discharge and charge capacities of the first cycle are 715.2 and 547.1 mA h g−1 with a coulombic efficiency of 76.5%. The initial irreversible capacity loss could be attributed to the formation of the SEI layer. The coulombic efficiency of P-FeS@C is at a relatively high level for the same type of materials which is attributed to the fully covered carbon shell of P-FeS@C.14,15,26,41,42 The carbon shell can avoid the direct contact of active materials and electrolytes to reduce the occurrence of side reactions and to form a stable SEI film. The cycling stability of P-FeS@C is shown in Fig. 4c. It exhibits a high reversible capacity of 555.1 mA h g−1 at 0.2 A g−1 over 150 cycles, without any capacity decay. The discharge capacities increased gradually during cycling, primarily due to the formation of a polymeric gel-like film on the surface of P-FeS@C resulting from electrolyte degradation, which has been observed in other transition metal oxides.25Fig. 5 shows the characterization of P-FeS@C after 100 cycles. The pie-like structure can be still observed from the SEM image (Fig. 5a), which verifies the stability of P-FeS@C. Furthermore, the HRTEM image indicates that the FeS NCs are still existent as shown in Fig. 5b, although the size of the FeS has increased, suggesting that the carbon network in the pie-like structure can effectively prevent the aggregation of the FeS NCs. In addition, the thickness of the carbon layers outside has also increased compared to the initial one as shown in Fig. 2a, it may be attributed to the growth of the SEI film on the surface of the carbon layers during the charging/discharging process.9,35,45Fig. 5c shows the element mappings of C, O, S and Fe in P-FeS@C after 100 cycles, where the uniform distribution of every element also proves the structure stability of the pie-like structure.
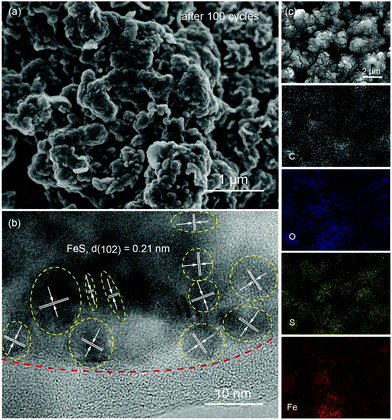 | ||
| Fig. 5 The (a) SEM and (b) HRTEM images, and (c) the elemental (C, O, S and Fe) mappings of the P-FeS@C nanohybrid electrode after 100 cycles. | ||
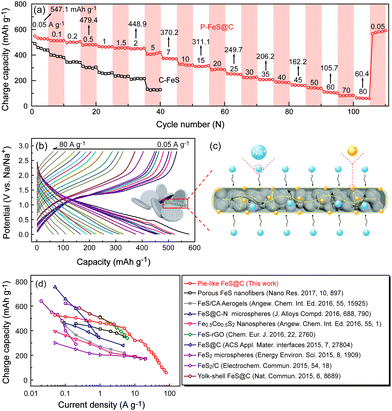
Furthermore, the rate capability of P-FeS@C was explored at different densities (Fig. 6a and b). The reversible capacities of P-FeS@C are 547.1, 479.4, 448.9, 370.2, and 311.1 mA h g−1 at 0.05, 0.5, 2, 7, to 15 A g−1, respectively. Even at a super high current density of 25, 35, 45, 60 and 80 A g−1, the capacities are still 249.7, 206.2, 162.2, 105.7 to 60.4 mA h g−1. When the current density decreased to 0.05 A g−1, the reversible capacity was recovered to 578.9 mA h g−1 after 120 cycles. As a comparison, the sodium storage performance of the commercial FeS (C-FeS) was also studied. Obviously, the C-FeS displays a poor rate capability and cycling stability which is mainly due to the low conductivity and the bulk structure (Fig. S12†). Fig. S13† shows the XRD pattern of C-FeS. The rate capability of the iron sulfide based anode materials for sodium ion storage reported up to now are summarized in Fig. 6d. P-FeS@C in this work shows excellent rate capability, especially at high rates, as anode materials for sodium ion batteries compared with iron-sulfide-based materials reported in the literatures.11,13–15,25,26,41,42,46 The outstanding performance of P-FeS@C stems from the unique pie-like structure as shown in Fig. 6c. First, the ultrasmall FeS NCs and the mesopores in the materials shorten the transfer distance of sodium ions to speed up the Na-ion diffusion kinetics. Second, the thin carbon shell outside produces excellent structure stability and allows helpful electronic contact. Furthermore, the electrochemical sodium storage properties of P-FeS@C are diagnosed using EIS. Fig. S14† shows the Nyquist plots of P-FeS@C and C-FeS after the first cycle in the frequency range of 1 MHz–0.1 Hz, both of which contain a depressed semicircle in the medium-to-high frequencies and a linear tail in the low frequencies. The diameter of the semicircle for P-FeS@C is much smaller than that of C-FeS, suggesting that P-FeS@C has a smaller contact and charge-transfer impedances.47 It also validates that such a novel pie-like structure can effectively improve the electrical conductivity of the FeS. As regards the linear tail in the low frequencies corresponding to the sodium-diffusion process, the apparent Na diffusion coefficient (Dapparent) of P-FeS@C and C-FeS was compared using the following equation:48
| Dapparent = R2T2/2A2n4F4C2σ2, | (1) |
| Zre = RD + RL + σω−1/2. | (2) |
Fig. S15† shows the variations and fittings of Zre and ω−1/2 (ω is the angular frequency) in the low-frequency region. It is clear that the slope σ of C-FeS is about twice as much as P-FeS@C, and the Dapparent can be compared from above eqn (1). The Dapparent of P-FeS@C is much larger than the one of C-FeS, confirming that a faster sodium ion diffusion process is operated in P-FeS@C. It is mainly due to the rich mesopores and ultrasmall FeS NCs in the pie-like structure which greatly shorten the ion transport distance and speed up the reaction kinetics. Hence, the pie-like structure is an ideal structure to achieve high rate capability and great cycling stability.
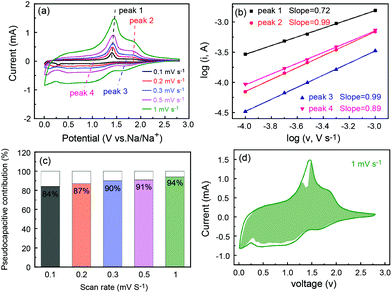
The superior rate capability prompted us to study the electrode process kinetics of P-FeS@C. Thus, the CV tests at different scan rates were carried out as shown in Fig. 7a. Obviously, the peak current (i) is not proportional to the square root of the scan rate (v), which suggests that the charge/discharge process contains faradaic and non-faradaic behaviors.50 There is a relationship between the peak current and scan rate as follows:51
| i = avb | (3) |
| log(i) = b × log(v) + log(a) | (4) |
| i = k1v + k2v1/2 | (5) |
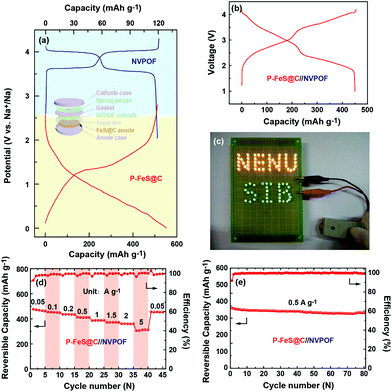
The excellent electrochemical performance of P-FeS@C encourages us to try to assemble a Na-ion full cell. NVPOF is used as a cathode material which is prepared following the method previously reported by our group.23,53,54 The characteristics of NVPOF are shown in Fig. S16 and S17.† In detail, the P-FeS@C//NVPOF full cell was assembled according to the scheme inserted in Fig. 8a. The charge and discharge curves of NVPOF and P-FeS@C in the Na-ion half-cell are shown in Fig. 8a. Fig. 8b shows the charge/discharge curves of the P-FeS@C//NVPOF full cell at 0.1 A g−1 which presents the comprehensive characteristics of both the cathode and anode with an average output voltage about 2.6 V. It is enough to light up 84 LED bulbs containing 48 yellow bulbs and 36 green bulbs as shown in Fig. 8c. The P-FeS@C//NVPOF full cell shows an outstanding sodium ion storage performance. As shown in Fig. 8d, when the current densities reach 0.05, 0.1, 0.2, 0.5, 1, 1.5, 2 and 5 A g−1, the reversible capacities are 477.2, 454.9, 436.1, 413.1, 386.5, 372.3, 360 and 305.7 mA h g−1. Fig. 8e shows the cycling stability of the P-FeS@C//NVPOF full cell, delivering a reversible capacity of 441.2 mA h g−1 after 80 cycles at 0.5 A g−1 with a capacity retention of 91.8% and a coulombic efficiency of about 99.5%. It should be noted that all the capacities are calculated by the mass of P-FeS@C.
Conclusions
In summary, a novel pie-like FeS@C (P-FeS@C) nanohybrid, in which all ultrasmall FeS NCs are totally embedded into the carbon network and sealed by a protective carbon shell, has been prepared. The unique pie-like structure has speeded up the reaction kinetics and stabilized the FeS NCs inside. The P-FeS@C nanohybrid exhibits an excellent rate capability and a superior cycling stability as an anode material of SIBs. It delivers 555.1 mA h g−1 at 0.2 A g−1 over 150 cycles, without any capacity decay. Even at 35 A g−1, the reversible capacity is still 140.8 mA h g−1. Incredibly, even at a high current density of 80 A g−1, the capacity is still 60.4 mA h g−1. Moreover, the P-FeS@C//NVPOF full cell shows a superior sodium ion storage performance, delivering a reversible capacity of 477.2 mA h g−1 at 0.05 A g−1. It should be noted that even up to 5 A g−1, the reversible capacity was still 305.7 mA h g−1. The superior performance of P-FeS@C enables it to become a promising anode material for SIBs. In view of the excellent sodium performance of this pie-like structure, it could also be extended to other cathode and anode materials, which will promote the development of next-generation electrochemical energy storage devices (SIBs/LIBs, supercapacitors and the hybrids) with both high-power and high-energy densities.Conflicts of interest
There are no conflicts to declare.Acknowledgements
This work was supported by the National Natural Science Foundation of China (51602048) and the Fundamental Research Funds for the Central Universities (2412017FZ013).Notes and references
- W. Luo, F. Shen, C. Bommier, H. Zhu, X. Ji and L. Hu, Acc. Chem. Res., 2016, 49, 231–240 CrossRef CAS PubMed.
- X. Xiong, G. Wang, Y. Lin, Y. Wang, X. Ou, F. Zheng, C. Yang, J.-H. Wang and M. Liu, ACS Nano, 2016, 10, 10953–10959 CrossRef CAS PubMed.
- X. Ge, Z. Li and L. Yin, Nano Energy, 2017, 32, 117–124 CrossRef CAS.
- J.-Z. Guo, F. Wan, X.-L. Wu and J.-P. Zhang, J. Mol. Sci., 2016, 32, 265–279 Search PubMed.
- Y. Jiang, M. Wei, J. Feng, Y. Ma and S. Xiong, Energy Environ. Sci., 2016, 9, 1430–1438 Search PubMed.
- S. Wang, L. Xia, L. Yu, L. Zhang, H. Wang and X. W. D. Lou, Adv. Energy Mater., 2016, 6, 1502217 CrossRef.
- K. Zhang, M. Park, L. Zhou, G.-H. Lee, W. Li, Y.-M. Kang and J. Chen, Adv. Funct. Mater., 2016, 26, 6728–6735 CrossRef CAS.
- Y. Zheng, T. Zhou, C. Zhang, J. Mao, H. Liu and Z. Guo, Angew. Chem., Int. Ed., 2016, 55, 3408–3413 CrossRef CAS PubMed.
- F. Zhang, C. Xia, J. Zhu, B. Ahmed, H. Liang, D. B. Velusamy, U. Schwingenschlögl and H. N. Alshareef, Adv. Energy Mater., 2016, 6, 1601188 CrossRef.
- F. Wan, J. Z. Guo, X. H. Zhang, J. P. Zhang, H. Z. Sun, Q. Yan, D. X. Han, L. Niu and X. L. Wu, ACS Appl. Mater. Interfaces, 2016, 8, 7790–7799 CAS.
- K. Zhang, M. Park, L. Zhou, G. H. Lee, J. Shin, Z. Hu, S. L. Chou, J. Chen and Y. M. Kang, Angew. Chem., Int. Ed., 2016, 55, 1–6 CrossRef.
- N. Yabuuchi, K. Kubota, M. Dahbi and S. Komaba, Chem. Rev., 2014, 114, 11636–11682 CrossRef CAS PubMed.
- Z. Hu, Z. Zhu, F. Cheng, K. Zhang, J. Wang, C. Chen and J. Chen, Energy Environ. Sci., 2015, 8, 1309–1316 CAS.
- D. Li, D. Yang, X. Yang, Y. Wang, Z. Guo, Y. Xia, S. Sun and S. Guo, Angew. Chem., Int.Ed., 2016, 55, 15925–15928 CrossRef CAS PubMed.
- X. Wei, W. Li, J. A. Shi, L. Gu and Y. Yu, ACS Appl. Mater. Interfaces, 2015, 7, 27804–27809 CAS.
- S. Lv, P.-Y. Sun, C. Wang and X.-T. Yang, J. Mol. Sci., 2016, 32, 496 Search PubMed.
- Z. Wang, K.-S. Zhao, Y. Sun, D. Zhou and H.-M. Xie, J. Mol. Sci., 2016, 32, 367–378 Search PubMed.
- N. Zhang, X. Han, Y. Liu, X. Hu, Q. Zhao and J. Chen, Adv. Energy Mater., 2014, 5, 1401123 CrossRef.
- B. Luo, T. Qiu, D. Ye, L. Wang and L. Zhi, Nano Energy, 2016, 22, 232–240 CrossRef CAS.
- B.-H. Hou, X.-L. Wu, Y.-Y. Wang, H.-Y. Lü, D.-H. Liu, H.-Z. Sun, J.-P. Zhang and H.-Y. Guan, Part. Part. Syst. Charact., 2015, 32, 1020–1027 CrossRef CAS.
- Z. Liu, X.-Y. Yu and U. Paik, Adv. Energy Mater., 2016, 6, 1502318 CrossRef.
- Q. Li, Z. Li, Z. Zhang, C. Li, J. Ma, C. Wang, X. Ge, S. Dong and L. Yin, Adv. Energy Mater., 2016, 6, 1600376 CrossRef.
- J. Z. Guo, P. F. Wang, X. L. Wu, X. H. Zhang, Q. Yan, H. Chen, J. P. Zhang and Y. G. Guo, Adv. Mater., 2017, 29, 1701968 CrossRef PubMed.
- L. Fei, Q. Lin, B. Yuan, G. Chen, P. Xie, Y. Li, Y. Xu, S. Deng, S. Smirnov and H. Luo, ACS Appl. Mater. Interfaces, 2013, 5, 5330–5335 CAS.
- J. S. Cho, J.-S. Park and Y. C. Kang, Nano Res., 2016, 10, 897–907 CrossRef.
- Y.-X. Wang, J. Yang, S.-L. Chou, H. K. Liu, W.-x. Zhang, D. Zhao and S. X. Dou, Nat. Commun., 2015, 6, 8689 CrossRef CAS PubMed.
- J. Duan, W. Zhang, C. Wu, Q. Fan, W. Zhang, X. Hu and Y. Huang, Nano Energy, 2015, 16, 479–487 CrossRef CAS.
- C. Wu, Y. Jiang, P. Kopold, P. A. van Aken, J. Maier and Y. Yu, Adv. Mater., 2016, 28, 7276–7283 CrossRef CAS PubMed.
- Y. Liu, N. Zhang, L. Jiao and J. Chen, Adv. Mater., 2015, 27, 6702–6707 CrossRef CAS PubMed.
- J. Liu, P. Kopold, C. Wu, P. A. van Aken, J. Maier and Y. Yu, Energy Environ. Sci., 2015, 8, 3531–3538 CAS.
- L. Wang, X. Bi and S. Yang, Adv. Mater., 2016, 28, 7672–7679 CrossRef CAS PubMed.
- D.-S. Liu, D.-H. Liu, B.-H. Hou, Y.-Y. Wang, J.-Z. Guo, Q.-L. Ning and X.-L. Wu, Electrochim. Acta, 2018, 264, 292–300 CrossRef CAS.
- H. Liu, M. Jia, Q. Zhu, B. Cao, R. Chen, Y. Wang, F. Wu and B. Xu, ACS Appl. Mater. Interfaces, 2016, 8, 26878–26885 CAS.
- H. Geng, J. Yang, H. Yu, C. Li and X. Dong, Mater. Chem. Front., 2017, 1, 1435–1440 RSC.
- Y. Zhang, P. Zhu, L. Huang, J. Xie, S. Zhang, G. Cao and X. Zhao, Adv. Funct. Mater., 2015, 25, 481–489 CrossRef CAS.
- W. Li, M. Zhou, H. Li, K. Wang, S. Cheng and K. Jiang, Energy Environ. Sci., 2015, 8, 2916–2921 CAS.
- L. Fan, X. Li, B. Yan, J. Feng, D. Xiong, D. Li, L. Gu, Y. Wen, S. Lawes and X. Sun, Adv. Energy Mater., 2016, 6, 1502057 CrossRef.
- F. Wan, H.-Y. Lü, X.-L. Wu, X. Yan, J.-Z. Guo, J.-P. Zhang, G. Wang, D.-X. Han and L. Niu, Energy Storage Mater., 2016, 5, 214–222 CrossRef.
- Y.-Y. Wang, B.-H. Hou, H.-Y. Lü, C.-L. Lü and X.-L. Wu, ChemistrySelect, 2016, 1, 1441–1447 CrossRef CAS.
- Y.-Y. Wang, B.-H. Hou, H.-Y. Lü, F. Wan, J. Wang and X.-L. Wu, RSC Adv., 2015, 5, 97427–97434 RSC.
- S. Y. Lee and Y. C. Kang, Chem. – Eur. J., 2016, 22, 2769–2774 CrossRef CAS PubMed.
- Z.-G. Wu, J.-T. Li, Y.-J. Zhong, J. Liu, K. Wang, X.-D. Guo, L. Huang, B.-H. Zhong and S.-G. Sun, J. Alloys Compd., 2016, 688, 790–797 CrossRef CAS.
- J. Patra, H.-C. Chen, C.-H. Yang, C.-T. Hsieh, C.-Y. Su and J.-K. Chang, Nano Energy, 2016, 28, 124–134 CrossRef CAS.
- H. Xue, D. Y. W. Yu, J. Qing, X. Yang, J. Xu, Z. Li, M. Sun, W. Kang, Y. Tang and C.-S. Lee, J. Mater. Chem. A, 2015, 3, 7945–7949 CAS.
- X. Fan, J. Mao, Y. Zhu, C. Luo, L. Suo, T. Gao, F. Han, S.-C. Liou and C. Wang, Adv. Energy Mater., 2015, 5, 1500174 CrossRef.
- Y. Zhu, L. Suo, T. Gao, X. Fan, F. Han and C. Wang, Electrochem. Commun., 2015, 54, 18–22 CrossRef CAS.
- W.-H. Liu and X.-L. Wu, J. Mol. Sci., 2016, 32, 379–395 Search PubMed.
- J. Z. Guo, X. L. Wu, F. Wan, J. Wang, X. H. Zhang and R. S. Wang, Chem. – Eur. J., 2015, 21, 17371–17378 CrossRef CAS PubMed.
- B.-H. Hou, Y.-Y. Wang, H.-Y. Lü, Q.-L. Ning, X. Yan, D.-S. Liu, Y. Chen, J. Wang, X. Wang and X.-L. Wu, Electrochim. Acta, 2018, 268, 323–331 CrossRef CAS.
- K. Zhang, Z. Hu, X. Liu, Z. Tao and J. Chen, Adv. Mater., 2015, 27, 3305–3309 CrossRef CAS PubMed.
- B. H. Hou, Y. Y. Wang, J. Z. Guo, Y. Zhang, Q. L. Ning, Y. Yang, W. H. Li, J. P. Zhang, X. L. Wang and X. L. Wu, ACS Appl. Mater. Interfaces, 2018, 10, 3581–3589 CAS.
- Z. Hu, L. Wang, K. Zhang, J. Wang, F. Cheng, Z. Tao and J. Chen, Angew. Chem., Int. Ed., 2014, 53, 12794–12798 CrossRef CAS PubMed.
- J.-Z. Guo, Y. Yang, D.-S. Liu, X.-L. Wu, B.-H. Hou, W.-L. Pang, K.-C. Huang, J.-P. Zhang and Z.-M. Su, Adv. Energy Mater., 2018, 1702504 CrossRef.
- Y.-Y. Wang, B.-H. Hou, J.-Z. Guo, Q.-L. Ning, W.-L. Pang, J. Wang, C.-L. Lü and X.-L. Wu, Adv. Energy Mater., 2018, 1703252 CrossRef.
Footnote |
| † Electronic supplementary information (ESI) available: Detailed TGA, SEM, XPS, XRD and electrochemical data. See DOI: 10.1039/c7nr09674g |
| This journal is © The Royal Society of Chemistry 2018 |

