
 Open Access Article
 This Open Access Article is licensed under a
 Creative Commons Attribution 3.0 Unported Licence
Aggregation of polyethylene glycol polymers suppresses receptor-mediated endocytosis of PEGylated liposomes†
Zhiqiang
Shen
a,
Huilin
Ye
a,
Martin
Kröger
 b and
Ying
Li
*a
b and
Ying
Li
*a
aDepartment of Mechanical Engineering and Institute of Materials Science, University of Connecticut, Storrs, CT 06269, USA. E-mail: yingli@engr.uconn.edu; Fax: +1 860 4865088; Tel: +1 860 4867110
bDepartment of Materials, Polymer Physics, ETH Zürich, CH-8093 Zurich, Switzerland
First published on 26th January 2018
Abstract
The PEGylated liposome, composed of an aqueous core and a fluid state lipid bilayer shell, is one of the few Food and Drug Administration (FDA) approved drug delivery platforms. To prevent the absorption of serum proteins, the surface of a liposome is decorated by hydrophilic and bio-compatible polyethylene glycol (PEG) polymers, which can significantly extend the blood circulation time of liposomes. In this work, with the help of dissipative particle dynamics (DPD) simulations, we explore how the tethered PEG polymers will affect the membrane wrapping process of PEGylated liposomes during endocytosis. Specifically, we compare the membrane wrapping process of a PEGylated rigid nanoparticle (NP) with a PEGylated liposome under identical conditions. Due to the mobility of grafted PEG polymers on the liposome's surface, the complete wrapping of a PEGylated liposome can be dramatically delayed and blocked, in comparison with a PEGylated rigid NP. For the first time, we observe the aggregation of PEG polymers in the contact region between a PEGylated liposome and the membrane, which in turn leads to a ligand-free region on the surface of the liposome during endocytosis. Subsequently, the partially wrapped PEGylated liposome can be bounced back to a less wrapped state. Through free energy analysis, we find that the aggregation of PEG polymers during the membrane wrapping process of a PEGylated liposome introduces a dramatic free energy penalty of about ∼800kBT, which is almost twice that of a PEGylated rigid NP. Here kB and T are the Boltzmann constant and temperature, respectively. Such a large energy barrier and the existence of a ligand-free region on the surface of PEGlylated liposomes prevent their membrane wrapping, thereby reducing the chance of internalization by tumor cells. Therefore, our DPD simulation results provide a possible explanation for the inefficient cellular uptake of PEGylated liposomes. In addition, we suggest that by increasing the repulsive interactions between grafted PEG polymers it might be possible to limit their aggregation, and in turn, facilitate the internalization of PEGylated liposomes. The current study provides fundamental insights into the endocytosis of PEGylated liposomes, which could help to design this platform with high efficacy for drug delivery.
1. Introduction
Nanoparticle (NP)-based drug delivery has been an attractive research area in recent years.1–4 These engineered NPs carry drug molecules or imaging agents, protect them and deliver them to target tissues or organs. Thus, the NP-based drug carriers are able to selectively detect and destroy tumor cells.5,6 Although the concept of NP-based nanomedicine is very promising, there are limited numbers of NPs translated to clinical applications.4 Once injected into the human body, the administered NPs immediately confront with both physical and biological barriers.3 For instance, serum proteins in the blood flow can quickly interact and be absorbed on the surface of NPs. These absorbed proteins act as opsonins that initiate phagocytosis of the mononuclear phagocyte system (MPS), resulting in the clearance of most NPs.3,4,7 Therefore, the properties of NPs, such as size, shape, stiffness and surface, could greatly affect their interactions with surrounding environment and determine their fate during the drug delivery process.8–10 Doxil is one of the few Food and Drug Administration (FDA) approved NPs for drug delivery,11 which is doxorubicin encapsulated in a long-circulating stealth liposome. The liposome is formed by a phospholipid bilayer, which encloses an aqueous core inside (see Fig. 1). The bilayer could be either in fluid or in gel state depending on lipid compositions and environmental temperature. In addition, to reduce the absorption of serum proteins, PEGylated lipids, such as 1,2-distearoyl-sn-glycero-3-phosphoethanolamine-poly(ethylene glycol) (DSPE-PEG), are incorporated into the bilayer, forming a polyethylene glycol (PEG) polymer brush on its surface. Furthermore, targeting moieties,12 such as peptides13,14 or antibodies,15 are conjugated on the free ends of PEG polymers to enable selective targeting by interacting with specific over-expressed receptors on the cell surface. Despite being successful among their counterparts, the efficacy of PEGylated liposomes is still limited by the releasing of encapsulated drug molecules. Upon entering tumor sites, PEGylated liposomes stay outside of tumor cells without internalization.11,16 As a result, drug molecules need to be firstly released from the liposome to the tumor ex-cellular interstitial fluid and then diffuse into the tumor cells.17,18 Therefore, due to the existence of a trans-membrane barrier, the amount of drug molecules taken up by tumor cells might be dramatically reduced. To resolve this issue, it is crucial to study the interaction between PEGylated liposomes and tumor cells.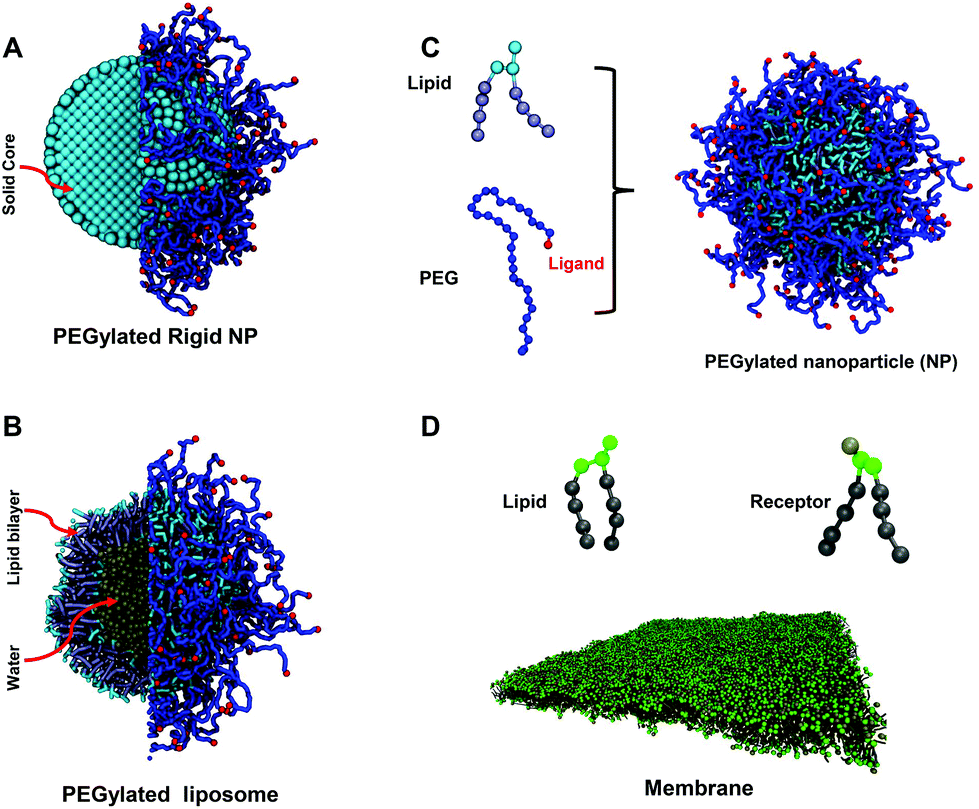 | ||
| Fig. 1 Molecular structures of computational models: (A) PEGylated rigid NP, (B) PEGylated liposome, and (C) lipid and PEG polymer models for both types of PEGylated NPs. Lipid heads and tails in a liposome are colored in light blue and ice blue, respectively. The PEG polymers are colored in blue. The ligands (targeting moieties) conjugated on the distal ends of PEG polymers are represented by red beads. (D) Lipid membrane with over-expressed receptors. Lipid heads and tails in the membrane are colored in green and gray, respectively. The molecular structure of receptors is the same as for lipids in simulations. The bead colored in tan on the head of the receptor is the active site to specifically bind to a ligand. | ||
Endocytosis is one of the fundamental processes for cells to internalize molecules or macromolecules, which is also a primary route exploited by engineering NPs.3,19,20 Depending on the proteins and lipids involved, endocytosis could be sub-classified into several other mechanisms, such as macropinocytosis, clathrin-mediated endocytosis, caveolae-mediated endocytosis and calthrin/caveolae independent endocytosis. All of these mechanisms share the same steps in ligand-dependent binding, membrane budding and pinching off.21–23 Note that the typical endocytic pathway of NPs consists of the following four steps:21,23 (1) specific binding of ligands on the NP surface to receptors over-expressed on the cell membrane; (2) membrane wrapping around the NP and formation of a membrane-bound NP carrier; (3) pinching-off of the membrane-bound NP carrier to form an early stage endosome in the cytoplasm; and (4) endosomal release of the NP during the late stage of the endosome. The current study mainly focuses on the first two steps, related to the membrane wrapping of NPs, which is a critical and necessary condition for NPs to be internalized. The last two steps related to the endosomal release of NPs remain beyond the scope of the present study.
Fundamental understandings about endocytosis could provide a guideline for the rational design of NP-mediated drug delivery. For example, during the endocytosis process, receptors in the cell membrane diffuse and rearrange to interact with ligands decorated on a NP surface. Since the membrane wrapping of large sized NPs requires the recruitment of a large number of receptors, the efficiency of endocytosis is limited by the receptor diffusivity in the cell membrane.24,25 In contrast, due to the limited number of available ligands, small sized NPs are unable to overcome the energy barrier due to the membrane bending penalty.24,25 Considering the balance of receptor diffusion and ligand–receptor binding, a radius of around 30–50 nm has been suggested as the most efficient size for spherical NPs,24,26,27 which is in good agreement with experimental observations.3,28 In addition, soft NPs like liposomes are deformable during endocytosis. When approaching the tumor cell, soft NPs can deform to increase their contact area with the cell membrane, resulting in a high curvature area in the contact region. This large deformation of NPs leads to a high energy barrier that blocks the membrane wrapping of soft NPs during endocytosis.29 Therefore, rigid NPs were suggested to offer a higher chance of internalization.29,30 Apart from their size and stiffness, both the shape and surface properties of NPs are also found to play important roles during the membrane wrapping process,31–34 which can dramatically affect the cellular uptake efficiency.
Compared with PEGylated gold NPs, the PEG polymers in PEGylated liposomes are able to rearrange their positions and configurations during endocytosis due to the fluid nature of the lipid bilayer. For instance, by using molecular mean-field theory, Szleifer and co-workers investigated the interaction between a PEGylated micelle and a planar surface (mimicking the surface of a tumor cell).35 When the PEGylated micelle approaches the planar surface, the polymer chains can migrate from the confined gap region between the micelle and the planar surface to the unconfined regions. Such a movement can dramatically reduce the polymer segment density in the confined region, leading to the reduction of the energy penalty induced by restricted configurations and increased excluded volume interactions in the confined regions. Furthermore, when conjugated with targeting moieties (ligands), polymer chains can migrate to the gap boundaries to promote ligand–receptor binding and to reduce the polymer energy penalty.36 The mobility of polymer chains can therefore promote the adhesion of PEGylated micelles on a cell surface, compared to the PEGylated rigid (gold) NPs. In addition, through computational modeling, Gorfe et al. suggested that the rearrangement of polymers on lipid–polymer hybrid (LPH) NPs could benefit the adhesion of LPH on membrane surfaces.37 However, considering the endocytosis, the situation is more complicated due to the wrapping and deformation of the membrane. The re-distribution of polymers is not only determined by the ligand–receptor binding and polymer energy penalty, but also the free energy change associated with the deformation of the membrane. Therefore, the problem related to how the PEG mobility will affect the endocytosis of PEGylated liposomes remains largely unexplored.
In this work, with the help of large-scale molecular dynamics simulations, we reveal the physical details about the endocytosis of PEGylated liposomes. Specifically, we explore how the PEG mobility affects the membrane wrapping process during endocytosis. To understand the influence of PEG mobility in a better way, we also study the receptor-mediated endocytosis of PEGylated rigid (gold) NPs, where the tethers of PEG polymers are fixed on the NP surface. As shown in Fig. 1, the PEGylated rigid NP consists of a solid core and tethered PEG polymers. In comparison, the PEGylated liposome is composed of an aqueous core and a fluid state lipid bilayer shell. To control the mobility of grafted PEG polymers during simulations, the rigid NP is mimicked by treating the lipids and water beads in the liposome as a single rigid body in our simulations. Therefore, the PEGylated rigid NP and liposome share the same size and surface chemistry. The only differences between them are the mobility of grafted PEG polymers and deformability of the liposome. Under the same conditions, we find that the PEGylated liposome is more difficult to be fully wrapped by the membrane during endocytosis, compared to its rigid counterparts. In particular, we observe the aggregation of PEG polymers in the contact region between the PEGylated liposome and the membrane, which in turn leaves a ligand-free region on the surface of the liposome. Due to this ligand-free region, ligand–receptor binding does not occur during the late stage of membrane wrapping for PEGylated liposomes. Furthermore, the PEGylated liposome can be bounced back to a less wrapped state, by reducing the free energy penalty due to membrane bending. Through a free energy analysis, we find that the free energy change of PEG polymers during membrane wrapping plays the most important role. Specifically, the aggregation of PEG polymers during endocytosis of PEGylated liposomes introduces a dramatic free energy penalty (∼800kBT), which is more than twice of the membrane bending energy. Such a large energy barrier and the existence of a ligand-free region on the surface of PEGylated liposomes prevent their membrane wrapping, thereby reducing the chance of its internalization by tumor cells. Our simulation results thus provide a possible explanation for the inefficient cellular uptake of PEGylated liposomes. In addition, we suggest that by increasing the repulsive interactions between PEG polymers or ligands one might be able to limit the polymer aggregation, and in turn, facilitate the internalization of a PEGylated liposome.
2. Results and discussion
The dissipative particle dynamics (DPD) method is adopted in our molecular dynamics simulations to investigate the membrane wrapping of PEGylated NPs during endocytosis, which has proved to be an efficient and accurate method in our previous studies.32,33,38 In this model, each lipid molecule contains one lipid head group and two lipid tails. A PEG polymer is modeled by a linear chain, as shown in Fig. 1. Each PEG polymer has N = 30 monomers (molecular weight around 1000 Da). To prepare the PEGylated liposome, a liposome is firstly formulated through self-assembly by lipids. Lipid molecules in the outer leaflet of the liposome are then randomly selected for grafting PEG polymers on their head bead. Afterwards, the PEGylated liposome is further relaxed for 105τ, at a temperature of T = 1, where τ is the basic time unit and kBT the basic energy unit in DPD simulations. Two differently sized liposomes with 800 and 1701 lipids are prepared with radii around 7r0 and 15r0, respectively. Here r0 is the length unit in the DPD simulations. The planar membrane bilayer is fully relaxed in the simulation box of size (70 × 70 × 100)r03. The stretch modulus and bending rigidity of the membrane are around KA ≈ 17.42kBT/r02 and κ ≈ 6kBT, respectively. The membrane tension is maintained constant during the membrane wrapping process via the N-varied DPD method.32,33,39–41 The physical length and time scales, corresponding to τ and r0 in simulations, could be obtained by the relations r0 ≈ 0.9 nm and τ = 11.8 ns, considering the thickness of the cell membrane and the diffusion coefficient of lipids. Details about the DPD model and simulation procedures are given in the section Models and method and in the ESI.†2.1. Aggregation of PEG polymers during membrane wrapping of PEGylated liposomes
We first investigate the membrane wrapping of PEGylated rigid NPs and liposomes with a size of r = 7r0 under the same conditions, as shown in Fig. 2. 20% of lipids (800 lipids in total) in both the rigid NP and the liposome are PEGylated. The membrane tension is controlled at −0.38kBT/r02 (1kBT/r02 corresponds to 5 mN m−1). At startup (t = 0), both the PEGylated rigid NP and the liposome are placed above the planar membrane at the distance 3r0. For the PEGylated rigid NP, the membrane wrapping process can be divided into three stages: membrane bending stage (0 < t < 10![[thin space (1/6-em)]](https://www.rsc.org/images/entities/char_2009.gif) 000τ), membrane protruding stage (10000τ < t < 80000τ) and equilibrium stage (t > 80000τ). At the membrane bending stage, due to the thermal fluctuation and flexibility of PEG polymers, the targeting moieties (ligands) conjugated on the distal ends of PEG polymers can interact with and bind to receptors in the planar membrane, resulting in adhesion of the NP at time t = 1000τ. Then, driven by the ligand–receptor binding, the planar membrane starts bending and wrapping around the PEGylated rigid NP. With the simulation time running, more and more receptors diffuse into the membrane bending region and bind to ligands on the free ends of tethered PEG polymers. The energy released by the ligand–receptor binding provides the major driving force to overcome the energy barriers during the membrane bending. At time t = 40000τ, most of the PEGylated rigid NP is wrapped by the membrane, and the membrane starts to protrude and wrap the PEGylated rigid NP from the top (t = 50000τ). The lower part of the membrane only bends slowly and weakly, compared with its performance at the membrane bending stage. Afterwards, the PEGylated rigid NP is slightly pulled upwards and located around the center of the membrane to reduce the bending energy penalty from the lower membrane part. At time t = 80000τ, the PEGylated rigid NP is fully wrapped by the membrane. A similar membrane wrapping pathway has been observed in previous studies on PEGylated rigid NPs,32,33 hydrophilic NPs decorated by ligands only (without PEGylation)42,43 and liposome-like NPs.38,41
000τ), membrane protruding stage (10000τ < t < 80000τ) and equilibrium stage (t > 80000τ). At the membrane bending stage, due to the thermal fluctuation and flexibility of PEG polymers, the targeting moieties (ligands) conjugated on the distal ends of PEG polymers can interact with and bind to receptors in the planar membrane, resulting in adhesion of the NP at time t = 1000τ. Then, driven by the ligand–receptor binding, the planar membrane starts bending and wrapping around the PEGylated rigid NP. With the simulation time running, more and more receptors diffuse into the membrane bending region and bind to ligands on the free ends of tethered PEG polymers. The energy released by the ligand–receptor binding provides the major driving force to overcome the energy barriers during the membrane bending. At time t = 40000τ, most of the PEGylated rigid NP is wrapped by the membrane, and the membrane starts to protrude and wrap the PEGylated rigid NP from the top (t = 50000τ). The lower part of the membrane only bends slowly and weakly, compared with its performance at the membrane bending stage. Afterwards, the PEGylated rigid NP is slightly pulled upwards and located around the center of the membrane to reduce the bending energy penalty from the lower membrane part. At time t = 80000τ, the PEGylated rigid NP is fully wrapped by the membrane. A similar membrane wrapping pathway has been observed in previous studies on PEGylated rigid NPs,32,33 hydrophilic NPs decorated by ligands only (without PEGylation)42,43 and liposome-like NPs.38,41
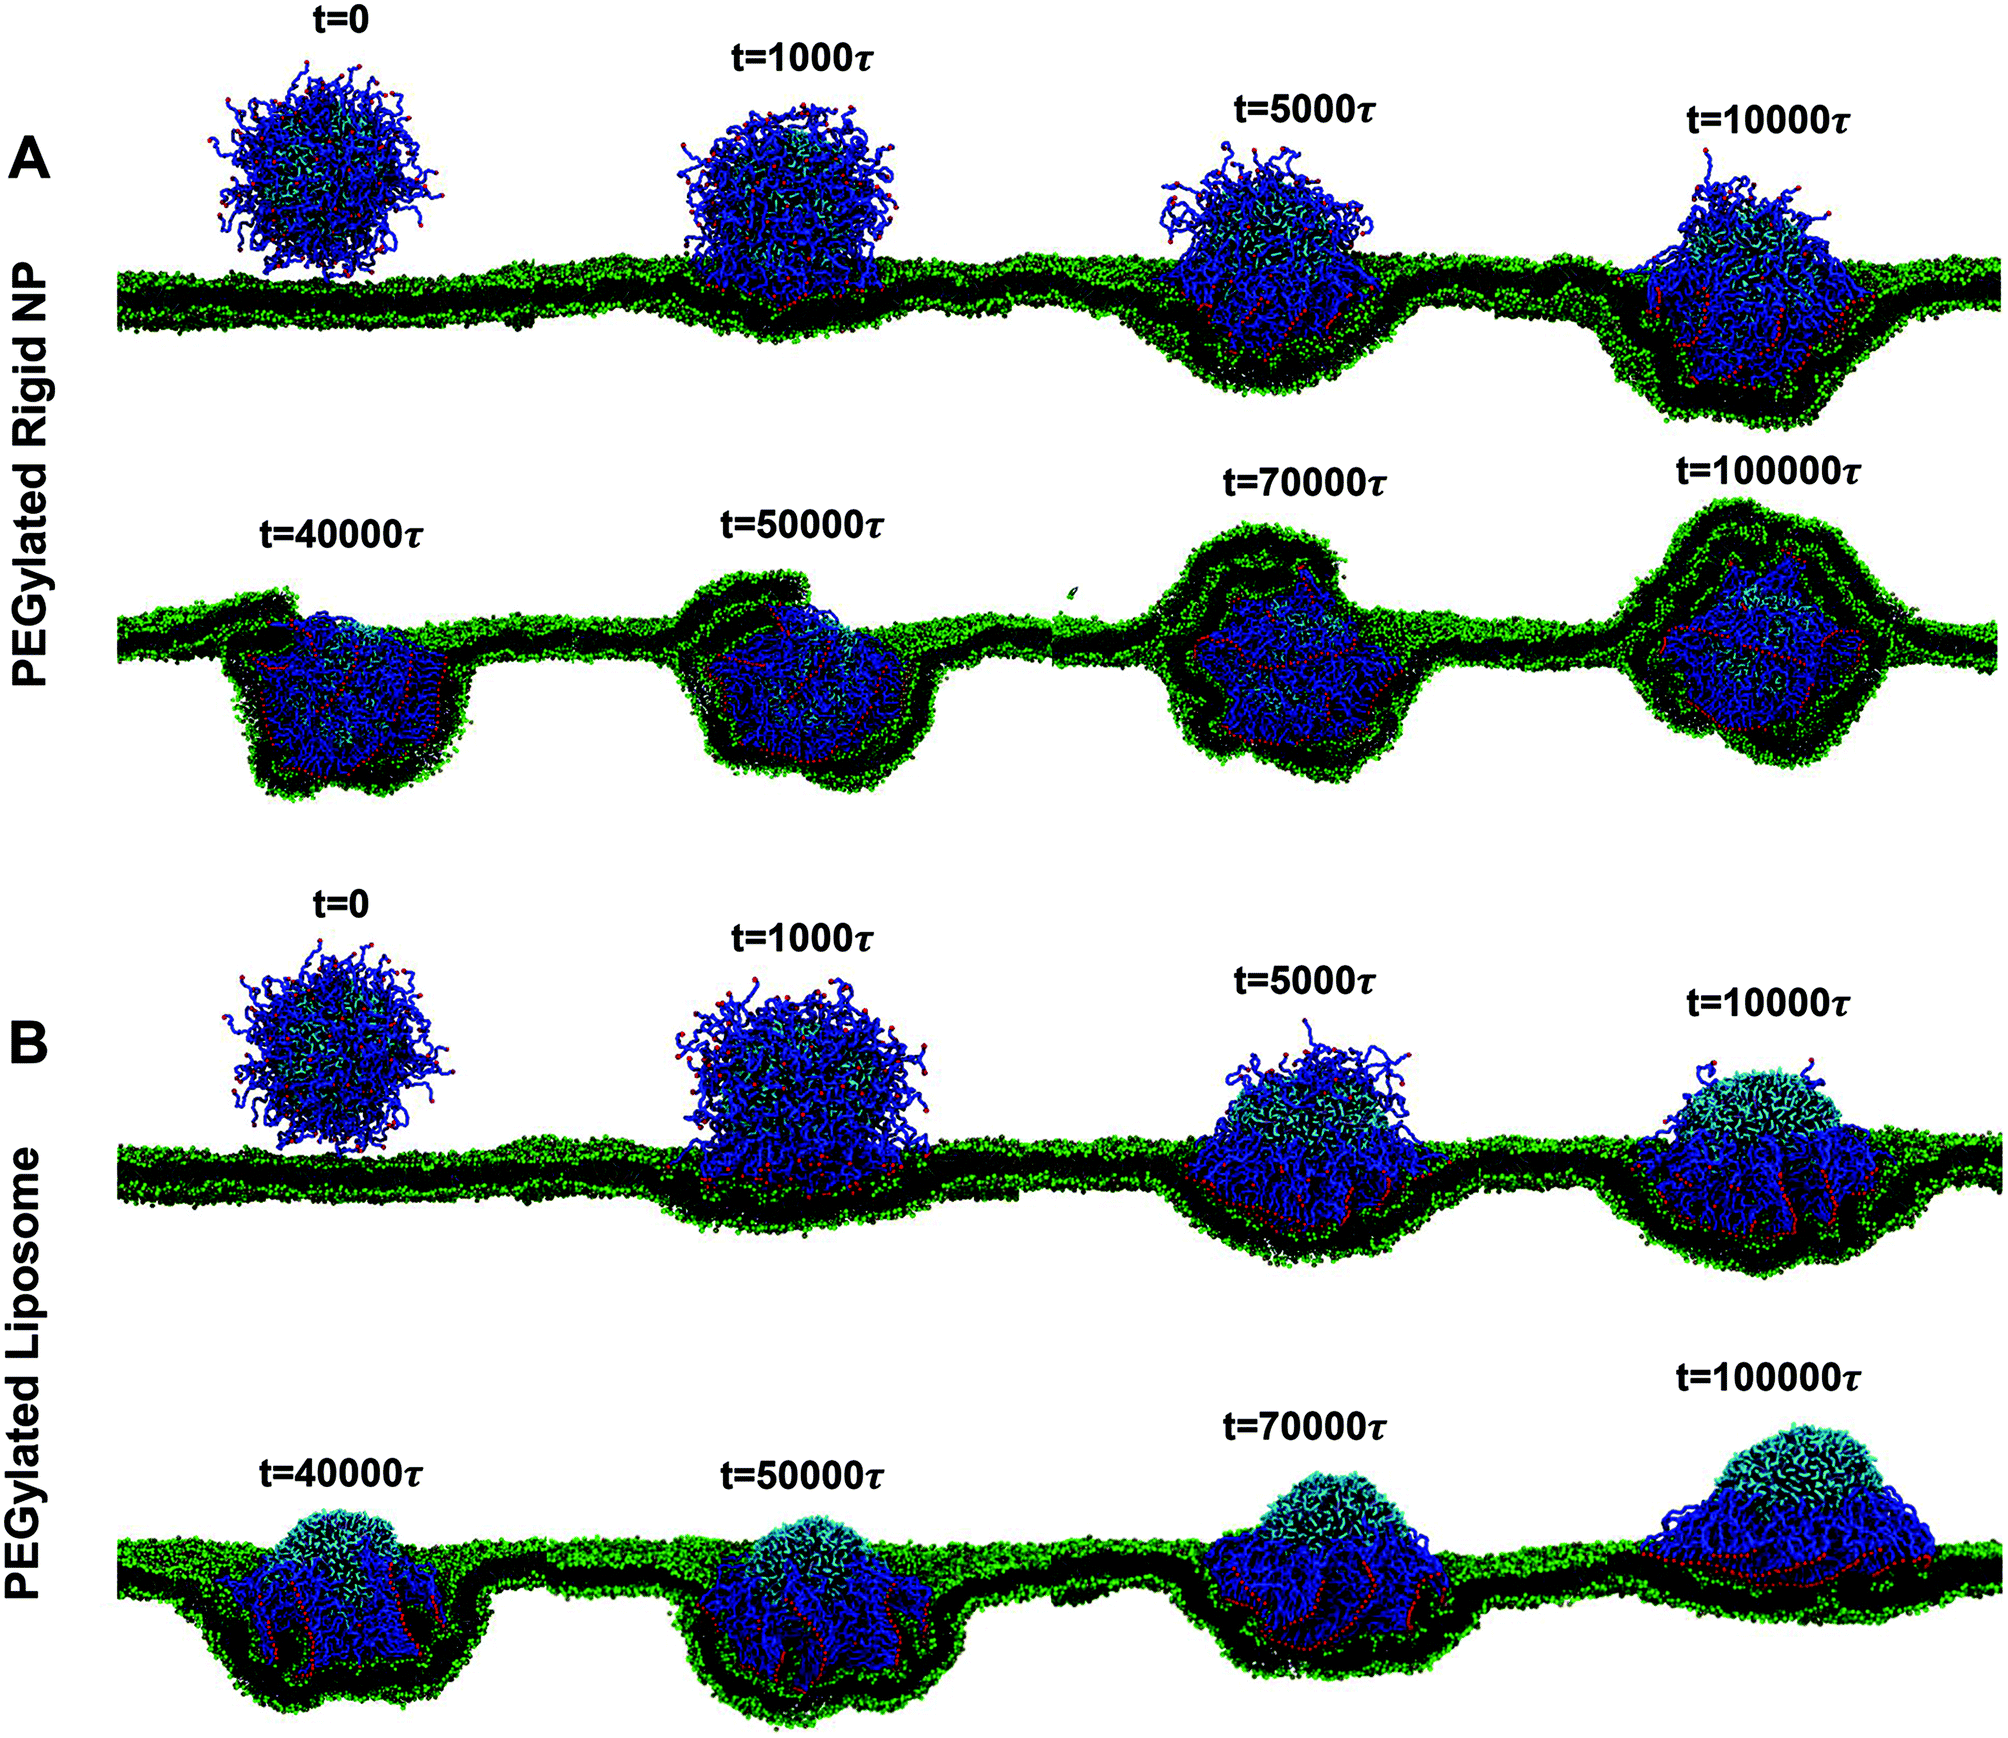 | ||
| Fig. 2 Representative snapshots for membrane wrapping processes of (A) PEGylated rigid NPs and (B) PEGylated liposomes with a size of r = 7r0. The membrane tension in both cases is controlled at −0.38kBT/r02. Water beads are not shown for clarity. The color scheme is the same as that given in Fig. 1. | ||
At the early stage of membrane wrapping, both the PEGylated rigid NP and the liposome demonstrate similar behaviors. However, at the late stage, their behaviors are completely different. As shown in Fig. 2, at time t = 50000τ, we observe the aggregation of PEG polymers into the membrane wrapping region, due to the strong ligand–receptor binding in this area. This difference is more pronounced at t = 10000τ, when the unwrapped part of the liposome almost becomes a PEG polymer free region. The majority of PEG polymers aggregate within the contact region between the liposome and the membrane. Later on, rather than being fully wrapped by the membrane, the PEGylated liposome is gradually bounced back on the surface of the planar membrane and returns to the previous membrane bending state (t = 40000τ), although most of the ligands on PEG polymers bind to receptors in the planar membrane. Therefore, the membrane wrapping process for the PEGylated liposome can be divided into membrane bending stage (0 < t < 50000τ) and liposome bouncing back stage (50000τ < t < 100000τ).
To further quantitatively understand above different behaviors between the PEGylated rigid NP and the liposome, we calculate the wrapping ratio, ligand–receptor binding ratio and asphericity of NPs, as given in Fig. 3. The wrapping ratio, defined as the ratio between the membrane's wrapped surface area to the total surface area of NPs, can be used to quantify the endocytosis efficiency. The ligand–receptor binding ratio, defined as the ratio between bound ligands to the total number of ligands on NP surfaces, directly reflects the ligand–receptor binding during the membrane wrapping process. The asphericity of NPs, given by λz2 − (λx2 + λy2)/2, is used to capture the deformation of NPs. Here λx2, λy2 and λz2 are the principal moments of the gyration tensor (λx2 ≤ λy2 ≤ λz2) of a liposome. A large asphericity value indicates a pronounced anisotropic shape.44 As shown in Fig. 3, the wrapping ratio of the PEGylated rigid NP monotonically increases with simulation time. By contrast, due to the ‘bouncing back’ phenomenon, the wrapping ratio of the PEGylated liposome decreases after reaching a plateau value of around 0.6. Different from the wrapping ratio, the ligand–receptor binding ratio of the PEGylated liposome increases more sharply than that of the PEGylated rigid NP. If we consider the ligand–receptor binding as a chemical reaction and fit the simulation results by an exponential growth function y = A + B exp(−kτ),36 the mean lifetime 1/k, needed to achieve the equilibrium of the ligand–receptor interaction, for the PEGylated liposome (1/k = 2.8 × 10³τ) is only half of that of the PEGylated rigid NP (1/k = 6.2 × 10³τ). This observation signifies that the mobility and aggregation of PEG polymers in the PEGylated liposome can significantly promote the ligand–receptor binding during endocytosis, consistent with previous studies.35,36 In addition, due to the deformable nature of the liposome, the asphericity of the PEGylated liposome varies with simulation time during the membrane wrapping process. At the initial stage of wrapping, the liposome deforms dramatically to maximize the contact area, leading to a highly anisotropic shape. After t = 10000τ, with the increment of the wrapping ratio, the asphericity decreases to reduce the energy cost from liposome deformation.29 It is worth noting that during the ‘bouncing back’ stage (t > 50000τ), the changes of the asphericity are almost symmetric to their early stage behavior. The maximum asphericity value during the membrane wrapping process is about ∼8r02.
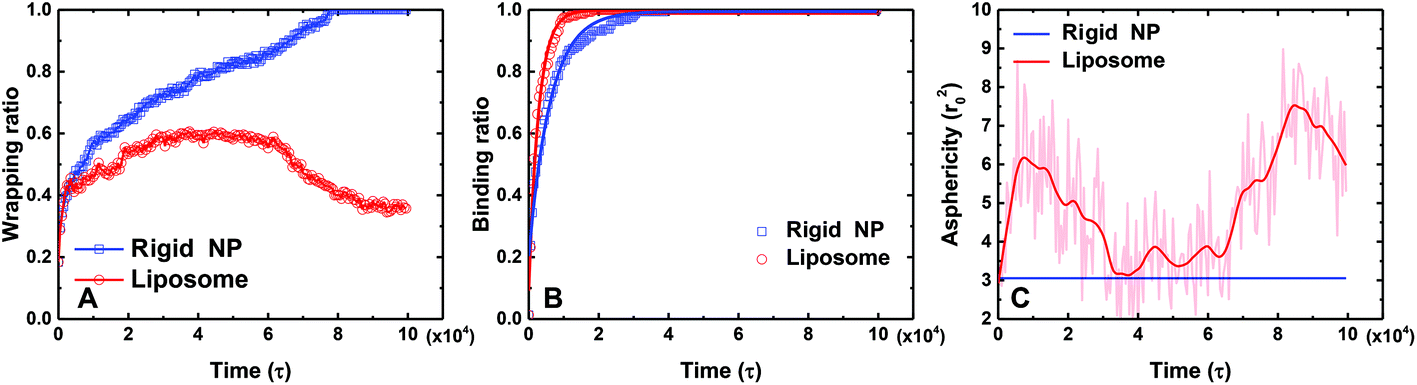 | ||
| Fig. 3 A comparison of the (A) wrapping ratio, (B) ligand–receptor binding ratio and (C) asphericity between the PEGylated rigid NP and the liposome during the membrane wrapping process. In (A), the wrapping ratio is defined as the ratio between the wrapped surface area of a NP and its total surface area. In (B), the ligand–receptor binding ratio is defined as the ratio between the numbers of bound and total ligands. The scattered points are the data obtained during simulations. The solid lines are obtained by fitting the data by an exponential growth function y = A + Bexp(−kτ). In (C), the asphericity is defined by λz2 − (λx2 + λy2)/2, where λx2, λy2 and λz2 are the principal moments of the gyration tensor (λx2 ≤ λy2 ≤ λz2) for a NP. | ||
Note that both the PEGylated rigid NP and the liposome are considered under identical conditions, such as the same size and surface property. Therefore, we believe that the above difference between ‘fully wrapped’ and ‘bouncing back’ of the PEGylated rigid NP and the liposome, respectively, should be induced by the aggregation of the PEG polymer during the membrane wrapping process. During binding between ligands and receptors, PEG polymers are under stretched conditions because of the restricted configurational space.32,45 Moreover, the PEG polymers on the edge of the contact region between the liposome and the membrane should be more stretched than the ones in the central part.46,47 As the PEG polymers are movable in the PEGylated liposome, they prefer to migrate to the center of the contact region, to reduce the stretching energy penalty of PEG polymers and to assist recruiting free ligands at the edges. Due to the aggregation of PEG polymers, the unwrapped surface of the liposome becomes a ligand free region. Thus, ligand–receptor binding cannot be provided for further wrapping of this ligand free region during the late stage of membrane wrapping. This inhomogeneous ligand distribution on the liposome is unfavorable for the endocytosis of NPs.48
To further confirm the above phenomenon and rule out possible effects potentially stemming from the NP size and membrane tension, we explore the membrane wrapping process of a 20 mol% PEGylated liposome with 1701 lipids in total (radius r = 15r0) and 340 PEGylated lipids (340/1701 = 20%). The membrane tension during endocytosis is maintained at 0.08kBT/r02. The whole membrane wrapping process is similar to that of the small sized PEGylated liposome (cf. Fig. S4 and S5 in the ESI†). Again, the PEG polymers aggregate in the contact region between the liposome and the membrane, accompanied by a ligand free region from the unwrapped surface. The half-wrapped liposome then regresses to an ‘adhesive’ state, rather than being fully wrapped. In contrast, the PEGylated rigid NP with identical size and PEGylation can be fully wrapped, as given in Fig. S4 of the ESI.† All of these observations confirm that the aggregation of PEG polymers could be a common problem for the endocytosis of PEGylated liposomes. Considering the computational cost of the large size PEGylated liposomes, we still use the small size liposome with r = 7r0 for a detailed study in the following parts.
2.2. The influence of the PEG molar ratio and membrane tension
The molar ratio of PEGylated lipids is one of the key design parameters for PEGylated liposomes; in experiments it ranges from 10% to 50%.16 In particular, the targeting moieties are conjugated on the free ends of PEG polymers. Thus, the total number of PEG polymers or the molar ratio of PEGylated lipids also determines the overall strength of ligand–receptor binding during the wrapping process. Moreover, the diffusion coefficient of ligands on the liposome surface decreases with increasing PEG molar ratio, as shown in Fig. S2 of the ESI.† On the other hand, cells could actively adjust their membrane tension through various mechanisms.19 For instance, mammalian cells could change their membrane tension from 0.01 to 10 mN m−1.49 Therefore, in this part, we explore how the membrane wrapping of PEGylated liposomes will be affected by the membrane tension and the molar ratio of PEGylated lipids. First, we fix the membrane tension to be −0.38kBT/r02, which is the same as the one in Fig. 2. Then, we increase the molar ratio of PEGylated lipids from 20% to 40%. As presented in Fig. 4, the PEGylated liposome can be fully wrapped by the membrane, in comparison with the 20% PEGylated liposome. During this process, although the PEG polymers aggregate within the contact region (10000τ < t < 50000τ), the area of the ligand-free region is much smaller due to the increased number of PEG polymers. After t = 60000τ, the membrane lipids near the contact region protrude and start to spread over the ligand free region. Note that, after being fully wrapped by the cell membrane, the PEG polymers are redistributed and become homogeneously distributed on the surface of the liposome at t = 70000τ.
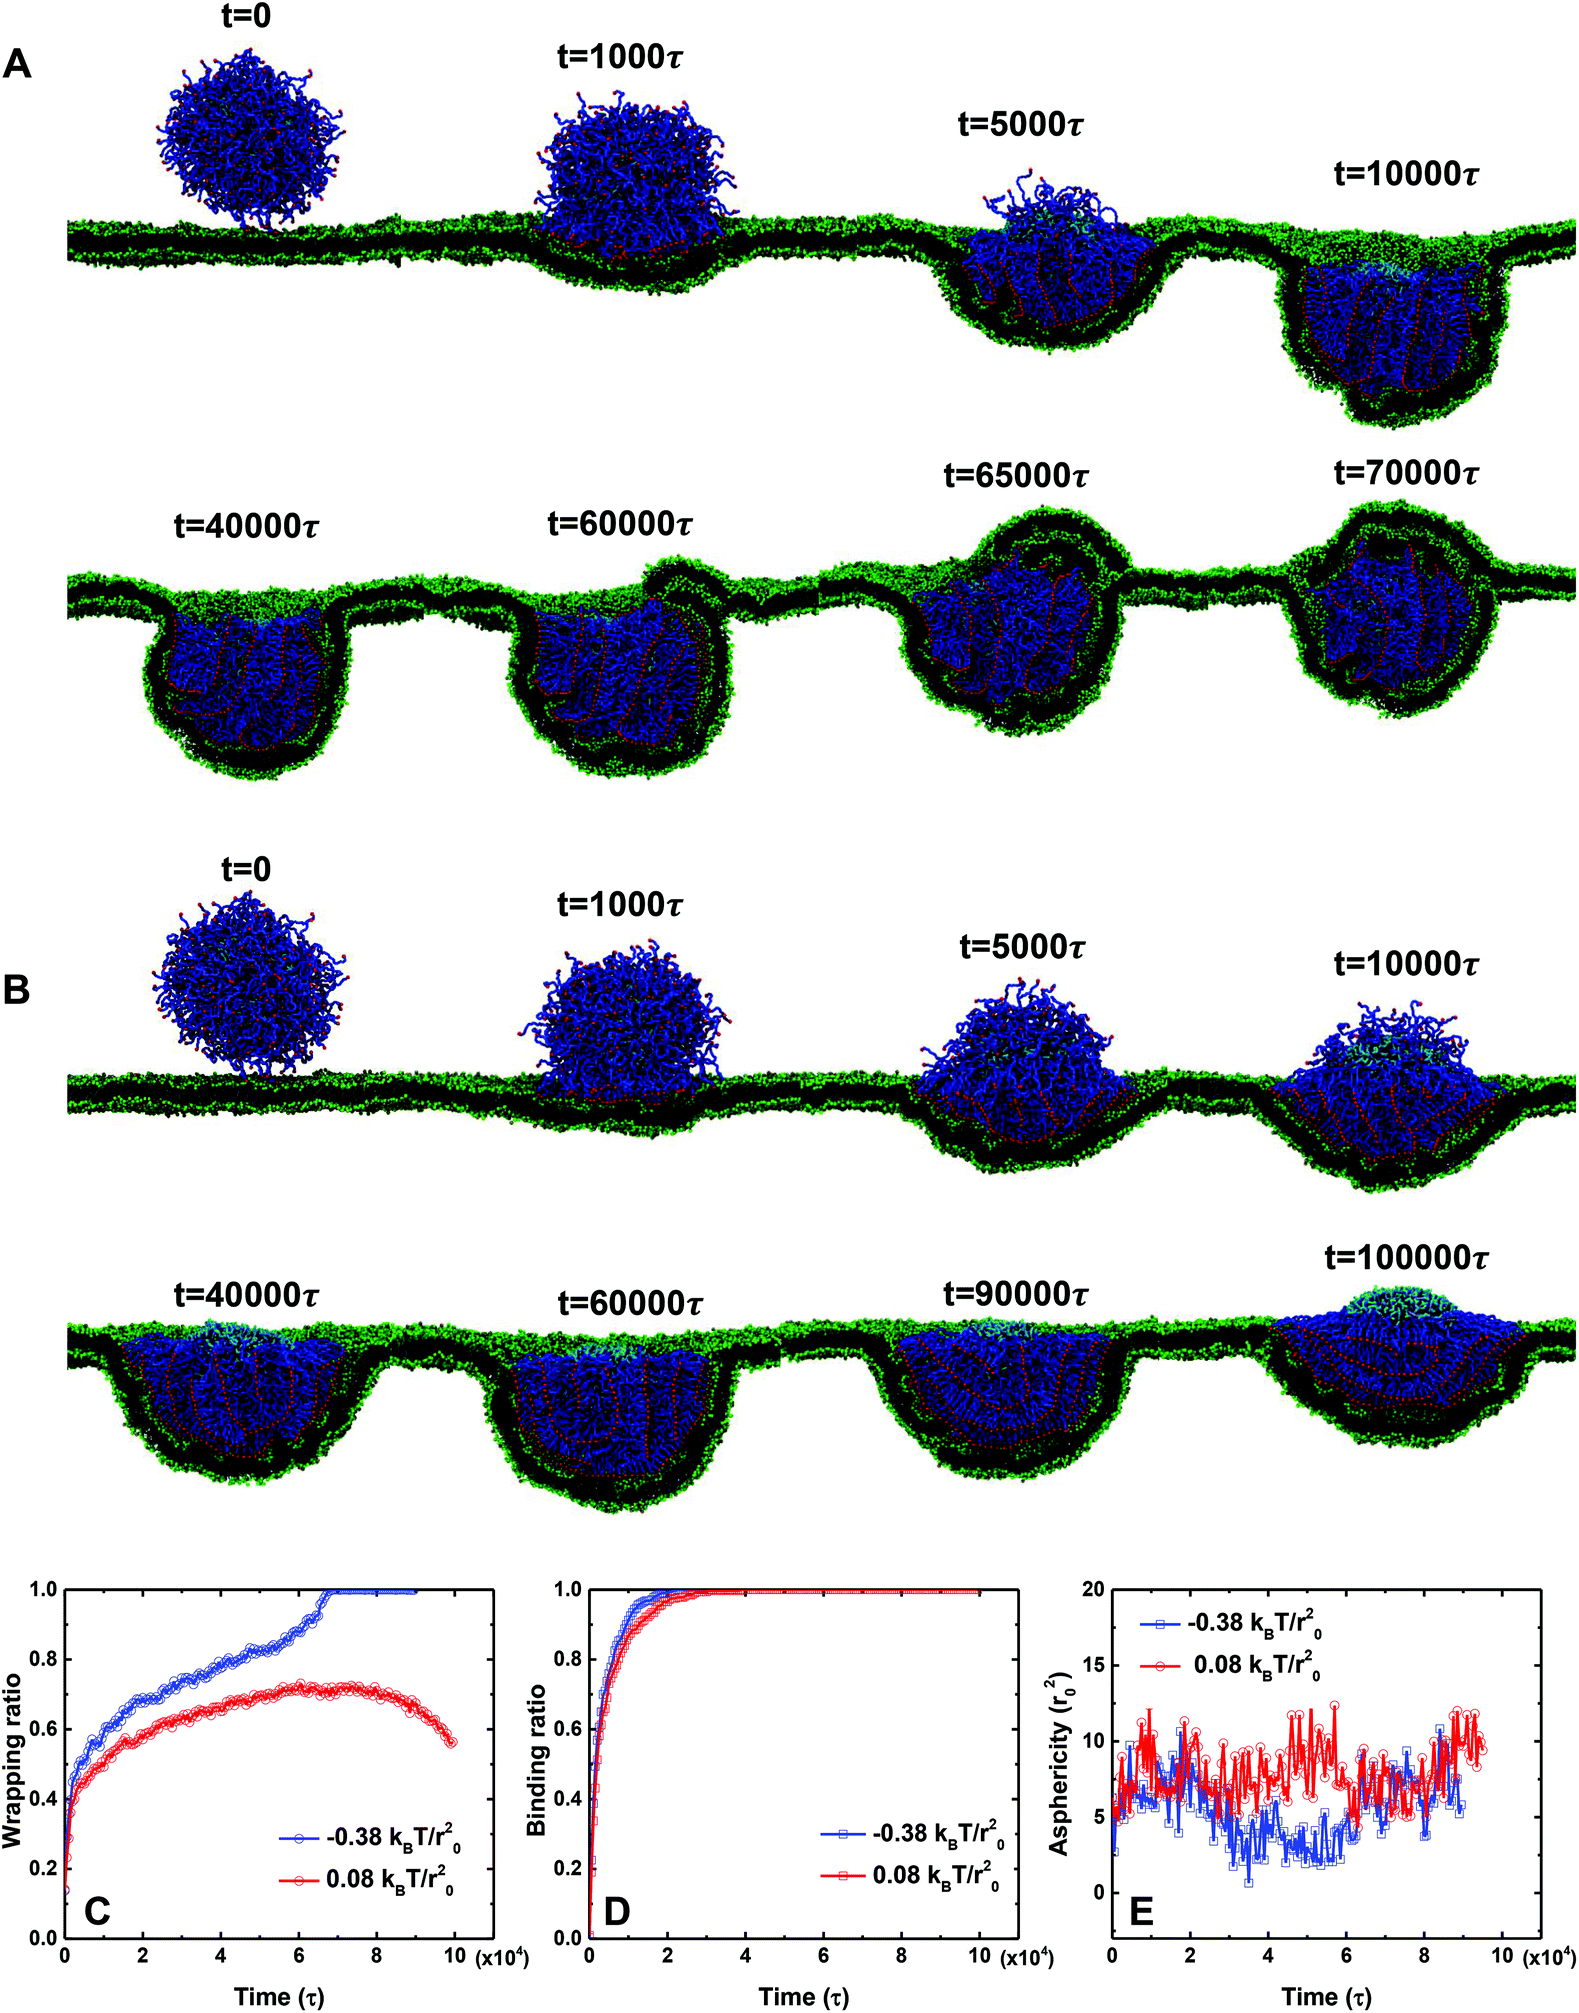 | ||
| Fig. 4 The endocytosis process of the 40 mol% PEGylated liposome (radius r = 7r0). (A) Snapshots of the PEGylated liposome under a membrane tension of −0.38kBT/r02 (compression). (B) Snapshots of the PEGylated liposome under a membrane tension of 0.08kBT/r02 (tension). The molar ratio of the PEGylated lipid for (A) and (B) is 40%. A comparison of the (C) wrapping ratio, (D) ligand–receptor binding ratio and (E) asphericity between these two cases. | ||
Upon further increasing the membrane tension from −0.38kBT/r02 to 0.08kBT/r02, the 40 mol% PEGylated liposome cannot be fully wrapped and demonstrates the ‘bouncing back’ phenomenon after time t = 60000τ, as shown in Fig. 4B. To further understand this difference, we calculate the wrapping ratio, ligand–receptor binding ratio and asphericity of these two cases. As evidenced from Fig. 4B, the increase of membrane tension creates a higher energy penalty, dramatically reduces the membrane wrapping of PEGylated liposome, and promotes the aggregation of PEG polymers (t = 40000τ). Therefore, under large membrane tension, a bigger ligand-free region has been observed on the surface of the PEGylated liposome, although the ligand–receptor binding for these two cases is almost the same (see Fig. 4D). In addition, we find that the asphericity of the liposomes is not significantly affected by the membrane tension, as shown in Fig. 4E. Therefore, we can conclude that the increment of membrane tension leads to a higher energy barrier and more aggregation of PEG polymers during endocytosis, resulting in the partially wrapped state of the PEGylated liposome.
To further understand the influence of PEG mobility, we systematically vary the molar ratio of PEGylated lipids from 10% to 40%, and the membrane tension from −0.75kBT/r02 to 1.0kBT/r02. The phase diagrams for different wrapping states of the PEGylated rigid NP and the liposome are displayed in Fig. 5. Note that all the distal ends of PEG polymers are conjugated with targeting moieties (ligands) in our simulations. There is a threshold PEG molar ratio value VPEG for both the PEGylated rigid NP and the liposome, below which the ligand–receptor interaction is not strong enough to overcome energy barriers during membrane wrapping. On the other hand, there is also a membrane tension upper bound value VTen, above which the energy penalty from the membrane is too large that prevents endocytosis. These two boundary values divide the whole phase diagram into two regions: fully wrapped and partially wrapped regions. As shown in Fig. 5, the area of the fully wrapped region for the PEGylated liposome is dramatically smaller than that of the PEGylated rigid NP. The fully wrapping state of the PEGylated liposome can only be achieved under the high PEG molar ratio and low membrane tension. This difference further highlights the important role played by the PEG mobility, which will be further analyzed in the next part.
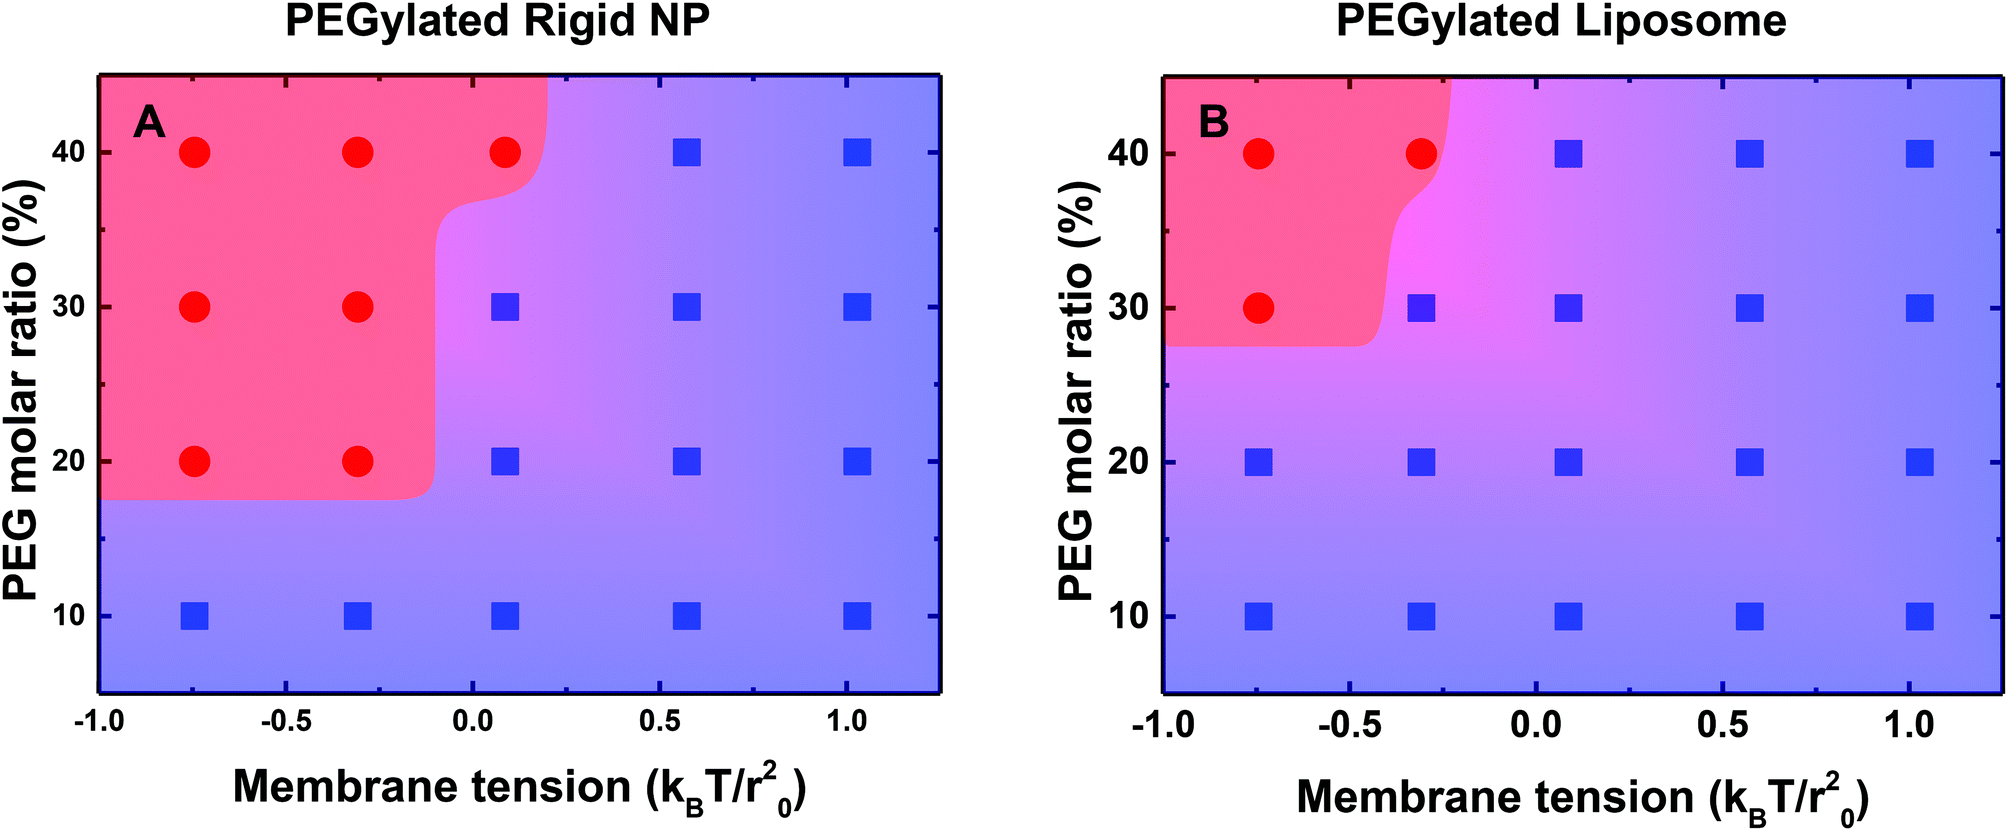 | ||
| Fig. 5 A phase diagram for the membrane wrapping of (A) PEGylated rigid NPs and (B) PEGylated liposomes under the influences of the membrane lateral tension and PEG molar ratio. The red circles represent the cases of being fully membrane wrapped. The blue squares are the cases of being partially membrane wrapped during endocytosis. | ||
2.3. Free energy analysis for membrane wrapping of the PEGylated liposome
To provide a detailed understanding on the important role played by the PEG mobility, we carry out a free energy analysis of the membrane wrapping process of the PEGylated liposome. As evidenced from the simulation results (cf.Fig. 2), the total free energy change of the system consists of (i) the ligand–receptor binding ΔFLR; (ii) deformation of liposome ΔFLIP; (iii) bending and stretching of the cell membrane ΔFMEM; and (iv) the configurational entropy change of PEG polymers ΔFPEG. Note that the possible free energy changes induced by the membrane fluctuation and translational entropy loss of receptors (and solvent molecules) are much smaller than the above energy barriers.50,51 We ignore their contributions to simplify this free energy analysis. Therefore, the total free energy during the membrane wrapping process could be expressed as| ΔF = ΔFLR + ΔFLIP + ΔFMEM + ΔFPEG. | (1) |
If ΔF < 0, the driving force from the ligand–receptor binding is large enough to overcome all the barriers. And the membrane could achieve full wrapping around PEGylated NPs. Otherwise, the wrapping process might be blocked. In this part, taking the example in Fig. 2 (20 mol% PEGylated lipid, membrane tension −0.38kBT/r02), we attempt to analyze all of these energy changes of the PEGylated liposome and compare them with those of the PEGylated rigid NP. First of all, the individual binding strength between the ligand and the receptor in our DPD simulations is about ∼6.8kBT. Thus, the maximum energy gained through ligand–receptor binding is around ΔFLR ≈ −1088kBT, considering the total number of targeting moieties is 160. The estimations of ΔFLIP, ΔFMEM, and ΔFPEG are discussed in the following sections.
 | (2) |
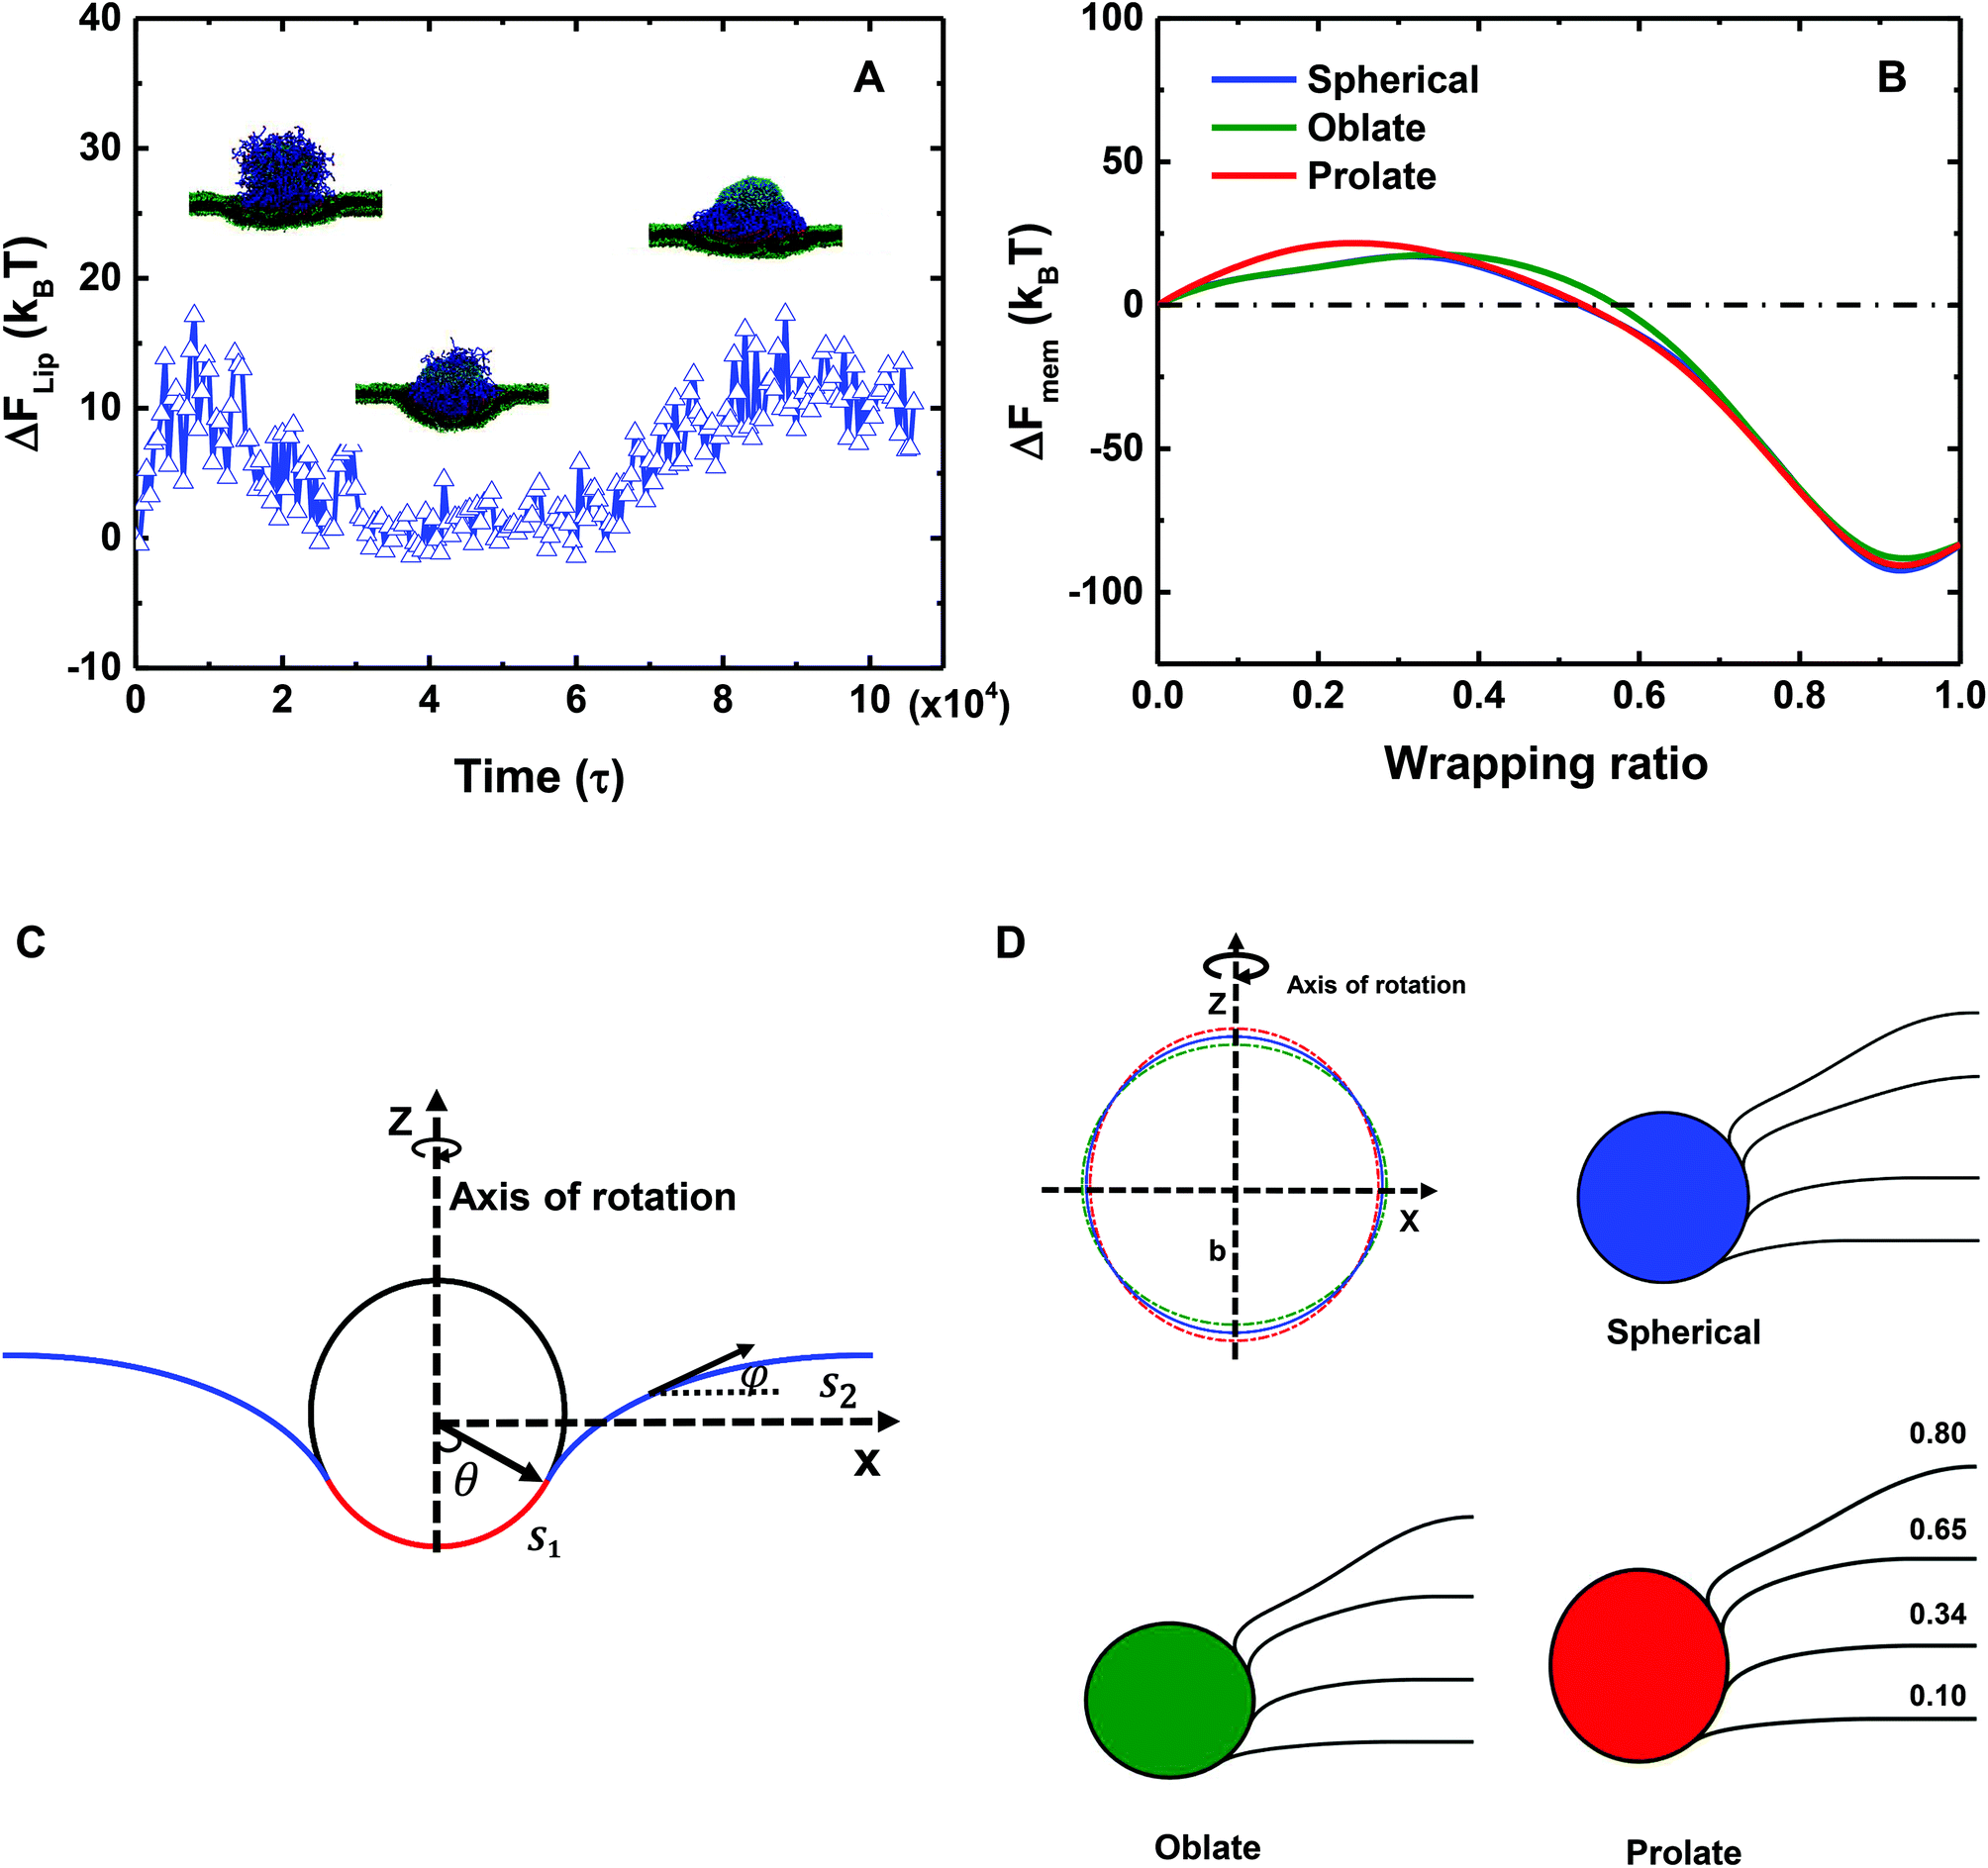 | ||
| Fig. 6 Free energy changes of the liposome and the membrane. (A) The evolution of the bending energy change of the liposome in the course of time. (B) The free energy change of the membrane versus the wrapping ratio. Lines with different colors, such as blue, green and red, represent spherical, oblate and prolate particles, respectively. (C) Illustration of the membrane wrapping geometry and parameters in the theoretical model. θ is the wrapping angle, s denotes arc length, ϕ is the angle tangent to the membrane profile, and z is the axis of rotational symmetry. The red line represents the wrapped part of the cell membrane. The blue line denotes the free part of the cell membrane. (D) The figure on the top left is a schematic of a spherical NP (blue line) with identical size of the PEGylated liposome, and an oblate (green line, a/b > 1) and a prolate (red line, a/b < 1) ellipsoid with an asphericity value of 8. The remaining three drawings show the membrane shapes for spherical, oblate and prolate ellipsoid NPs with wrapping ratios of 0.10, 0.34, 0.65 and 0.80. | ||
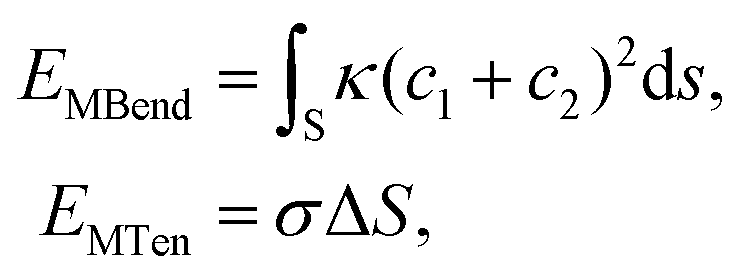
| EMEM = EMBend + EMTen. | (3) |
To estimate the membrane elastic energy in our simulations, a theoretical model is here developed. To this end we assume that a planar membrane wraps around a solid NP (cf.Fig. 6C), which is rotational symmetric with respect to the z axis. Moreover, to evaluate the influence of liposome deformation, three different NPs (Fig. 6D) are considered: (I) a spherical NP with a radius of r; (II) an oblate ellipsoid NP; and (III) a prolate ellipsoid NP. The shape function of both oblate and prolate ellipsoids is defined by (x2 + y2)/a + z2/b = 1, where a and b are the length of major and minor axes of the ellipsoidal particles. All of the three particles share the same volume under the control of relation r = (a2b)1/3. In particular, the specific values of r, a and b are taken as follows: (I) r = 7r0 for the spherical NP, which has the same radius as the liposome; (II) a = 7.198r0 and b = 6.619r0 for the oblate ellipsoidal NP; and (III) a = 6.817r0 and b = 7.380r0 for the prolate ellipsoidal NP. Under these conditions, the asphericity values of both oblate and prolate ellipsoids are 8r02, which is the maximum value of the deformed liposome during the membrane process (cf.Fig. 3C). It is noteworthy in Fig. 6D that the deformation of the liposome is actually small during the whole wrapping process. By comparing the wrapping processes of these three NPs, we should be able to estimate the upper and lower boundaries of the membrane energy change for both the PEGylated rigid NP and the liposome.
Within this model, we consider a symmetric membrane and assume no topological change during the whole membrane wrapping process. The bending and tension energies of the planar membrane are then expressed as
 | (4) |
The membrane energy change ΔFMEM along with the wrapping ratio for all three cases is given in Fig. 6B. At the first stage of the wrapping process, ΔFMEM increases with increasing wrapping ratio, reaching its peak value at around 25kBT. At this stage, the membrane energy change is dominated by the bending energy cost. At a later stage, the tension energy will dominate the whole membrane energy, because of the negative membrane tension and large excess area of lipids. Therefore, ΔFMEM decreases to a negative value of around −80kBT. In addition, due to the deformation of the liposome (cf.Fig. 6D), ΔFMEM can be slightly affected. In short, we could conclude that ΔFMEM < 25kBT for both the PEGylated rigid NP and the liposome. It is also interesting to note the pronounced reduction of membrane energy after a wrapping ratio of 0.5, which might be able to explain why the 20 mol% PEGylated rigid NP and the 40 mol% PEGylated liposome can be fully wrapped after the saturation of ligand–receptor binding under a membrane tension of −0.38kBT/r02.
| ΔFPEG = ΔFel + ΔFint + ΔFtrans. | (5) |
Based on our previous studies,32,33 these free energy changes of PEG polymers can be estimated by feeding self-consistent mean field (SCF) theory with the information about PEG polymer configurations and local volume fractions from DPD simulations. According to SCF theory,32,33 the elastic part Fel of a single PEG chain is linearly proportional to the mean squared extension 〈ree2〉 of a polymer normal to the tethered surface, Fel/kBT = (3/2)〈ree2〉/R02, where R0 represents the equilibrium span of an unconstrained PEG polymer with polymerization degree N. We employ R02 = 〈ree2〉/e using the available 〈ree2(N)〉 values for a single PEG chain in water.32,33 Within the SCF, the mean interaction free energy per chain Fint is quantified through the spatially inhomogeneous volume fraction ϕ of PEG monomers,  , where fm = (ϕ2 + ϕ3)/v for PEG,32 and v = 0.0633 nm3 denotes the excluded volume of a PEG monomer; the integral extends over the mean volume of a single chain. In addition, the translational free energy Ftrans is directly related to the variable distribution of PEG tethering points on the surface. We use the volume fraction to estimate this contribution,
  . If the tethering points are immobile, this purely entropic term is absent. Note that the intrinsic relaxation time of a PEG polymer with polymerization degree N = 30 is about 100 ps,58–61 while a time step Δt in our DPD simulations corresponds to about 118 ps. It means that the PEG polymers are able to relax themselves on a time scale that is short compared with the total simulation time, the equilibrium SCF approach can be considered applicable, and we can extract ΔFPEG in the course of time. In the following, we will monitor both the volume fraction distribution ϕ and the mean end-to-end distance of PEG polymers
  (M is the total number of PEG polymers) in the simulations. By transferring the information about ϕ and Ree into the Fel, Fint and Ftrans formulas above, we can directly calculate the corresponding free energy changes. More details about the free energy changes of PEG polymers are given in section 1.4 of the ESI.†
The local volume fraction distribution of PEG polymers changes along with the rearrangement of polymer chains during membrane wrapping. The PEG volume fraction distribution is given in Fig. 7 for both the PEGylated rigid NP and the liposome. For the PEGylated rigid NP, the volume fraction of PEG chains in the wrapped region of the NP is increased (t = 5000–10000τ) compared to its initial state. Within the wrapped region, the occupied space of PEG polymers is reduced due to the confinement from the rigid NP core and the membrane. One the other hand, we observe highly concentrated PEG polymer segments at time t = 40000–100000τ, induced by the aggregation of bound receptors.44 For the PEGylated liposome, apart from these two phenomena, the aggregation of mobile PEG polymers on the liposome further contributes to a highly inhomogeneous volume fraction distribution (t = 5000, 10000τ in Fig. 7B). This inhomogeneity is more pronounced for the PEGylated liposome during the ‘bouncing back’ stage (t = 50000–100000τ in Fig. 7B), in comparison with the PEGylated rigid NP. All these observations confirm that the mobility of PEG polymers on the PEGylated liposome facilitates their aggregation during the membrane wrapping process, which creates additional energy barriers.
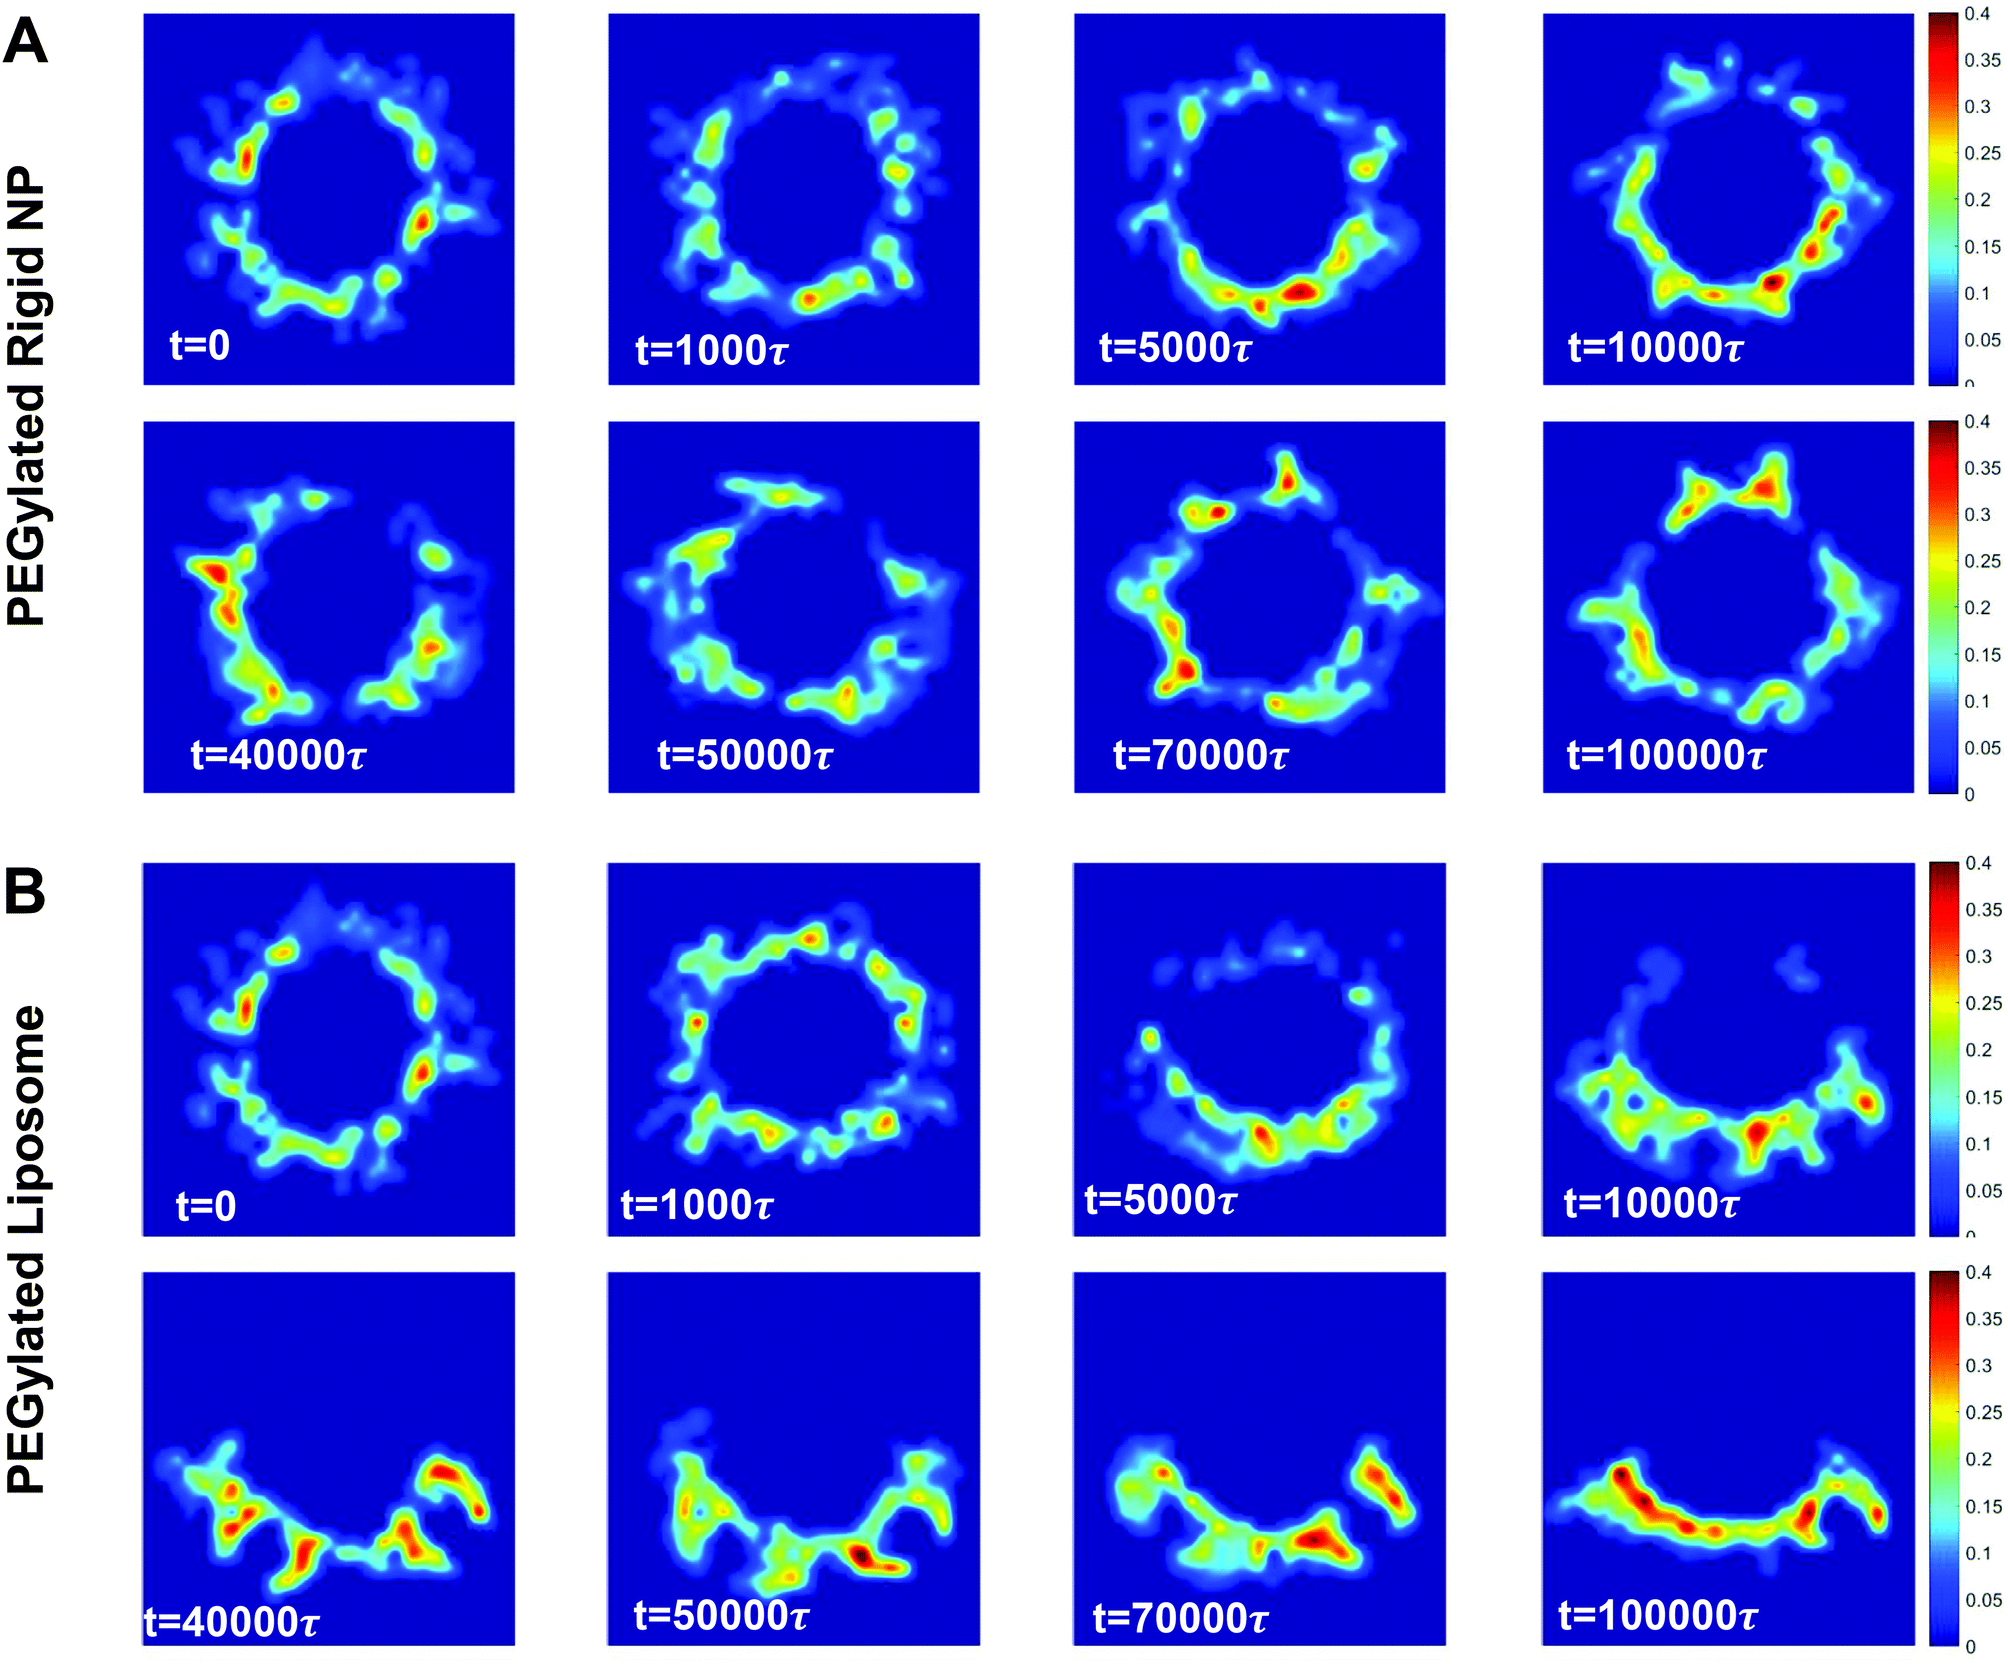 | ||
| Fig. 7 Cross-sectional views of PEG polymer volume fraction distribution during the membrane wrapping process: (A) PEGylated rigid NP and (B) PEGylated liposome. | ||
The mean end-to-end distance Ree of the PEG polymers also changes along with the ligand–receptor binding. As illustrated in Fig. 8A, the value of Ree for both the PEGylated rigid NP and the liposome increases rapidly at the initial stage because of stretching of individual PEG polymers during ligand–receptor binding. However, the Ree of the PEGylated liposome exceeds that of the PEGylated rigid NP due to the PEG mobility facilitated ligand–receptor binding. Interestingly, after the ‘bouncing back’ of the PEGylated liposome, its Ree value decreases and converges to that of the PEGylated rigid NP.
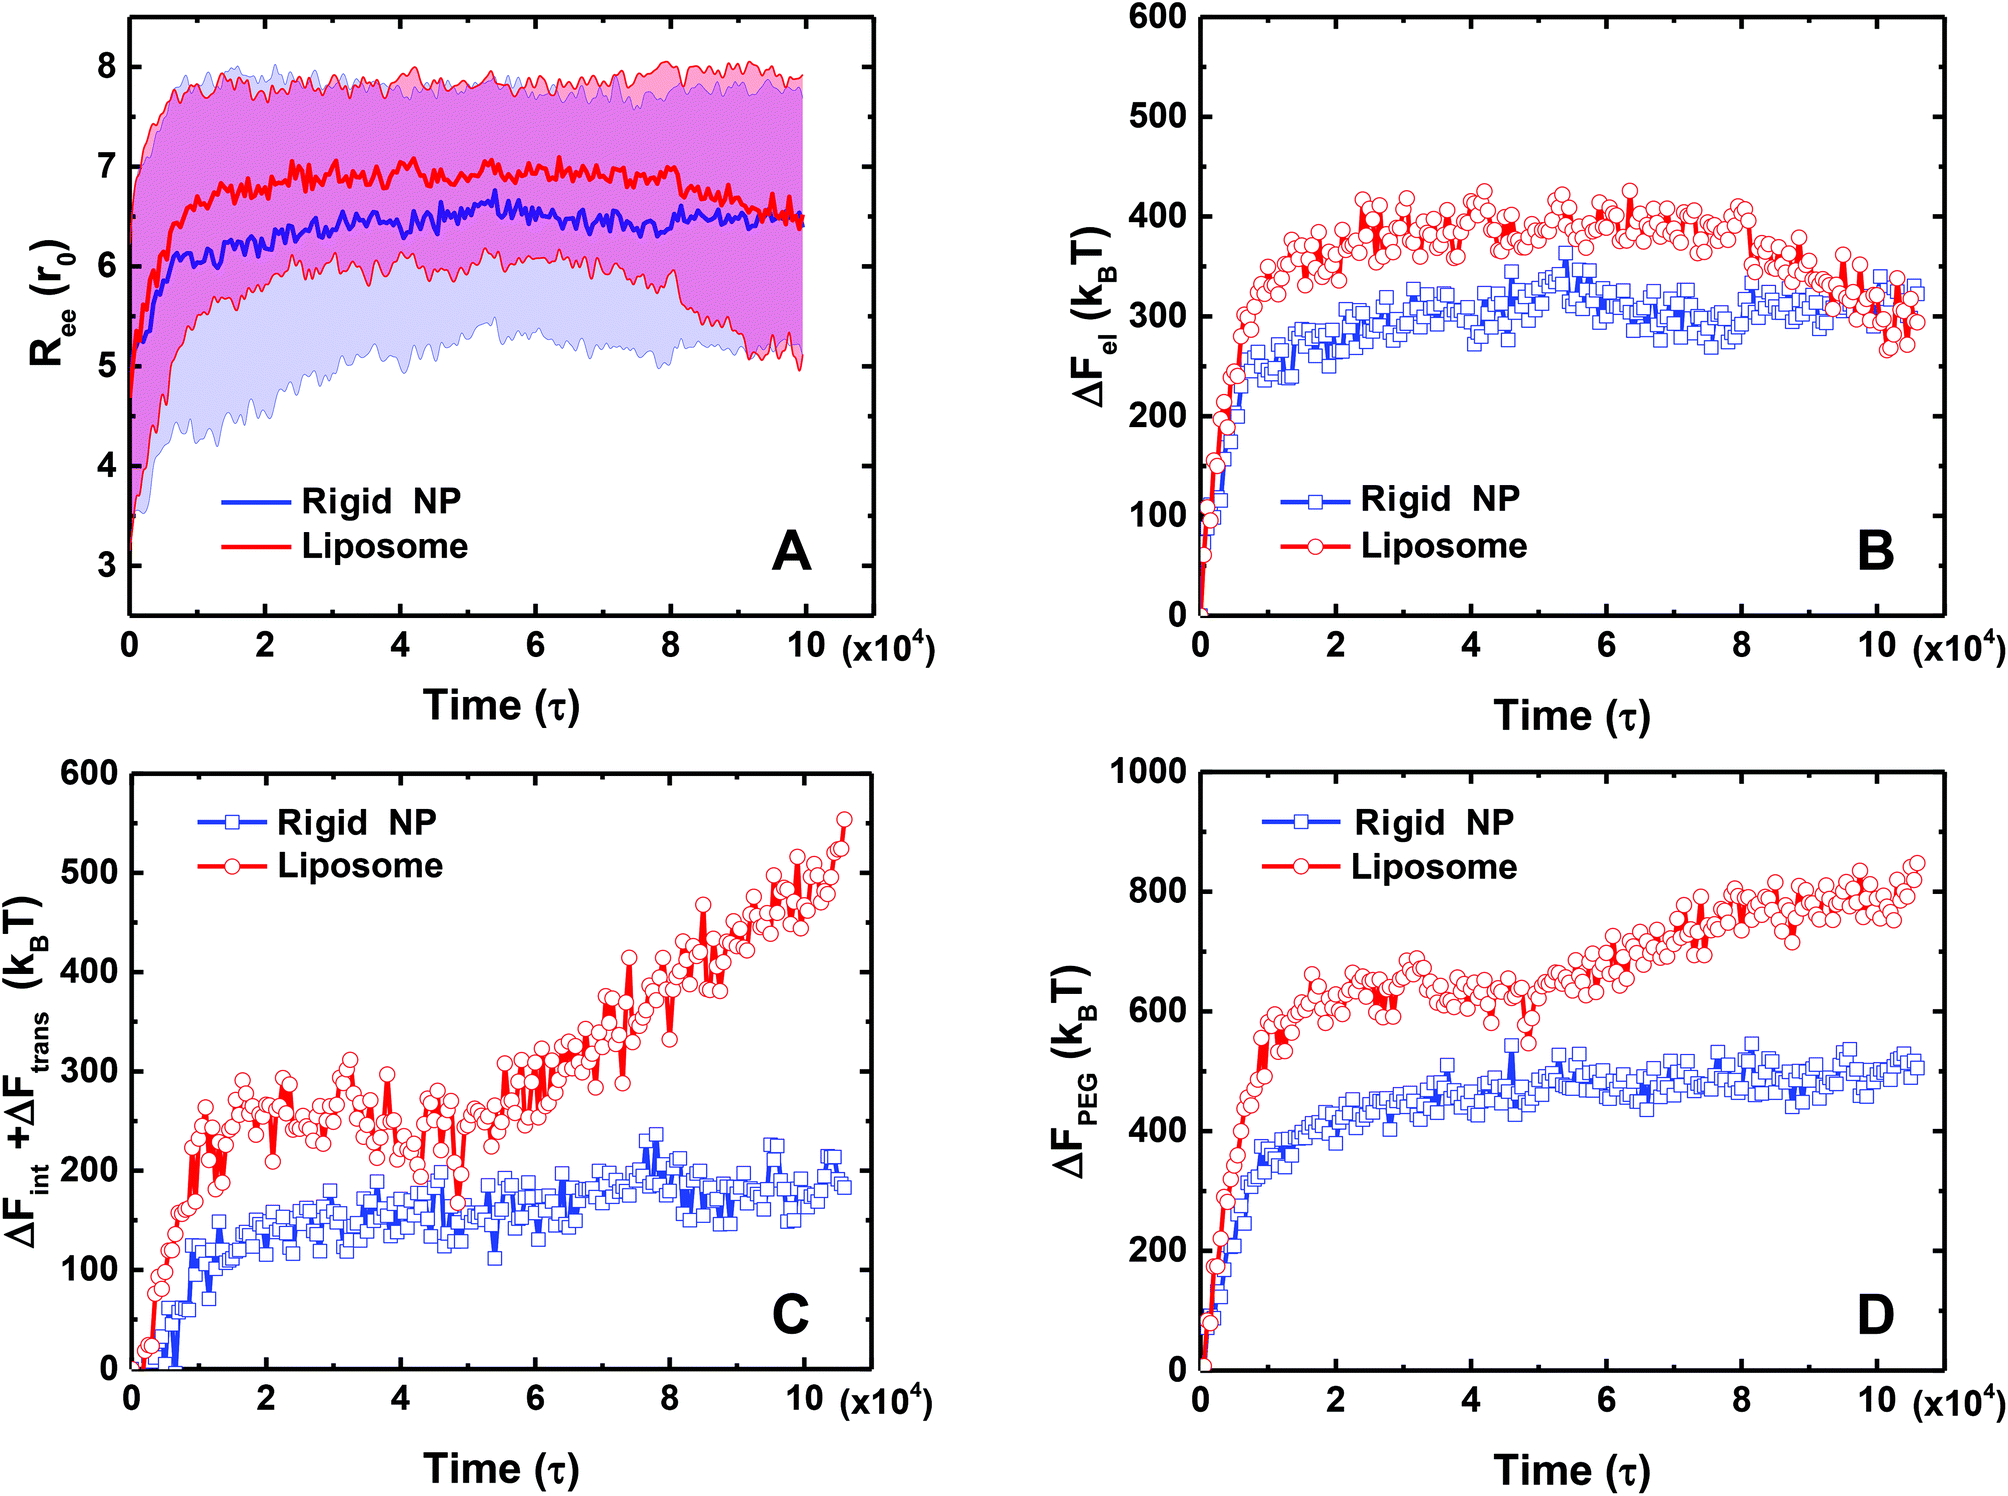 | ||
| Fig. 8 A comparison of mean end-to-end distance and free energy changes of PEG polymers between a PEGylated rigid NP and a liposome in the course of time: (A) mean end-to-end distance Ree, (B) elastic free energy change ΔFel, (C) translational and interaction free energy change ΔFint + ΔFtrans, and (D) total free energy change ΔFPEG of PEG polymers. | ||
The corresponding free energy changes from PEG polymers during membrane wrapping are illustrated in Fig. 8. The features of the free energy profiles are different at the membrane bending stage (0 < t < 50000τ) and liposome ‘bouncing back’ stage (t > 50000τ) for the PEGylated liposome. At the membrane bending stage, both ΔFel and ΔFint + ΔFtrans of the PEGylated liposome increase rapidly, reaching values of 400kBT and 300kBT, respectively. Over the same time period, these energy penalties from the PEGylated rigid NP also increase, but reach smaller values of 300kBT and 150kBT, respectively. These differences should be attributed to the aggregation induced inhomogeneous distribution of PEG volume fractions and the large end-to-end distance value. At the liposome ‘bouncing back’ stage, the elastic energy ΔFel of the PEGylated liposome decreases and becomes comparable to that of the PEGylated rigid NP, while its interaction and translational free energy ΔFint + ΔFtrans further increases. This competition between ΔFel and ΔFint + ΔFtrans leads to the increment of the total PEG polymer energy penalty and reaches a plateau at the end. In comparison, over the same time period, the PEG free energy changes of the PEGlyated rigid NP almost remain unchanged after saturation of the ligand–receptor binding (Fig. 8D). In summary, we obtain ΔFPEG ≃ 800kBT for the PEGylated liposome and ΔFPEG ≃ 450kBT for the PEGylated rigid NP.
To sum up the above free energy analysis results, we have calculated separate contribution to the energy barriers: (1) for the PEGylated liposome, ΔFLIP < 20kBT, ΔFMEM < 25kBT and ΔFPEG ≃ 800kBT; and (2) for the PEGylated rigid NP, ΔFLIP = 0, ΔFMEM < 25kBT and ΔFPEG ≃ 450kBT. In light of these findings, the energy barrier from PEG polymers is the main factor prohibiting the endocytosis of the PEGylated rigid NP and the liposome. More importantly, the PEG mobility-induced aggregation further increases the value of ΔFPEG ≃ 800kBT, in comparison with that of the PEGylated rigid NP, ΔFPEG ≃ 450kBT. Such a large energy barrier ΔFPEG induced by the aggregation of PEG polymers and the appearance of a ligand-free region on the liposome surface are the main reasons that the PEGylated liposome is more easily trapped during the membrane wrapping process.
To further confirm the important role played by the PEG aggregation, we treat the water beads inside the liposome as a single rigid body to prevent the deformation of the liposome during membrane wrapping. The tethered PEG polymers are still able to diffuse on the liposome's surface. All other conditions remain the same as for the case depicted in Fig. 2. As shown in Fig. S6 of the ESI,† the membrane wrapping process of this PEGylated liposome with a rigid core follows the similar behavior of the PEGylated liposome. The PEG polymers aggregate within the contact region between the liposome and the membrane, leading to a trapped and partially wrapped state of the PEGylated liposome. Besides this, the wrapping ratio and the ligand–receptor binding ratio of this case are very similar to those of the PEGylated liposome, indicating that the deformation of the liposome plays a negligible role during membrane wrapping. However, the asphericity value of the liposome stays constant since the interior water beads are treated as a single rigid body.
2.4. Correlation with theoretical and experimental observations
Our DPD simulation results suggest that the mobility of polymers on the PEGylated liposome can induce their aggregation within the contact region during the membrane wrapping process. Such an aggregation can lead to an inhomogeneous distribution of PEG polymers and targeting moieties (ligands) on their free ends. Although the mobility of PEG polymers and their flexibility can promote the ligand–receptor binding and adhesion of PEGylated NPs at the early stage of the membrane wrapping process, the aggregation of PEG polymers also results in a higher energy barrier and ligand-free region on the liposome surface. Both of these factors give rise to the inefficient cellular uptake of PEGylated liposomes, in comparison with PEGylated rigid NPs. In fact, the ligand distribution on the NP surface is also an important design parameter. Both theoretical and computational studies suggest that the inhomogeneous distribution of ligands on a NP surface can prohibit the endocytosis of NPs.48,62 For instance, Schubertová et al. explored the influence of the ligand distribution on the cellular uptake efficiency of rigid NPs through coarse-grained molecular simulations.48 The simulation results reveal that the NPs with homogeneous ligand distributions demonstrate fast membrane wrapping and cellular uptake, while the diffusion of ligands on the NP surface can delay and block the uptake of NPs, due to the ligand-free NP surface. Moreover, a recent theoretical study by Michele et al.63 argues that the mobility of ligands on the NP surface can accumulate and impede the endocytosis. They propose that the increment of the steric force between ligands can prevent their aggregation and facilitate the endocytosis of NPs with movable ligands. However, the influence of tethered PEG polymers was not considered in these studies, thus ignoring the large energy barrier induced by the aggregation of PEG polymers.In experiments, a large number of studies demonstrate that conjugated targeting moieties on the distal ends of PEG polymers can effectively facilitate the internalization of PEGylated rigid (gold) NPs.64–66 However, there are pieces of evidence showing that decorating ligands on the free ends of the liposome's PEG polymers might not be enough to efficiently deliver the encapsulated drug molecules into tumor cells. For instance, Goren et al.67 demonstrate that the adhesion of a ligand (anti-erbB2-2) conjugated PEGylated liposome on N-87 cell surfaces (erbB-2-positive human gastric carcinoma) can be significantly improved, compared to a plain PEGylated liposome. However, no improvement in cytotoxicity against N-87 cells can be observed, which indicates that the conjugation of ligands can barely improve the internalization of the PEGylated liposome. On the other hand, utilizing receptor-specific peptides as ligands, Stefanick et al.14,68 showed that the number of peptide-conjugated PEGylated liposomes internalized by H929 and MM.1S multiple myeloma cells cannot be increased compared with a plain PEGylated liposome. However, increasing the hydrophilicity between peptides can dramatically improve the internalization of the peptide-conjugated PEGylated liposome. All these experimental observations can be explained by our simulation results: the mobility of PEG polymers and conjugated targeting moieties can promote the binding and adhesion of PEGylated liposomes on cell surfaces, but can impede the membrane wrapping due to the large energy penalty induced by the PEG polymer aggregation. Therefore, increasing the repulsive interactions between PEG polymers or targeting moieties can reduce their aggregation and facilitate the endocytosis.
3. Conclusion
In this work, we performed large scale DPD simulations to understand the influence of PEG polymer mobility during the endocytosis of PEGylated liposomes. Comparing the membrane wrapping processes of a PEGylated rigid NP and a liposome under identical conditions, we find that the PEGylated liposome gets only partially wrapped, while the PEGylated rigid NP can be fully wrapped by the cell membrane. During the membrane wrapping process, the mobility of PEG polymers enables them to diffuse on the liposome surface and to rearrange themselves to promote the ligand–receptor binding and adhesion of the PEGylated liposome. However, the aggregation of PEG polymers also occurs within the contact region between the liposome and the membrane, leading to a ligand-free region on the liposome. The PEG polymer aggregation and ligand-free region on the liposome surface block the further membrane wrapping and result in the ‘bouncing back’ of the liposome to a less wrapped state. By systematically varying the molar ratio of PEGylation and membrane tension, we find that the PEGylated liposomes are overall more difficult to be fully wrapped than PEGylated rigid NPs. To understand the physical mechanisms behind this difference, we analyzed the free energy changes of the PEGylated liposome during its membrane wrapping process, including the bending energy change of the liposome, the elastic energy change of the membrane, the ligand–receptor binding energy change, and the free energy change of the PEG polymers, and compared them with those of the PEGylated rigid NP. We find that the free energy penalty induced by the aggregation of PEG polymers is about ∼800kBT for the PEGylated liposome, which is twice that of the PEGylated rigid NP. We therefore conclude that the large free energy penalty induced by PEG aggregation, and the ligand-free region on the liposome surface are the main reasons that PEGylated liposomes cannot be efficiently taken up by tumor cells. In addition, we suggest that by increasing the repulsive interactions between grafted PEG polymers or targeting moieties might help to limit their aggregation, and in turn, facilitate the internalization of the PEGylated liposome. The current study provides fundamental insights into the endocytosis of PEGylated liposomes, which could help to design PEGylated liposomes with high efficacy for drug delivery.4. Models and methods
All coarse-grained molecular simulations performed in this work are based on the dissipative particle dynamics (DPD) method.69,70 The basic interacting sites in DPD simulations are represented by soft beads. Between each pair of DPD beads, effective two-body interactions consist of three major forces:69,70 a conservative force FC, a random force FR and a dissipative force FD. Specifically, the conservative force between beads i and j is FijC = aijω(rij)eij, where rij denotes the distance between the two beads i and j, and eij is the unit vector pointing from i to j; aij represents the maximum repulsion force. The weighting factor ω(rij) is a normalized distribution function as ω(rij) = 1 − rij/r0 for rij ≤ r0, while ω(rij) = 0 for rij > r0. Here r0 is the cutoff distance for pairwise interactions. The random forces are specified by , where α represents a normal distributed Gaussian random number with zero mean and unit variance, Δt = 0.01τ with
  denotes the integration time step, βij is a bead friction coefficient. The dissipative force is given by FijD = −βijω2(rij)(eij·vij)eij, where vij is the relative velocity vector between beads i and j. All pair-wise interactions aij between different types of beads are listed in ESI Table S1.†
All the lipid molecules in our simulations share the same model, in which two lipid tails (with four tail beads each) are connected with two head beads, respectively. The head group contains three head beads. Adjacent beads making the lipid molecules are connected by a harmonic spring potential Us1 = Ks1(rij − rs1)2, with spring coefficient Ks1 = 64kBT/r02, and equilibrium distance rs1 = 0.5r0. The stiffness of the lipid tails is guaranteed by an angular potential Uθ1 = Kθ1(1 − cosθ) with Kθ1 = 15kBT. Under control of these potentials, the tension of a planar bilayer is linearly related to the lipid molecular area.71,72 The stretch modulus of the membrane can be obtained from the related slope (ESI Fig. S1†) as KA = 17.42kBT/r02. The bending rigidity of the membrane is given by73,74κ = KAdhh2/48 with κ ≈ 6kBT. The physical length corresponding to our simulation units are obtained by comparing the membrane thickness in simulations dHH = 4r0 to the thickness of a real membrane, dHH ≈ 3.53 nm,75 indicating r0 = 0.9 nm. The experimental lipid lateral diffusion coefficient of DMPC76 is D ≃ 5 μm2 s−1. In our simulations, the lipid lateral diffusion coefficient, Dlipid ≃ 7.3 × 10⁻²r02/τ, is obtained by averaging the values under different membrane tensions (cf. Fig. S2†). Herefrom, we estimate the physical time scale τ = 11.8 ns. Note that these spatial and temporal mappings are only used to approximate the length and time scales of all DPD simulations, which are different from the real length and time scales in all-atom molecular dynamics simulations.
A hydrophilic PEG polymer in our DPD simulations is modeled by a linear chain consisting of coarse-grained monomers. The monomers of PEG polymers are sequentially connected by a harmonic bond potential: Us2 = Ks2(rij − rs2)2, with spring stiffness Ks2 = 2111.3kBT/r02 and equilibrium distance rs2 = 0.4125r0. The known flexibility of the PEG polymer is taken into account by an angular potential between each three consecutive monomers, defined by Uθ2 = Kθ2(cosθ − cosθ02), with bending stiffness Kθ2 = 16.4946kBT, and equilibrium angle θ0 = 130°. Such a DPD PEG model could correctly reproduce the conformation of a PEG polymer in water, including the radius of gyration and end-to-end distance, as shown in our previous studies.32,33 To describe the PEGylated lipid, one end of the PEG polymer is bonded to the lipid head bead through a harmonic bond potential. In addition, the monomers at the free end of PEG polymers are defined to act as targeting moieties (ligands) (cf.Fig. 1). The polymerization degree of PEG polymers in our simulation is set to N = 30 (representing a molecular weight around 1000 Da), falling within the typical range of 500–5000 Da in experiments.7,15,77
To mimic the ligand–receptor interaction during endocytosis, we assume that 50% of lipid molecules in the planar bilayer act as receptors. In this way, the receptor diffusion will not be a factor that limits the efficiency during the membrane wrapping in our simulation.24,78 Receptors in the planar membrane follow the same configuration as a lipid, with the head bead acting as an active site to interact with the ligand. The ligand–receptor interaction follows a modified Lennard–Jones potential32,33 as Uij = 4εligand[(σb/rij)12 − (σb/rij)6] − Ucut, when rij ≤ rcut and Uij = 0 otherwise. Here, rcut = r0 for a short-range attractive interaction and Ucut = 4εligand[(σb/r0)12 − (σb/r0)6]. The equilibrium distance is fixed by σ = 0.624r0. Additionally, the repulsive force is limited to 25kBT/r0. We use εligand = 12kBT. The single ligand–receptor binding energy is then around 6.8kBT.32
Due to the elasticity of the lipid membrane, the tension of membranes in cells can be adjusted, changing from 0.01 to 10 mN m−1.49 The N-varied DPD method is applied during the endocytosis process to ensure a constant tension of the planar membrane.32,33,39–41 In practice, the boundaries of the lipid bilayer are treated as a lipid reservoir for addition and removal of lipids. If the lipid number per unit area is larger (or smaller) than the target density ρ1 (or ρ2), lipid molecules will be deleted (or inserted) into this boundary region to maintain a constant lipid number density. Meanwhile, a corresponding number of water molecules will be inserted (or deleted) randomly in the simulation box to ensure a constant bead density of 3.0/r03 in the simulation box. By using the N-varied DPD protocol, the lipid density in the membrane can easily be controlled to maintain the membrane's lateral tension during the endocytosis process. More details are given in the ESI.†
Conflicts of interest
There are no conflicts to declare.Acknowledgements
Z. S., H. Y. and Y. L. are grateful for support from the Department of Mechanical Engineering at the University of Connecticut. Z. S. is thankful for partial financial support from the GE Fellowship for innovation. Z. S. thanks Jiuling Wang for the insightful discussions about the PSO algorithm. This research benefited in part from the computational resources and staff contributions provided for Booth Engineering Center for Advanced Technology (BECAT) at the University of Connecticut. A part of this work used the Extreme Science and Engineering Discovery Environment (XSEDE), which is supported by National Science Foundation grant number ACI-1053575. The contribution by M. K. was promoted by the Swiss National Science Foundation through grant 200021_156106.References
- D. Peer, J. M. Karp, S. Hong, O. C. Farokhzad, R. Margalit and R. Langer, Nat. Nanotechnol., 2007, 2, 751–760 CrossRef CAS PubMed.
- R. Langer and D. A. Tirrell, Nature, 2004, 428, 487–492 CrossRef CAS PubMed.
- A. Albanese, P. S. Tang and W. C. Chan, Annu. Rev. Biomed. Eng., 2012, 14, 1–16 CrossRef CAS PubMed.
- S. Wilhelm, A. J. Tavares, Q. Dai, S. Ohta, J. Audet, H. F. Dvorak and W. C. Chan, Nat. Rev. Mater., 2016, 1, 16014 CrossRef CAS.
- K. Cho, X. Wang, S. Nie, Z. Chen and D. M. Shin, Clin. Cancer Res., 2008, 14, 1310–1316 CrossRef CAS PubMed.
- R. K. Jain and T. Stylianopoulos, Nat. Rev. Clin. Oncol., 2010, 7, 653–664 CrossRef CAS PubMed.
- C. D. Walkey, J. B. Olsen, H. Guo, A. Emili and W. C. W. Chan, J. Am. Chem. Soc., 2012, 134, 2139–2147 CrossRef CAS PubMed.
- Z. Shen, M.-P. Nieh and Y. Li, Polymers, 2016, 8, 83 CrossRef.
- Y. Li, Y. Lian, L. T. Zhang, S. M. Aldousari, H. S. Hedia, S. A. Asiri and W. K. Liu, Interface Focus, 2016, 6, 20150086 CrossRef PubMed.
- S. Angioletti-Uberti, npj Comput. Mater., 2017, 3, 48 CrossRef.
- Y. C. Barenholz, J. Controlled Release, 2012, 160, 117–134 CrossRef CAS PubMed.
- V. P. Torchilin, Nat. Rev. Drug Discovery, 2005, 4, 145–160 CrossRef CAS PubMed.
- P. Nativo, I. A. Prior and M. Brust, ACS Nano, 2008, 2, 1639–1644 CrossRef CAS PubMed.
- J. F. Stefanick, J. D. Ashley and B. Bilgicer, ACS Nano, 2013, 7, 8115–8127 CrossRef CAS PubMed.
- E. C. Cho, L. Au, Q. Zhang and Y. Xia, Small, 2010, 6, 517–522 CrossRef CAS PubMed.
- M. L. Immordino, F. Dosio and L. Cattel, Int. J. Nanomed., 2006, 1, 297 CrossRef CAS PubMed.
- K. Harrington, G. Rowlinson-Busza, K. Syrigos, R. Abra, P. Uster, A. Peters and J. Stewart, Br. J. Cancer, 2000, 83, 684 CrossRef CAS PubMed.
- K. Harrington, G. Rowlinson-Busza, K. Syrigos, P. Uster, R. Abra and J. Stewart, Br. J. Cancer, 2000, 83, 232 CrossRef CAS PubMed.
- S. Zhang, H. Gao and G. Bao, ACS Nano, 2015, 9, 8655–8671 CrossRef CAS PubMed.
- H.-M. Ding and Y.-Q. Ma, Small, 2015, 11, 1055–1071 CrossRef CAS PubMed.
- G. J. Doherty and H. T. McMahon, Annu. Rev. Biochem., 2009, 78, 857–902 CrossRef CAS PubMed.
- L. Y. Chou, K. Ming and W. C. Chan, Chem. Soc. Rev., 2011, 40, 233–245 RSC.
- X. Yi and H. Gao, Nanoscale, 2017, 9, 454–463 RSC.
- H. Gao, W. Shi and L. B. Freund, Proc. Natl. Acad. Sci. U. S. A., 2005, 102, 9469–9474 CrossRef CAS PubMed.
- S. Zhang, J. Li, G. Lykotrafitis, G. Bao and S. Suresh, Adv. Mater., 2009, 21, 419–424 CrossRef CAS PubMed.
- W. Jiang, B. Y. Kim, J. T. Rutka and W. C. Chan, Nat. Nanotechnol., 2008, 3, 145–150 CrossRef CAS PubMed.
- H. Yuan, J. Li, G. Bao and S. Zhang, Phys. Rev. Lett., 2010, 105, 138101 CrossRef PubMed.
- B. D. Chithrani and W. C. Chan, Nano Lett., 2007, 7, 1542–1550 CrossRef CAS PubMed.
- X. Yi, X. Shi and H. Gao, Phys. Rev. Lett., 2011, 107, 098101 CrossRef PubMed.
- J. Sun, L. Zhang, J. Wang, Q. Feng, D. Liu, Q. Yin, D. Xu, Y. Wei, B. Ding and X. Shi, et al. , Adv. Mater., 2015, 27, 1402–1407 CrossRef CAS PubMed.
- C. Huang, Y. Zhang, H. Yuan, H. Gao and S. Zhang, Nano Lett., 2013, 13, 4546–4550 CrossRef CAS PubMed.
- Y. Li, M. Kröger and W. K. Liu, Biomaterials, 2014, 35, 8467–8478 CrossRef CAS PubMed.
- Y. Li, M. Kröger and W. K. Liu, Nanoscale, 2015, 7, 16631–16646 RSC.
- X. Shi, A. von Dem Bussche, R. H. Hurt, A. B. Kane and H. Gao, Nat. Nanotechnol., 2011, 6, 714–719 CrossRef CAS PubMed.
- R. Nap, Y.-Y. Won and I. Szleifer, Soft Matter, 2012, 8, 1688–1700 RSC.
- H. Djohari and E. E. Dormidontova, Biomacromolecules, 2009, 10, 3089–3097 CrossRef CAS PubMed.
- Z. Li and A. A. Gorfe, Nanoscale, 2015, 7, 814–824 RSC.
- Z. Shen, D. T. Loe, J. K. Awino, M. Kröger, J. L. Rouge and Y. Li, Nanoscale, 2016, 8, 14821–14835 RSC.
- B. Hong, F. Qiu, H. Zhang and Y. Yang, J. Phys. Chem. B, 2007, 111, 5837–5849 CrossRef CAS PubMed.
- H.-m. Ding and Y.-q. Ma, Biomaterials, 2014, 35, 8703–8710 CrossRef CAS PubMed.
- Y. Li, X. Zhang and D. Cao, Nanoscale, 2015, 7, 2758–2769 RSC.
- T. Yue, X. Zhang and F. Huang, Soft Matter, 2014, 10, 2024–2034 RSC.
- X. Chen, F. Tian, X. Zhang and W. Wang, Soft Matter, 2013, 9, 7592–7600 RSC.
- J. Liang, P. Chen, B. Dong, Z. Huang, K. Zhao and L.-T. Yan, Biomacromolecules, 2016, 17, 1834–1844 CrossRef CAS PubMed.
- N. W. Moore and T. L. Kuhl, Biophys. J., 2006, 91, 1675–1687 CrossRef CAS PubMed.
- C. Jeppesen, J. Y. Wong, T. L. Kuhl, J. N. Israelachvili, N. Mullah, S. Zalipsky and C. M. Marques, Science, 2001, 293, 465–468 CrossRef CAS PubMed.
- J. Y. Wong and T. L. Kuhl, Langmuir, 2008, 24, 1225–1231 CrossRef CAS PubMed.
- V. Schubertová, F. J. Martinez-Veracoechea and R. Vácha, Soft Matter, 2015, 11, 2726–2730 RSC.
- N. C. Gauthier, T. A. Masters and M. P. Sheetz, Trends Cell Biol., 2012, 22, 527–535 CrossRef CAS PubMed.
- J. Liu, G. E. Weller, B. Zern, P. S. Ayyaswamy, D. M. Eckmann, V. R. Muzykantov and R. Radhakrishnan, Proc. Natl. Acad. Sci. U. S. A., 2010, 107, 16530–16535 CrossRef CAS PubMed.
- R. Bradley and R. Radhakrishnan, Polymers, 2013, 5, 890–936 CrossRef PubMed.
- Z. Shen, H. Ye, M. Kröger and Y. Li, Phys. Chem. Chem. Phys., 2017, 19, 13294–13306 RSC.
- W. Helfrich, Z. Naturforsch., C: J. Biosci., 1973, 28, 693–703 CAS.
- F. Jülicher and R. Lipowsky, Phys. Rev. Lett., 1993, 70, 2964 CrossRef PubMed.
- J. Wang, H. Yao and X. Shi, J. Mech. Phys. Solids, 2014, 73, 151–165 CrossRef CAS.
- W. Góźdź, Langmuir, 2007, 23, 5665–5669 CrossRef PubMed.
- M. Deserno, Phys. Rev. E, 2004, 69, 031903 CrossRef PubMed.
- G. Vicq, G. Delbos, J. F. Marquina and K. Lamkaouchi, J. Chim. Phys. Phys.-Chim. Biol., 1999, 96, 1426–1449 CrossRef CAS.
- C. Mali, S. Chavan, K. Kanse, A. Kumbharkhane and S. Mehrotra, Indian J. Pure Appl. Phys., 2007, 45, 476–481 CAS.
- H. Purohit and R. Sengwa, J. Mol. Liq., 1988, 39, 43–52 CrossRef CAS.
- J. Y. Wong, T. L. Kuhl, J. N. Israelachvili, N. Mullah and S. Zalipsky, Science, 1997, 275, 820–822 CrossRef CAS PubMed.
- L. Li, Y. Zhang and J. Wang, R. Soc. Open Sci., 2017, 4, 170063 CrossRef PubMed.
- L. Di Michele, P. K. Jana and B. M. Mognetti, 2017, arXiv preprint arXiv:1708.03733.
- C. H. J. Choi, C. A. Alabi, P. Webster and M. E. Davis, Proc. Natl. Acad. Sci. U. S. A., 2010, 107, 1235–1240 CrossRef CAS PubMed.
- S. Dixit, T. Novak, K. Miller, Y. Zhu, M. E. Kenney and A.-M. Broome, Nanoscale, 2015, 7, 1782–1790 RSC.
- Y. Cheng, J. D. Meyers, R. S. Agnes, T. L. Doane, M. E. Kenney, A.-M. Broome, C. Burda and J. P. Basilion, Small, 2011, 7, 2301–2306 CrossRef CAS PubMed.
- D. Goren, A. Horowitz, S. Zalipsky, M. Woodle, Y. Yarden and A. Gabizon, Br. J. Cancer, 1996, 74, 1749 CrossRef CAS PubMed.
- J. F. Stefanick, Design of ligand-targeted nanoparticles for enhanced cancer targeting, University of Notre Dame, 2014 Search PubMed.
- P. J. Hoogerbrugge and J. M. V. A. Koelman, Europhys. Lett., 1992, 19, 155 CrossRef.
- R. D. Groot and P. B. Warren, J. Chem. Phys., 1997, 107, 4423 CrossRef CAS.
- A. Grafmüller, J. Shillcock and R. Lipowsky, Biophys. J., 2009, 96, 2658–2675 CrossRef PubMed.
- A. Grafmüller, J. Shillcock and R. Lipowsky, Phys. Rev. Lett., 2007, 98, 218101 CrossRef PubMed.
- M. Mutz and W. Helfrich, J. Phys., 1990, 51, 991–1001 CAS.
- R. Goetz, G. Gompper and R. Lipowsky, Phys. Rev. Lett., 1999, 82, 221 CrossRef CAS.
- N. Kučerka, Y. Liu, N. Chu, H. I. Petrache, S. Tristram-Nagle and J. F. Nagle, Biophys. J., 2005, 88, 2626–2637 CrossRef PubMed.
- G. Orädd, G. Lindblom and P. W. Westerman, Biophys. J., 2002, 83, 2702–2704 CrossRef.
- A. de la Zerda, S. Bodapati, R. Teed, S. Y. May, S. M. Tabakman, Z. Liu, B. T. Khuri-Yakub, X. Chen, H. Dai and S. S. Gambhir, ACS Nano, 2012, 6, 4694–4701 CrossRef CAS PubMed.
- R. Vácha, F. J. Martinez-Veracoechea and D. Frenkel, Nano Lett., 2011, 11, 5391–5395 CrossRef PubMed.
Footnote |
| † Electronic supplementary information (ESI) available: Details of the computational models for PEGylated liposomes and lipid membranes, computational methods and additional simulation results. See DOI: 10.1039/C7NR09011K |
| This journal is © The Royal Society of Chemistry 2018 |