 Open Access Article
Creative Commons Attribution 3.0 Unported Licence
Ultrafast magnetization dynamics in a nanoscale three-dimensional cobalt tetrapod structure
Sourav
Sahoo
a,
Sucheta
Mondal
a,
Gwilym
Williams
b,
Andrew
May
b,
Sam
Ladak
 b and
Anjan
Barman
 *a
*a
aDepartment of Condensed Matter Physics and Material Sciences, S. N. Bose National Centre for Basic Sciences, Block JD, Sector III, Salt Lake, Kolkata 700 106, India. E-mail: abarman@bose.res.in
bSchool of Physics and Astronomy, Cardiff University, Cardiff CF24 3AA, UK
First published on 17th May 2018
Abstract
Three-dimensional magnetic nanostructures are now attracting intense interest due to their potential as ultrahigh density future magnetic storage devices. Here, we report on the study of ultrafast magnetization dynamics of a complex three-dimensional magnetic nanostructure. Arrays of magnetic tetrapod structures were fabricated using a combination of two-photon lithography (TPL) and electrodeposition. All-optical time-resolved magneto-optical Kerr microscopy was exploited to probe the spin-wave modes from the junction of a single tetrapod structure. Micromagnetic simulations reveal that the nature of these modes originates from the intricate three-dimensional tetrapod structure. Our findings enhance the basic knowledge about the dynamic control of spin waves in complex three-dimensional magnetic elements which are imperative for the construction of modern spintronic devices.
Introduction
Confined magnetic structures have long been interesting systems due to their interesting spin configuration,1,2 magnetization reversal properties,1,2 spin dynamics3,4 and damping5 as well as their potential applications in high density magnetic storage,6 memory,7 logic,8 transistor9 and communication devices. Consequently, during the last decade, a new research field named magnonics10 has rapidly emerged with potential applications in on-chip high-frequency communication and data processing. Magnonic crystals10,11 (MCs) are periodically modulated magnetic media, the magnetic counterparts of the photonic12 and phononic13 crystals, where spin waves act as information carriers. Ultrafast magnetization dynamics and spin waves of one-dimensional arrays of nanowires14,15 and two-dimensional arrays of planar ferromagnetic structures such as nanodots4,16–19 and antidots20–22 as well as bi-component magnonic crystals23 have been studied in great detail. In contrast, the study of three-dimensional (3D) magnetic nanostructures is still in its infancy but is gaining intense interest due to the emergence of novel fabrication methods such as focused electron beam induced deposition24 as well as numerous applications including sensors and actuators,25 ultrahigh density magnetic data storage,26 neuromorphic computer architecture,27 2.5-dimensional spintronics25 and 3D magnonic crystals.28 Recently Chern et al.29 proposed a 3D layered geometry for a 3D artificial spin ice to capture the fully 3D spin-ice behaviour including effective Coulomb interactions between monopoles and they also provide an accessible and flexible, experimentally realizable geometry for the same. However, intensive research to explore the above fields based on 3D micro- and nanostructures is missing in the literature. A commonly used technique for 3D structure fabrication is electrodeposition of magnetic materials on templates prepared by ion-track etching of polycarbonate membranes, anodization of alumina films, block copolymerization, and focused electron beam milling. However, fabrication of complex 3D structures of arbitrary shape and with high precision is difficult using the above techniques. Two-photon lithography30 (TPL) has recently emerged as a very powerful nanostructuring approach with intrinsic 3D structure fabrication capability and has recently demonstrated the realization of very pure 3D magnetic nanostructures.31Here, we have fabricated an array of well-separated 3D cobalt tetrapod structures with sub-micrometre features using a combination of TPL and electrodeposition. We show, for the first time that such complex 3D magnetic nanostructures can be studied using time-resolved magneto-optical Kerr effect (TR-MOKE) microscopy in order to directly observe the ultrafast magnetization dynamics. The time-resolved data show multi-mode precessional oscillations while the fast Fourier transform (FFT) spectra of time-resolved data show two clear precessional modes (around 1 and 10 GHz) accompanied by another less intense mode at around 30 GHz. The results have been reproduced by 3D micromagnetic simulations which allowed the mapping of the spatial distribution of the precessional modes. The higher frequency mode (30 GHz) shows uniform precession over the major part of the sample, while the other two modes show mixed character.
Experimental details
A 100 μm2 array of 3D cobalt tetrapod structures was fabricated using two-photon lithography (TPL) and electrodeposition.31 In the TPL technique, a femtosecond laser operating in the infrared frequency range is focused down to a diffraction-limited spot within a conventional photoresist. Common photoresists have negligible linear absorption in the infrared region, and hence the laser can penetrate into the materials and influence its polymerization within the region of interest without perturbing other regions of the resist. A TPL system consisting of a pulsed laser of wavelength = 780 nm, average power = 120 mW, pulse width = 120 fs and a repetition rate = 80 MHz was used to build a pattern within a positive photoresist (AZ9260) on a glass/indium tin oxide (ITO) substrate. After patterning the resist, electrodeposition was used to fill the channels with Co. A standard Watts bath (600 ml) consisting of cobalt sulphate (90 g), cobalt chloride (27 g), boric acid (14 g) and sodium lauryl sulphate (1 g) was used. A simple two-electrode electrodeposition was used at room temperature with a cobalt anode operating at a constant current of 1 mA. Complete infiltration of the pores was ensured by utilizing deposition rate studies on a number of samples. After electrodeposition, the resist was removed using acetone, yielding free standing cobalt tetrapod structures.A scanning electron micrograph of the sample is shown in Fig. 1. The total array size is approximately 100 μm2. Each tetrapod structure consists of four wires, each with an approximate dimension of 657 nm × 782 nm × 10 μm. Only a small amount of variation (60 nm) in the nanowire width is seen across the array, with a similar variation in the nanowire length (100 nm) also being observed. The tetrapod structures are seen to be well fabricated with clean surface morphology. The separation between the tetrapod structures is 10 μm, which ensures that they are not magnetostatically coupled. Further details upon the growth and physical characterisation of these samples can be found elsewhere.31
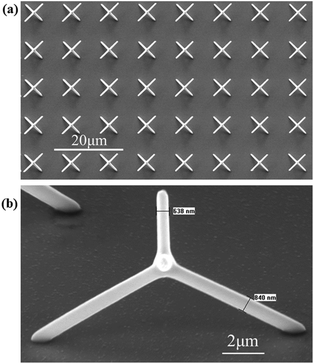 | ||
| Fig. 1 (a) Scanning electron micrograph of (a) an array of tetrapod structures and (b) a single tetrapod structure. | ||
The ultrafast magnetization dynamics of a single tetrapod structure from the array was measured using a custom-built time-resolved magneto optic Kerr effect (TR-MOKE) microscope based on a two-colour collinear pump–probe technique.32 The second harmonic (λpump = 400 nm, fluence = 19 mJ cm−2, pulse width = 100 fs) of the fundamental laser beam from a mode-locked Ti-sapphire laser (Tsunami, Spectra Physics) was used to pump the sample, while the time-delayed fundamental beam (λprobe = 800 nm, fluence = 7 mJ cm−2, pulse width = 80 fs) is used to probe the polar Kerr rotation using optical bridge detection as a function of the time delay between the pump and probe beams. The optical bridge detector isolates the Kerr rotation and the total reflectivity signal to avoid breakthrough of one signal into another and the measurement is done using lock-in amplifiers in a phase sensitive manner to attain high sensitivity. The probe beam is tightly focused (spot diameter = 800 nm) using a microscope objective of a numerical aperture of 0.65 at the junction of the tetrapod structure, while the pump beam is slightly defocused at the focal plane of the probe beam with a spot diameter of about 1 μm. The probe beam is carefully placed at the centre of the pump-beam and the junction of the tetrapod structure using an x–y–z piezoelectric scanning state with a feedback loop and a white-light illumination system. A static magnetic field with varying magnitudes is applied at a small angle (∼15°) to the normal direction of the substrate plane (as shown in Fig. 2(a)), the out-of-plane component of which is defined as the bias field H. Here, we measure the precessional magnetization dynamics from the junction of the Co tetrapod sample, which is a more complicated geometry than a thin film or a vertically standing nanowire. However, after careful alignment of the static bias field angle, we found that this tilt of ∼15° is suitable for inducing precessional magnetization dynamics in this sample. A large enough static field is first applied to saturate the sample magnetization followed by reducing it to the desired bias field value for measurement of the time-resolved dynamics.
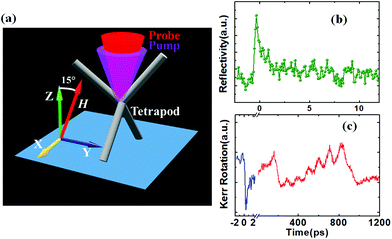 | ||
| Fig. 2 (a) Schematic diagram of the cobalt tetrapod and the experimental geometry. Typical time-resolved (b) reflectivity and (c) Kerr rotation data are shown at H = 3.92 kOe. | ||
Results and discussion
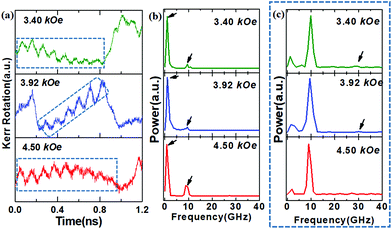
Typical time-resolved reflectivity and Kerr rotation data are shown in Fig. 2(b) and (c), respectively. The time-resolved Kerr rotation data show three distinctly different temporal regimes (Fig. 2(c)). First it shows the negative delay followed by ultrafast demagnetization within about 400 fs of the zero delay. This is followed by a fast relaxation within about 700 fs and a slower relaxation superposed with the precession of magnetization. However, the precession shows a complicated profile, which does not allow the precise determination of the slower relaxation time in this sample. Fig. 3(a) shows the background subtracted time-resolved Kerr rotation data for three different magnetic field values. The strong beating effect in the precessional oscillation indicates the presence of multiple spin-wave modes in this system. The fast Fourier transform (FFT) power spectra of the full time-resolved precessional oscillation data (Fig. 3(b)) show a highly intense mode at around 1 GHz and another less intense mode at around 10 GHz. It is apparent from the precessional data that another higher frequency mode is present in it, and in order to extract that mode clearly from the higher amplitude modes we take FFT of the marked part of the precessional data (as shown in Fig. 3(c)). The FFT power spectra of partial time-resolved data show a clear mode at around 10 GHz and another lower intensity mode at around 30 GHz. However, for lower bias field values the signal to noise ratio of the magnetization precession data becomes very weak making it difficult for extracting the precessional mode frequencies clearly, and hence we restrict our measurements for three field values only.To gain more insight into the observed precessional modes, we have performed 3D micromagnetic simulations using MuMax333 software. For 3D visualization of the simulated results, we have used Mayavi34 and Muview35 software. In the simulation, we have considered a tetrapod structure made of four cobalt cylindrical legs of diameters similar to the experimental sample but due to the limited computational resources, we have considered the length of each cylindrical leg as 2.5 μm. This is justified since the experimental time-resolved Kerr rotation data were obtained using the focused laser spot placed at the centre of a single tetrapod structure. The sample is discretized into cells of dimensions 25 × 25 × 25 nm3. We believe that the spin-wave modes in structures with such dimensions are primarily governed by the dipolar interaction, so the cell size above the exchange length of cobalt can reproduce the observed magnetization dynamics. Simulating a Co tetrapod sample of 2.5 μm leg length allowed us to use a cell size of 25 × 25 × 25 nm3, which corresponds to about 40 cells in all three directions at the junction of the tetrapod structure which would be sufficient to resolve the spin configuration and the spin dynamics in this region of space. The magnetic parameters used for the simulation are saturation magnetization Ms = 1400 emu cc−1, anisotropy constant K = 0 (justified since the uniaxial grains have random orientations31), gyromagnetic ratio γ = 17.6 MHz Oe−1 and the exchange stiffness constant Aex = 3.0 × 10⁻⁵ erg cm−1. The external bias field H is applied according to the experimental configuration and a square pulsed field of 10 ps risetime, 200 ps width and a peak amplitude of 20 Oe is applied perpendicular to the sample plane. The simulated magnetization dynamics data are acquired from a volume of 1 μm3 from the tetrapod junction. The FFT power spectra of the simulated time-resolved magnetization (Fig. 4(a)) reveal three resonant modes, namely M1, M2, and M3 from a higher to lower frequency regime.
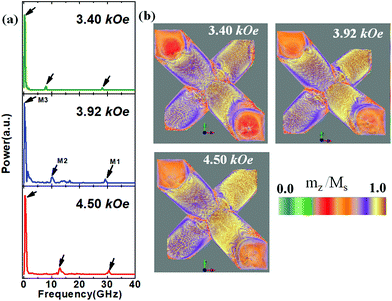 | ||
| Fig. 4 Simulated (a) power spectra and (b) normalized static magnetization configuration (z-component) for the ground state at three different bias magnetic fields are shown. | ||
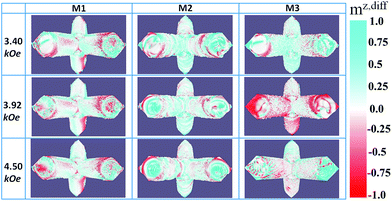
The number of modes and the corresponding mode-frequencies obtained from the simulation match qualitatively with the experimental results. The static magnetic configurations of the z-component of magnetization at three different bias field values are shown in Fig. 4(b). The colour bar in Fig. 4(b) represents normalized magnetization along the z-direction. It is clear from the figure that the z-component of magnetization increases with increasing bias field, i.e. the colour changes from reddish to orange at the ends of the wires and it changes from violet to gold at the surface of the wires. Though, the increment is not uniform all over the tetrapod structure due to a complicated internal field distribution in such a complex 3D structure. In addition slight tilt (∼15°) in the bias field also introduces an asymmetry in the magnetic configuration in different arms of the tetrapod. Having achieved this qualitative agreement, we now further simulate the corresponding mode profiles by providing a sinusoidal excitation corresponding to each of the resonance frequencies along the z-direction with an amplitude of 20 Oe. This is followed by a long waiting time of more than 100 ns, so that all other spurious modes decay down leaving behind only the driven mode at that frequency. The resonant mode profiles are extracted by taking the difference in magnetization between the excited state and the ground state.36 The difference between the z-components is normalized (mz,diff) and viewed using Muview software. The spatial profiles of modes M1, M2 and M3 at three different bias fields are shown in Fig. 5.
The magnetization profiles of the sample at three different magnetic field values show qualitatively similar behaviour although the non-uniformity in the surface magnetization (red contrast) appears to increase with the reduction in the magnetic field (Fig. 4(b)). Consequently, the mode profiles of the observed modes at three magnetic field values also show qualitatively the same behaviour (Fig. 5), with distinct differences in the mode profiles for the three different modes. Fig. 6(a) shows the three modes distributed over the whole simulated sample at a bias field H = 4.50 kOe. It is clearly observed that mode 1 (M1) corresponds to a spatially uniform mode, while mode 2 (M2) and mode 3 (M3) are standing wave modes with an increasing number of nodal planes with decreasing frequency. Fig. 6(b) shows the slices taken from the junction of the tetrapod for the three modes. From this figure M2 and M3 are found to have the nature of a mixed mode of a dipolar origin with nodal planes spreading along the mutually perpendicular directions of the plane. The quantization number increases with the decrease in frequency but cannot be clearly counted due to the highly complicated spatial nature of the modes. On the other hand, although M1 shows primarily spatially uniform nature, it also contains thin fringes along mutually perpendicular directions, indicating standing spin-wave modes of a very high mode quantization number.
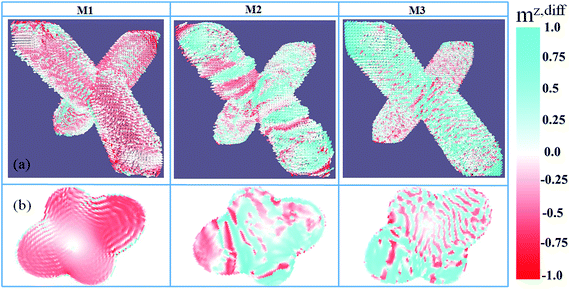 | ||
| Fig. 6 (a) Magnified view of the mode profile and (b) the sliced view of the tetrapod junction for different modes at H = 4.50 kOe. | ||
Conclusion
In conclusion, we have investigated ultrafast magnetization dynamics in a three-dimensional cobalt tetrapod structure, using time-resolved magneto-optical Kerr microscopy. The experimental results along with three-dimensional micromagnetic simulations reveal the existence of three spin-wave modes at around 1, 10 and 30 GHz. With the variation of the bias magnetic field only small quantitative changes are observed in the modes while the qualitative characteristics of the modes remain unchanged. Investigation of the spatial nature of the modes over the whole simulated tetrapod sample as well as from its junction reveal a spatially uniform mode with thin fringes most likely associated with standing spin-wave modes of a high mode quantization number at 30 GHz. However, the two lower frequency modes show dipolar dominated mixed modes with nodal planes spreading along two mutually perpendicular directions. The mode quantization number of the dipolar modes increases with the decrease in frequency. The investigation of ultrafast magnetization dynamics from a complicated three-dimensional magnetic structure and revelation of complex modes in such structures open the possibility of further intensive study in this field for promotion of such structures as building blocks in high-frequency ultra-high-density storage, memory, logic and communication devices.Conflicts of interest
The authors state no potential conflict of interest.Acknowledgements
We acknowledge the financial assistance from the Department of Science and Technology, Govt. of India under grant no. SR/NM/NS-09/2011 and the S. N. Bose National Centre for Basic Sciences (SNBNCBS) under project no. SNB/AB/12-13/96. SS acknowledges SNBNCBS and SM acknowledges the DST INSPIRE scheme for financial support. SL acknowledges support from the EPSRC (EP/R009147/1).Information on the data underpinning the results presented here, including how to access them, can be found in the Cardiff University data catalogue at http://doi.org/10.17035/d.2018.0049660686.
References
- R. Skomski, J. Phys.: Condens. Matter, 2003, 15, R841 CrossRef.
- S. D. Bader, Rev. Mod. Phys., 2006, 78, 1 CrossRef.
- A. Barman and A. Haldar, in Solid State Physics, ed. R. Stamps and R. Camley, Academic Press, 2014, vol. 65, pp. 1–108 Search PubMed.
- V. V. Kruglyak, A. Barman, R. J. Hicken, J. R. Childress and J. A. Katine, J. Appl. Phys., 2005, 97, 10A706 CrossRef.
- A. Barman, S. Wang, J. Maas, A. R. Hawkins, S. Kwon, A. Liddle, J. Bokor and H. Schmidt, Appl. Phys. Lett., 2007, 90, 202504 CrossRef.
- O. Hellwig, A. Berger, T. Thomson, E. Dobisz, Z. Z. Bandic, H. Yang, D. Kercher and E. E. Fullerton, Appl. Phys. Lett., 2007, 90, 162516 CrossRef.
- S. Tehrani, E. Chen, M. Durlam, M. DeHerrera, J. M. Slaughter, J. Shi and G. Kerszykowski, J. Appl. Phys., 1999, 85, 5822 CrossRef.
- D. A. Allwood, G. Xiong, C. C. Faulkner, D. Atkinson, D. Petit and R. P. Cowburn, Science, 2005, 309, 1688 CrossRef PubMed.
- D. Kumar, S. Barman and A. Barman, Sci. Rep., 2014, 4, 4108 CrossRef PubMed.
- B. Lenk, H. Ulrichs, F. Garbs and M. Münzenberg, Phys. Rep., 2011, 507, 107 CrossRef.
- M. Krawczyk and M. Grundler, J. Phys.: Condens. Matter, 2014, 26, 123202 CrossRef PubMed.
- M. Jacoby, Chem. Eng. News, 1998, 76, 38 Search PubMed.
- M. S. Kushawa, P. Halevi, L. Dobrzynski and B. Djafari-Rouhani, Phys. Rev. Lett., 1993, 71, 2022 CrossRef PubMed.
- G. Gubbiotti, S. Tacchi, M. Madami, G. Carlotti, N. Singh, S. Goolaup, A. O. Adeyeye and M. Kostylev, Appl. Phys. Lett., 2007, 90, 092503 CrossRef.
- Z. K. Wang, V. L. Zhang, H. S. Lim, S. C. Ng, M. H. Kuok, S. Jain and A. O. Adeyeye, ACS Nano, 2010, 4, 643 CrossRef PubMed.
- G. Gubiotti, M. Madami, S. Tacchi, G. Carlotti and T. Okuno, J. Appl. Phys., 2006, 99, 08C701 CrossRef.
- V. V. Kruglyak, P. S. Keatley, A. Neudert, R. J. Hicken, J. R. Childress and J. A. Katine, Phys. Rev. Lett., 2010, 104, 027201 CrossRef PubMed.
- S. Saha, R. Mandal, S. Barman, D. Kumar, B. Rana, Y. Fukuma, S. Sugimoto, Y. Otani and A. Barman, Adv. Funct. Mater., 2013, 23, 2378 CrossRef.
- B. K. Mahato, B. Rana, D. Kumar, S. Barman, S. Sugimoto, Y. Otani and A. Barman, Appl. Phys. Lett., 2014, 105, 012406 CrossRef.
- S. Neusser, B. Botters and D. Grundler, Phys. Rev. B: Condens. Matter Mater. Phys., 2008, 78, 054406 CrossRef.
- S. Tacchi, B. Botters, M. Madami, J. W. Kłos, M. L. Sokolovskyy, M. Krawczyk, G. Gubbiotti, G. Carlotti, A. O. Adeyeye, S. Neusser and D. Grundler, Phys. Rev. B: Condens. Matter Mater. Phys., 2012, 86, 014417 CrossRef.
- S. Choudhury, S. Barman, Y. Otani and A. Barman, ACS Nano, 2017, 11, 8814–8821 CrossRef PubMed.
- S. Choudhury, S. Saha, R. Mandal, S. Barman, Y. Otani and A. Barman, ACS Appl. Mater. Interfaces, 2016, 8, 18339–18346 Search PubMed.
- J. D. Fowlkes, R. Winkler, B. B. Lewis, M. G. Stanford, H. Plank and P. D. Rack, ACS Nano, 2016, 10, 6163–6172 CrossRef PubMed.
- A. Fernández-Pacheco, R. Streubel, O. Fruchart, R. Hertel, P. Fischer and R. P. Cowburn, Nat. Commun., 2017, 8, 15756 CrossRef PubMed.
- S. S. P. Parkin, M. Hayashi and L. Thomas, Science, 2008, 320, 190–194 CrossRef PubMed.
- S. Lequeux, S. Sampaio, V. Cros, K. Yakushiji, A. Fukushima, R. Matsumoto, K. Kubota, S. Yuasa and J. Grollier, Sci. Rep., 2016, 6, 31510 CrossRef PubMed.
- S. Mamica, J. Appl. Phys., 2013, 114, 043912 CrossRef.
- G.-W. Chern, C. Reichhardt and C. Nisoli, Appl. Phys. Lett., 2014, 104, 013101 CrossRef.
- H.-B. Sun and S. Khawata, in NMR·3D Analysis·Photopolymerization, Advances in Polymer Science, Springer, Berlin Heidelberg, 2004, pp. 169–273 Search PubMed.
- G. William, M. Hunt, B. Bohem, A. May, M. Taverne, D. Ho, S. Giblin, D. Read, J. Rarity, R. Allenspach and S. Ladak, Nano Res., 2018, 11, 845 CrossRef.
- B. Rana and A. Barman, SPIN, 2013, 3, 1330001 CrossRef.
- A. Vansteenkiste, J. Leliaert, M. Dvornik, M. Helsen, F. Garcia-Sanchez and B. V. Waeyenberge, AIP Adv., 2014, 4, 107133 CrossRef.
- P. Ramachandran and G. Varoquaux, IEEE Computing in Science & Engineering, 2011, vol. 13, pp. 40–51 Search PubMed.
- G. Rowlands, Muview2, http://grahamrow.github.io/Muview2/ Search PubMed.
- M. Donahue and D. G. Porter, OOMMF User's guide, Version 1.0, NIST Interagency Report no. 6376, National Institute of Standard and Technology, Gaithersburg, MD, 1999, http://math.nist.gov/oommf Search PubMed.
| This journal is © The Royal Society of Chemistry 2018 |

