
 Open Access Article
 This Open Access Article is licensed under a Creative Commons Attribution-Non Commercial 3.0 Unported Licence
Recombinant phosphatidylserine-binding nanobodies for targeting of extracellular vesicles to tumor cells: a plug-and-play approach†
Sander A. A.
Kooijmans
 ,
Jerney J. J. M.
Gitz-Francois
,
Raymond M.
Schiffelers
and
Pieter
Vader
*
,
Jerney J. J. M.
Gitz-Francois
,
Raymond M.
Schiffelers
and
Pieter
Vader
*
Department of Clinical Chemistry and Haematology, University Medical Center Utrecht, Utrecht, The Netherlands. E-mail: pvader@umcutrecht.nl; Tel: (+31) (0)887555546
First published on 15th January 2018
Abstract
Extracellular vesicles (EVs) are increasingly being recognized as candidate drug delivery systems due to their ability to functionally transfer biological cargo between cells. However, manipulation of targeting properties of EVs through engineering of the producer cells can be challenging and time-consuming. As a novel approach to confer tumor targeting properties to isolated EVs, we generated recombinant fusion proteins of nanobodies against the epidermal growth factor receptor (EGFR) fused to phosphatidylserine (PS)-binding domains of lactadherin (C1C2). C1C2-nanobody fusion proteins were expressed in HEK293 cells and isolated from culture medium with near-complete purity as determined by SDS-PAGE. Fusion proteins specifically bound PS and showed no affinity for other common EV membrane lipids. Furthermore, C1C2 fused to anti-EGFR nanobodies (EGa1-C1C2) bound EGFR with high affinity and competed with binding of its natural ligand EGF, as opposed to C1C2 fused to non-targeting control nanobodies (R2-C1C2). Both proteins readily self-associated onto membranes of EVs derived from erythrocytes and Neuro2A cells without affecting EV size and integrity. EV-bound R2-C1C2 did not influence EV–cell interactions, whereas EV-bound EGa1-C1C2 dose-dependently enhanced specific binding and uptake of EVs by EGFR-overexpressing tumor cells. In conclusion, we developed a novel strategy to efficiently and universally confer tumor targeting properties to PS-exposing EVs after their isolation, without affecting EV characteristics, circumventing the need to modify EV-secreting cells. This strategy may also be employed to decorate EVs with other moieties, including imaging probes or therapeutic proteins.
Introduction
In the past decade, the view that extracellular vesicles (EVs) may be exploited as drug delivery systems has gained increasing support in the scientific community. EVs are naturally occurring lipid membrane vesicles with sizes ranging from 50 to 1000 nm, and are either shed from plasma membranes or released from intracellular compartments termed multivesicular endosomes (MVEs) or multivesicular bodies (MVBs) by virtually all cells in the body. Plasma membrane-derived EVs are often referred to as microvesicles, while MVE-derived EVs are usually termed exosomes. However, in practice, these types show overlapping characteristics.1 EVs are believed to play a role in intercellular communication by transporting their cargo, which includes bioactive lipids, proteins and nucleic acids (e.g. miRNA and mRNA), from one cell to another via bodily fluids.2 EVs can transfer these macromolecules to recipient cells and thereby induce pronounced phenotypical changes.3–6 This capability has created excitement in the drug delivery field, where efficient, biocompatible and targeted transfer of such cargo is desired.7–10 The first clinical trials using EVs for therapeutic purposes have already been initiated.11However, the biological nature of EVs presents not only opportunities, but also challenges for their application as drug delivery systems. EVs are ‘pre-programmed’ with selected cargoes and cell-specific targeting moieties, which may not necessarily overlap with their intended therapeutic application. To overcome these challenges, various strategies have been employed to manipulate EV tropism. For example, the EV membrane protein Lamp2b has been successfully fused to targeting ligands specific for brain, angiogenic endothelium or IL3 receptors on myeloid leukemia cells to target EVs to these respective tissues and cells.12–14 In addition, the platelet-derived growth factor receptor was used as an anchor to express tumor targeting ligands on EV surfaces.15 Alternatively, we have previously described the use of glycosylphosphatidylinositol (GPI) anchors for this purpose.16 Although such strategies were shown to result in efficient targeting of EVs to specific cell types, their general applicability may be limited by the need to engineer EV-secreting cells, which can be particularly challenging in primary cells. Furthermore, targeting ligands expressed in such a manner may be displayed with an insufficient density for proper targeting, or even directed to intracellular degradation pathways resulting in minimal display on EVs.17
In this study, we present a novel approach to confer targeting properties to EVs after their isolation, without the need to modify EV secreting cells and with broad applicability for EVs from multiple cell sources. It has recurrently been described that EVs are enriched in the negatively charged phospholipid phosphatidylserine (PS).2,18,19 For example, Llorente et al. described that whereas PS constitutes approximately 5.5% of lipids in PC-3 cells, this molar percentage was doubled in PC-3 derived EVs.18 Slightly deviating numbers have been reported for other cell types,20,21 however a general enrichment of PS in EVs compared with their parent cells is often observed. Under normal conditions, PS is exclusively located in the inner leaflet of the cell membrane and this asymmetrical membrane distribution is actively maintained by flippase enzymes.22 However, during EV formation this lipid asymmetry is lost, resulting in the release of PS-exposing EVs.1,23,24 The exposure of PS on a membrane surface is a classical ‘eat-me’ signal that connects to a large number of serum proteins and opsonins that enable uptake by phagocytic cells. Hence, it is not surprising that in proteomic studies EVs are often found to be associated with the opsonin lactadherin (also named MFG-E8).25–30 This protein, which contains two PS-binding C-domains (C1 and C2, together referred to as C1C2) that share homology with the corresponding domains in coagulation factor V and VIII.31,32 Due to its localization on EV membranes, the C1C2 domain of lactadherin has been exploited as an EV membrane anchor for recombinant proteins.33–36 In these reports, C1C2-fusion protein encoding vectors were transfected into EV producer cells to obtain EVs exposing the desired proteins. We reasoned that, given that lactadherin is a soluble protein, the C1C2-fusion strategy could be employed to equip EVs with tumor cell targeting properties after isolation in a ‘plug-and-play’ fashion. We fused C1C2 domains with nanobodies raised against the well-studied oncogene epidermal growth factor receptor (EGFR), which is the main target of a range of inhibitors used for cancer treatment in the clinic.37,38 Nanobodies (also termed single-domain antibodies, sdAbs or VHHs) are single variable domains of the heavy-chain only antibodies found in Camelidae species.39 These antibody fragments typically possess antigen-binding capacity similar to that of the full length antibody, but are generally more resistant to extreme chemical and thermal conditions.40,41 Furthermore, their size of approximately 15 kDa, ease of production and high solubility allows nanobodies to be employed as versatile targeting ligands. Here, we describe the purification of C1C2-nanobodies from cell culture supernatants, and characterized the specificity of these proteins for PS and EGFR binding. Furthermore, we evaluated whether these proteins could be employed as tools to confer specific tumor cell targeting properties to isolated EVs from red blood cells (RBCs) and Neuro2A cells.
Materials and methods
Materials
MicroBCA Protein Assay Kit, AlexaFluor 488 NHS ester, CellTracker Green CMFDA dye, CellTracker Deep Red dye, CellTracker Red CMTPX dye and the pcDNA3.1 vector with Neomycin resistance were purchased from Thermo Fisher Scientific (Waltham, USA). Sepharose CL-4B and cholesterol were obtained from Sigma-Aldrich (Steinheim, Germany) and TALON Superflow Metal Affinity Resin was from Clontech Laboratories, Inc. (Saint-Germain-en-Laye, France). Phospholipids were purchased from Avanti Polar Lipids (Birmingham, USA), except for egg phosphatidylcholine, which was obtained from Lipoid AG (Steinhausen, Switzerland). Cell culture flasks were obtained from Greiner Bio-One (Alphen aan de Rijn, The Netherlands). pET28a-EGa1 and pAX51-R2 vectors encoding EGa1 (PDB ID: 4KRN) and R2 (PDB ID: 1QD0) Myc-tagged nanobodies, respectively, were kindly provided by Dr S. Oliveira (Department of Biology, Utrecht University, Utrecht, The Netherlands).Molecular cloning
Mouse splenic dendritic cells (D1) were a kind gift from Dr Harry Heijnen (UMC Utrecht, Utrecht, The Netherlands)42 and were cultured as described.43 RNA was isolated using TRIzol Reagent (Thermo Fisher Scientific) according to the manufacturer's instructions. cDNA synthesis was performed using iScript cDNA Synthesis Kit (Bio-Rad Laboratories, Veenendaal, The Netherlands) according to the manufacturer's protocol. The C1C2 region of MFG-E8 was PCR amplified using forward primer Fw_C1C2 and reverse primer Rv_C1C2 (see ESI Table 1†). These primers were designed to flank the C1C2 sequence with a 5′ NotI restriction site and 2xGGGGS linker sequence, and a 3′ Tobacco Etch Virus (TEV) cleavage site and EagI restriction site. After NotI/EagI digestion, C1C2 sequence was inserted into pET28-EGa1 at the NotI site. The resulting EGa1-C1C2-Myc-His cassette was PCR amplified, flanked with NheI and XbaI sites and inserted in pcDNA3.1. Subsequently, an Igκ leader sequence (see ESI Table 1†) was inserted in-frame at the NheI site to generate pcDNA3.1-EGa1-C1C2. For the pcDNA3.1-R2-C1C2 vector, the R2 sequence was PCR amplified from pAX51-R2 and flanked with NheI and NotI sites. The EGa1 sequence was excised from pcDNA3.1-EGa1-C1C2 using the same restriction enzymes and replaced with the R2 sequence. All obtained vectors were sequenced using a BigDye® Terminator v3.1 Cycle Sequencing Kit (Thermo Fisher Scientific) according to the manufacturer's instructions.Generation of cell lines and cell culture
All used cell lines were maintained at 37 °C and 5% CO2. Human epidermoid carcinoma cells (A431, ATCC, Manassas, USA) and human embryonic kidney cells (HEK293, ATCC) were cultured in Dulbecco's Modified Eagle Medium (DMEM) supplemented with 10% fetal bovine serum (FBS), 100 U mL−1 penicillin and 100 U mL−1 streptomycin. Mouse neuroblastoma cells (Neuro2A, ATCC) were grown in Roswell Park Memorial Institute (RPMI) 1640 medium supplemented with 10% FBS, 100 U mL−1 penicillin and 100 U mL−1 streptomycin. To generate cell lines stably expressing R2-C1C2 or EGa1-C1C2 proteins, HEK293 cells were transfected overnight with pcDNA3.1-R2-C1C2 or pcDNA3.1-EGa1-C1C2 using Lipofectamine 2000 (Thermo Fisher Scientific) according to the manufacturer's instructions. Cells were selected for at least 2 weeks using 500 μg mL−1 G418 (Thermo Fisher Scientific) selection antibiotic, until normal morphology and growth was regained.Large-scale purification of recombinant phosphatidylserine-binding proteins
HEK293 cells expressing R2-C1C2 or EGa1-C1C2 were seeded at 50% confluency in 10-layer HYPERflask M cell culture vessels (Corning Life Sciences B.V., Amsterdam, The Netherlands) in normal growth medium. After 72 h, medium was replaced with production medium, consisting of Opti-MEM Reduced Serum medium supplemented with GlutaMAX (Gibco, Thermo Fisher Scientific), 0.5% v/v Ultroser G serum substitute (Pall Corporation, Washington, USA), 250 μg mL−1 G418 and penicillin/streptomycin. Cells were cultured for 48 h, after which conditioned medium was harvested and replaced with fresh production medium. Conditioned medium was mixed with 0.2 mM benzamidine HCl, depleted of cells and debris by centrifugation at 5000g for 15 min at 4 °C and stored at −20 °C until processing. When 5–10 L of conditioned medium was collected, medium was thawed and concentrated to ±120 mL using a 10 kDa molecular weight cut-off (MWCO) hollow fiber cartridge mounted on a Quixstand benchtop system (GE Healthcare, Eindhoven, The Netherlands). Concentrate was mixed with 0.5% v/v Triton X-100 to disrupt interactions of recombinant proteins with HEK293 EVs. Talon Superflow Metal Affinity Resin beads were washed with HEPES buffer (500 mM NaCl, 25 mM HEPES, pH 7.8) according to the manufacturer's instructions and incubated overnight at 4 °C with conditioned medium concentrate. Beads were pelleted at 500g and 4 °C for 5 min and washed three times with optimized stabilizing buffer (OSB, 18 mM L-arginine, 3.5 mM L-leucine, 5.7 mM L-glutamic acid, 0.009% (w/v) fatty acid free bovine serum albumin (BSA), 8% glycerol, 500 mM NaCl, 25 mM HEPES, pH 7.4). Beads were packed in a Tricorn 10/50 column (GE Healthcare) connected to a refrigerated ÄKTA Pure chromatography system according to the manufacturer's instructions and washed with at least 10 column volumes of OSB, Wash Buffer (2 mM imidazole and 0.7% v/v Triton X-100 in OSB) and once more with OSB. Proteins were stripped from the resin with Elution Buffer (250 mM imidazole and 100 mM EDTA in OSB), concentrated on 3 kDa MWCO Vivaspin tubes (Sartorius, UK) and dialyzed overnight in 10 kDa MWCO Slide-A-Lyzer dialysis cassettes (Thermo Fisher Scientific) against excess OSB. Subsequently, protein concentrates were loaded onto a 26/600 Hiload Superdex 200 pg gel filtration column (GE Healthcare), connected to a refrigerated ÄKTA Pure chromatography system and equilibrated with OSB. After elution in OSB, protein containing fractions (as determined by western blotting) were pooled and protein concentrations were determined using absorbance at 280 nm and calculated molar extinction coefficients of both proteins. Finally, proteins were concentrated on 3 kDa MWCO Vivaspin tubes, and stored in aliquots at −20 °C. Myc-tagged EGa1 control nanobodies were produced and purified as described previously.44SDS-PAGE and western blot analysis
Samples were mixed with reducing sample buffer containing dithiothreitol (DTT), heated to 95 °C for 10 min and subjected to electrophoresis over 4–12% Bis–Tris polyacrylamide gels (Thermo Fisher Scientific). Gels were stained with PageBlue Protein Staining Solution (Thermo Fisher Scientific) according to manufacturer's instructions. Alternatively, proteins were blotted on Immobilon-FL polyvinylidene difluoride (PVDF) membranes (Merck Millipore, Amsterdam, The Netherlands), which were subsequently blocked with 50% v/v Odyssey Blocking Buffer (LI-COR Biosciences, Leusden, The Netherlands) in Tris buffered saline (TBS). Antibody incubations were performed in 50% v/v Odyssey Blocking Buffer in TBS containing 0.1% v/v Tween 20 (TBS-T). Primary antibodies included mouse-anti-Myc (9E10 from MYC 1-9E10.2 hybridoma, ATCC, 1![[thin space (1/6-em)]](https://www.rsc.org/images/entities/char_2009.gif) :4000), mouse-anti-β-actin (Cell Signaling Technology, clone 8H10D10, 1:1000), rabbit anti-alpha 1 spectrin (Abcam, clone EPR9300, 1:1000), rabbit anti-EGFR (Cell Signaling Technology, clone D38B1, 1:1000), rabbit anti-CD9 (Abcam, clone EPR2949, 1:2000), and mouse anti-Alix (Abcam, clone 3A9, 1:1000). Secondary antibodies included Alexa Fluor 680-conjugated anti-rabbit antibodies (Thermo Fisher Scientific, A-21076, 1:7500 dilution) or IRDye 800CW anti-mouse antibodies (LI-COR Biosciences, 926-32212, 1:7500 dilution). Imaging was performed on an Odyssey Infrared Imager (LI-COR Biosciences, Leusden, the Netherlands) at 700 and 800 nm.
:4000), mouse-anti-β-actin (Cell Signaling Technology, clone 8H10D10, 1:1000), rabbit anti-alpha 1 spectrin (Abcam, clone EPR9300, 1:1000), rabbit anti-EGFR (Cell Signaling Technology, clone D38B1, 1:1000), rabbit anti-CD9 (Abcam, clone EPR2949, 1:2000), and mouse anti-Alix (Abcam, clone 3A9, 1:1000). Secondary antibodies included Alexa Fluor 680-conjugated anti-rabbit antibodies (Thermo Fisher Scientific, A-21076, 1:7500 dilution) or IRDye 800CW anti-mouse antibodies (LI-COR Biosciences, 926-32212, 1:7500 dilution). Imaging was performed on an Odyssey Infrared Imager (LI-COR Biosciences, Leusden, the Netherlands) at 700 and 800 nm.
Protein–lipid overlay assay
Protein–lipid overlay assay was performed as described elsewhere,45 with minor modifications. Phospholipids (16:0–18:1) phosphatidylserine (PS), egg phosphatidylglycerol (PG), cholesterol (CHL), milk ganglioside GM3 (GM3), milk sphingomyelin (SM), egg- or soy-derived phosphatidylcholine (PCegg and PCsoy, respectively) and egg phosphatidylethanolamine (PE) were dissolved in 1:1 chloroform:methanol (except GM3, which was dissolved in water) and diluted to a final concentration of 500 μM with a mixture of chloroform:methanol:water (2:1:0.8). Of each phospholipid, 1 μL was spotted on an Immobilon-FL PVDF membrane and dried for 1 hour at room temperature. Membrane was blocked with 50% v/v Odyssey Blocking Buffer in TBS for 2 hours at room temperature, followed by overnight incubation at 4 °C with 45 nM of R2-C1C2 or EGa1-C1C2 in 50% v/v Odyssey Blocking Buffer in TBS-T. Blots were washed 5 times with TBS-T and probed with primary antibodies (mouse anti-Myc) and Alexa Fluor 680-conjugated secondary antibodies as described under “SDS-PAGE and western blot analysis”. Protein–lipid binding was visualized using an Odyssey Infrared Imager at 700 nm.
Enzyme-linked immunosorbent assay (ELISA)
Extracellular domains of EGFR fused with Fc domains of human antibodies (EGFR-Fc, R&D Systems, Inc, USA) were coated overnight at 4 °C onto Nunc MaxiSorp plates (Thermo Fisher Scientific) at a concentration of 2 μg mL−1. Wells were washed three times with phosphate buffered saline (PBS) and blocked with 2% skimmed milk in PBS for 1 hour. Wells were emptied and incubated with C1C2-nanobodies diluted in 2% skimmed milk in PBS for 1 hour. Plates were washed three times with PBS containing 0.05% v/v Tween20 (PBS-T) and incubated with mouse anti-Myc antibodies (9E10, 1:2000) for 1 hour. After washing with PBS-T, plates were incubated with rabbit-anti-mouse HRP (DAKO, P0260, 1:1000) for 1 hour. All protein and antibody incubations were performed in triplicates in 2% skimmed milk in PBS at room temperature while shaking. Plates were washed with PBS-T and stained with 100 μL TMB substrate solution (Thermo Fisher Scientific). Reactions were quenched by addition of 50 μL 1 M H2SO4, and absorbance at 450 nm was measured using a SpectraMax M2e microplate reader (Molecular Devices, UK). Absorbance values were normalized to control wells to which no C1C2 nanobodies were added. Data were plotted in Graphpad Prism 6 software (Graphpad Software, Inc, USA) and non-linear regression was performed using the ‘one site-specific binding’ option to calculate dissociation constants (Kd).
EGF competition ELISA
Nunc MaxiSorp plates were coated overnight at 4 °C with goat anti-human antibodies (Thermo Fisher Scientific, PA1-85606, 1:1000) in PBS. Plates were washed three times with PBS, and incubated with EGFR-Fc (2 μg mL−1 in PBS) for 1 hour. After washing with PBS, plates were blocked with 2% fatty acid free BSA in PBS (2% PBSA) for 1 hour, and subsequently incubated with six replicate samples of C1C2 nanobodies mixed with 40 nM EGF-IRDye 800CW optical probe (LI-COR Biosciences) in 2% PBSA for 1 hour. All incubations were performed at room temperature while shaking. Finally, plates were washed three times with PBS and analyzed using an Odyssey Infrared Imager at 800 nm. Fluorescence intensity values of the wells were quantified using Odyssey software (V3.0, LI-COR Biosciences) and normalized to control wells to which no EGFR-Fc was added.
Isolation and stimulation of red blood cells
Blood was obtained from healthy volunteers with sodium heparin as anticoagulant. Withdrawal of blood samples was approved by the University Medical Center Utrecht (UMCU) Ethics Committee and informed consents were obtained from all participants of this study. RBCs were isolated using α-cellulose columns and resuspended in Ringer's buffer (125 mM NaCl, 5 mM KCl, 1.6 mM CaCl2, 5 mM glucose, 10 mM HEPES, pH 7.4) at 40% haematocrit as measured using a Cell-Dyn 1800 hematology analyzer (Abbott, Hoofddorp, The Netherlands). RBCs were stimulated overnight at room temperature with 4 μM of Ca2+-ionophore A23187 (Sigma-Aldrich) in a tube rotator to induce EV secretion.Isolation and labeling of red blood cell EVs
After overnight stimulation, a differential (ultra)centrifugation protocol based on the “gold standard” method described by Thery et al.46 was used to isolate RBC EVs. RBCs were centrifuged twice at 2000g for 10 min to remove cells and debris. Supernatant was centrifuged at 10000g for 10 min to remove large vesicles and debris. Subsequently, supernatant was centrifuged at 100000g for 70 min using a fixed-angle rotor (Type 50.2 Ti, k-factor 206.3, Beckman Coulter) to pellet EVs. EV pellet was resuspended in PBS and centrifuged again at 100000g for 70 min. All centrifugation steps were performed at 4 °C. Washed EV pellet was resuspended in a small volume of PBS (<1 mL). EV protein concentration was determined using a MicroBCA Protein Assay Kit according to the manufacturer's instructions. For cell association and uptake assays, RBC EVs were labeled with the fluorescent dye AlexaFluor 488 NHS ester. Lyophilized dye was dissolved at a concentration of 10 mg mL−1 in dimethyl sulfoxide (DMSO). EVs were mixed with 100 mM sodium bicarbonate (pH 8) and 1% v/v AlexaFluor 488 NHS ester, and incubated for 1 hour at 22 °C in a shaker incubator at 1400 rpm. Unbound label was removed using size exclusion chromatography with a Sepharose CL-4B column as described under “EV decoration and purification by size-exclusion chromatography”.
Isolation and labeling of Neuro2A EVs
Neuro2A cells were seeded in T175 flasks and cultured for 24 hours, after which medium was replaced by Opti-MEM Reduced Serum medium supplemented with GlutaMAX (Gibco, Thermo Fisher Scientific) and 100 U mL−1 penicillin, 100 U mL−1 streptomycin. Cells were allowed to produce EVs for 48 hours. EVs were isolated according to a previously described ‘ultrafiltration followed by liquid-chromatography’ method (UF-LC47). We preferred this method over the ultracentrifugation method used for RBC EV isolation, because the conditioned medium of Neuro2A cells contained considerably higher quantities of contaminants than the Ringer's buffer in which RBCs secreted EVs. These contaminants were more efficiently removed when using UF-LC compared with ultracentrifugation. In brief, conditioned medium was cleared of cells and debris by centrifugation at 300g and 2000g for 10 min at 4 °C, followed by vacuum driven filtration through 0.22 μm Steritop filters (Merck Millipore). Medium was concentrated to <4 mL using Amicon Ultra-15 Centrifugal Filter Units with a 100 kDa MWCO (Merck Millipore) at 4000g and 4 °C, and loaded onto a HiPrep 16/60 Sephacryl S-400 HR gel filtration column (GE Healthcare Life Sciences), which was equilibrated with phosphate buffered saline (PBS) and connected to a refrigerated ÄKTA pure chromatography system. EVs were eluted at 0.6 mL min−1, and EV containing fractions (as visualized by UV absorbance at 280 nm) were again concentrated on 100 kDa MWCO Amicon Ultra-15 Centrifugal Filter Units. For cell uptake experiments, EVs were mixed with 10 μM CellTracker Deep Red fluorescent dye (diluted from 2 mM stock in DMSO) immediately after isolation and incubated for 1 hour at 37 °C. EVs were purified from unbound dye using Sepharose CL-4B based SEC (as described under “EV decoration and purification by size-exclusion chromatography”) and concentrated using 100 kDa MWCO Vivaspin tubes. Protein concentrations were determined using a MicroBCA Protein Assay Kit according to the manufacturer's instructions.EV decoration and purification by size-exclusion chromatography
EVs were mixed with R2-C1C2 or EGa1-C1C2 diluted in OSB or equal volumes of OSB as negative control and incubated at room temperature for 30 min. To remove unbound proteins, size-exclusion chromatography was performed with a XK-16/20 column (GE Healthcare) packed with Sepharose CL-4B according to the manufacturer's instructions. The column was connected to a refrigerated ÄKTA Pure chromatography system, and equilibrated with PBS. EV/protein mixtures were injected, eluted with PBS, and EV containing fractions (visualized by UV absorbance at 280 nm) were pooled. EV samples were concentrated to 100–200 μL using Vivaspin 100 kDa MWCO.Nanoparticle tracking analysis
Concentrated EV samples were diluted with PBS to appropriate dilutions for analysis and automatically injected into a NanoSight NS500 system equipped with an LM14 405 nm violet laser unit (Malvern Instruments, Worcestershire, UK). Five movies of 30 seconds were recorded at camera level 13 (RBC-derived EVs) or 15 (Neuro2A-derived EVs) and at a fixed temperature of 25 °C. Data was analyzed using NTA 3.1 software, with detection threshold 9 (RBC-derived EVs) or 6 (Neuro2A-derived EVs) and other settings kept at default. PBS used for dilution was confirmed to be particle-free at these settings.Immuno-electron microscopy
RBC EVs in PBS were adsorbed to carbon-coated formvar grids for 15 min at room temperature, washed, and fixated in 2% paraformaldehyde and 0.2% glutaraldehyde in 0.1 M phosphate buffer. Immunolabeling was performed with mouse anti-Myc antibody (9E10, 1:100), followed by rabbit-anti-mouse IgG (Rockland, 610-4120, 1:250) and 10 nm Protein A gold (CMC, Utrecht, The Netherlands). For Neuro2A-derived EVs, primary antibody was used at a 1:150 dilution and labelling was performed prior to fixation with 1% glutaraldehyde in PBS. Grids were embedded in methyl cellulose uranyl-acetate after counterstaining with uranyl-oxalate.48 Grids were imaged using a Tecnai T12 transmission electron microscope (FEI, Eindhoven, The Netherlands).
Cell association assays
Fluorescently labeled EVs were decorated with PS-binding proteins and purified again using size exclusion chromatography. To exclude the possibility of labeling biases among samples, EV protein concentrations were measured using a MicroBCA Protein Assay, and fluorescence of 60 μL EV samples in a black 96-well plate was determined using a SpectraMax M2e microplate reader at 488 nm excitation and 530 nm emission. Differences in labeling efficiency (expressed as fluorescence intensity per μg of EV protein) of less than 10% were considered acceptable before proceeding with cell association or uptake assays.For cell association assays, Neuro2A or A431 cells were trypsinized and resuspended in ice-cold culture medium at a concentration of 3 × 10⁵ cells per mL. Cells were transferred to round bottom 96-well plates (100 μL per well) on ice and mixed with 3.8 μg of EVs per well. EV–cell mixtures were incubated for 1 hour at 4 °C to allow EV binding. Plates were centrifuged for 5 min at 500g and 4 °C to pellet cells, after which cells were resuspended in ice-cold FACS buffer (PBS containing 0.3% BSA). This procedure was repeated twice for a total of three washes. Finally, cells were resuspended in 0.2% formaldehyde in PBS and analyzed using a FACSCanto II flow cytometer (BD Biosciences, USA). Mean fluorescence intensity (MFI) values of treated cells were normalized to untreated cells.
Cell uptake assays
Neuro2A or A431 were cultured in flat-bottom 96-well plates at a density of 3 × 10⁴ cells per well in their normal growth medium. After 24 hours, when a confluency of 80–90% was reached, 3.8 μg of AlexaFluor 488 NHS ester-labeled RBC EVs, or 3.75 × 10⁹ particles of CellTracker Deep Red-labeled Neuro2A EVs were added and cells were incubated for 4 hours at 37 °C to allow EV uptake. Cells were washed once with PBS, trypsinized, resuspended in culture medium and transferred to round-bottom 96-well plates. Cells were washed once with FACS buffer, once with an acid wash buffer (0.5 M NaCl, 0.2 M acetic acid, pH 3) to remove cell-bound EVs, and once more with FACS buffer as described under Cell association assays. Cells were resuspended in 0.2% formaldehyde in PBS and MFI values were determined using flow cytometry.In co-culture uptake experiments, Neuro2A cells were labelled with 5 μM of CellTracker Green dye according to the manufacturer's protocol, washed three times with complete cell culture medium and mixed with unlabeled A431 cells in a Neuro2A:A431 ratio of 2:1. Cell mixture was seeded at a density of 3 × 10⁴ cells per well in 96-well plates. After 24 hours, uptake assay was performed as described above and analyzed using flow cytometry. Using cytometric analysis, CellTracker Green positive and negative cells were gated in order to separately analyze EV uptake by Neuro2A and A431 cells, respectively.
Fluorescence microscopy
Neuro2A and A431 cells were labeled with 5 μM of CellTracker Red and CellTracker Green, respectively, according to the manufacturer's instructions. Cells were subsequently washed three times with complete culture medium, mixed in a Neuro2A:A431 ratio of 3:1 and seeded onto glass coverslips in 24-well plates at a density of 2 × 10⁵ cells per well. After 24 hours, 2.3 × 10¹⁰ particles of CellTracker Deep Red labeled Neuro2A EVs were added and incubated for 5 hours at 37 °C. Cells were washed once with PBS, once with acid wash buffer, and once more with PBS. Cells were fixated in 4% polyformaldehyde in PBS for 20 min at room temperature, washed with PBS, and stained with 1 μg mL−1 of 4′,6-diamidine-2′-phenylindole dihydrochloride (DAPI, Sigma Aldrich) for 8 min at room temperature. Cells were washed again with PBS and mounted onto microscopy slides using FluorSave Reagent (Merck Millipore). Slides were imaged using a LED-based Zeiss Axiovision Z1 fluorescence microscope (Carl Zeiss, Oberkochen, Germany) with a 40× objective and on a Zeiss LSM700 Confocal Laser Scanning microscope.
Results
Design and purification of C1C2-nanobody fusion proteins
In this work, we investigated whether isolated, PS-exposing EVs can be equipped with nanobodies to improve their targeting specificity. The EGa1 nanobody was used as a targeting ligand for EGFR-expressing tumor cells. This nanobody has been described to bind EGFR with high affinity, without triggering its activation.49 The R2 nanobody, which was raised against the azo-dye Reactive Red (RR6),50 served as a negative control nanobody as it showed negligible affinity for EGFR in previous reports.51,52 DNA sequences of these nanobodies were cloned into pcDNA3.1 vectors with a CMV-promoter, and fused to PS-binding C1C2 domains of MFG-E8 via a GGGS2 linker sequence (Fig. 1A). In addition, an Igκ leader sequence was inserted to induce protein secretion, and C-terminal c-Myc- and His6 tags were inserted for detection and purification, respectively. It was hypothesized that the resulting fusion proteins would self-associate with PS in EV membranes, resulting in nanobody display on the membrane surface (Fig. 1B).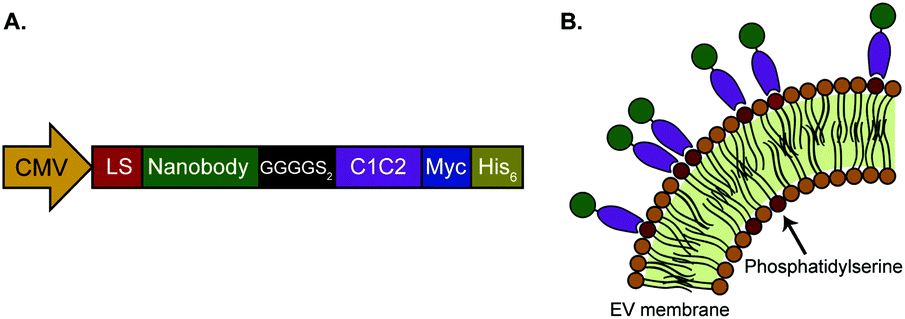 | ||
| Fig. 1 Schematic presentation of C1C2-nanobody fusion proteins. A. Protein expression cassette as cloned in the pcDNA3.1 vector. Expression is driven by a CMV-promoter. Recombinant proteins comprise an Igκ leader sequence (LS), nanobody sequence, GGGGS2 linker sequence, C1 and C2 domains of mouse MFG-E8 (C1C2), and Myc and His6 tags for detection and purification, respectively. B. C1C2 domains (purple) of the targeting proteins are expected to self-associate with PS in the outer leaflets of EV membranes, resulting in display of nanobodies (green). | ||
To test this hypothesis, vectors encoding C1C2-fused to R2 or EGa1 (R2-C1C2 and EGa1-C1C2, respectively) were stably transfected into HEK293 cells. Both proteins were successfully expressed in these cells, and appeared as bands at their calculated molecular weights of 56.9 kDa (R2-C1C2) and 57.4 kDa (EGa1-C1C2) when analyzed by western blotting (Fig. 2A). Expression of R2-C1C2 was lower than expression of EGa1-C1C2, possibly due to differences in transfection or selection efficiency. Both proteins were secreted into the culture medium and showed two bands on western blot. This may be explained by partial cleavage of the Igκ leader sequence (2.4 kDa) from the proteins during secretion. To purify the C1C2-nanobodies from cell culture supernatants, proteins were adsorbed to immobilized metal affinity chromatography (IMAC) resins and thoroughly washed with detergents to remove any protein-bound EVs and phospholipids from HEK293 cells.
 | ||
| Fig. 2 C1C2-proteins are expressed and secreted by HEK293 cells and can be purified from conditioned medium. A. Western blot of HEK293 cell lysates after stable transfection with pcDNA3.1-R2-C1C2 (R2) or pcDNA3.1-EGa1-C1C2 (EGa1) vectors (10 μg protein per lane) and corresponding conditioned medium (45 μL medium per lane). Myc tags were used to detect C1C2-nanobody expression, and β-actin was included as a loading control. B. Western blot of R2-C1C2 and EGa1-C1C2 after purification from conditioned medium, stained with anti-Myc antibodies. C. SDS-PAGE of purified R2-C1C2 and EGa1-C1C2. Arrows indicate bands of BSA from the OSB (gray) and C1C2-nanobodies (black). Lanes in B and C contained 1 μg of protein. | ||
After elution from the resins, proteins were purified to near-complete purity using gel filtration, as analyzed by western blotting and SDS-PAGE (Fig. 2B and C, respectively). Importantly, it was observed that the C1C2-nanobodies readily and irreversibly precipitated from solutions when dissolved in commonly used aqueous solutions (e.g. PBS). To prevent this issue, proteins were formulated in an optimized stabilizing buffer (based on studies with recombinant factor VIII53), which was found to prevent protein precipitation even after three freeze–thaw cycles and allowed protein storage at −20 °C for more than a year (data not shown). This formulation contains BSA, which appeared as a 66 kDa band when proteins were analyzed by SDS-PAGE (Fig. 2C).
C1C2-nanobody association with PS and EGFR
To investigate whether the C1C2 domains of the recombinant proteins could promote association with PS, a protein–lipid overlay assay was employed. In this assay, a variety of common EV membrane lipids, including phosphatidylethanolamine (PE), phosphatidylcholine (PC), sphingomyelin (SM), ganglioside GM3 and PS,54 were spotted onto a PVDF membrane and incubated with equimolar concentrations of R2-C1C2 or EGa1-C1C2. Both proteins bound exclusively to PS in a concentration dependent manner, even when spotted in a 100-fold lower concentration compared with the other lipids (Fig. 3A). Importantly, both proteins showed no binding to phosphatidylglycerol (PG), a phospholipid bearing a negative charge similar to PS, but lacking the recognition motif for C1C2, indicating that protein binding is not solely based on simple electrostatic interactions. | ||
| Fig. 3 Purified C1C2-nanobodies bind to PS and EGFR with high affinity and compete with binding of EGF. A. Protein–lipid overlay assay in which a PVDF membrane was spotted with 500 pmol of phosphatidylglycerol (PG), cholesterol (CHL), ganglioside GM3 (GM3), sphingomyelin (SM), egg- and soy-derived phosphatidylcholine (PCegg and PCsoy, respectively), phosphatidylethanolamine (PE), and decreasing quantities of PS. Binding of R2-C1C2 and EGa1-C1C2 was detected with anti-Myc antibodies. B. ELISA showing binding of increasing concentrations of R2-C1C2 and EGa1-C1C2 to immobilized extracellular domains of EGFR. C1C2-nanobody binding was quantified using anti-Myc antibodies with peroxidase detection. C. Competition ELISA in which C1C2-nanobodies were mixed with 40 nM EGF-IRDye800 (EGF-IR) and incubated with plate-captured extracellular domains of EGFR. EGF-IR binding was analyzed using an Odyssey imager. All data are displayed as mean ± SD and are representative of at least two replicate experiments. | ||
To determine whether the nanobody domains of the PS-binding proteins showed affinity for EGFR, an anti-EGFR ELISA was performed. Extracellular domains of EGFR were captured on 96-well plates and incubated with R2-C1C2 or EGa1-C1C2 (Fig. 3B). As expected, EGa1-C1C2 bound EGFR with high affinity (Kd = 39.3 ± 2.7 nM). In contrast, R2-C1C2 showed no affinity for EGFR, confirming that these proteins could serve as non-binding controls for EGa1-C1C2. EGa1 has been described to not only bind EGFR, but also compete with its natural ligand epidermal growth factor (EGF) and thereby prevent EGF-induced receptor phosphorylation.49,51,52
To investigate whether EGa1-C1C2 also competed with EGF, a competition ELISA was employed in which C1C2-nanobodies were mixed with EGF conjugated to a near-infrared fluorophore (EGF-IR) and allowed to bind immobilized extracellular domains of EGFR. EGa1-C1C2 competed with IR-EGF for binding to EGFR, while no IR-EGF competition was observed for R2-C1C2 (Fig. 3C).
Association of C1C2-nanobodies with RBC EVs
We next investigated whether the PS-binding properties allowed the C1C2-nanobodies to bind to EV surfaces. RBCs were isolated from blood from healthy volunteers and stimulated with Ca2+-ionophore. This procedure has been described to stimulate secretion of EVs which are predominantly PS-positive.55,56 EVs were isolated using a differential (ultra)centrifugation method, with typical EV protein yields of 0.25–0.35 mg per mL of RBCs (at 40% hematocrit), corresponding with 7 × 10¹¹–9.8 × 10¹¹ particles per mL of RBCs as determined by Nanoparticle Tracking Analysis (NTA). Isolated EVs were incubated with R2-C1C2 and EGa1-C1C2 to allow protein binding to EV surfaces. Unbound proteins were removed by size-exclusion chromatography (SEC), and EVs were analyzed by western blotting. The amount of R2-C1C2 and EGa1-C1C2 that co-eluted with EVs increased in a concentration dependent manner (Fig. 4A). Importantly, when high concentrations of R2-C1C2 and EGa1-C1C2 without EVs were loaded onto the SEC column, no proteins were detected in the typical EV fractions (right two lanes in Fig. 4A), indicating that the purification method was suitable to completely separate EVs from unbound protein. Decoration of EVs with R2-C1C2 or EGa1-C1C2 did not affect EV size distribution as determined by NTA (Fig. 4B). EVs typically showed a heterogeneous size distribution with a mean size of ±160 nm. To investigate whether decoration with C1C2-nanobodies affected EV integrity or morphology, EVs were analyzed by Transmission Electron Microscopy (TEM). Immunogold labeling was performed on Myc tags to analyze recombinant protein localization. EVs appeared as heterogeneous spherical structures and displayed variable electron density (Fig. 4C). | ||
| Fig. 4 C1C2-nanobodies self-associate with RBC EVs in a dose-dependent manner without affecting EV size and integrity. A. Western blot of RBC EVs after decoration with increasing amounts of R2-C1C2 and EGa1-C1C2 and after SEC purification. C1C2-nanobodies were detected with anti-Myc antibodies and alpha-1-spectrin was used as a loading control for EVs. In each lane 20 μg of protein was loaded. Right two lanes show typical EV fractions after loading of high concentrations of R2-C1C2 or EGa1-C1C2 (corresponding with concentrations used in sample lanes 4 and 7) onto the SEC column. B. Representative size distribution of RBC EVs after decoration with C1C2-nanobodies (40 ng μg−1 EV), determined by Nanoparticle Tracking Analysis. Data is displayed as mean ± SD of 5 measurements. C. Transmission electron microscopy pictures of SEC-purified RBC EVs after decoration with R2-C1C2 or EGa1-C1C2 at a concentration of 40 ng μg−1 EV. Immunogold labeling was performed with anti-Myc antibodies and arrowheads indicate examples of membrane-associated gold. Scale bars represent 200 nm. | ||
Furthermore, EV samples contained elongated tubular structures with lengths of up to several micrometers, which is consistent with morphological observations on RBC EVs in previous studies.57,58 Control RBC EV membranes were mostly gold-negative, whereas gold clearly associated with EV membranes after EV incubations with R2-C1C2 or EGa1-C1C2. However, under these conditions also non-associated gold was observed, which might be the result of protein dissociation from EV membranes during, or before EM sample processing. The presence of C1C2-nanobodies did not affect EV size, morphology or electron density. Interestingly, both proteins were not homogeneously distributed over all EVs in the sample, but appeared to be concentrated on specific EV subpopulations instead. These subpopulations could not be characterized by particular features (e.g. low electron density or tubular/spherical size).
Effects of EV decoration with C1C2-nanobodies on EV interactions with tumor cells
To study whether decoration with C1C2-nanobodies altered the targeting specificity of RBC EVs, cell association and cell uptake assays with EGFR-negative Neuro2A cells and EGFR-overexpressing A431 cells (ESI Fig. 1†) were performed. For cell association assays, cells in suspension were incubated with AlexaFluor 488 fluorescently labeled EVs for 1 hour at 4 °C. The low temperature allows association, but prevents uptake of the EVs by the cells. When EVs were decorated with C1C2-nanobody/EV ratios of 2 or 10 ng μg−1, association with Neuro2A cells did not change, regardless of nanobody type (Fig. 5A). Remarkably, Neuro2A cell association increased slightly when EVs were decorated at a C1C2-nanobody/EV ratio of 50 ng μg−1, and this effect was similar for R2-C1C2 and EGa1-C1C2. When R2-C1C2 decorated EVs were incubated with A431 cells, the same behavior was observed (Fig. 5B). However, when EVs were decorated with EGa1-C1C2, association with A431 cells dramatically increased. This effect was dependent on the EGa1-C1C2/EV ratio. To evaluate whether this improvement in cell association translated into improved EV uptake by these cells, uptake assays were performed in which fluorescently labeled EVs were incubated with cells for 4 hours at 37 °C. After incubation, cells were acid washed to remove any cell-bound material and analyzed by flow cytometry. Interestingly, under these incubation conditions, untreated EVs were barely taken up by both cell types. Decoration with either R2-C1C2 or EGa1-C1C2 had no effect on EV uptake by Neuro2A cells, even when a high C1C2-nanobody/EV ratio was applied (Fig. 5C). In contrast, decoration of EVs with small amounts of EGa1-C1C2 resulted in a significantly increased EV uptake by A431 cells compared with untreated EVs or R2-C1C2 decorated EVs (Fig. 5D). Again, EV uptake was dependent on the EGa1-C1C2/EV ratio, whereas decoration with R2-C1C2 (even in a high R2-C1C2/EV ratio) did not affect EV uptake by these cells.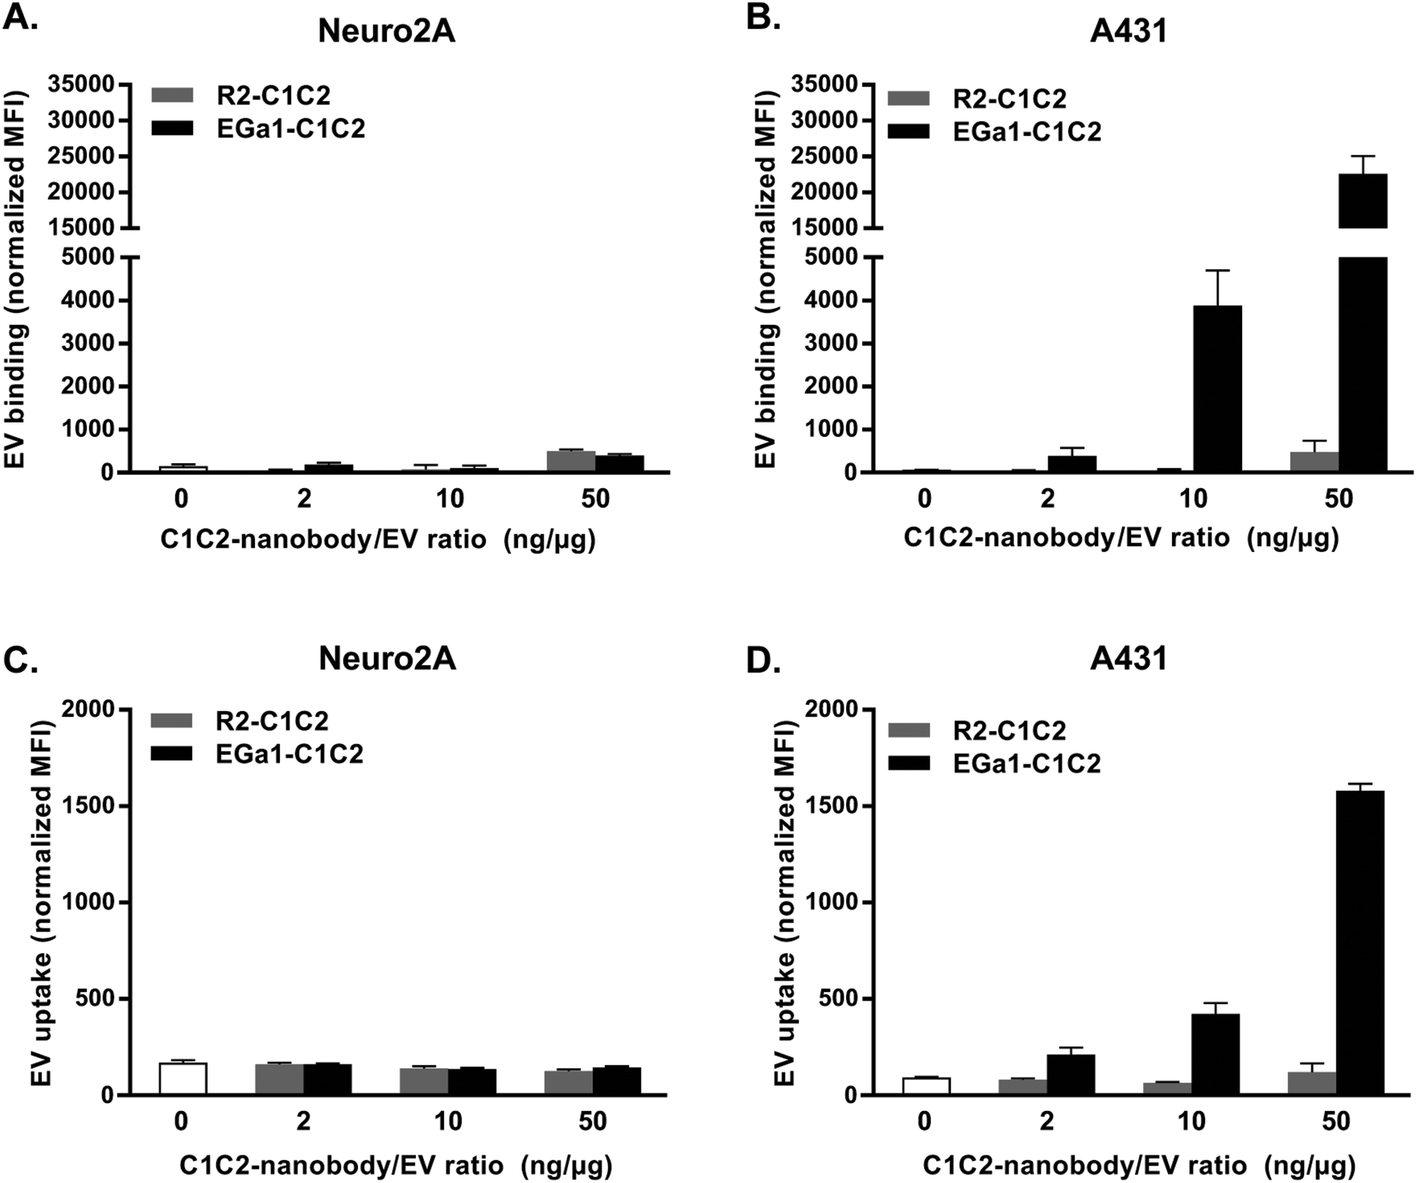 | ||
| Fig. 5 Decoration of RBC EVs with EGa1-C1C2 dose-dependently increases EV binding and uptake specifically by EGFR-overexpressing A431 cells. A. Binding of AlexaFluor488-labeled RBC EVs decorated with increasing amounts of R2-C1C2 (gray) or EGa1-C1C2 (black) to Neuro2A cells (panel A) and A431 cells (panel B) for 1 hour at 4 °C, determined by flow cytometry. C. Uptake of AlexaFluor488-labeled RBC EVs decorated with increasing amounts of C1C2-nanobodies by Neuro2A cells (panel C) and A431 cells (panel D) for 4 hours at 37 °C, determined by flow cytometry. Representative data of at least 2 replicate experiments are shown and data are displayed as mean ± SD. | ||
Application of C1C2-nanobodies to cell-culture derived EVs
We next hypothesized that C1C2-nanobodies could also equip PS-exposing EVs from other cellular sources than RBCs with tumor cell targeting properties. To test this, EVs were isolated from Neuro2A cells and mixed with R2-C1C2 and EGa1-C1C2. Indeed, C1C2-nanobodies dose-dependently self-associated with these EVs, whereas EV marker expression and EV size distribution remained unaltered (Fig. 6A and ESI Fig. 2†). C1C2-domains were required for this association, given that incubation with EGa1 lacking this domain resulted in complete removal of nanobodies from EVs by size exclusion chromatography. TEM analysis of decorated EVs after immunogold labelling of Myc tags revealed that C1C2-nanobodies did not affect the typical “cup-shaped” morphology or electron density of the EVs (ESI Fig. 3†). As observed for RBC-derived EVs, the recombinant proteins were not homogenously distributed over all EVs, but localized to membranes of specific subpopulations instead. When the C1C2-nanobody/EV ratio was increased, this distribution was only marginally affected, whereas gold density per vesicle increased. | ||
| Fig. 6 Decoration of Neuro2A EVs with EGa1-C1C2 dose-dependently promotes EV uptake by EGFR-overexpressing A431 cells and inhibits uptake by non-targeted cells. A. Western blot of Neuro2A EVs after decoration with increasing amounts of R2-C1C2 and EGa1-C1C2, or with 300 ng μg−1 EGa1 without C1C2 domains (second lane) and after SEC purification. C1C2-nanobodies were detected with anti-Myc antibodies and Alix and CD9 were used as EV marker proteins. In each lane 3 μg of protein was loaded. In the last two lanes 100 ng of R2-C1C2 and EGa1-C1C2 were loaded as references. B. Uptake of CellTracker Deep Red labeled, SEC purified Neuro2A EVs decorated with increasing concentrations of R2-C1C2 (gray) or EGa1-C1C2 (black) or 300 ng μg−1 of EGa1 without C1C2 domains by A431 cells or Neuro2A cells (panel C), as determined by flow cytometry. D. Uptake of CellTracker Deep Red labeled Neuro2A EVs decorated with increasing concentrations of R2-C1C2 or EGa1-C1C2 or 300 ng μg−1 of EGa1 without C1C2 domains by CellTracker Green labeled Neuro2A cells co-cultured with unstained A431 cells in a 2:1 ratio, as determined by flow cytometry. Data are expressed as the ratio of mean fluorescence intensity (MFI) of A431 cells with that of Neuro2A cells in the same well. Representative data of at least 3 replicate experiments are shown and data are displayed as mean ± SD. | ||
To investigate whether decoration with C1C2-nanobodies affected the interaction of Neuro2A EVs with tumor cells, EVs were labelled with CellTracker Deep Red, decorated with nanobodies and incubated by Neuro2A and A431 cells. EGa1-C1C2 dose-dependently and specifically increased the uptake of the EVs by A431 cells (Fig. 6B), whereas such effects were not observed for their parent cells (Neuro2A, Fig. 6C). In contrast, C1C2-nanobody decoration at high C1C2-nanobody/EV ratios (300 ng μg−1) tended to inhibit EV uptake by Neuro2A cells. The same effect was observed for EV uptake by A431 cells when EVs were decorated with 300 ng μg−1 of R2-C1C2. Of note, uptake of EVs by A431 cells appeared to reach a plateau when EVs were decorated with >75 ng μg−1 EGa1-C1C2, supporting observations from TEM analysis that high doses of C1C2 nanobodies affected the decoration density, but not the number of decorated EVs. No effect on EV uptake was observed when EVs were incubated with EGa1 without C1C2 domains, again confirming that the C1C2 domain was required for nanobody attachment and likely responsible for the inhibitory effects on EV uptake.
We next studied whether the C1C2-nanobodies allowed the EVs to be taken up selectively by EGFR expressing cells in the presence of an excess of non-EGFR expressing cells. Neuro2A cells were labelled with CellTracker Green and co-cultured with A431 cells in a Neuro2A:A431 ratio of 2:1. When fluorescently labeled C1C2-nanobody decorated EVs were added to this co-culture, it was again observed that the EVs were selectively taken up by A431 cells when decorated with EGa1-C1C2 (Fig. 6D). EV selectivity for A431 cells improved with increasing concentrations of EGa1-C1C2, due to a combination of increased uptake by A431 cells and decreased uptake by their parent Neuro2A cells. When both cell types were labelled with different fluorescent dyes and EV uptake visualized with fluorescence microscopy, these observations were confirmed (ESI Fig. 4†). In addition, given that acid washing does not guarantee complete removal of surface-bound EVs, co-cultured cells were examined using confocal microscopy after EV uptake. This analysis confirmed that EGa1-C1C2 decorated EVs were actually internalized by the A431 cells and not merely bound to the cell surface (ESI Fig. 5†).
Discussion
In this study, we show for the first time that C1C2 domains of lactadherin can be successfully fused to nanobodies and purified from cell culture supernatants of mammalian cells, and that these can be used to improve target cell-specific binding and uptake of EVs. It has been described that the C2 domain of lactadherin, which shares homology with the C2 domains of coagulation factors V and VIII, is mainly responsible for PS-binding.32,59 However, the C1 domain can further improve PS-association of the C2 domain, especially when the lipid is incorporated in membranes of lipid vesicles (e.g. EVs).33,60,61 Together, C1C2 domains are therefore attractive anchoring moieties for the attachment of targeting ligands to PS-exposing EVs, given that these domains (1) show high affinity for PS (Kd = ∼4 nM (ref. 32)), (2) bind PS in a calcium-independent fashion,62,63 (3) increase their binding affinity to PS with increasing membrane curvature and hence would be expected to favor EVs over larger PS-exposing surfaces in circulation (e.g. of apoptotic cells),63,64 (4) may shield PS on EVs from recognition by plasma components, such as coagulation factors V and VIII,62 which may reduce their thrombogenic potential, and (5) may shield PS on EVs from direct or lactadherin-mediated PS-recognition by phagocytes in the mononuclear phagocyte system (MPS), which may prevent premature clearance.65,66 Despite these beneficial features, the use of purified C1C2 domains for the decoration of EV surfaces is limited to a single report. Delcayre and coworkers showed that these domains could be used to decorate dendritic cell-derived exosomes with cytokines to elicit immune responses.33 This work was followed up by others who showed that cells transfected with C1C2-fusion proteins secreted EVs displaying these proteins, including tumor antigens34–36 and reporter proteins,67,68 on their membrane. However, these proteins were not purified, restricting their use to the transfected parent cells and corresponding EVs. Such strategies are therefore less suitable for hard-to-transfect cells, such as primary cells. The applicability of C1C2-fusion proteins can be significantly expanded by purification of these proteins. However, this process is hampered by technical challenges, given that C1C2 domains are hydrophobic and tend to irreversibly precipitate in aqueous solutions in the absence of lipid membranes. Indeed, when the C1C2-nanobodies described here were initially expressed in E. coli cells, pronounced protein accumulation in inclusion bodies was observed (data not shown). Protein precipitation was slightly reduced when a mammalian expression system was employed, possibly due to post-translational modifications. Nonetheless, significant irreversible C1C2-nanobody precipitation was observed during purification of these proteins with affinity chromatography (data not shown). To overcome these issues, a stabilizing formulation was developed, which contained a mixture of neutral, positively and negatively charged amino acids, and a low concentration of BSA. This formulation facilitated purification of these proteins and prevented their precipitation, even after several freeze–thaw cycles. As a result, both the N-terminal nanobody domains and the C-terminal C1C2 domains retained their functionality.We showed that the C1C2 domains of the C1C2-nanobodies could direct specific protein association with PS, but not with other membrane lipids, including phospholipids with negatively charged head groups. As expected, this resulted in rapid association of the C1C2 nanobodies with EVs derived from Ca2+-ionophore stimulated RBCs, which have been described to be predominantly PS-positive.24,55 Furthermore, C1C2-nanobodies self-associated with EVs from Neuro2A cells, illustrating that a substantial percentage of these EVs also expose PS. These data show that C1C2-nanobodies may be applied to equip EVs from a variety of cell types, including circulating cells in the blood stream, which have been described to secrete large quantities of PS-positive EVs, with targeting moieties.57,58 Nevertheless, it should be noted that a subset of EVs may be PS-negative and hence would not be receptive to C1C2-based decoration with targeting ligands. This is in line with our TEM observations, where C1C2-nanobodies’ distribution over EVs was heterogeneous, especially for cell culture derived (Neuro2A) EVs. In fact, the current dogma states that EVs which originate from direct blebbing of the plasma membrane (i.e. microvesicles or ectosomes) are PS-positive, while EVs released via fusion of multivesicular bodies with the plasma membrane (i.e. exosomes) are predominantly PS-negative.24,48,69 However, in lipidomic studies even exosomes are often found to be enriched in PS compared with their parent cells.2,18,19 Furthermore, exosomes typically do not contain flippase (the enzyme that actively maintains the asymmetrical lipid distribution in cellular membranes). This may result in gradual PS-exposure1 and possibly also makes exosomes amenable for C1C2 binding.
Association of C1C2-nanobodies with EVs resulted in major changes of EV–cell interactions. Whereas ‘naked’ RBC EVs typically showed only limited binding and uptake by EGFR-overexpressing tumor cells, these processes were dramatically enhanced upon decoration with EGa1-C1C2. This was also the case for Neuro2A EVs, which typically already show a higher basal association and uptake by these cells. A small non-specific increase of EV cell binding was observed when RBC EVs were decorated with relatively high concentrations of C1C2-nanobodies. It is still unclear why this phenomenon occurs, however it could be that C1C2 domains slightly reduce the negative surface charge of EVs by masking negatively charged PS head groups on the EV surface or by enriching the EV surface with positively charged domains. This may slightly increase passive association of EVs with the negatively charged cell surface.
Notably, it was observed that the uptake of C1C2-nanobody decorated Neuro2A-derived EVs by non-targeted cells (including their parent cells) tended to decrease compared with unmodified EVs, suggesting that EV targeting specificity was increased. Additionally, this indicates that PS plays a role in EV uptake and that C1C2 domains may be employed to shield EVs from interacting with non-targeted cells. These findings are supported by previous reports, which have shown that masking of PS on EVs with annexin V reduces their uptake by recipient cells70–75 and that PS receptors on recipient cells (e.g. TIM-1 and TIM-4) facilitate EV uptake.45,76,77 Given the abundance of these receptors on phagocytotic cells, PS on EVs is described to serve as an ‘eat-me’ signal, promoting EV engulfment and clearance from circulation.74,78 Hence, decoration with C1C2-nanobodies may provide additional advantages for EVs as drug delivery systems besides improved cell targeting specificity. If C1C2 fusion proteins are capable of masking eat-me signals of PS, the circulation time of exogenously administered EVs (which is typically short compared with currently approved synthetic drug delivery systems44,79) may be prolonged, improving their exposure to target tissues. This is especially relevant for solid tumor tissues which are supported by leaky vasculature, allowing passive extravasation of nanoparticles as a function of their circulation time.10,80
In addition to its targeting properties, EGa1-C1C2 may serve as an inhibitor of EGFR signaling. Our data showed that EGa1-C1C2 competed with EGF for its receptor, even at a 16-fold lower molar concentration than EGF. This is in agreement with previously published data on EGa1.49 Furthermore, EGa1-exposing liposomes have been described to induce EGFR downregulation and inhibit proliferation of tumor cells.51,52 Whether this antitumor effect is also conferred to EVs after decoration with EGa1-C1C2 remains to be investigated.
It should be noted that the intracellular fate of C1C2-nanobody decorated EVs may require additional studies. Proper delivery of EV-carried nucleic acids and other molecules may require fusion of EV membranes with plasma or endosomal membranes.7 These processes may be affected when EVs are directed towards an EGFR-dependent uptake mechanism. However, sensitive assays to properly assess the ability of EVs to functionally transfer biological cargo to recipient cells are currently scarce and remain the topic of intensive investigation. One of such assays could be the Cre-LoxP reporter system employed by Zomer et al., in which recipient cells permanently switch color when messenger RNA coding for Cre recombinase is functionally delivered.4 However, as with most reporter assays, this requires loading of EVs with appropriate effector molecules, which is technically challenging (especially for primary erythrocytes employed in this study). Nevertheless, given the biocompatible nature of EV manipulation using C1C2 fusion proteins (which are partly derived from naturally occurring lactadherin), it is well conceivable that EVs retain their capacity to transfer their cargo to targeted cells.
In conclusion, we show that C1C2-domains can be fused to nanobodies, and purified to near-complete purity while avoiding protein precipitation. These proteins confer remarkable tumor targeting properties to EVs from RBCs and Neuro2A cells without affecting EV integrity, and could possibly be used as ‘plug-and-play’ EV tumor targeting tools. Furthermore, the generation of recombinant C1C2-fused proteins may be an appealing strategy to decorate EVs with other moieties, such as therapeutic proteins and imaging reporters. Future research will be focused on the delivery of EV cargo to further boost their therapeutic potential.
Conflicts of interest
There are no conflicts to declare.Acknowledgements
The work of SAAK, JJJG, PV and RMS on cell-derived membrane vesicles is supported by a European Research Council starting grant (260627) “MINDS” in the FP7 ideas program of the European Union. PV is supported by a VENI Fellowship (# 13667) from the Netherlands Organisation for Scientific Research (NWO). Cor Seinen is gratefully acknowledged for technical assistance in electron microscopy experiments.References
- M. Colombo, G. Raposo and C. Thery, Annu. Rev. Cell Dev. Biol., 2014, 30, 255–289 CrossRef CAS PubMed.
- M. Yanez-Mo, P. R. Siljander, Z. Andreu, A. B. Zavec, F. E. Borras, E. I. Buzas, K. Buzas, E. Casal, F. Cappello, J. Carvalho, E. Colas, A. Cordeiro-da Silva, S. Fais, J. M. Falcon-Perez, I. M. Ghobrial, B. Giebel, M. Gimona, M. Graner, I. Gursel, M. Gursel, N. H. Heegaard, A. Hendrix, P. Kierulf, K. Kokubun, M. Kosanovic, V. Kralj-Iglic, E. M. Kramer-Albers, S. Laitinen, C. Lasser, T. Lener, E. Ligeti, A. Line, G. Lipps, A. Llorente, J. Lotvall, M. Mancek-Keber, A. Marcilla, M. Mittelbrunn, I. Nazarenko, E. N. Nolte-‘t Hoen, T. A. Nyman, L. O'Driscoll, M. Olivan, C. Oliveira, E. Pallinger, H. A. Del Portillo, J. Reventos, M. Rigau, E. Rohde, M. Sammar, F. Sanchez-Madrid, N. Santarem, K. Schallmoser, M. S. Ostenfeld, W. Stoorvogel, R. Stukelj, S. G. Van der Grein, M. H. Vasconcelos, M. H. Wauben and O. De Wever, J. Extracell. Vesicles, 2015, 4, 27066 CrossRef PubMed.
- H. Valadi, K. Ekstrom, A. Bossios, M. Sjostrand, J. J. Lee and J. O. Lotvall, Nat. Cell Biol., 2007, 9, 654–659 CrossRef CAS PubMed.
- A. Zomer, C. Maynard, F. J. Verweij, A. Kamermans, R. Schafer, E. Beerling, R. M. Schiffelers, E. de Wit, J. Berenguer, S. I. Ellenbroek, T. Wurdinger, D. M. Pegtel and J. van Rheenen, Cell, 2015, 161, 1046–1057 CrossRef CAS PubMed.
- C. Thery, M. Ostrowski and E. Segura, Nat. Rev. Immunol., 2009, 9, 581–593 CrossRef CAS PubMed.
- B. Costa-Silva, N. M. Aiello, A. J. Ocean, S. Singh, H. Zhang, B. K. Thakur, A. Becker, A. Hoshino, M. T. Mark, H. Molina, J. Xiang, T. Zhang, T. M. Theilen, G. Garcia-Santos, C. Williams, Y. Ararso, Y. Huang, G. Rodrigues, T. L. Shen, K. J. Labori, I. M. Lothe, E. H. Kure, J. Hernandez, A. Doussot, S. H. Ebbesen, P. M. Grandgenett, M. A. Hollingsworth, M. Jain, K. Mallya, S. K. Batra, W. R. Jarnagin, R. E. Schwartz, I. Matei, H. Peinado, B. Z. Stanger, J. Bromberg and D. Lyden, Nat. Cell Biol., 2015, 17, 816–826 CrossRef CAS PubMed.
- S. El-Andaloussi, I. Mager, X. O. Breakefield and M. J. Wood, Nat. Rev. Drug Discovery, 2013, 12, 347–357 CrossRef CAS PubMed.
- S. A. Kooijmans, P. Vader, S. M. van Dommelen, W. W. van Solinge and R. M. Schiffelers, Int. J. Nanomed., 2012, 7, 1525–1541 CAS.
- S. M. van Dommelen, P. Vader, S. Lakhal, S. A. Kooijmans, W. W. van Solinge, M. J. Wood and R. M. Schiffelers, J. Controlled Release, 2012, 161, 635–644 CrossRef CAS PubMed.
- R. van der Meel, M. H. Fens, P. Vader, W. W. van Solinge, O. Eniola-Adefeso and R. M. Schiffelers, J. Controlled Release, 2014, 195, 72–85 CrossRef CAS PubMed.
- B. Gyorgy, M. E. Hung, X. O. Breakefield and J. N. Leonard, Annu. Rev. Pharmacol. Toxicol., 2015, 55, 439–464 CrossRef CAS PubMed.
- L. Alvarez-Erviti, Y. Seow, H. Yin, C. Betts, S. Lakhal and M. J. Wood, Nat. Biotechnol., 2011, 29, 341–345 CrossRef CAS PubMed.
- Y. Tian, S. Li, J. Song, T. Ji, M. Zhu, G. J. Anderson, J. Wei and G. Nie, Biomaterials, 2014, 35, 2383–2390 CrossRef CAS PubMed.
- D. Bellavia, S. Raimondo, G. Calabrese, S. Forte, M. Cristaldi, A. Patinella, L. Memeo, M. Manno, S. Raccosta, P. Diana, G. Cirrincione, G. Giavaresi, F. Monteleone, S. Fontana, G. De Leo and R. Alessandro, Theranostics, 2017, 7, 1333–1345 CrossRef PubMed.
- S. Ohno, M. Takanashi, K. Sudo, S. Ueda, A. Ishikawa, N. Matsuyama, K. Fujita, T. Mizutani, T. Ohgi, T. Ochiya, N. Gotoh and M. Kuroda, Mol. Ther., 2013, 21, 185–191 CrossRef CAS PubMed.
- S. A. Kooijmans, C. G. Aleza, S. R. Roffler, W. W. van Solinge, P. Vader and R. M. Schiffelers, J. Extracell. Vesicles, 2016, 5, 31053 CrossRef PubMed.
- M. E. Hung and J. N. Leonard, J. Biol. Chem., 2015, 290, 8166–8172 CrossRef CAS PubMed.
- A. Llorente, T. Skotland, T. Sylvanne, D. Kauhanen, T. Rog, A. Orlowski, I. Vattulainen, K. Ekroos and K. Sandvig, Biochim. Biophys. Acta, 2013, 1831, 1302–1309 CrossRef CAS.
- M. Record, K. Carayon, M. Poirot and S. Silvente-Poirot, Biochim. Biophys. Acta, 2014, 1841, 108–120 CrossRef CAS PubMed.
- R. A. Haraszti, M. C. Didiot, E. Sapp, J. Leszyk, S. A. Shaffer, H. E. Rockwell, F. Gao, N. R. Narain, M. DiFiglia, M. A. Kiebish, N. Aronin and A. Khvorova, J. Extracell. Vesicles, 2016, 5, 32570 CrossRef PubMed.
- K. Laulagnier, C. Motta, S. Hamdi, S. Roy, F. Fauvelle, J. F. Pageaux, T. Kobayashi, J. P. Salles, B. Perret, C. Bonnerot and M. Record, Biochem. J., 2004, 380, 161–171 CrossRef CAS PubMed.
- K. Segawa and S. Nagata, Trends Cell Biol., 2015, 25, 639–650 CrossRef CAS PubMed.
- B. Hugel, M. C. Martinez, C. Kunzelmann and J. M. Freyssinet, Physiology, 2005, 20, 22–27 CrossRef CAS PubMed.
- A. Piccin, W. G. Murphy and O. P. Smith, Blood Rev., 2007, 21, 157–171 CrossRef CAS PubMed.
- C. Thery, A. Regnault, J. Garin, J. Wolfers, L. Zitvogel, P. Ricciardi-Castagnoli, G. Raposo and S. Amigorena, J. Cell Biol., 1999, 147, 599–610 CrossRef CAS PubMed.
- V. Luga, L. Zhang, A. M. Viloria-Petit, A. A. Ogunjimi, M. R. Inanlou, E. Chiu, M. Buchanan, A. N. Hosein, M. Basik and J. L. Wrana, Cell, 2012, 151, 1542–1556 CrossRef CAS PubMed.
- K. Hassani and M. Olivier, PLoS Neglected Trop. Dis., 2013, 7, e2185 CAS.
- B. Fevrier, D. Vilette, F. Archer, D. Loew, W. Faigle, M. Vidal, H. Laude and G. Raposo, Proc. Natl. Acad. Sci. U. S. A., 2004, 101, 9683–9688 CrossRef CAS PubMed.
- R. J. Simpson, S. S. Jensen and J. W. Lim, Proteomics, 2008, 8, 4083–4099 CrossRef CAS PubMed.
- P. Veron, E. Segura, G. Sugano, S. Amigorena and C. Thery, Blood Cells, Mol., Dis., 2005, 35, 81–88 CrossRef CAS PubMed.
- J. D. Stubbs, C. Lekutis, K. L. Singer, A. Bui, D. Yuzuki, U. Srinivasan and G. Parry, Proc. Natl. Acad. Sci. U. S. A., 1990, 87, 8417–8421 CrossRef CAS.
- M. H. Andersen, H. Graversen, S. N. Fedosov, T. E. Petersen and J. T. Rasmussen, Biochemistry, 2000, 39, 6200–6206 CrossRef CAS PubMed.
- A. Delcayre, A. Estelles, J. Sperinde, T. Roulon, P. Paz, B. Aguilar, J. Villanueva, S. Khine and J. B. Le Pecq, Blood Cells, Mol., Dis., 2005, 35, 158–168 CrossRef CAS PubMed.
- Z. C. Hartman, J. Wei, O. K. Glass, H. Guo, G. Lei, X. Y. Yang, T. Osada, A. Hobeika, A. Delcayre, J. B. Le Pecq, M. A. Morse, T. M. Clay and H. K. Lyerly, Vaccine, 2011, 29, 9361–9367 CrossRef CAS PubMed.
- R. B. Rountree, S. J. Mandl, J. M. Nachtwey, K. Dalpozzo, L. Do, J. R. Lombardo, P. L. Schoonmaker, K. Brinkmann, U. Dirmeier, R. Laus and A. Delcayre, Cancer Res., 2011, 71, 5235–5244 CrossRef CAS PubMed.
- I. S. Zeelenberg, M. Ostrowski, S. Krumeich, A. Bobrie, C. Jancic, A. Boissonnas, A. Delcayre, J. B. Le Pecq, B. Combadiere, S. Amigorena and C. Thery, Cancer Res., 2008, 68, 1228–1235 CrossRef CAS PubMed.
- F. Ciardiello and G. Tortora, N. Engl. J. Med., 2008, 358, 1160–1174 CrossRef CAS PubMed.
- N. Tebbutt, M. W. Pedersen and T. G. Johns, Nat. Rev. Cancer, 2013, 13, 663–673 CrossRef CAS PubMed.
- H. Revets, P. De Baetselier and S. Muyldermans, Expert Opin. Biol. Ther., 2005, 5, 111–124 CrossRef CAS PubMed.
- S. Ewert, C. Cambillau, K. Conrath and A. Pluckthun, Biochemistry, 2002, 41, 3628–3636 CrossRef CAS PubMed.
- E. Dolk, C. van Vliet, J. M. Perez, G. Vriend, H. Darbon, G. Ferrat, C. Cambillau, L. G. Frenken and T. Verrips, Proteins, 2005, 59, 555–564 CrossRef CAS PubMed.
- V. Kondylis, H. E. van Nispen Tot Pannerden, S. van Dijk, T. Ten Broeke, R. Wubbolts, W. J. Geerts, C. Seinen, T. Mutis and H. F. Heijnen, Autophagy, 2013, 9, 861–880 CrossRef CAS PubMed.
- C. Winzler, P. Rovere, M. Rescigno, F. Granucci, G. Penna, L. Adorini, V. S. Zimmermann, J. Davoust and P. Ricciardi-Castagnoli, J. Exp. Med., 1997, 185, 317–328 CrossRef CAS PubMed.
- S. A. A. Kooijmans, L. A. L. Fliervoet, R. van der Meel, M. H. A. M. Fens, H. F. G. Heijnen, P. M. P. van Bergen en Henegouwen, P. Vader and R. M. Schiffelers, J. Controlled Release, 2016, 224, 77–85 CrossRef CAS PubMed.
- M. Miyanishi, K. Tada, M. Koike, Y. Uchiyama, T. Kitamura and S. Nagata, Nature, 2007, 450, 435–439 CrossRef CAS PubMed.
- C. Thery, S. Amigorena, G. Raposo and A. Clayton, in Current protocols in cell biology/editorial board, ed. J. S. Bonifacino, et al., 2006, ch. 3, unit 3 22 Search PubMed.
- J. Z. Nordin, Y. Lee, P. Vader, I. Mager, H. J. Johansson, W. Heusermann, O. P. Wiklander, M. Hallbrink, Y. Seow, J. J. Bultema, J. Gilthorpe, T. Davies, P. J. Fairchild, S. Gabrielsson, N. C. Meisner-Kober, J. Lehtio, C. I. Smith, M. J. Wood and S. El Andaloussi, Nanomedicine, 2015, 11, 879–883 CrossRef CAS PubMed.
- H. F. Heijnen, A. E. Schiel, R. Fijnheer, H. J. Geuze and J. J. Sixma, Blood, 1999, 94, 3791–3799 CAS.
- E. G. Hofman, M. O. Ruonala, A. N. Bader, D. van den Heuvel, J. Voortman, R. C. Roovers, A. J. Verkleij, H. C. Gerritsen and P. M. van Bergen En Henegouwen, J. Cell Sci., 2008, 121, 2519–2528 CrossRef CAS PubMed.
- L. G. Frenken, R. H. van der Linden, P. W. Hermans, J. W. Bos, R. C. Ruuls, B. de Geus and C. T. Verrips, J. Biotechnol., 2000, 78, 11–21 CrossRef CAS PubMed.
- S. Oliveira, R. M. Schiffelers, J. van der Veeken, R. van der Meel, R. Vongpromek, P. M. van Bergen En Henegouwen, G. Storm and R. C. Roovers, J. Controlled Release, 2010, 145, 165–175 CrossRef CAS PubMed.
- R. van der Meel, S. Oliveira, I. Altintas, R. Haselberg, J. van der Veeken, R. C. Roovers, P. M. van Bergen en Henegouwen, G. Storm, W. E. Hennink, R. M. Schiffelers and R. J. Kok, J. Controlled Release, 2012, 159, 281–289 CrossRef CAS PubMed.
- S. H. Paik, Y. J. Kim, S. K. Han, J. M. Kim, J. W. Huh and Y. I. Park, Biotechnol. Prog., 2012, 28, 1517–1525 CrossRef CAS PubMed.
- C. Subra, K. Laulagnier, B. Perret and M. Record, Biochimie, 2007, 89, 205–212 CrossRef CAS PubMed.
- R. L. Koshiar, S. Somajo, E. Norstrom and B. Dahlback, PLoS One, 2014, 9, e104200 Search PubMed.
- P. E. Van Der Meijden, M. Van Schilfgaarde, R. Van Oerle, T. Renne, H. ten Cate and H. M. Spronk, J. Thromb. Haemostasis, 2012, 10, 1355–1362 CrossRef CAS PubMed.
- N. Arraud, C. Gounou, R. Linares and A. R. Brisson, J. Thromb. Haemostasis, 2015, 13, 237–247 CrossRef CAS PubMed.
- N. Arraud, R. Linares, S. Tan, C. Gounou, J. M. Pasquet, S. Mornet and A. R. Brisson, J. Thromb. Haemostasis, 2014, 12, 614–627 CrossRef CAS PubMed.
- C. Shao, V. A. Novakovic, J. F. Head, B. A. Seaton and G. E. Gilbert, J. Biol. Chem., 2008, 283, 7230–7241 CrossRef CAS PubMed.
- H. Wakabayashi, A. E. Griffiths and P. J. Fay, J. Biol. Chem., 2010, 285, 25176–25184 CrossRef CAS PubMed.
- K. Oshima, N. Aoki, T. Kato, K. Kitajima and T. Matsuda, Eur. J. Biochem., 2002, 269, 1209–1218 CrossRef CAS PubMed.
- J. Shi and G. E. Gilbert, Blood, 2003, 101, 2628–2636 CrossRef CAS PubMed.
- D. E. Otzen, K. Blans, H. Wang, G. E. Gilbert and J. T. Rasmussen, Biochim. Biophys. Acta, 2012, 1818, 1019–1027 CrossRef CAS PubMed.
- J. Shi, C. W. Heegaard, J. T. Rasmussen and G. E. Gilbert, Biochim. Biophys. Acta, 2004, 1667, 82–90 CrossRef CAS PubMed.
- K. S. Ravichandran, Immunity, 2011, 35, 445–455 CrossRef CAS PubMed.
- S. K. Dasgupta, H. Abdel-Monem, P. Niravath, A. Le, R. V. Bellera, K. Langlois, S. Nagata, R. E. Rumbaut and P. Thiagarajan, Blood, 2009, 113, 1332–1339 CrossRef CAS PubMed.
- Y. Takahashi, M. Nishikawa, H. Shinotsuka, Y. Matsui, S. Ohara, T. Imai and Y. Takakura, J. Biotechnol., 2013, 165, 77–84 CrossRef CAS PubMed.
- M. Morishita, Y. Takahashi, M. Nishikawa, K. Sano, K. Kato, T. Yamashita, T. Imai, H. Saji and Y. Takakura, J. Pharm. Sci., 2015, 104, 705–713 CrossRef CAS PubMed.
- M. Kanada, M. H. Bachmann, J. W. Hardy, D. O. Frimannson, L. Bronsart, A. Wang, M. D. Sylvester, T. L. Schmidt, R. L. Kaspar, M. J. Butte, A. C. Matin and C. H. Contag, Proc. Natl. Acad. Sci. U. S. A., 2015, 112, E1433–E1442 CAS.
- K. Al-Nedawi, B. Meehan, R. S. Kerbel, A. C. Allison and J. Rak, Proc. Natl. Acad. Sci. U. S. A., 2009, 106, 3794–3799 CrossRef PubMed.
- K. Al-Nedawi, B. Meehan, J. Micallef, V. Lhotak, L. May, A. Guha and J. Rak, Nat. Cell Biol., 2008, 10, 619–624 CrossRef CAS PubMed.
- L. G. Lima, A. C. Leal, G. Vargas, I. Porto-Carreiro and R. Q. Monteiro, Thromb. Res., 2013, 132, 450–456 CrossRef CAS PubMed.
- S. Keller, A. K. Konig, F. Marme, S. Runz, S. Wolterink, D. Koensgen, A. Mustea, J. Sehouli and P. Altevogt, Cancer Lett., 2009, 278, 73–81 CrossRef CAS PubMed.
- A. Matsumoto, Y. Takahashi, M. Nishikawa, K. Sano, M. Morishita, C. Charoenviriyakul, H. Saji and Y. Takakura, J. Pharm. Sci., 2017, 106, 168–175 CrossRef CAS PubMed.
- K. Yuyama, H. Sun, S. Mitsutake and Y. Igarashi, J. Biol. Chem., 2012, 287, 10977–10989 CrossRef CAS PubMed.
- A. Morales-Kastresana, B. Telford, T. A. Musich, K. McKinnon, C. Clayborne, Z. Braig, A. Rosner, T. Demberg, D. C. Watson, T. S. Karpova, G. J. Freeman, R. H. DeKruyff, G. N. Pavlakis, M. Terabe, M. Robert-Guroff, J. A. Berzofsky and J. C. Jones, Sci. Rep., 2017, 7, 1878 CrossRef PubMed.
- D. Feng, W. L. Zhao, Y. Y. Ye, X. C. Bai, R. Q. Liu, L. F. Chang, Q. Zhou and S. F. Sui, Traffic, 2010, 11, 675–687 CrossRef CAS PubMed.
- L. A. Mulcahy, R. C. Pink and D. R. Carter, J. Extracell. Vesicles, 2014, 3, 24641 CrossRef PubMed.
- C. P. Lai, O. Mardini, M. Ericsson, S. Prabhakar, C. A. Maguire, J. W. Chen, B. A. Tannous and X. O. Breakefield, ACS Nano, 2014, 8, 483–494 CrossRef CAS PubMed.
- H. Maeda, H. Nakamura and J. Fang, Adv. Drug Delivery Rev., 2013, 65, 71–79 CrossRef CAS PubMed.
Footnote |
| † Electronic supplementary information (ESI) available. See DOI: 10.1039/c7nr06966a |
| This journal is © The Royal Society of Chemistry 2018 |