
An inner filter effect based Schiff base chemosensor for recognition of Cr(VI) and ascorbic acid in water matrices†
Ambreen
Abbasi
and
Mohammad
Shakir
 *
*
A Division of Inorganic Chemistry, Department of Chemistry, Aligarh Muslim University, Aligarh 202002, India. E-mail: shakir078@yahoo.com; Tel: +91-9837430035
First published on 20th November 2017
Abstract
An effective and simple fluorescent sensing approach for recognition of Cr(VI) using a Schiff base chemosensor, N′-[(E)-(3,4-dimethoxyphenyl)methylidene]furan-2-carbohydrazide, was developed. Fluorescence of the chemosensor was adequately quenched by Cr(VI) through primary and secondary inner filter effects. The linear recognition range of Cr(VI) was from 1 μM to 500 μM with a detection limit of 0.175 μM. The switched off fluorescence of the chemosensor–Cr(VI) solution was effectively switched on with the addition of L-ascorbic acid in the concentration range of 10 μM to 390 μM with a LOD of 2.46 μM. The mechanism proposed for fluorescence turn-on of quenched fluorescence of the Cr(VI)–chemosensor solution of ascorbic acid is the reduction of Cr(VI) to Cr(III) by L-ascorbic acid which resulted in the elimination of both primary and secondary inner filter effects and the recovery of fluorescence of the chemosensor. The method presented in this paper was found to be effective in recognition of Cr(VI) in tap water and groundwater and ascorbic acid in human serum and vitamin C tablets.
1. Introduction
In the last few decades, chromium has been extensively released into the environment by various industrial processes such as electroplating, leather tanning, mining, textile dyeing, inorganic chemical plants and other anthropogenic processes1–5 due to which contamination by chromium has become a serious concern in recent years. Generally, chromium is found in soil, ground water and seawater in trivalent and hexavalent oxidation states. Chromium in its trivalent oxidation state is an essential element for mammals and is required for maintaining efficient glucose, lipid and protein metabolism6 and also plays an important role in insulin action. On the other hand, chromium in its hexavalent oxidation state is a notorious pollutant to the environment and can have a negative impact on human health.7 Its toxicity arises due to its high oxidation potential and small size, on account of which it can easily diffuse through cell membranes in the form of HCrO4− and CrO42−.8 Cr(VI) is known to be highly mutagenic and carcinogenic and is detrimental to human reproductive and developmental systems. Its high water solubility increases its mobility and bioaccessibility.9 It can easily reach the aquatic environment through various industrial effluents. The corrosion inhibitors used in water pipes are one of the most widespread sources of direct entry of Cr(VI) in the drinking water supply chain. The U.S. Environmental Protection Agency has set the maximum Cr(VI) concentration in drinking water to be 0.1 mg L−1,10 while the World Health Organization (WHO) has set an allowable limit of Cr(VI) in drinking water to be 16 mg L−1.11 Keeping in mind its high toxicity and carcinogenicity for humans, the demand for selective and sensitive detection of Cr(VI) in the environment is growing at the fastest rate.Until now, a lot of analytical techniques have been successfully employed in the detection of Cr(VI) such as chromatography, electrochemical techniques, inductively coupled plasma mass spectroscopy12–15etc. Although these methods are successful in the determination of Cr(VI), they have serious disadvantages which limit their use in the detection of Cr(VI). Some of these disadvantages are high cost and time consuming, complicated sample preparation and operation of costly and very sophisticated instruments. In recent years, fluorescent sensors have attracted a great deal of attention and recognition by various analysts because of their high selectivity and sensitivity, quick response, simple and low-cost operation, in situ and real-time monitoring and non-invasiveness.16,17 Some nanoparticles have been used as sensors for the fluorometric detection of Cr(VI);18–20 however, organic fluorescent sensors for Cr(VI) are few in comparison to those for other metal ions.8,21–24 Hence, the development of organic fluorescent sensors for the detection of Cr(VI) is highly desirable.
L-Ascorbic acid (AA) is the main biologically active form of vitamin C. Green peppers, citrus fruits and juices, tomatoes, broccoli, green turnips, sweet potato, etc.25 are some of the natural sources of vitamin C. It serves as a co-factor for several enzymes, which aids in the synthesis of collagen, norepinephrine and the adrenal hormone and the metabolism of folic acid, tyrosine and tryptophan.26 Its importance in the absorption of iron in the gut and the biosynthesis of carnitine is well known.27 Many biological events such as electron transport reaction, hydroxylation, oxidative catabolism of aromatic compounds and many more28 involve the participation of L-ascorbic acid. The toxic free radicals and other reactive oxygen species which are formed during cell metabolism and are related to various forms of tissue damage and diseases29 are removed by ascorbic acid. The deficiency of ascorbic acid causes scurvy, and hypo-immunity, infertility and cancer30 while its overdose may lead to diarrhoea, kidney calculi and stomach cramps.31,32 Keeping in mind its utmost association with human health, a quantitative analysis of ascorbic acid has captured great importance in several areas of analytical chemistry such as pharmaceutical and food applications. The development of suitable methods to determine ascorbic acid in serum has utmost clinical significance which could be used to timely treat the deficiency of ascorbic acid and evaluate human physiological conditions. Among the various analytical techniques available to detect ascorbic acid in biological and pharmaceutical samples, the fluorescence technique has gained the upper hand on account of its simplicity, sensitivity, selectivity and rapid response.
The inner filter effect, though a source of error in fluorimetry, has been employed recently to develop sensors.8,9,18–20 It arises from the absorption of excitation and/or emission of light by the absorber in the detecting system. The basic requirement for the inner filter effect to be operative is the efficient spectral overlap between the absorption band of the absorbing species and excitation and/or emission band of the fluorophore. Upon comparing the inner filter effect mechanism with other sensing mechanisms such as photoinduced electron transfer, intramolecular charge transfer, fluorescence resonance energy transfer, metal–ligand charge transfer etc., which involve intermolecular interactions between the target analyte and the sensor, this approach does not require any interaction between the target analyte and the sensor. Furthermore, in this case, absorbance changes of the absorber transform exponentially into fluorescence intensity changes, which result in an increased sensitivity of this method compared to other methods. An inner filter effect based Schiff base chemosensor was synthesized and characterized to recognize Cr(VI) in a water matrix. Fluorescence quenching in the presence of Cr(VI) was observed due to the intensive absorption of both the excitation and emission light of the chemosensor by Cr(VI). Further, the chemosensor–Cr(VI) solution was used to determine ascorbic acid via oxidation–reduction between Cr(VI) and ascorbic acid. The developed chemosensor has a wide dynamic detection range and low detection limits for both Cr(VI) and L-ascorbic acid. The developed method was also applied for recognition of Cr(VI) in tap water and ground water and L-ascorbic acid in human serum and commercial vitamin C tablets.
According to the authors’ knowledge, this study is the first to report an inner filter effect based Schiff base sensor for sensing Cr(VI) and ascorbic acid in a water matrix.
2. Experimental
2.1. Reagents and instrumentation
All the chemicals were purchased from Sigma Aldrich and were used as received. The chloride salts of K+, Na+, Ca2+, Mg2+, Cr3+, Mn2+, Co2+, Ni2+, Cu2+, Hg2+, Cd2+, Fe3+, Zn2+ and Al3+ were used as metal ion sources and potassium salts of CrO42−, F−, Cl−, Br−, I−, CO32−, NO2−, NO3−, SO42−, SO32−, PO43−, CH3COO−, −OH, ClO4−, HSO4−, HPO42−, CN−, SCN− and MnO4− were used as ion sources. Ascorbic acid, sucrose, fructose, glucose, maltose, saccharin, citric acid, benzoic acid, oxalic acid, malonic acid, mannitol and sorbitol were also procured from Sigma Aldrich. Ultrapure water was prepared in the laboratory using a water treatment device and was used throughout the work. Human serum was obtained from the pathology lab of University hospital. Commercial vitamin C tablets (Limcee (500 mg ascorbic acid) and Celin (ascorbic acid (1000 mg)) were purchased from a local drug store.A Hitachi LS-2500 spectrometer was used to record fluorescence spectra. Electronic spectral studies were done on a Shimadzu UV-2450 spectrometer. FT-IR spectra were obtained using a Perkin Elmer Spectrum Two FT-IR Spectrometer. A Bruker Avance II 400 spectrometer operating at 400 MHz and 100 MHz, respectively, was used for 1H and 13C NMR spectral studies, using DMSO-d6 as the solvent. Mass spectra were recorded on a Waters Q-TOF MICROMASS mass spectrometer operating on ESI. A flash EA 1112 analyzer was employed to carry out elemental analysis. Fluorescence lifetime measurements were done on a HORIBA Jobin Yvon Fluorocube-01-NL fluorescence lifetime spectrometer by using the Time-correlated Single Photon Counting (TCSPC) method.
2.2. Preparation of test solutions and the general procedure for UV-Vis and fluorescence spectrometry determination
A stock solution of the chemosensor, L (1 mM), was prepared in DMF. 10 mM stock solutions of metal ions and anions and other reagents were prepared in ultrapure water. The original stock solutions were used to prepare the working stock solutions (1 mM) and an appropriate amount of working solutions was further used in an analytical procedure. For Cr(VI) determination 200 μL of the stock solution of the chemosensor, L (20 μM), and different concentrations of 1 mM stock solution of Cr(VI) and 100 μL of DMF were introduced into a 10 mL volumetric flask. The mixed solutions were diluted to volume with DMF/water (1![[thin space (1/6-em)]](https://www.rsc.org/images/entities/char_2009.gif) :9, v/v) and the pH of the resulting solution was maintained at 6 using dilute HCl and fluorescence spectra were recorded after 1 min. For ascorbic acid determination 200 μL of the stock solution of the chemosensor, L (20 μM), and different concentrations of 1 mM stock solution of ascorbic acid and 100 μL of DMF were introduced into a 10 mL volumetric flask containing 1 mM of Cr(VI). The mixed solutions were diluted to volume with DMF/water (1:9, v/v) and the pH of the resulting solution was maintained at 6 using dilute HCl and fluorescence spectra were recorded after 5 minutes. The pH value was adjusted with 0.1 M NaOH and 0.1 M HCl. The excitation and emission wavelengths used for the measurements were 350 nm and 438 nm, and the slit widths were 10 mm. The measurements were performed after 1 min for Cr(VI) and 5 minutes for ascorbic acid.
:9, v/v) and the pH of the resulting solution was maintained at 6 using dilute HCl and fluorescence spectra were recorded after 1 min. For ascorbic acid determination 200 μL of the stock solution of the chemosensor, L (20 μM), and different concentrations of 1 mM stock solution of ascorbic acid and 100 μL of DMF were introduced into a 10 mL volumetric flask containing 1 mM of Cr(VI). The mixed solutions were diluted to volume with DMF/water (1:9, v/v) and the pH of the resulting solution was maintained at 6 using dilute HCl and fluorescence spectra were recorded after 5 minutes. The pH value was adjusted with 0.1 M NaOH and 0.1 M HCl. The excitation and emission wavelengths used for the measurements were 350 nm and 438 nm, and the slit widths were 10 mm. The measurements were performed after 1 min for Cr(VI) and 5 minutes for ascorbic acid.
2.3. Determination of Cr(VI) in tap water and ground water samples
The impurities and suspended matter in the collected tap and groundwater samples were removed by filtering the samples through Whatman filter paper No. 41. 2 mL of water samples were added separately into 10 mL volumetric flasks, then 200 μL of the stock solution of the chemosensor, L (20 μM), and different concentrations of 1 mM stock solution of Cr(VI) and 100 μL of DMF were introduced. The mixed solutions were diluted to volume with DMF/water (1:9, v/v) and the pH of the resulting solution was maintained at 6 using dilute HCl and fluorescence spectra were recorded after 1 min.
2.4. Determination of ascorbic acid in human serum and vitamin C tablets
A human serum sample was diluted 50-fold with ultrapure water before the analysis. 100 μL of the diluted serum sample was added to 10 mL volumetric flasks, then 200 μL of the stock solution of the chemosensor, L (20 μM), 1 mM Cr(VI) and different concentrations of 1 mM stock solution of ascorbic acid and 100 μL of DMF were introduced. The mixed solutions were diluted to volume with DMF/water (1:9, v/v) and the pH of the resulting solution was maintained at 6 using dilute HCl and fluorescence spectra were recorded after 5 minutes.
The average content of tablets was determined from the contents of five tablets. The contents were powdered in an agate mortar and an accurately weighed portion of the powder was transferred to a 100 mL brown measuring flask and diluted to scale with ultrapure water. The mixture was sonicated for 15 minutes for appropriate dissolution and then filtered. An accurate volume of the filtrate was further diluted with ultrapure water so that the concentration of ascorbic acid in the final solution could meet the linear range of the working curve. Fluorescence determination of the tablet samples was conducted in the same way as the standard ascorbic acid solution except that the ascorbic acid solution was replaced by the prepared tablet solutions.
For quantitative determination 180 μL of the diluted tablet solutions were added separately into 10 mL volumetric flasks, then 200 μL of the stock solution of the chemosensor, L (20 μM), 1 mM of Cr(VI) and different concentrations of 1 mM stock solution of ascorbic acid and 100 μL of DMF were introduced. The mixed solutions were diluted to volume with DMF/water (1:9, v/v) and the pH of the resulting solution was maintained at 6 using dilute HCl and fluorescence spectra were recorded after 5 minutes.
2.5. Synthesis of the chemosensor, N′-[(E)-(3,4-dimethoxyphenyl)methylidene]furan-2-carbohydrazide (L)
The Schiff base chemosensor, N′-[(E)-(3,4-dimethoxyphenyl)methylidene]furan-2-carbohydrazide (L), was synthesized by mixing an ethanolic solution of 3,4-methoxybenzaldehyde (0.012 GM, 5 mile) with 2-furoic acid hydrazide (0.0095 GM, 5 mmol) in ethanol (15 mL) at room temperature (Scheme 1). The mixture was then stirred under reflux for three hours. The off-white colored crystalline precipitate of the Schiff base was obtained from yellow colored solution by slow evaporation of the solvent.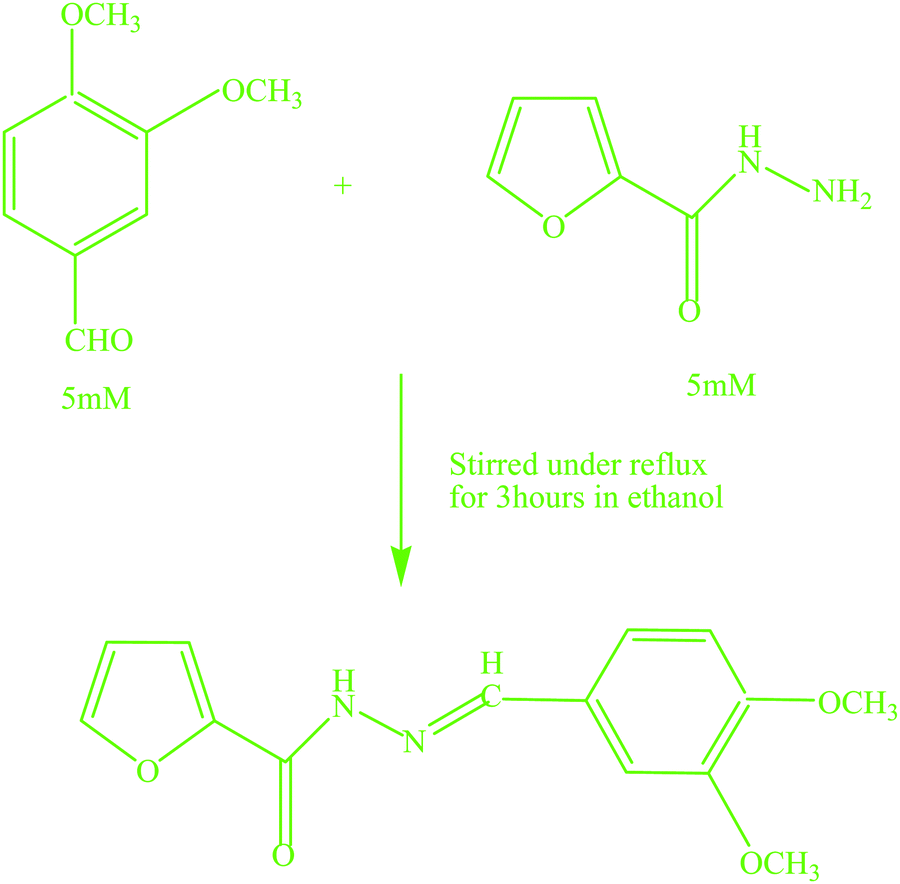 | ||
| Scheme 1 Synthesis of the Schiff base chemosensor. | ||
3. Results and discussion
Scheme 1 shows the synthesis of the sensor, L.Characterization of the developed chemosensor, L, was done by proton and carbon-13 NMR, IR, and mass spectral techniques and elemental analysis. The IR spectrum of the chemosensor exhibited an absorption band at 3219 cm−1, corresponding to the ν(NH) stretching vibration of a secondary amide. The amide I, ν(C![[double bond, length as m-dash]](https://www.rsc.org/images/entities/char_e001.gif) O), band was observed at 1652 cm−1. The methoxy stretching vibration was observed at 2836 cm−1 and the azomethine stretching vibration was found at 1596 cm−1. Elemental analysis results corroborated the composition C14H14N2O4 (C 61.35; H 5.16; N 10.25) which matched well with the calculated values of C 61.31; H 5.14; N 10.21. The 1H NMR spectrum of the chemosensor, L (Fig. S1, ESI†), presented signals in the range of 6.69–7.93 ppm corresponding to aromatic protons. The signal at 11.77 ppm corresponded to the N–H proton of the hydrazide moiety. The signal at 8.36 ppm was assigned to azomethine hydrogen. The signals at 3.81 and 3.80 ppm corresponded to methoxy hydrogens. The 13C NMR spectrum of L (Fig. S2, ESI†) exhibited a characteristic signal at 150.86 ppm corresponding to azomethine carbon and the signal at 154.24 ppm was ascribed to carbonyl carbon. The signals at 55.60 ppm and 55.48 ppm were assignable to methoxy carbons. The signals in the range 108.19–149.13 ppm were assigned to aromatic carbons. The mass spectrum of L (Fig. S3, ESI†) showed peaks at m/z values of 275.47 and 297.45 for [L + H]+ and [L + Na]+.
O), band was observed at 1652 cm−1. The methoxy stretching vibration was observed at 2836 cm−1 and the azomethine stretching vibration was found at 1596 cm−1. Elemental analysis results corroborated the composition C14H14N2O4 (C 61.35; H 5.16; N 10.25) which matched well with the calculated values of C 61.31; H 5.14; N 10.21. The 1H NMR spectrum of the chemosensor, L (Fig. S1, ESI†), presented signals in the range of 6.69–7.93 ppm corresponding to aromatic protons. The signal at 11.77 ppm corresponded to the N–H proton of the hydrazide moiety. The signal at 8.36 ppm was assigned to azomethine hydrogen. The signals at 3.81 and 3.80 ppm corresponded to methoxy hydrogens. The 13C NMR spectrum of L (Fig. S2, ESI†) exhibited a characteristic signal at 150.86 ppm corresponding to azomethine carbon and the signal at 154.24 ppm was ascribed to carbonyl carbon. The signals at 55.60 ppm and 55.48 ppm were assignable to methoxy carbons. The signals in the range 108.19–149.13 ppm were assigned to aromatic carbons. The mass spectrum of L (Fig. S3, ESI†) showed peaks at m/z values of 275.47 and 297.45 for [L + H]+ and [L + Na]+.
3.1. Spectral properties of the synthesized chemosensor
The UV-Vis absorption spectrum of the synthesized chemosensor (Fig. S4, ESI†) exhibited two absorption bands: one located at 263 nm corresponding to the π–π* transition and one broad band with three small peaks at 334 nm, 349 nm and 368 nm assignable to the n–π* transitions of the Schiff base moiety. Fig. S5 (ESI†) displays the photoluminescence spectra of the chemosensor at different excitation wavelengths. Upon changing the excitation wavelength from 260 nm to 350 nm only one emission peak appeared at 438 nm, indicating that the emission wavelength of the chemosensor was independent of the excitation wavelength. Further, it was noted that the maximum emission was obtained upon excitation at 350 nm and hence, this was chosen as the excitation wavelength for our study. The observed single emission wavelength was indicative of the fact that the solution of the chemosensor has only a single emitter. In order for the inner filter effect to be efficient, a good overlap between the absorption band of the quencher and the excitation and/or emission bands of the fluorophore is required. As shown in Fig. 1, Cr(VI) exhibited three absorption bands centred at 260 nm, 350 nm and 440 nm, while the excitation spectrum of the chemosensor was centred at 350 nm and its emission band under 350 nm excitation was located at 438 nm, respectively, showing the effective overlapping between the Cr(VI) absorption bands and the excitation and emission bands of the chemosensor. Thus, Cr(VI) was not only effective in shielding the excitation light of the chemosensor but was also successful in absorbing the emitted light from the chemosensor. Therefore, the increase in the absorbance of Cr(VI) was effectively converted into fluorescence quenching of the chemosensor, which in turn ensured that the inner filter effect has occurred in an efficient manner. | ||
| Fig. 1 (a) UV-Vis absorption spectrum of K2CrO4 (Cr(VI)), (b) the fluorescence excitation and (c) the emission spectrum of the chemosensor. | ||
3.2. Optimization of reaction conditions
To achieve sensitive detection of Cr(VI), the effect of pH value on the fluorescence intensity of the chemosensor was evaluated. As shown in Fig. S6 (ESI†), the fluorescence intensity of the chemosensor remained almost unchanged in the pH range of 2–12, which indicated that the pH had no effect on the fluorescence intensity of the chemosensor. The effect of pH on the solution of the chemosensor and Cr(VI) was also studied. Fig. S6 (ESI†) shows that the maximum fluorescence quenching was observed at pH 6, and therefore, this pH was chosen for the study. The effect of the reaction time between the chemosensor and Cr(VI) was also investigated to further optimise the analytical procedure. A stable fluorescence signal was obtained after a reaction time of 1 minute (Fig. S7, ESI†) upon the addition of 2 mM of Cr(VI) to 20 μM solution of the chemosensor. Thus, a reaction time of one minute was found to be enough for fluorescence quenching experiments. For the determination of ascorbic acid, a stable fluorescence signal was obtained for a solution of the chemosensor containing 500 μM of Cr(VI) and 3 mM of ascorbic acid after 5 minutes (Fig. S8, ESI†).3.3. Fluorescence determination of Cr(VI) and ascorbic acid (AA)
To study the selectivity of the chemosensor, L, towards Cr(VI) and the L–Cr(VI) ensemble towards ascorbic acid, we studied the influence of common metal ions, anions and chemical species on the fluorescence intensity of L and the L–Cr(VI) ensemble. As shown in Fig. S9 (ESI†), most of the metal ions and anions exhibited no significant effect on the fluorescence intensity of L, expect MnO4−. The quenched fluorescence of the L–Cr(VI) ensemble was recovered only by the addition of ascorbic acid and no other chemical species could bring about a similar effect (Fig. S10, ESI†). The sensitivity of the chemosensor towards Cr(VI) was investigated in the concentration range 0–2 mM. Fig. 2A shows that, with a gradual increment in the Cr(VI) concentration, the fluorescence quenching signal was observed at 438 nm. The fluorescence quenching signal exhibited a linear response in the concentration range of 1–500 μM with a LOD of 0.175 μM (Fig. 2B). The equation F0/F = 26841.5[Cr(VI)] + 1.09 was obtained upon fitting the values of the fluorescence intensity and the concentration of Cr(VI). The equation obtained was found to be close to the Stern Volmer equation. The KSV value was found to be 2.7 × 10⁴ L mol−1 with a correlation coefficient R2 of 0.992 (Fig. 2C). The LOD was found to be much lower than the maximum limit of Cr(VI) set for drinking water. | ||
| Fig. 2 (A) Fluorescence response of the chemosensor at different concentrations of Cr(VI). The inset figure represents the relationship between the fluorescence intensity and the concentration of Cr(VI). (B) Fluorescence response of the chemosensor at different concentrations of Cr(VI) within the linear range. (C) The Stern Volmer plot within the linear range. | ||
Taking into account both the primary and secondary inner filter effect processes between the chemosensor and Cr(VI) and the strong oxidising property exhibited by Cr(VI), we thought of considering a probability of sensing a powerful reductant by the fluorescence switch on–off–on process. In our study, we have chosen L-ascorbic acid to be that reductant as it is known to remove Cr(VI).33Fig. 3A indicates that the switched off fluorescence of the chemosensor–Cr(VI) solution was regenerated by the addition of ascorbic acid. Fig. 3B shows that there is good linearity between the fluorescence intensity and the ascorbic acid concentration in the range of 10 to 390 μM with a LOD of 2.46 μM.
 | ||
| Fig. 3 (A) Fluorescence response of the chemosensor in the presence of 500 μM of Cr(VI) and at different concentrations of ascorbic acid. The inset figure represents the relationship between the fluorescence intensity and the concentration of ascorbic acid. (B) Fluorescence response of the chemosensor at different concentrations of ascorbic acid within the linear range. | ||
3.4. Interferences
In the analysis of real samples, the analyte under consideration will include interferents which may affect the fluorescence signal either by suppressing it or enhancing it. The effect of possible interfering substances in the detection of Cr(VI) (Table 1 and Fig. S11, ESI†) and ascorbic acid (Table 2 and Fig. S12, ESI†) was studied by preparing a set of solutions, each one with 20 μM of chemosensor, 100 μM of Cr(VI) and different concentrations of interfering species tested for Cr(VI), while for ascorbic acid a set of solutions were prepared, each containing 20 μM of chemosensor, 500 μM of Cr(VI), 50 μM of ascorbic acid and different concentrations of chemical species to be tested. A chemical species is considered to be non-interfering when its effect on the fluorescence signal of the chemosensor–Cr(VI) system and the chemosensor–Cr(VI)–ascorbic acid system is less than 5% deviation.| Ions added | Tolerance ratio (mol mol−1) |
|---|---|
| F−, Cl−, Br−, I−, CO32−, NO2−, NO3−, SO42−, SO32−, PO43−, CH3COO−, −OH, ClO4−, HSO4−, HPO42−, CN−, SCN− | 300 |
| K+, Na+, Ca2+, Mg2+, Cr3+, Mn2+, Co2+, Ni2+, Hg2+, Cd2+ | 300 |
| Fe2+, Zn2+, Al3+ | 100 |
| Cu2+, Fe3+ | 50 |
| MnO4− | 0.3 |
| Interfering species | Tolerance ratio (mol mol−1) |
|---|---|
| Sucrose, citric acid | 400 |
| Glucose | 100 |
| Fructose, saccharin, benzoic acid, oxalic acid, malonic acid, maltose mannitol and sorbitol | 300 |
| K+, Na+, Ca2+, Mg2+, Mn2+, Ni2+, SO42−, Cl− | 500 |
| Fe2+, Zn2+ | 200 |
As shown in Table 1, the major interference in the determination of Cr(VI) comes from a permanganate (MnO4−) ion, which is not surprising as permanganate is known to have absorption in the UV and visible region, and hence its tolerance ratio was found to be as low as 0.3. Table 1 shows that most of the anions were well tolerated at a concentration of >100-fold of Cr(VI). Fe2+, Zn2+, and Al3+ were found to exhibit minimal interference when their concentrations were kept below 100-fold of Cr(VI), while Cu2+ and Fe3+ showed slight interference and hence their concentrations were kept lower than 50-fold of Cr(VI). These results supported the selectivity of the chemosensor towards Cr(VI).
The results given in Table 2 suggested that the chemical species studied have no major interference in the determination of ascorbic acid. The results indicated that relatively high concentrations of these species were well tolerated.
3.5. Mechanism involved in the determination of Cr(VI) and ascorbic acid (AA)
The fluorescence lifetime measurements of the chemosensor at different concentrations of Cr(VI) were explored to confirm the inner filter effect (IFE) mechanism for Cr(VI) recognition using the chemosensor. As shown in Fig. S13 (ESI†), the lifetime remained constant under 350 nm excitation, and the fluorescence decay of the chemosensor was fitted using a three exponential decay function to yield a lifetime of 5.3 nm. The results confirmed the IFE mechanism. Fig. S14 (ESI†) shows that the absorption spectrum of the chemosensor did not show any change with increasing concentration of Cr(VI). Scheme 2 represents the fluorescence turn on–off assay for Cr(VI) and turn on–off–on assay for ascorbic acid. | ||
| Scheme 2 | ||
To ascertain the mechanism of the chemosensor–Cr(VI) in the determination of ascorbic acid, absorption spectra of the chemosensor–Cr(VI) system was studied at different concentrations of ascorbic acid. As shown in Fig. S15 (ESI†), the absorption bands of Cr(VI) gradually decreased with the increase in the concentration of ascorbic acid while the bands of Cr(III) at 426 nm and 566 nm appeared and increased in intensity with the increase in the concentration of ascorbic acid. The results confirmed that ascorbic acid reduced Cr(VI) to Cr(III) and itself got oxidized to dehydroascorbic acid (DAA), which was found to be similar to an earlier report.34 It was also noted that the absorption spectrum of the chemosensor did not show any change during the whole process. The conversion of Cr(VI) to Cr(III) by ascorbic acid lowers the efficiency of IFE leading to a fluorescence enhancement upon the addition of ascorbic acid.
3.6. Determination of Cr(VI) in tap water and ground water
In order to evaluate the practicality of the chemosensor in real sample detection, the proposed sensor was tested through the determination of Cr(VI) in tap and ground water samples using the standard addition method and the results are summarized in Table 3. The experimental results showed that the recovery of Cr(VI) varied from 99% to 104% with a relative standard deviation (RSD) of less than 2, suggesting the applicability of the proposed method to water samples. The present method was compared with other reported methods for the determination of Cr(VI) (Table S1, ESI†).| Water sample | Added (μM) | Found (μM) | Recovery (%) | RSD (%) |
|---|---|---|---|---|
| Tap water | 0 | Not found | — | — |
| 50 | 52 | 104 | 1.45 | |
| 200 | 198 | 99 | 1.64 | |
| Ground water | 0 | Not found | — | — |
| 50 | 51 | 102 | 1.85 | |
| 200 | 203 | 101.5 | 1.95 |
3.7. Determination of ascorbic acid in human serum and vitamin C tablets
In order to evaluate the feasibility of the proposed method in real sample detection, the developed fluorescence probe based on the synthesized chemosensor–Cr(VI) system was used to detect ascorbic acid in human serum samples. The results obtained using the standard addition method are shown in Table 4 and the accuracy of the method was evaluated by determining the recovery of ascorbic acid in the serum sample. The recovery of ascorbic acid reached 102.5% and the RSD was found to be lower than 2. The results demonstrated the potential applicability of the developed method for the detection of ascorbic acid in human serum.| Added (μM) | Found (μM) | Recovery (%) | RSD (%) |
|---|---|---|---|
| 0 | Not found | — | — |
| 200 | 205 | 102.5 | 2.36 |
| 1400 | 1407 | 100.5 | 2.48 |
The qualitative determination of ascorbic acid in vitamin C tablets was carried out by adding suitable aliquots of diluted vitamin C tablet samples to 10 mL of 20 μM chemosensor solution containing 450 μM Cr(VI) in a DMF/water mixture (1:9 v/v) at pH 6 (Fig. S16 and S17, ESI†).
For quantitative determination, the standard addition method was employed and the results are tabulated in Table 5. The RSD was found to be less than 2% and recoveries between 101.5% and 105% were significant, which illustrated the good performance of the method. The proposed method was also used to determine ascorbic acid in vitamin C tablets and was compared with the standard triiodide procedure (Table 5). The present method was compared with other reported methods for the determination of ascorbic acid (Table S2, ESI†).
| Vitamin C tablet | Proposed method (mg per tablet) | Reference method (mg per tablet) | Found (μM) | Added (μM) | Total found (μM) (n = 5) | Recovery (%) | RSD (%) n = 5) |
|---|---|---|---|---|---|---|---|
| Limcee (500 mg) | 475 ± 2.4 | 485 ± 3.2 | 5 | 100 | 106 | 101 | 1.12 |
| 200 | 208 | 101.5 | 1.25 | ||||
| Celin (1000 mg) | 987 ± 2.1 | 992 ± 4.1 | 10 | 100 | 113 | 103 | 1.67 |
| 200 | 214 | 102 | 1.51 |
Although by employing our method we did not obtain the lowest limit of detection for both Cr(VI) and ascorbic acid, the straightforwardness and the potential to recognize both Cr(VI) and ascorbic acid using our synthesized chemosensor via the inner filter effect based Schiff base chemosensor is the uniqueness of our presented work.
4. Conclusions
A new inner filter effect based Schiff base chemosensor is synthesized and characterized to recognize Cr(VI) and ascorbic acid in water matrices. The sensor was successfully applied in the analysis of real samples with satisfactory results.Conflicts of interest
There are no conflicts to declare.Acknowledgements
We gratefully acknowledge the Department of Science and Technology, Delhi, and the University Grants Commission, Delhi, India, for providing funds to the Department of Chemistry under the DST-PURSE-Phase II program.References
- P. S. Coloma, U. Izagirre, Y. Belaustegi, J. B. Jorcin, F. J. Cano and N. Lapena, Appl. Surf. Sci., 2015, 345, 24–35 CrossRef.
- H. Falk-Windisch, J. E. Svensson and J. Froitzheim, J. Power Sources, 2015, 287, 25–35 CrossRef CAS.
- S. Karamchedu, E. Hryha and L. Nyborg, J. Mater. Process. Technol., 2015, 223, 171–185 CrossRef CAS.
- V. D. Ovcharenko, A. S. Kuprin, G. N. Tolmachova, I. V. Kolodiy, A. Gilewicz, O. Lupicka, J. Rochowicz and B. Warcholinski, Vacuum, 2015, 117, 27–34 CrossRef CAS.
- M. Zheng, Z. Xie, D. Qu, D. Li, P. Du, X. Jing and Z. Sun, ACS Appl. Mater. Interfaces, 2013, 5, 13242–13247 CAS.
- L. Wang, J. Liu, Z. Zhou, M. Xu and B. Wang, Anal. Methods, 2017, 9, 1786–1791 RSC.
- M. A. Qazi, U. Ocak, M. Ocak, S. Menon and I. B. Solangi, J. Fluoresc., 2013, 23, 575–590 CrossRef CAS PubMed.
- D. Zhang, Z. Dong, X. Jiang, M. Feng, W. Li and G. Gao, Anal. Methods, 2013, 5, 1669–1675 RSC.
- H. Kim, B. Lee II and S. H. Byeon, Chem. Commun., 2015, 51, 725–728 RSC.
- F.-M. Li, J.-M. Liu, X.-X. Wang, Li-P. Lin, W.-L. Cai, X. Lin, Yi-N. Zeng, Z.-M. Li and S.-Q. Lin, Sens. Actuators, B, 2011, 155, 817–822 CrossRef CAS.
- WHO, Guidelines for Drinking Water Quality, Recommendations, World Health Organization, Geneva, 3rd edn, 2004, vol. 1 Search PubMed.
- J. Chwastowska, W. Skwara, E. SterlInika and L. Pszonicki, Talanta, 2005, 66, 1345–1349 CrossRef CAS PubMed.
- H. J. Wang, X. M. Du, M. Wang, T. C. Wang, H. Ou-Yanga, B. Wang, M. T. Zhu, Y. Wang, G. Jia and W. Y. Feng, Talanta, 2010, 81, 1856–1860 CrossRef CAS PubMed.
- V. Arancibia, M. Valderrama, K. Silva and T. Tapia, J. Chromatogr. B: Anal. Technol. Biomed. Life Sci., 2003, 785, 303–309 CrossRef CAS.
- T. N. Ravishankar, S. Muralikrishna, K. Suresh Kumar, G. Nagaraju and T. Ramakrishnappa, Anal. Methods, 2015, 7, 3493–3499 RSC.
- L. E. Santos-Figueroa, M. E. Moragues, E. Climent, A. Agostini, R. Martinez-Manez and F. Sancenon, Chem. Soc. Rev., 2013, 42, 3489–3613 RSC.
- K. Kaur, R. Saini, A. Kumar, V. Luxami, N. Kaur, P. Singh and S. Kumar, Coord. Chem. Rev., 2012, 256, 1992–2028 CrossRef CAS.
- M. Rong, L. Lin, X. Song, Y. Wang, Y. Zhong, J. Yan, Y. Feng, X. Zeng and X. Chen, Biosens. Bioelectron., 2015, 68, 210–217 CrossRef CAS PubMed.
- D. K. Dalavi, D. P. Bhopate, A. S. Bagawan, A. H. Gore, N. K. Desai, A. A. Kamble, P. G. Mahajan, G. B. Kolekar and S. R. Patil, Anal. Methods, 2014, 6, 6948–6955 RSC.
- L. Zhu, X. Peng, H. Li, Y. Zhang and S. Yao, Sens. Actuators, B, 2017, 238, 196–203 CrossRef CAS.
- A. F. Zheng, J. L. Chen, G. H. Wu, G. L. Wu, Y. G. Zhang and H. P. Wei, Spectrochim. Acta, Part A, 2009, 74, 265–270 CrossRef PubMed.
- K. A. N. Upamali, L. A. Estrada and D. C. Neckers, Anal. Methods, 2011, 3, 2469–2471 RSC.
- M. A. Qazi, Ü. Ocak, M. Ocak, S. Memon and I. B. Solangi, J. Fluoresc., 2013, 23, 575–590 CrossRef CAS PubMed.
- Z. Zhang, C. Sha, A. Liu, Z. Zhang and D. Xu, J. Fluoresc., 2015, 25, 335–340 CrossRef CAS PubMed.
- Y. Andreu, S. D. Marcos, J. R. Castillo and J. Galban, Talanta, 2005, 65, 1045–1051 CrossRef CAS PubMed.
- S. Skrovankova, J. Mlcek, J. Sochor, M. Baron, J. Kynicky and T. Jurikova, Int. J. Electrochem. Sci., 2015, 10, 2421–2431 CAS.
- M. T. T. Trani, K. M. Phillips and M. Cotty, J. Food Compos. Anal., 2012, 26, 12–25 CrossRef.
- L. Klepo, A. C. Janicijevic and L. K. Modum, Molecules, 2016, 21, 101–112 CrossRef PubMed.
- S. De Rosa, P. Cirillo, A. Paglia, L. Sasso, V. Di Palma and M. Chiariello, Curr. Vasc. Pharmacol., 2010, 8, 259–275 CrossRef CAS PubMed.
- J. Liu, Y. Chen, W. Wang, J. Feng, M. Liang, S. Ma and X. Chen, J. Agric. Food Chem., 2016, 64, 371–380 CrossRef CAS PubMed.
- S. J. Padayatty, A. Katz, Y. Wang, P. Eck, O. Kwon, J.-H. Lee, S. Chen, C. Corpe, A. Dutta, S. K. Dutta and M. Levine, J. Am. Coll. Nutr., 2003, 22, 18–35 CrossRef CAS PubMed.
- L. K. Massey, M. Liebman and S. A. Kynast-Gales, J. Nutr., 2005, 135, 1673–1677 CAS.
- X. R. Xu, H. B. Li, X. Y. Li and J. D. Gu, Chemosphere, 2004, 57, 609–613 CrossRef CAS PubMed.
- B. Z. Karan, A. N. Ay and C. Ünaleroğlu, Synth. React. Inorg. Met. – Org. Chem., 2002, 32, 1071–1084 CrossRef.
Footnote |
| † Electronic supplementary information (ESI) available. See DOI: 10.1039/c7nj03677a |
| This journal is © The Royal Society of Chemistry and the Centre National de la Recherche Scientifique 2018 |