Construction of a Z-scheme core–shell g-C3N4/MCNTs/BiOI nanocomposite semiconductor with enhanced visible-light photocatalytic activity
Zengyu
You
a,
Qianhong
Shen
 *ab,
Yuxuan
Su
a,
Yang
Yu
a,
Hui
Wang
a,
Tian
Qin
a,
Fang
Zhang
b,
Di
Cheng
b and
Hui
Yang
*ab
aState Key Laboratory of Silicon Materials, School of Materials Science and Engineering, Zhejiang University, Hangzhou, 310027, P. R. China. E-mail: s_qianhong@163.com
bZhejiang-California International NanoSystems Institute, Zhejiang University, Hangzhou, 310058, P. R. China
First published on 24th November 2017
Abstract
A novel Z-scheme core–shell g-C3N4/MCNTs/BiOI heterojunction was successfully designed and fabricated through filling multi-walled carbon nanotubes (MCNTs) with g-C3N4, followed by the loading of BiOI on the outer surface of the MCNTs. The structure–property relationship was analyzed by X-ray diffraction (XRD), Fourier transform infrared spectra (FT-IR), scanning electron microscopy (SEM), transmission electron microscopy (TEM), UV-vis diffuse reflectance spectra (DRS), photoluminescence spectra (PL), ESR probe tests and reactive species trapping measurements. The results show that the BiOI nanoparticles are uniformly loaded on the surface of the MCNTs which are fully filled by g-C3N4. The MCNTs connect the two semiconductors of g-C3N4 and BiOI, and serve as electron mediating conductors to promote the transfer of the photo-generated electrons, thereby constructing a Z-scheme heterojunction between g-C3N4 and BiOI. With this unique structure, enhanced visible-light photocatalytic activities are achieved because of the synergistic effect of light harvesting and improved separation efficiency of photo-generated carriers.
1. Introduction
Semiconductor photocatalysts have received massive attention during the past few decades due to their potential applications in environment purification and hydrogen energy production.1,2 As a single semiconductor generally suffers from low separation efficiency of photo-generated electron–hole pairs, semiconductor heterojunctions were constructed to overcome this problem. Normally, a heterojunction can be formed between two semiconductors, in which one semiconductor has a more negative CB potential whereas the other semiconductor possesses a more positive VB potential. The difference of chemical potential will result in opposite migration of photo-generated electrons and holes. That is, photo-generated electrons would transfer from the semiconductor with more negative CB potential to the semiconductor with more positive CB potential, and the holes prefer to migrate from the semiconductor with more positive VB potential to the semiconductor with more negative VB potential, therefore achieving an efficient charge separation. However, the redox ability of the photo-generated carriers is also inevitably weakened at the same time.3 Hence, Z-scheme heterojunctions have attracted more and more attention due to their special band structure. In this case, the photo-generated electrons would transfer from the semiconductor with more positive CB potential to the semiconductor with more negative VB potential, therefore leaving the electrons and the holes in the more-negative CB and more-positive VB, respectively. Hence, this band structure can achieve efficient separation of photo-generated carriers without weakening their original redox ability.4,5 It is obvious that electron transfer between the two semiconductors is the rate-determining process for Z-scheme heterojunctions.6,7 How to promote the transfer of photo-generated electrons has become a research hotspot in this field. Recently, semiconductor–conductor–semiconductor (S–C–S) Z-scheme heterojunctions, which were formed by placing a conductor that served as an electron mediator between the two semiconductors, were proposed to achieve highly effective electron migration.8,9The material selection is crucial in designing Z-scheme heterojunctions. It is well known that superoxide radicals (O2˙−), hydroxyl radicals (˙OH) and holes (h+) are the main reactive species during the photocatalytic reaction.3 To take full use of these species after the Z-scheme transfer of photo-generated charges, the remaining electrons in the semiconductor with more negative CB potential should have the ability to produce O2˙−. That is to say the CB potential of this semiconductor needs to be more negative than −0.33 eV (O2/O2˙− = −0.33 eV per NHE).10 For the same purpose, the VB of the semiconductor, in which the holes stay, should be more positive than 2.27 eV (˙OH/H2O = 2.27 eV per NHE).11 At the same time, the CB potential of the semiconductor with more positive VB potential should be more negative than the VB potential of the semiconductor with more negative VB potential. Furthermore, in the case of a S–C–S Z-scheme heterojunction, a conductor material between the two semiconductors is used as an electron mediator to enable photo-generated electrons to migrate from one semiconductor to another. The selection of the conductor material is another important issue for the construction of S–C–S Z-scheme heterojunctions. Ionic redox couples, such as Fe3+/Fe2+ and I2/I−, are the most commonly studied electron mediators for shuttling electrons.12,13 Besides, noble metals (for example Ag and Au) and reduced graphene oxide (RGO) are also involved in the construction of an S–C–S Z-scheme heterojunction.14–16
In recent years, graphitic carbon nitride (g-C3N4) has become a promising visible-light responsive photocatalyst due to its 2D structure, extraordinary stability, tunable electronic structure and narrow bandgap of 2.7 eV.17–21 In order to further enhance the photocatalytic activities of g-C3N4, various attempts have been made,22–26 in which constructing a heterojunction between g-C3N4 and other semiconductors has been widely employed to achieve enhanced light harvesting, as well as to improve the separation efficiency of photo-generated electrons and holes in g-C3N4.27–33 However, the VB potential of g-C3N4 is about 1.66 eV, which is less than 2.27 eV (˙OH/H2O = 2.27 eV per NHE), so the holes remaining in the VB of g-C3N4 cannot react with H2O and yield ˙OH.3,34 In our previous research,34 a Z-scheme g-C3N4/InVO4 heterojunction was fabricated, and thus the holes can remain in the VB of InVO4 (the potential is about 2.44 eV) and generate ˙OH due to their more positive VB potential compared with the ˙OH/H2O standard potential, thereby exhibiting an enhanced photocatalytic activity.
In this article, an S–C–S Z-scheme g-C3N4-based heterojunction was designed and constructed. BiOI, with a narrow bandgap of 1.73–1.94 eV,35–40 was selected to combine with g-C3N4 to form a Z-scheme heterojunction because of its matched band level and more positive VB level relative to the 2.27 eV of the ˙OH/H2O standard potential.41 To further promote the electron transfer from BiOI to g-C3N4, multi-walled carbon nanotubes (MCNTs), which have been widely used to accelerate charge separation of semiconductor photocatalysts,42–45 were employed as an electron mediator. MCNTs were filled with g-C3N4 inside and decorated by BiOI nanoparticles on the outside surface. Thus, an expected Z-scheme heterojunction was constructed. With such a unique structure, the composite exhibited improved photocatalytic activity under visible light irradiation due to the synergistic effect of light harvesting and enhanced separation efficiency of photo-generated carriers. Moreover, the relationship between the photocatalytic activity and the structure of the heterojunction was also discussed in detail.
2. Experimental
2.1 Materials
All of the chemicals (AR grade) in this work, including cyanamide (CN2H2), potassium iodide (KI), bismuth nitrate (BiN3O9·5H2O), ethylene glycol (EG), methylene blue (MB), p-benzoquinone (BQ), isopropyl alcohol (IPA) and ethylenediamine teraacetic acid disodium salt (EDTA-2Na), were purchased from Aladdin Reagent Co. Ltd and used without any further purification. Multi-walled carbon nanotubes (MCNTs) were also purchased from Aladdin Reagent Co. Ltd. 5,5-Dimethyl-1-pyrroline-N-oxide (DMPO) was obtained commercially from Sigma-Aldrich (for ESR-spectroscopy).2.2 Synthesis of core–shell g-C3N4/MCNTs (CM)
Core–shell CM was synthesized through the following process: Firstly, 0.5 g of MCNTs was put into a glass beaker containing 50 ml of ethyl alcohol. 2 g of cyanamide was added to the system after being ultrasonicated and stirred for 4 h. After stirring for 2 h, the mixture was transferred to a vacuum oven and kept for 4 h at room temperature, and then dried at 80 °C for 24 h. Finally, the black mixture was collected and put in an semi-covered crucible, followed by a heating process at 550 °C for 4 h in Ar at a heating rate of 2.2 °C min−1. The as-prepared sample was ground into a fine powder for further use.For comparison, g-C3N4 was synthesized through a thermal condensation process. Firstly, a certain amount of cyanamide was placed in a semi-covered alumina crucible, and then the crucible was put into a tube furnace. The cyanamide was heated to 550 °C in air at a heating rate of 2.2 °C min−1. After roasting at 550 °C for 4 h, g-C3N4 was obtained.
2.3 Synthesis of g-C3N4/MCNTs/BiOI (CMB)
The CMB composites were prepared via a solvothermal method. In a typical process, a certain amount of CM was dispersed in 25 ml of EG solution with ultrasonication for 1 h. Then, 20 ml of bismuth nitrate EG solution was added to the dispersion slowly. After stirring for 30 min, 20 ml of potassium iodide EG solution was added to the system drop by drop to a molar ratio of Bi3+![[thin space (1/6-em)]](https://www.rsc.org/images/entities/char_2009.gif) :
:![[thin space (1/6-em)]](https://www.rsc.org/images/entities/char_2009.gif) I− = 1
I− = 1![[thin space (1/6-em)]](https://www.rsc.org/images/entities/char_2009.gif) :
:![[thin space (1/6-em)]](https://www.rsc.org/images/entities/char_2009.gif) 1, and then the mixture was stirred for another 30 min. The mixture was then poured into a 100 ml teflon-lined stainless autoclave and was heated in an oven at 150 °C for 12 h. Subsequently, the precipitate was collected and washed by centrifugation with deionized water and ethyl alcohol twice respectively, and then dried at 60 °C for 6 h. The as-prepared composites with expected CM mass fractions of 5%, 10%, 20% and 33.3% were denoted as CMB-5, CMB-10, CMB-20 and CMB-33, respectively.
1, and then the mixture was stirred for another 30 min. The mixture was then poured into a 100 ml teflon-lined stainless autoclave and was heated in an oven at 150 °C for 12 h. Subsequently, the precipitate was collected and washed by centrifugation with deionized water and ethyl alcohol twice respectively, and then dried at 60 °C for 6 h. The as-prepared composites with expected CM mass fractions of 5%, 10%, 20% and 33.3% were denoted as CMB-5, CMB-10, CMB-20 and CMB-33, respectively.
For comparison, a g-C3N4/BiOI composite with an expected g-C3N4 mass ratio of 20% was fabricated through a similar method, and denoted as CB-20. BiOI was also synthesized via a similar solvothermal method simply without CM present. Pristine g-C3N4 was obtained using the same process without the presence of MCNTs, KI and BiN3O9·5H2O (denoted as CN).
2.4 Characterization
An X-ray powder diffractometer (XRD, APEXII, Bruker, Germany) was used to identify the crystal structure of the obtained powders using Ni-filtered Cu Ka radiation (k = 0.1542 nm). The 2 theta ranges from 5° to 80° in steps of 0.02°. The FT-IR spectra were recorded in transmission mode from![[small nu, Greek, tilde]](https://www.rsc.org/images/entities/i_char_e0e1.gif) = 4000 to 400 cm−1 with an FT-IR spectrometer (Nicolet 5700, ThermoFisher, USA) by using the standard KBr disk method. The morphology and particle sizes of the samples were performed on a field emission scanning electron microscopy (SEM, SU-70, Hitachi, Japan). Further morphological and structural characterizations were based on field emission transmission electron microscopy and high-resolution transmission microscopy (TEM and HRTEM, Tecnai G2 F20 S-TWIN, FEI, USA) observations. UV-vis diffuse reflectance spectra (DRS) were obtained on a UV-vis spectrophotometer (DRS, Cary 5000, Agilent, USA) with BaSO4 as the reference and the absorption spectra were further calculated using the Kubelka–Munk function. The photoluminescence emission spectra and the time-resolved fluorescence decay spectra of the as-prepared samples were detected on a fluorescence lifetime and steady-state spectrometer (FLS920, Edinburgh, UK). In detail, the PL emission spectra were obtained at an excitation wavelength of 325 nm with a Xe lamp, and the PL decay spectra were recorded at an excitation wavelength of 405 nm with a nanosecond pulse laser.
= 4000 to 400 cm−1 with an FT-IR spectrometer (Nicolet 5700, ThermoFisher, USA) by using the standard KBr disk method. The morphology and particle sizes of the samples were performed on a field emission scanning electron microscopy (SEM, SU-70, Hitachi, Japan). Further morphological and structural characterizations were based on field emission transmission electron microscopy and high-resolution transmission microscopy (TEM and HRTEM, Tecnai G2 F20 S-TWIN, FEI, USA) observations. UV-vis diffuse reflectance spectra (DRS) were obtained on a UV-vis spectrophotometer (DRS, Cary 5000, Agilent, USA) with BaSO4 as the reference and the absorption spectra were further calculated using the Kubelka–Munk function. The photoluminescence emission spectra and the time-resolved fluorescence decay spectra of the as-prepared samples were detected on a fluorescence lifetime and steady-state spectrometer (FLS920, Edinburgh, UK). In detail, the PL emission spectra were obtained at an excitation wavelength of 325 nm with a Xe lamp, and the PL decay spectra were recorded at an excitation wavelength of 405 nm with a nanosecond pulse laser.
2.5 Evaluation of photocatalytic activity
The photocatalytic activities of the as-prepared samples were evaluated by the decolorization of methylene blue46 (MB) in aqueous solution under visible light irradiation. A 300 W Xe lamp with a 420 nm UV-cutoff filter was used as a visible light source. In each experiment, 50 mg of photocatalyst was dispersed in a MB (100 ml, 10 mg L−1) aqueous solution. Prior to irradiation, the solution was continuously stirred in the dark for 2 h to reach adsorption–desorption equilibrium between the MB and the photocatalyst. During the photocatalytic reaction, the solution was kept magnetically stirring, and 4 ml of the mixture was collected at 30 min intervals followed by centrifugation (10![[thin space (1/6-em)]](https://www.rsc.org/images/entities/char_2009.gif) 000 rpm, 5 min) to remove the photocatalyst. The concentration of MB was determined by monitoring the change of absorbance at 663 nm using a UV-vis spectrophotometer (UV-vis Abs, UV-4100, Hitachi, Japan).
000 rpm, 5 min) to remove the photocatalyst. The concentration of MB was determined by monitoring the change of absorbance at 663 nm using a UV-vis spectrophotometer (UV-vis Abs, UV-4100, Hitachi, Japan).
2.6 Active species trapping experiments
Benzoquinone (BQ), isopropanol (IPA) and EDTA disodium salt (EDTA-2Na) were involved in the MB photocatalytic decolorization reaction system as the scavengers of superoxide radicals (O2˙−), hydroxyl radicals (˙OH) and holes (h+) respectively to elucidate the photocatalysis mechanism. The concentrations of BQ, IPA and EDTA-2Na were 0.1 mmol L−1, 2.0 mmol L−1 and 10 mmol L−1 respectively. The measurement was similar to the former photocatalytic activity experiment except that the scavengers were added before visible-light irradiation. Additionally, the electron spin resonance (ESR, ESRA-300, Bruker, Germany) signals were recorded by the probe molecule 5,5-dimethyl-1-pyrroline-N-oxide (DMPO) under visible-light irradiation (>420 nm). The samples for ESR measurement were prepared by mixing the as-prepared samples in 80 mmol L−1 DMPO solution. An aqueous dispersion was used for DMPO–˙OH and a methanol dispersion was used for DMPO–O2˙−.3. Results and discussion
The XRD patterns of CN, MCNTs and CM are shown in Fig. 1a. For CN, two pronounced diffraction peaks are observed at 13.2° and 27.4° respectively. The former peak is indexed as the (100) plane corresponding to the in-plane structural packing motif of tri-s-triazine units, and the diffraction peak at 27.4° corresponds to the interlayer stacking of the conjugated aromatic systems.17 MCNTs have a characteristic diffraction peak at 26°, which is consistent with the literature.43 Moreover, as shown in the XRD pattern of CM, a peak that is unapparent due to the covering of the peak of MCNTs at 27.4° belonging to g-C3N4 can also be observed. The formation of g-C3N4 inside the carbon nanotubes is further verified by the FT-IR spectra, as shown in Fig. 1b. The featured bands assigned to g-C3N4 are observed significantly in the FT-IR spectra of CM, such as skeletal vibrations at 1200–1600 cm−1 for aromatic CN heterocycles and the breathing vibration at 809 cm−1 for triazine units.47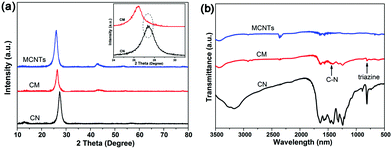 | ||
| Fig. 1 (a) XRD patterns in the range from 10 to 80° and from 24 to 31° (inset) and (b) FT-IR spectra of CN, CM and MCNTs. | ||
The structure and morphology of the MCNTs and CM were investigated by the observation of a TEM image. As presented in Fig. 2a, the MCNTs have expected tube-like structures with open ends. However, as displayed in Fig. 2b, g-C3N4 occupies the inside space of the tubes and is in intimate contact with the internal face of the MCNTs. The elemental mapping of CM is displayed in Fig. 2c and d. The maps of C-K and N-K are well defined and have the same shape and location, demonstrating the definite existence of g-C3N4 inside the tubes along with the results of the XRD patterns and FT-IR spectra.
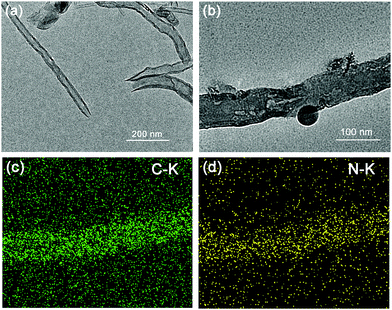 | ||
| Fig. 2 TEM images of (a) MCNTs and (b) CM; the corresponding EDS elemental mapping images of (c) C and (d) N. | ||
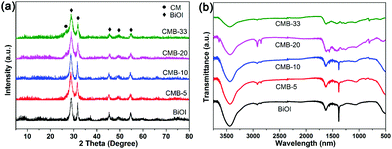
XRD was also used to identify and determine the phase structure of the BiOI and CMB composites with different mass ratios of CM, as displayed in Fig. 3a. The XRD pattern of BiOI shows five distinct diffraction peaks at 29.0°, 31.8°, 45.6°, 49.5° and 54.9°, which can be indexed to the (102), (110), (104), (114) and (212) diffraction planes.48 These main diffraction peaks of BiOI absolutely do not change in all the XRD patterns, indicating that BiOI is well crystallized during the fabrication process. For CMB-33, an obvious diffraction peak at 26.5° can be observed, which belonged to CM, confirming that the fabrication process does not destroy the main structure of both of the counterparts. Moreover, the peak of CM decreases in intensity gradually with increasing mass ratio of BiOI, and finally cannot be observed in the CMB-10 sample owing to the small content. In contrast, the diffraction peaks of BiOI exhibit a slight increase with increasing content.
FT-IR was performed to further investigate the phase structure of the as-prepared composites. As demonstrated in Fig. 3b, the strong band in the 1200–1600 cm−1 region of CMB-33 can be ascribed to typical stretching vibration modes of C–N and C![[double bond, length as m-dash]](https://www.rsc.org/images/entities/char_e001.gif) N heterocycles of g-C3N4. Additionally, the peak at 809 cm−1 is related to the characteristic breathing mode of triazine units, verifying the presence of g-C3N4.49 Furthermore, the FT-IR curve of BiOI is consistent with the literature, proving the existence of BiOI.37 Along with the XRD analysis, the results of FT-IR confirm that the main structure of both CM and BiOI is not destroyed after the combination through the preparation process.
N heterocycles of g-C3N4. Additionally, the peak at 809 cm−1 is related to the characteristic breathing mode of triazine units, verifying the presence of g-C3N4.49 Furthermore, the FT-IR curve of BiOI is consistent with the literature, proving the existence of BiOI.37 Along with the XRD analysis, the results of FT-IR confirm that the main structure of both CM and BiOI is not destroyed after the combination through the preparation process.
The morphology and structure were directly observed by SEM images, as presented in Fig. 4. CM keeps the appearance of MCNTs with a diameter range from 40 to 100 nm and a smooth surface indicating that the g-C3N4 is almost all inside the tubes, which also corresponds to the TEM images. With the mass ratio of CM reaching 33.3% and 20%, it can be observed that BiOI nanoparticles with a size of about 50 nm are deposited on the surface of CM uniformly with an intimate junction structure (Fig. 4b and c). With the mass ratio of CM decreasing to 10%, it is almost fully covered by BiOI particles. However, the tube-like skeleton can still be observed, as shown in Fig. 4d. For the CMB-5 sample, it exhibits a bulk-like morphology containing aggregated BiOI nanoparticles with CM inside (Fig. 4e). Besides, pure BiOI presents a plate morphology at a micron scale composed of nanoparticles, as presented in Fig. 4f. Therefore, it can be concluded that all the heterojunctions exhibit the coexistence of CM and BiOI.
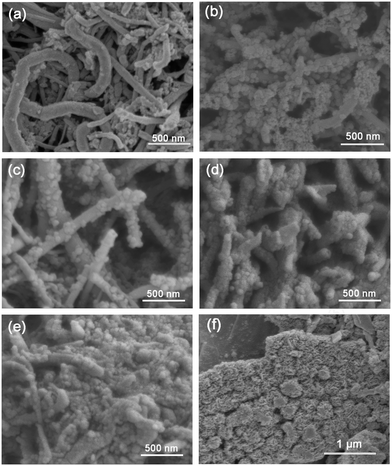 | ||
| Fig. 4 SEM images of the as-prepared samples: (a) CM, (b) CMB-33, (c) CMB-20, (d) CMB-10, (e) CMB-5 and (f) BiOI. | ||
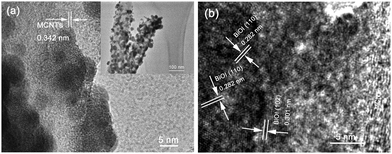
The morphology and structural details of the CMB composites were further investigated by TEM and HRTEM observations. As displayed in the insert TEM image of Fig. 5a, the MCNTs are filled with g-C3N4 which corresponds to the TEM images of CM (Fig. 2). Furthermore, the BiOI nanoparticles can also be observed to be uniformly loaded on the surface of CM with a size of around 50 nm coinciding with the results of the SEM images. An intimate interface between the BiOI particles and MCNTs was presented in the HRTEM images in Fig. 5a, suggesting an expectable efficient charge transfer. The lattice spacing of the MCNTs can be clearly observed and determined to be 0.342 nm, which is consistent with the XRD. As shown in Fig. 5b, the lattice spacing of BiOI can also be clearly observed and determined to be 0.282 nm and 0.301 nm, corresponding to the (110) facet and the (102) facet.48 The perfect crystalline quality and the clear interface between BiOI and CM would facilitate the separation of the photo-generated charge carriers.
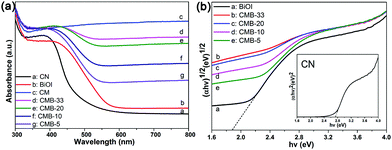
To reveal the light absorption properties of the as-prepared samples UV-vis diffuse reflectance spectra were recorded, as shown in Fig. 6a. CN holds an absorption edge at 480 nm, whereas CM exhibits strong absorption in the visible light region due to the perfect light absorption property of MCNTs. Meanwhile, the band edge wavelength of BiOI is located at 600 nm and has a clear red-shift after being combined with CM. Furthermore, the absorption edge of the CMB samples exhibits a gradual red-shift with the increase in CM content because of the interaction between both counterparts. The band gap energy can be calculated by the following equation:
| αhv ∼ (hv − Eg)(n/2)/hv | (1) |
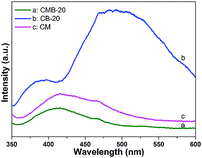
The observed PL emission peak is attributed to the radiative recombination process of self-trapped excitons, so a lower PL intensity indicates a better charge separation of photo-generated carriers which plays a crucial role in photocatalysis reactions.50 For comparison, PL spectra under the excitation wavelength of 325 nm of CM, CB-20 and CMB-20 were recorded.37 As presented in Fig. 7, CB-20 presents the highest intensity owing to the high recombination efficiency of photo-induced carriers of g-C3N4. However, CMB-20 has an emission peak located at 415 nm and shows obviously the lowest intensity, suggesting that the unique structure of CMB-20 would significantly facilitate the separation of photo-induced electrons and holes, which may further promote the photocatalytic activity.
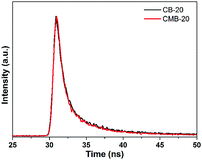
Furthermore, the time-resolved fluorescence decay spectra of CB-20 and CMB-20 were also recorded to understand the photophysical behaviors of photo-generated carriers, as shown in Fig. 8. The fluorescence intensities of both the samples decay exponentially. Fitting the decay spectrum shows three radiative lifetimes with different percentages.51 As given in Table 1, 38.33% of charge carriers in CMB-20 have the shortest lifetime of 0.98 ns, 38.9% of charge carriers have a medium lifetime of 4.1 ns and 22.77% of charge carriers have the longest lifetime of 20.7 ns. All of the three kinds of lifetime of charge carriers in CMB-20 are higher than that in CB-20. Besides, CMB-20 has a higher average charge carrier lifetime of 7.68 ns than that of 4.74 ns belonging to CB-20, indicating that the unique structure of CMB-20 can further inhibit recombination of photo-generated carriers compared with the normal heterojunction between g-C3N4 and BiOI.
| Sample | τ 1 [ns]–Rel (%) | τ 2 [ns]–Rel (%) | τ 3 [ns]–Rel (%) | Average [ns] |
|---|---|---|---|---|
| CB-20 | 0.76–33.74 | 3.46–47.59 | 15.17–18.67 | 4.74 |
| CMB-20 | 0.98–38.33 | 4.10–38.90 | 20.70–22.77 | 7.68 |
Fig. 9a shows the photocatalytic decolorization of methylene blue (MB) over various samples under visible light irradiation (λ > 420 nm), and the blank indicates that MB is stable under visible light irradiation if there is no photocatalyst present.52 The highest photocatalytic activity was obtained for CMB-20, over which about 70% MB can be decolorized. The photocatalytic decolorization kinetics of the as-prepared sample is fitted by a pseudo-first-order model, which is depicted by the following equation:53
| ln(C0/Ct) = kt | (2) |
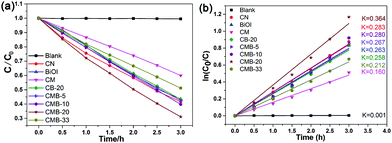 | ||
| Fig. 9 Photocatalysis analysis of the as-prepared samples: (a) photocatalytic decolorization of MB and (b) the corresponding kinetics. | ||
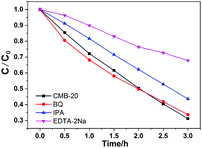
The DMPO spin-trapping ESR spectra were recorded to investigate the active radicals which were involved in the photocatalytic reaction.54 As displayed in Fig. 10, the characteristic signal of the ˙OH radicals can be apparently observed after visible-light irradiation confirming the formation of ˙OH. However, the characteristic signal of the O2˙− radical is hardly detected. Moreover, isopropanol (IPA, ˙OH quencher), benzoquinone (BQ, O2˙− quencher) and ethylenediamine teraacetic acid disodium salt (EDTA-2Na, h+ quencher) were introduced into the MB photocatalytic decolorization reaction system to elucidate the photocatalytic mechanism. As shown in Fig. 11, the decolorization of MB does not show any obvious change when BQ is added, suggesting that O2˙− is barely involved in the system. However, the decolorization of MB was inhibited significantly in the presence of EDTA-2Na. A certain decline in the degradation of MB was also detected when IPA is added, which also corresponds to the results of the ESR probe test. The results of the ESR probe test and trapping experiment suggest that the crucial reactive species is h+ rather than ˙OH, although both of them are generated during the reaction.
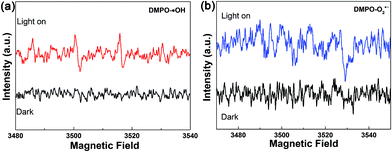 | ||
| Fig. 10 DMPO spin-trapping ESR spectra under visible light irradiation (>420 nm) for 300 s in (a) aqueous solutions for ˙OH and (b) methanol solutions for O2˙−. | ||
Furthermore, the energy band positions of the valence band (VB) and conduction band (CB) of g-C3N4 and BiOI were calculated based on the DRS spectra analysis according to the following formula:
| ECB = X − Ee − 1/2Eg | (3) |
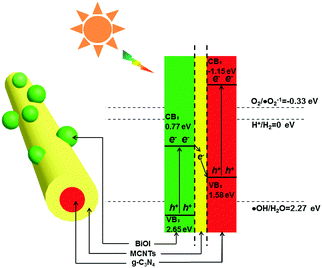 | ||
| Scheme 1 Electron–hole pair separation and transfer mechanism in the CMB photocatalyst under visible-light irradiation. | ||
4. Conclusions
In summary, it is demonstrated that MCNTs can be used as an electron mediator to construct a novel S–C–S Z-scheme photocatalyst. This unique nanostructure can promote the absorption of visible-light and result in low recombination efficiency of photo-generated electron–hole pairs through the Z-scheme transfer mechanism, thereby achieving enhanced photocatalytic activity compared with pure g-C3N4, BiOI and CB heterojunction structures. Moreover, this method using MCNTs as an electron mediator to construct Z-scheme heterojunctions may open up new avenues for the construction of other Z-scheme heterojunctions with excellent charge separation efficiency simultaneously with strong redox ability.Conflicts of interest
There are no conflicts to declare.Acknowledgements
This work is supported by The National Key Research and Development Program of China (No. 2016YFB0701100), and The Key Research and Development Program of Zhejiang Provence (No. 2017C01002).Notes and references
- A. J. Bard, Science, 1980, 207, 139–144 CAS.
- W. J. Ong, L. L. Tan, Y. H. Ng, S. T. Yong and S. P. Chai, Chem. Rev., 2016, 116, 7159–7329 CrossRef CAS PubMed.
- S. Cao, J. Low, J. Yu and M. Jaroniec, Adv. Mater., 2015, 27, 2150–2176 CrossRef CAS PubMed.
- R. Ye, H. Fang, Y. Zheng, N. Li, Y. Wang and X. Tao, ACS Appl. Mater. Interfaces, 2016, 8, 13879–13889 CAS.
- M. Li, L. Zhang, X. Fan, Y. Zhou, M. Wu and J. Shi, J. Mater. Chem. A, 2015, 3, 5189–5196 CAS.
- A. Iwase, Y. Ng, Y. Ishiguro, A. Kudo and R. Amal, J. Am. Chem. Soc., 2011, 133, 11054–11057 CrossRef CAS PubMed.
- Y. Sasaki, H. Nemoto, K. Saito and A. Kudo, J. Phys. Chem. C, 2009, 113, 17536–17542 CAS.
- Y. Yang, W. Guo, Y. Guo, Y. Zhao, X. Yuan and Y. Guo, J. Hazard. Mater., 2014, 271, 150–159 CrossRef CAS PubMed.
- F. Shi, L. Chen, M. Chen and D. Jiang, Chem. Commun., 2015, 51, 17144–17147 RSC.
- S. Wang, D. Li, C. Sun, S. Yang, Y. Guan and H. He, Appl. Catal., B, 2014, 144, 885–892 CrossRef CAS.
- S. B. Rawal, S. Bera, D. Lee, D. J. Jang and W. I. Lee, Catal. Sci. Technol., 2013, 3, 1822–1830 CAS.
- H. Kato, Y. Sasaki, N. Shirakura and A. Kudo, J. Mater. Chem. A, 2013, 1, 12327–12333 CAS.
- D. J. Martin, P. J. T. Reardon, S. J. A. Moniz and J. W. Tang, J. Am. Chem. Soc., 2014, 136, 12568–12571 CrossRef CAS PubMed.
- F. Chen, Q. Yang, J. Sun, F. Yao, S. Wang, Y. Wang, X. Wang, X. Li, C. Niu, D. Wang and G. Zeng, ACS Appl. Mater. Interfaces, 2016, 8, 32887–32900 CAS.
- Z. Yu, Y. Xie, G. Liu, G. Lu, X. Ma and H. Cheng, J. Mater. Chem. A, 2013, 1, 2773–2776 CAS.
- T. M. Suzuki, A. Iwase, H. Tanaka, S. Sato, A. Kudo and T. Morikawa, J. Mater. Chem. A, 2015, 3, 13283–13290 CAS.
- X. Wang, K. Maeda, A. Thomas, K. Takanabe, G. Xin, J. M. Carlsson, K. Domen and M. Antonietti, Nat. Mater., 2009, 8, 76–80 CrossRef CAS PubMed.
- J. Liu, Y. Liu, N. Liu, Y. Han, X. Zhang, H. Huang, Y. Lifshitz, S. Lee, J. Zhong and Z. Kang, Science, 2015, 347, 970–974 CrossRef CAS PubMed.
- Y. Zheng, J. Liu, J. Liang, M. Jaroniec and S. Qiao, Energy Environ. Sci., 2012, 5, 6717–6731 CAS.
- Y. Wang, X. Wang and M. Antonietti, Angew. Chem., Int. Ed., 2012, 51, 68–89 CrossRef CAS PubMed.
- Q. Liang, Z. Li, X. Yu, Z. H. Huang, F. Kang and Q. H. Yang, Adv. Mater., 2015, 27, 4634–4639 CrossRef CAS PubMed.
- S. Patnaik, S. Martha and K. M. Parida, RSC Adv., 2016, 6, 46929–46951 RSC.
- S. Patnaik, S. Martha, S. Acharya and K. M. Parida, Inorg. Chem. Front., 2016, 3, 336–347 RSC.
- S. Martha, A. Nashim and K. M. Parida, J. Mater. Chem. A, 2013, 1, 7816–7824 CAS.
- S. Samanta, S. Martha and K. M. Parida, ChemCatChem, 2014, 6, 1453–1462 CAS.
- S. Patnaik, S. Martha, G. Madras and K. M. Parida, Phys. Chem. Chem. Phys., 2016, 18, 28502–28514 RSC.
- Y. Tian, B. Chang, J. Lu, J. Fu, F. Xi and X. Dong, ACS Appl. Mater. Interfaces, 2013, 5, 7079–7085 CAS.
- B. Hu, F. Cai, T. Chen, M. Fan, C. Song, X. Yan and W. Shi, ACS Appl. Mater. Interfaces, 2015, 7, 18247–18256 CAS.
- J. Shen, H. Yang, Q. Shen, Y. Feng and Q. Cai, CrystEngComm, 2014, 16, 1868–1872 RSC.
- Y. Feng, J. Shen, Q. Cai, H. Yang and Q. Shen, New J. Chem., 2015, 39, 1132–1138 RSC.
- J. Zhang, Y. Wang, J. Jin, J. Zhang, Z. Lin, F. Huang and J. Yu, ACS Appl. Mater. Interfaces, 2013, 5, 10317–10324 CAS.
- S. Pany and K. M. Parida, Phys. Chem. Chem. Phys., 2015, 17, 8070–8077 RSC.
- S. Nayak, L. Mohapatra and K. M. Parida, J. Mater. Chem. A, 2015, 3, 18622–18635 CAS.
- Z. You, Y. Su, Y. Yu, H. Wang, T. Qin, F. Zhang, Q. Shen and H. Yang, Appl. Catal., B, 2017, 213, 127–135 CrossRef CAS.
- J. Wang, H. Yao, Z. Fan, L. Zhang, J. Wang, S. Zang and Z. Li, ACS Appl. Mater. Interfaces, 2016, 8, 3765–3775 CAS.
- Z. Liu, X. Xu, J. Fang, X. Zhu, J. Chu and B. Li, Appl. Surf. Sci., 2012, 258, 3771–3778 CrossRef CAS.
- D. Jiang, L. Chen, J. Zhu, M. Chen, W. Shi and J. Xie, Dalton Trans., 2013, 42, 15726–15734 RSC.
- K. Dai, L. Lu, C. Liang, G. Zhu, Q. Liu, L. Geng and J. He, Dalton Trans., 2015, 44, 7903–7910 RSC.
- D. Kandi, S. Martha, A. Thirumurugan and K. M. Parida, J. Phys. Chem. C, 2017, 121, 4834–4849 CAS.
- K. H. Reddy, S. Martha and K. M. Parida, Inorg. Chem., 2013, 52, 6390–6401 CrossRef CAS PubMed.
- X. Zhang, Z. Ai, F. Jia and L. Zhang, J. Phys. Chem. C, 2008, 112, 747–753 CAS.
- O. Akhavan, M. Abdolahad, Y. Abdi and S. Mohajerzadeh, Carbon, 2009, 47, 3280–3287 CrossRef CAS.
- L. Yue, S. Wang, G. Shan, W. Wu, L. Qiang and L. Zhu, Appl. Catal., B, 2015, 176, 11–19 CrossRef.
- H. Wang, J. Li, P. Huo, Y. Yan and Q. Guan, Appl. Surf. Sci., 2016, 366, 1–8 CrossRef CAS.
- L. Ge and C. Han, Appl. Catal., B, 2012, 117, 268–274 CrossRef.
- Y. Shang, X. Chen, W. Liu, P. Tan, H. Chen, L. Wu, C. Ma, X. Xiong and J. Pan, Appl. Catal., B, 2017, 204, 78–88 CrossRef CAS.
- J. Sun, J. Zhang, M. Zhang, M. Antoniett, X. Fu and X. Wang, Nat. Commun., 2012, 1139 CrossRef.
- J. Di., J. Xia, S. Yin, H. Xu, L. Xu, Y. Xu, M. He and H. Li, J. Mater. Chem. A, 2014, 2, 5340–5351 CAS.
- J. Gao, Y. Wang, S. Zhou, W. Lin and Y. Kong, ChemCatChem, 2017, 9, 1708–1715 CrossRef CAS.
- X. Yang, F. Qian, G. Zou, M. Li, J. Lu, Y. Li and M. Bao, Appl. Catal., B, 2016, 193, 22–35 CrossRef CAS.
- P. Niu, L. Zhang, G. Liu and H. Chen, Adv. Funct. Mater., 2012, 22, 4763–4770 CrossRef CAS.
- Z. Jin, W. Dong, M. Yang, J. Wang, H. Gao and G. Wang, ChemCatChem, 2016, 8, 3510–3517 CrossRef CAS.
- X. Zhang, Y. Xu, Q. Shen, B. Fan, X. Qiao, X. Fan, H. Yang, Q. Luo, L. Calvez, H. Ma, M. Cathelinaud and J. J. Simon, J. Mater. Chem. A, 2014, 2, 17099–17106 CAS.
- Y. Li, K. Lv, W. Ho, F. Dong, X. Wu and Y. Xia, Appl. Catal., B, 2017, 202, 611–619 CrossRef CAS.
| This journal is © The Royal Society of Chemistry and the Centre National de la Recherche Scientifique 2018 |

