
Construction of hierarchical Ag@TiO2@ZnO nanowires with high photocatalytic activity†
Xiao-Bo
Xiang
ab,
Yang
Yu
ab,
Wei
Wen
 ac and
Jin-Ming
Wu
*ab
ac and
Jin-Ming
Wu
*ab
aState Key Laboratory of Silicon Materials, Zhejiang University, Hangzhou 310027, P. R. China. E-mail: msewjm@zju.edu.cn; Fax: +86-571-87952358; Tel: +86-571-87952358
bSchool of Materials Science and Engineering, Zhejiang University, Hangzhou 310027, P. R. China
cCollege of Mechanical and Electrical Engineering, Hainan University, Haikou 570228, P. R. China
First published on 15th November 2017
Abstract
Noble metal loading and semiconductor compositing are two effective techniques to improve the photocatalytic activity of semiconductor photocatalysts. These two tactics are combined herein to achieve hierarchical Ag@TiO2@ZnO nanowires, which consist of ZnO nanorods growing radially from Ag nanowires with the help of a compact TiO2 intermediate layer. The Ag@TiO2@ZnO nanowires consisted of 4.3 wt% Ag, 16.7 wt% TiO2 and 79.0 wt% ZnO. When utilized to assist photodegradation of phenol in water under UV light illumination, the nanowires exhibited a reaction rate constant 1.8 times that of commercial Degussa P25 TiO2 nanoparticles and 3.8 times that of commercial ZnO nanoparticles. The excellent photocatalytic activity can be contributed to the enhanced light adsorption and charge separations arising from both Ag/TiO2 Schottky barriers and TiO2/ZnO heterojunctions.
1. Introduction
Semiconductor photocatalysis is an effective tool to tackle energy and environmental problems. As two widely studied photocatalysts, ZnO and TiO2 are quite promising owing to their nontoxicity, wide availability and low cost.1,2 TiO2 exhibits high stability under light illumination, while ZnO is prone to photo-corrosion particularly under UV light illumination. They both exhibit insufficient photocatalytic activity because of the easy recombinations of photogenerated charges.3,4Tailoring the nanostructures is an efficient method to improve photocatalytic performances.5,6 One-dimensional (1D) nanowires have emerged as a good choice because of their highly accessible surface and relatively high electron mobility.7,8 Imposing branches on the surface of nanowires to form branched nanowires further increases the specific surface area, leading to more active sites and enhanced light harvesting capability.9,10
The introduction of noble metals such as Au and Ag to semiconductor photocatalysts is another effective approach to improve photocatalytic activity because of the existence of Schottky junctions and the so-called localized surface plasmon resonance (LSPR) effect.11–13 The Schottky junction that forms at the metal–semiconductor interface can effectively hinder the recombination of photogenerated electron–hole pairs, while the LSPR allows more photons to be absorbed, thus enhancing the photocatalytic performance. Silver is a good candidate because of the relatively low cost and high electrical conductivity.14,15 Usually, 1D TiO216 or ZnO17 is decorated with Ag nanoparticles to improve the photocatalytic performance. A few studies reported the homogeneous coating of compact TiO2 nanoparticles or ZnO nanorods on Ag nanowires to form Ag@TiO2 or Ag@ZnO core–shell structures, which exhibit additional advantages of protecting Ag from oxidation.18–20
Coupling of TiO2 and ZnO is also reported to achieve an enhanced charge separation rate because of the formation of TiO2/ZnO heterojunctions.21 In this study, we attempt to combine the merits of the 1D nanostructure, noble metal loading, and semiconductor compositing. A composite photocatalyst of Ag@TiO2@ZnO with a hierarchical nanowire structure was synthesized by a stepwise hydrothermal treatment. Thanks to the improved light harvesting and charge separation arising from the unique 1D hierarchical nanostructure and the synergetic effects of the Ag/TiO2 Schottky barriers and TiO2/ZnO heterojunctions, the hierarchical Ag@TiO2@ZnO nanowires exhibited a reaction rate constant 1.8 times that of commercial Degussa P25 TiO2 nanoparticles and 3.8 times that of commercial ZnO nanoparticles when utilized to assist photodegradation of phenol in water under the UV light illumination.
2. Experimental
Fig. 1 illustrates schematically the synthesis of the hierarchical Ag@TiO2@ZnO nanowires. Ag nanowires were first coated homogeneously with a compact TiO2 intermediate layer through a hydrothermal approach, onto which ZnO seeds and nanorods were precipitated in sequence to afford composite nanowires.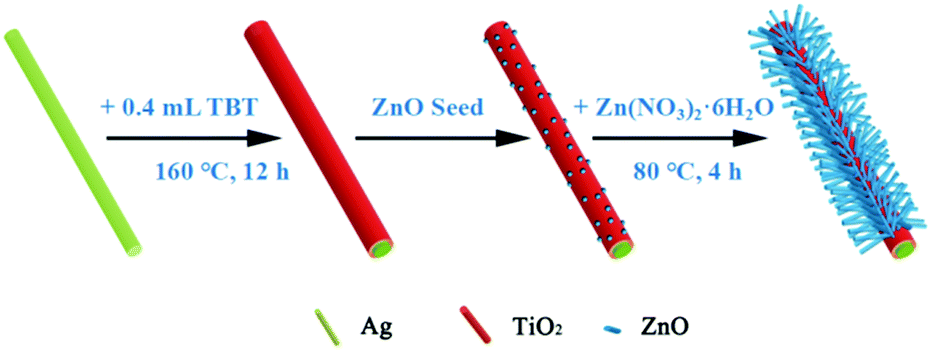 | ||
| Fig. 1 A schematic diagram showing the formation procedure of the hierarchical Ag@TiO2@ZnO nanowire. | ||
2.1 Synthesis of Ag nanowires
In a typical synthesis of Ag nanowires,22 2.93 g polyvinyl pyrrolidone (PVP, K30) was added into 95 mL glycerol with vigorous stirring at 90 °C for 2 h to form a clear solution. After cooling to 50 °C, 0.79 g AgNO3 was added into the solution, followed by the addition of a mixed solution of 29.5 mg NaCl, 0.25 mL H2O and 5 mL glycerol. The bath temperature was increased to 210 °C with stirring and maintained for ca. 40 min. The grey precipitates were then collected by natural sedimentation with the addition of deionized water. On further separation and purification, Ag nanowires with diameter ca. 50–100 nm were obtained, which were dispersed in absolute ethanol for further treatment.2.2 Synthesis of Ag@TiO2 nanowires
Initially, 100 mg Ag nanowires and 5 mg PVP (K30) were dispersed in 40 mL of absolute ethanol under magnetic stirring for 10 min, into which 0.4 mL tetrabutyl titanate (TBT) and 0.6 mL deionized water were injected dropwise. After further stirring for 30 min and sequent centrifugation, the obtained powder was transferred to 10 mL deionized water in an autoclave, which was maintained at 160 °C for 12 h.18 After the hydrothermal reaction, the powders were collected, thoroughly washed by deionized water and dried in air.2.3 Synthesis of Ag@TiO2@ZnO nanowires
A ZnO sol was prepared following the method described by Pacholski et al.23 In a typical process, 68.5 mg zinc acetate was added to 31.5 mL methanol to achieve complete dissolution. Then, 27.5 mg KOH was dissolved in 16.5 mL methanol, which was injected into the solution at 60 °C under magnetic stirring for 2 h to achieve the homogenous ZnO sol.Ag@TiO2 powders (25 mg) were dispersed in the ZnO sol under stirring for 2 h, which was then centrifuged and re-dispersed in 5 mL deionized water. Subsequently, the Ag@TiO2 slurry with ZnO seeds was transferred to 25 mL deionized water, into which 0.178 g Zn(NO3)2·6H2O and 0.084 g hexamethylenetetramine (HMT) were added. The reactant was kept at 80 °C under vigorous stirring for 4 h. The powders were then collected and dried in air for further characterizations.
2.4 Characterizations
The surface morphology of powders was observed using a field emission scanning electron microscope (FESEM, Hitachi S-4800) and a transmission electron microscope (TEM, FEI, Tecnai G2 F20 S-TWIN, with EDS capabilities). For TEM characterizations, Ag@TiO2@ZnO powders were dispersed in absolute ethanol and then placed on a carbon pre-coated copper grid. The X-ray diffraction (XRD) tests were conducted on a Rigaku D/max-3B diffractometer with Cu Kα radiation (λ = 0.154056 nm), operated at 40 kV, 36 mA. The atomic ratio of Ag, Ti and Zn was measured using an inductively coupled plasma mass spectrometer (ICP-MS, X Series II, Thermo Fisher Scientific, USA). For the ICP-MS measurements, the Ag@TiO2@ZnO powders were dissolved in aqua regia. The X-ray photoelectron spectroscopy (XPS) spectra were recorded using an ESCA spectrometer (S-Probe ESCA SSX-100S, Fisons Instrument) with Al Kα X-ray irradiation (1486.8 eV). The binding energies were calibrated using the binding energy of containment C 1s (284.6 eV). The UV-Vis diffuse reflectance absorption spectra were recorded using a UV-Vis near-infrared spectrometer (UV-3150, Shimadzu). The specific surface area data were calculated using Brunauer–Emmett–Teller (BET) models with low-temperature nitrogen adsorption–desorption isotherms recorded by autosorb-1-C (Quantachrome Instruments, USA) at 77 K.2.5 Photocatalytic activity evaluations
Phenol in water with an initial concentration of 10 ppm was utilized as a target molecule for the photocatalytic evaluations, which were conducted in a Pyrex reactor with a water jacket. For each run, 10 mg photocatalysts were dispersed into 50 mL solutions. The UV light was provided by an 18 W UV lamp and the light intensity was measured to be ca. 5.0 mW cm−2 (Model: UV-A, Beijing Normal University, China). The solution was stirred and exposed to air during the photocatalytic reaction. The change in the phenol concentration was monitored by Liquid Chromatography (C18-ODS column, 700![[thin space (1/6-em)]](https://www.rsc.org/images/entities/char_2009.gif) :300:1 methanol, water and acetic acid, 280 nm). Moreover, the active species trapping experiments were conducted using the same procedure as the aforementioned photodegradation reaction by adding 1 mM ethylene diaminetetraacetic acid disodium (EDTA-2Na, a quencher of h+), 0.05 mM N,N-dimethyl-4-nitrosoaniline (RNO, a quencher of ˙OH) and 1 mM KBrO3 (a quencher of e−), respectively.
:300:1 methanol, water and acetic acid, 280 nm). Moreover, the active species trapping experiments were conducted using the same procedure as the aforementioned photodegradation reaction by adding 1 mM ethylene diaminetetraacetic acid disodium (EDTA-2Na, a quencher of h+), 0.05 mM N,N-dimethyl-4-nitrosoaniline (RNO, a quencher of ˙OH) and 1 mM KBrO3 (a quencher of e−), respectively.
3. Results and discussion
Fig. 2 shows the morphologies of the as-prepared Ag nanowires and those after coating with TiO2 and ZnO. Fig. 2a and b indicate that the Ag nanowires are tens of micrometers in length with an average diameter of ca. 75 nm. After coating with TiO2 nanoparticles homogeneously, the diameter of Ag@TiO2 nanowires increased to ca. 250 nm and the surface became much rougher (Fig. 2c and d). After the ZnO precipitation, nanorods could be observed aligning radially around the Ag@TiO2 nanowires (Fig. 2e and f). | ||
| Fig. 2 FESEM images of the (a and b) Ag nanowires, (c and d) Ag@TiO2 nanowires and (e and f) Ag@TiO2@ZnO nanowires. | ||
The hierarchical Ag@TiO2@ZnO nanowire was characterized in detail by TEM observations. The low magnified TEM image clearly shows that a typical hierarchical nanowire consists of a trunk of Ag@TiO2 core–shell nanowires and large amounts of ZnO nanorod branches (Fig. 3a). The average diameter of ZnO nanorods radially growing along the Ag@TiO2 nanowire is ca. 15 nm and the length is ca. 300 nm. The corresponding HRTEM images (Fig. 3b–d) exhibit a lattice spacing of 0.204 nm, 0.243 nm and 0.251 nm, which correspond to the (200) plane of Ag, the (103) plane of anatase and the (101) plane of ZnO, respectively. The three phases formed close contacts, which allows for electronic interactions among Ag, TiO2, and ZnO, and in turn enhances the charge separation and the photocatalytic activity.24Fig. 3d also shows that an isolated ZnO nanorod is a single crystallite, which is beneficial to electron migration.20 The selected area electron diffraction (SAED) image (inset in Fig. 3a) demonstrates the multi-rings characteristic of a mixture of Ag, anatase TiO2 and ZnO. Fig. 3e shows the energy-dispersive X-ray spectra (EDX) mapping results, which clearly support the core–shell Ag@TiO2@ZnO structure. The ICP-MS measurement reveals that the Ag@TiO2@ZnO nanowires consisted of 4.3 wt% Ag, 16.7 wt% TiO2 and 79.0 wt% ZnO.
 | ||
| Fig. 3 (a) TEM image of the hierarchical Ag@TiO2@ZnO nanowire and the corresponding SAED pattern (the inset); HRTEM images showing the (b) Ag core, (c) TiO2 intermediate layer, and (d) ZnO branch; (e) the elemental mapping shows the Ag core, TiO2 intermediate layer and ZnO shell. | ||
The crystal structure of the Ag@TiO2@ZnO nanowires can be further verified with the XRD pattern. For comparison, the XRD patterns of Ag and Ag@TiO2 nanowires are also illustrated in Fig. 4. The Ag nanowires can be indexed to the face-center cubic (fcc) silver with high crystallinity.19 The peaks of anatase TiO2 appeared in the XRD pattern of Ag@TiO2, indicating that the Ag nanowire was surrounded by anatase nanoparticles after a hydrothermal process. The nanorods in the Ag@TiO2@ZnO nanowires can be assigned to the wurtize ZnO.
 | ||
| Fig. 4 XRD patterns of the Ag, Ag@TiO2 and Ag@TiO2@ZnO nanowires. | ||
The surface composition and chemical states of the Ag@TiO2@ZnO nanowires were also investigated using XPS analysis. Except the containment C, the wide scan spectrum shows elements of Ag, Ti, Zn and O (Fig. 5a). The atomic ratio of Ag:Ti:Zn was estimated to be 1.9:26.3:71.8. The weight ratio of Ag:TiO2:ZnO is thus calculated to be 2.5:25.4:72.1, which is in accordance with the ICP-MS measurement (4.3:16.7:79.0). The difference in the weight ratio can be attributed to the fact that XPS collects signals only from the surface. Fig. 5b shows two peaks located at 373.7 eV and 367.7 eV, with a split of 6.0 eV, for the Ag 3d spectrum, which can be ascribed to the 3d3/2 and 3d5/2 of metallic silver (Ag0).14,17 The binding energy of Ag 3d5/2 for the Ag@TiO2@ZnO (367.7 eV) shifts remarkably to a lower value when compared with the standard binding energy of pure metallic Ag, which is 368.2 eV.12,17 This suggests the interaction between Ag and semiconductor nanocrystals, that is, electrons transfer from TiO2 and ZnO to Ag and accumulate above the Fermi level of the metallic Ag nanowires, leading to lower binding energy.12 Two minor peaks located at 374.8 eV and 368.8 eV, with a split of also 6.0 eV, can also be discerned, suggesting the existence of minor amount of Ag(I) in the nanowires.25 For Ti 2p, the doublet peaks corresponding to Ti 2p1/2 and Ti 2p3/2 are recorded at 464.6 eV and 458.9 eV, respectively (Fig. 5c). These two peaks with a split of 5.7 eV are typical of Ti(IV) in TiO2.14 The binding energy band of Ti 2p3/2 (458.9 eV) shifts to a higher position than that of standard Ti4+ (458.5 eV), which indicates a lower electron density of the Ti atoms in the Ag@TiO2@ZnO materials because of the abovementioned electron transfer. For Zn 2p, the peaks located at 1045.4 eV and 1022.4 eV are assigned to Zn 2p1/2 and Zn 2p3/2, respectively, and the binding energy distance between the doublet peaks is around 23.0 eV (Fig. 5d), suggesting the existence of Zn species in the chemical state of Zn2+.26,27 The O 1s profile can be fitted by two symmetrical peaks located at 532.1 eV and 530.1 eV. The peak located at 530.1 eV can be attributed to the lattice oxygen in both TiO210 and ZnO,28 and that located at 532.1 eV can be ascribed to the oxygen of chemisorbed water molecules27 and hydroxyl on the surface of the oxides.28
 | ||
| Fig. 5 (a) Wide scan XPS spectrum and high resolution spectra of (b) Ag 3d, (c) Ti 2p, (d) Zn 2p and (e) O 1s core levels for Ag@TiO2@ZnO nanowires. | ||
Fig. 6 shows the UV-Vis diffuse reflectance absorption spectra of P25, Ag@TiO2 and Ag@TiO2@ZnO nanowires. It can be clearly observed that P25 showed strong absorption in the UV region with an absorption edge at around 400 nm.29 For Ag@TiO2 and Ag@TiO2@ZnO nanowires, much enhanced absorption in the visible region can be discerned, which can be attributed to the surface plasmon resonance arising from Ag nanowires.30 A strong resonance oscillation of the metal's surface free electrons occurs when the frequency of the incident photons matches that of the oscillating surface electrons, which transfers the energy of photons to electrons, forming surface plasmons; as a result, the optical response of the Ag-containing specimens in the visible light region is enhanced.31 When compared with Ag@TiO2 nanowires, the absorption of Ag@TiO2@ZnO nanowires increases in the UV region. This suggests that the Ag@TiO2@ZnO nanowires are likely to utilize the UV light more efficiently during the photocatalytic reactions.
 | ||
| Fig. 6 UV-Vis diffuse reflectance absorption spectra of the P25, Ag@TiO2 and Ag@TiO2@ZnO nanowires. | ||
Fig. 7a shows the photodegradation curves of phenol in water under UV light illumination, in the presence of various nanowires of Ag, Ag@TiO2, Ag@ZnO and Ag@TiO2@ZnO. The Ag@ZnO nanowires were synthesized using a method similar to that for Ag@TiO2@ZnO nanowires except that pure Ag nanowires were utilized directly instead of coating with TiO2 nanoparticles (refer to Fig. S1 in the ESI† for the FESEM morphology). In addition, the photodegradation curves assisted by commercial ZnO nanoparticles (30 ± 10 nm, 99.9%, Aladdin), and Degussa P25 TiO2 nanoparticles are demonstrated, which are commonly adopted benchmarks for photocatalysis. The BET specific surface area of Ag@TiO2@ZnO nanowires was evaluated to be 48.3 m2 g−1 (refer to Fig. S2, ESI† for the low temperature N2 adsorption–desorption isotherm curve), which is close to that of P25 TiO2 nanoparticles (ca. 50 m2 g−1).32
 | ||
| Fig. 7 (a) Photodegradation curves and (b) the corresponding fitting results assuming a pseudo first order reaction of phenol in water in the presence of ZnO, P25, and nanowires of Ag, Ag@TiO2, Ag@ZnO and hierarchical Ag@TiO2@ZnO under the UV light illumination. The cycling performance of the Ag@TiO2@ZnO nanowire is illustrated in (c). Initial phenol concentration: 10 ppm; UV light intensity: 5.0 mW cm−2. | ||
All the reaction kinetics can be fitted assuming a pseudo first order reaction,33,34 where c0 and c are the phenol concentrations just after the balanced dark absorption and that after reaction time t, respectively, and k is the reaction rate constant, which can be obtained by the slope of the fitting lines through origin. The corresponding fitting result is shown in Fig. 7b. The Ag nanowires induced almost no phenol degradations under the UV light illumination. The TiO2 coating on the Ag nanowires achieved a reaction rate constant of 0.00136 min−1. Further precipitation of ZnO nanorods increased the reaction rate constant significantly to 0.046 min−1, which is nearly 1.84 times that of P25 (0.025 min−1), and 3.83 times than that of commercial ZnO nanoparticles (0.012 min−1). The reaction rate constant is also 1.27 times that of Ag@ZnO nanowires (0.036 min−1).
Fig. 7c shows the cycling performance of the Ag@TiO2@ZnO nanowires. The degradation efficiency did not decrease significantly after 6 cycles, suggesting that Ag@TiO2@ZnO nanowire was fairly stable and resistant to photo-corrosion.
The trapping experiments were conducted to explore the main active species of the Ag@TiO2@ZnO nanowires in the photodegradation reaction (Fig. 8). Briefly, 0.05 mM N,N-dimethyl-4-nitrosoaniline(RNO), 1 mM KBrO3 and 1 mM ethylene diaminetetraacetic acid disodium (EDTA-2Na) were utilized to capture hydroxyl radicals (˙OH),35 electrons (e−),36 and holes (h+)37 in the photodegradation of phenol in water, respectively. In the presence of EDTA-2Na, the photodegradation of phenol was remarkably reduced, removing only 18% phenol in water after UV light illumination for 90 min. The additives of RNO and KBrO3 only slightly reduced the performance of Ag@TiO2@ZnO. Thus, it can be concluded that photogenerated holes are the main species responsible for the photodegradation process.
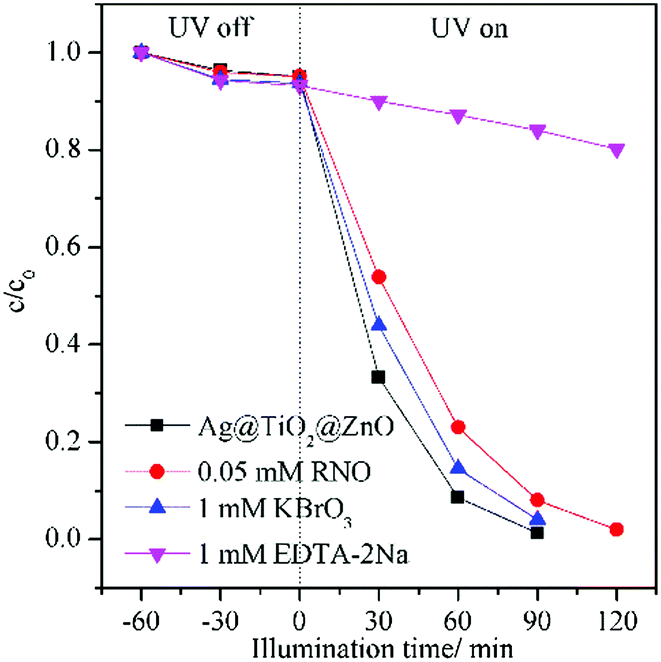 | ||
| Fig. 8 Effects of the RNO, KBrO3, EDTA-2Na additives on photodegradation of phenol in water in the presence of the Ag@TiO2@ZnO nanowires under the UV light irradiation. Initial phenol concentration: 10 ppm; UV light intensity: 5.0 mW cm−2. | ||
We propose a feasible band structure model to rationalize the enhanced photocatalytic performance of the present hierarchical Ag@TiO2@ZnO nanowires (Fig. 9). According to the reported data, the work function of Ag is ca. 4.26 to 4.7 eV,31 depending on the preparation method, crystallinity, testing conditions and so on. For the same token, the band structure of TiO2 and ZnO is also affected by many factors. The electron affinity (χ2) is 4.2 eV for TiO238,39 and 4.0 eV for ZnO.38 The valence band maximum (VB) is −7.4 eV for TiO238 and −7.2 eV for ZnO.40 TiO2 exhibits a work function of 4.50 eV to 4.66 eV,39 and that of ZnO is 4.3 eV,41 4.45 eV42 and 5.2 eV,43,44 which determines the Fermi level of TiO2 and ZnO.
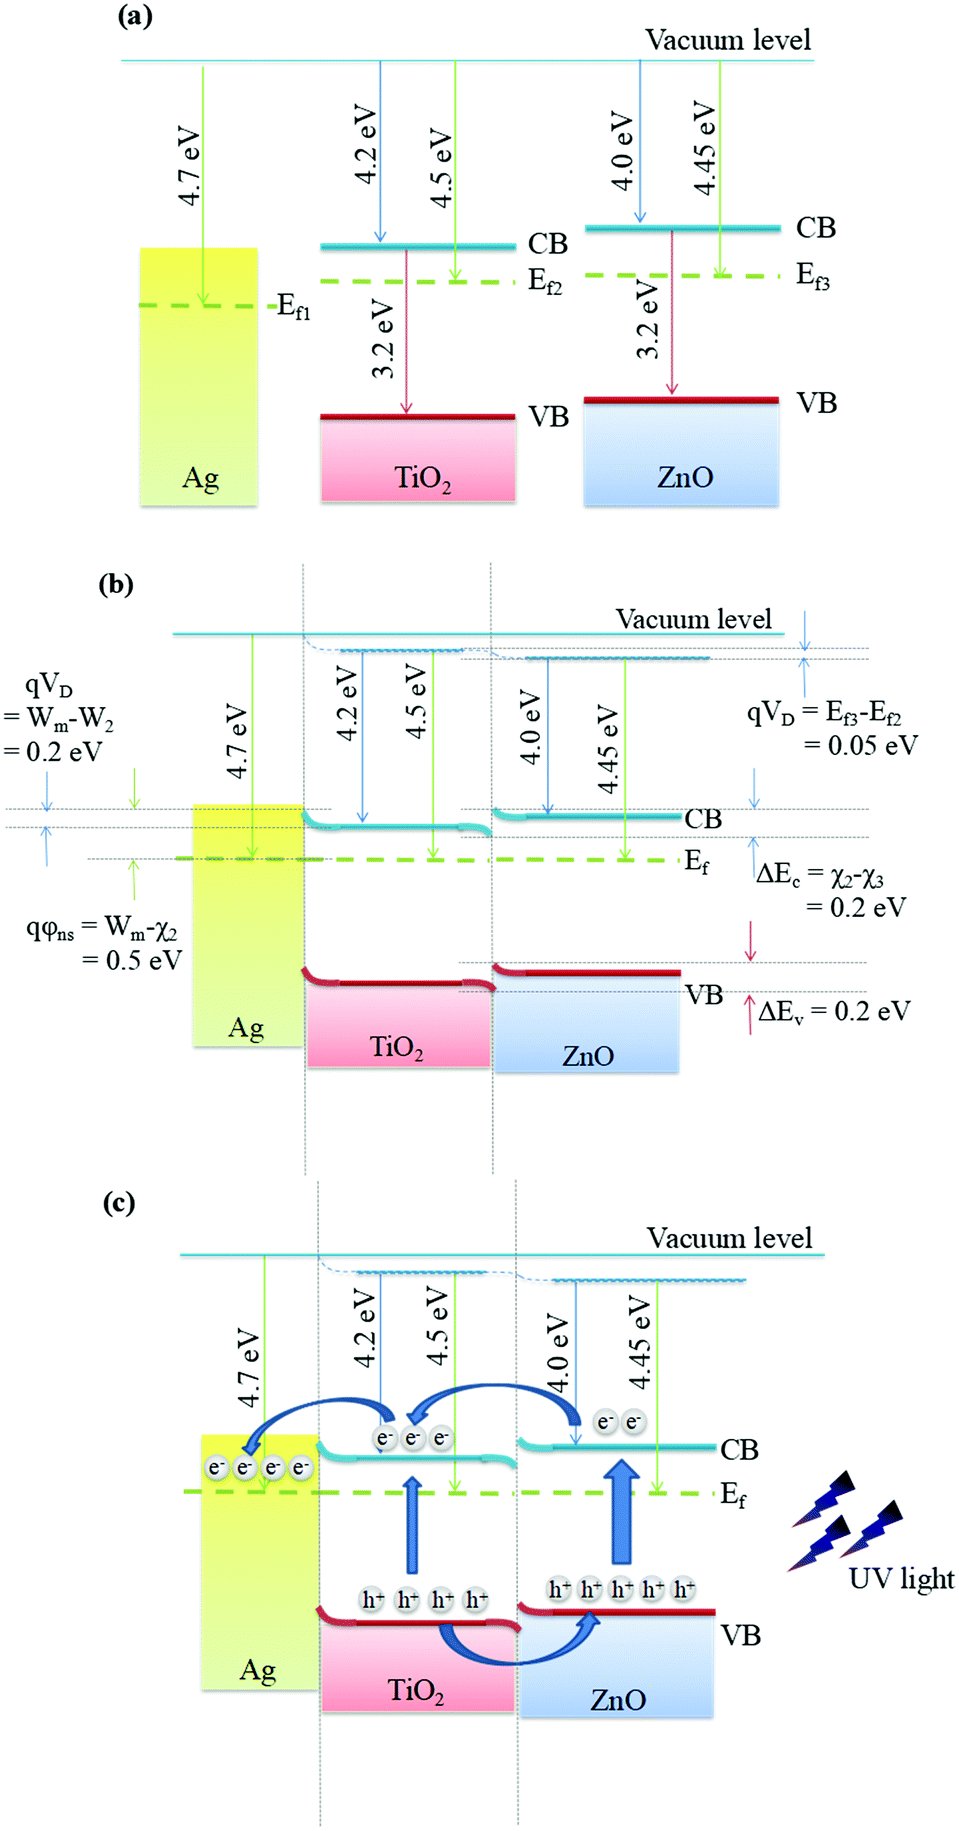 | ||
| Fig. 9 Schematic diagram of the band alignment of Ag@TiO2@ZnO (a) before contact, (b) after contact in an ideal situation and (c) under UV light irradiation. | ||
As shown in Fig. 9a, before contact, it is assumed that Ag (Wm = 4.7 eV) exhibits a slightly lower Fermi level as compared to TiO2 (W2 = 4.50 eV), and TiO2 exhibits a lower Fermi level as compared to ZnO (W3 = 4.45 eV). When Ag is in ideal contact with TiO2, the Fermi level of TiO2 should shift to locate at the same energy level as that of Ag, leading to the formation of a Schottky barrier and band bending near the Ag@TiO2 interface as shown in Fig. 9b. As a result, the expected Schottky barrier height (qφns) is 0.5 eV. Simultaneously, a heterojunction would form between TiO2 and ZnO when brought in close contact. The carriers would transfer until the Ag@TiO2@ZnO nanowires reach a uniform Fermi level, for which a new thermodynamic equilibrium is established (Fig. 9b). This band alignment is in accordance with the XPS results, which shows that the binding energy of Ag shifts negatively, while those of Ti and Zn shift positively (Fig. 5).
When the Ag@TiO2@ZnO nanowires are irradiated with UV light, as shown in Fig. 9c, the electrons in the VB of ZnO are excited to the conduction band (CB), leaving equal quantities of holes in the VB. The TiO2 nanoparticles would also produce photo-induced electrons because they also have opportunities to be exposed to UV light. On one hand, since the CB of ZnO is higher than TiO2 and the CB of TiO2 is higher than the Fermi level of Ag, the photo-excited electrons can transfer from ZnO to TiO2 and then from TiO2 to Ag. On the other hand, the holes can migrate from the VB of TiO2 to the VB of ZnO since the VB of ZnO is slightly higher than TiO2. Hence, the holes would accumulate on the outer ZnO nanorods of Ag@TiO2@ZnO nanowires to initiate the photodegradation of phenol through active ˙OH radicals, which is in line with the trapping experiments, revealing that the holes play an important part in the photodegradation reaction.
It is well established that the heterojunction between TiO2 and ZnO inhibits the charge recombination and results in a longer lifetime of photo-generated electron–hole pairs. For pure TiO2 or ZnO, these photoinduced electrons and holes readily recombine within nanoseconds.45 It is reported that the presence of TiO2/ZnO heterojunctions inhibits the recombination of photoinduced electron–hole charge carriers.21,46 The holes can take part in the degradation directly or react with a hydroxyl group to produce the hydroxyl radical (˙OH). Moreover, the electrons can reduce O2 to form superoxide ions (O2−), which are also responsible for the degradation of the pollutants in the photocatalytic reaction. In the current investigation, however, such a photoelectron-initiated path is less effective as the capture of electrons only slightly reduced the degradation rate (Fig. 8). It should be noted that the abundant surface oxygen deficiencies, as shown in Fig. 5e, also contribute to the charge separations via capturing photogenerated electrons.46
Silver nanowires act as electron traps, decreasing the recombination rate of photoinduced electrons and holes.30 Simultaneously, Ag nanowires act as fast electron transfer channels.47 This further contributes to the enhanced charge separation and hence more photogenerated holes could be involved in the photocatalytic reaction.
The excellent photocatalytic performance of the present hierarchical Ag@TiO2@ZnO nanowires can thus be summarized as follows. On one hand, the hierarchical structure endows the catalysts with a larger specific surface area and more accessible active sites for improved light harvesting as well as enhanced diffusion and absorption of target molecules. On the other hand, the Ag@TiO2@ZnO composite exhibits superior enhancement in the intensity and range of light absorption according to the UV-Vis diffuse reflectance absorption spectra (Fig. 5). Moreover, TiO2/ZnO heterojunctions and Ag/TiO2 Schottky barriers (Fig. 9) efficiently enhanced the separation of photoinduced electron/hole pairs.
4. Conclusions
In summary, a novel hierarchical Ag@TiO2@ZnO composite nanowire was synthesized by a stepwise hydrothermal method. ZnO nanorods grew radially along the TiO2-coated Ag nanowires. The ICP-MS measurement revealed that the Ag@TiO2@ZnO nanowires consisted of 4.3 wt% Ag, 16.7 wt% TiO2 and 79.0 wt% ZnO. When utilized to assist photodegradation of phenol in water under the UV light illumination, the reaction rate constant was 1.84 times than that of P25, and 3.83 times than that of ZnO nanoparticles. The much enhanced photocatalytic activity can be attributed to the increased light absorption and the enhanced charge separation arising from the synergetic effects of heterojunctions between TiO2/ZnO and noble metal loading (Ag/TiO2).Conflicts of interest
There are no conflicts to declare.Acknowledgements
We are grateful for financial support from the National Natural Science Foundation of China (No. 51502065), Department of Science and Technology of Zhejiang Province under Contract No. 2015C31034, and State Key Laboratory of Silicon Materials (No. SKL2016-12).Notes and references
- Y. Hong, C. G. Tian, B. J. Jiang, A. P. Wu, Q. Zhang, G. H. Tian and H. G. Fu, J. Mater. Chem. A, 2013, 1, 5700 CAS.
- J. Jitputti, Y. Suzuki and S. Yoshikawa, Catal. Commun., 2008, 9, 1265 CrossRef CAS.
- L. Lin, Y. C. Yang, L. Men, X. Wang, D. N. He, Y. C. Chai, B. Zhao, S. Ghoshroy and Q. W. Tang, Nanoscale, 2013, 5, 588 RSC.
- Y. Ma, X. L. Wang, Y. S. Jia, X. B. Chen, H. X. Han and C. Li, Chem. Rev., 2014, 114, 9987 CrossRef CAS PubMed.
- F. Ahmed, N. Arshi, M. S. Anwar, R. Danish and B. H. Koo, RSC Adv., 2014, 4, 29249 RSC.
- J. Bai and B. X. Zhou, Chem. Rev., 2014, 114, 10131 CrossRef CAS PubMed.
- X. D. Wang, Z. D. Li, J. Shi and Y. H. Yu, Chem. Rev., 2014, 114, 9346 CrossRef CAS PubMed.
- K. Shankar, J. I. Basham, N. K. Allam, O. K. Varghese, G. K. Mor, X. J. Feng, M. Paulose, J. A. Seabold, K. S. Choi and C. A. Grimes, J. Phys. Chem. C, 2009, 113, 6327 CAS.
- I. S. Cho, Z. B. Chen, A. J. Forman, D. R. Kim, P. M. Rao, T. F. Jaramillo and X. L. Zheng, Nano Lett., 2011, 11, 4978 CrossRef CAS PubMed.
- J. M. Wu and J. X. Yin, RSC Adv., 2015, 5, 3465 RSC.
- H. L. Wang, L. S. Zhang, Z. G. Chen, J. Q. Hu, S. J. Li, Z. H. Wang, J. S. Liu and X. C. Wang, Chem. Soc. Rev., 2014, 43, 5234 RSC.
- Y. H. Zheng, L. R. Zheng, Y. Y. Zhan, X. Y. Lin, Q. Zheng and K. M. Wei, Inorg. Chem., 2007, 46, 6980 CrossRef CAS PubMed.
- Y. Yu, W. Wen, X. Y. Qian, J. B. Liu and J. M. Wu, Sci. Rep., 2017, 7, 41253 CrossRef CAS PubMed.
- D. H. Yu, X. D. Yu, C. H. Wang, X. C. Liu and Y. Xing, ACS Appl. Mater. Interfaces, 2012, 4, 2781 CAS.
- J. B. Fei and J. B. Li, Adv. Mater., 2015, 27, 314 CrossRef CAS PubMed.
- Y. C. Liang, C. C. Wang, C. C. Kei, Y. C. Hsueh, W. H. Cho and T. P. Perng, J. Phys. Chem. C, 2011, 115, 9498 CAS.
- D. D. Lin, H. Wu, R. Zhang and W. Pan, Chem. Mater., 2009, 21, 3479 CrossRef CAS.
- Q. S. Dong, H. C. Yu, Z. B. Jiao, G. X. Lu and Y. P. Bi, RSC Adv., 2014, 4, 59114 RSC.
- F. Li, K. Liu, Y. L. Zhao, Y. Y. Cao, Z. Q. Li, H. T. Xu, H. B. Zhang, Y. C. Guo and H. S. Qian, J. Mater. Sci.: Mater. Electron., 2015, 26, 5753 CrossRef CAS.
- S. W. Wang, Y. Yu, Y. H. Zuo, C. Z. Li, J. H. Yang and C. H. Lu, Nanoscale, 2012, 4, 5895 RSC.
- R. H. Tao, J. M. Wu, J. Z. Xiao, Y. P. Zhao, W. W. Dong and X. D. Fang, Appl. Surf. Sci., 2013, 279, 324 CrossRef CAS.
- C. Yang, H. W. Gu, W. Lin, M. M. Yuen, C. P. Wong, M. Y. Xiong and B. Gao, Adv. Mater., 2011, 23, 3052 CrossRef CAS PubMed.
- C. Pacholski, A. Kornowski and H. Weller, Angew. Chem., Int. Ed., 2002, 41, 1188 CrossRef CAS PubMed.
- Y. S. Liu, S. H. Wei and W. Gao, J. Hazard. Mater., 2015, 287, 59 CrossRef CAS PubMed.
- Y. M. Geng, G. J. Lei, Y. Liao, H. Y. Jiang, G. Xie and S. P. Chen, J. Environ. Chem. Eng., 2017, 5, 5566 CrossRef CAS.
- Y. P. Xie, Y. Q. Yang, G. S. Wang and G. Liu, J. Colloid Interface Sci., 2017, 503, 198 CrossRef CAS PubMed.
- M. Pirhashemi and A. Habibi-Yangjeh, Ceram. Int., 2017, 43, 13447 CrossRef CAS.
- N. Li, Y. Tian, J. H. Zhao, J. Zhang, J. Zhang, W. Zuo and Y. Ding, Appl. Catal., B, 2017, 214, 126 CrossRef CAS.
- Y. Wang, C. X. Feng, M. Zhang, J. J. Yang and Z. J. Zhang, Appl. Catal., B, 2011, 104, 268 CrossRef CAS.
- C. C. Jia, H. S. Chen and P. Yang, CrystEngComm, 2015, 17, 4895 RSC.
- X. M. Zhang, Y. L. Chen, R. S. Liu and D. P. Tsai, Rep. Prog. Phys., 2013, 76, 046401 CrossRef PubMed.
- Y. L. Zhang, S. Wei, H. Y. Zhang, S. Liu, F. Nawaz and F. S. Xiao, J. Colloid Interface Sci., 2009, 339, 434 CrossRef CAS PubMed.
- C. Cheng, A. Amini, C. Zhu, Z. L. Xu, H. S. Song and N. Wang, Sci. Rep., 2014, 4, 4181 CrossRef PubMed.
- L. L. Lai, W. Wen, B. Fu, X. Y. Qian, J. B. Liu and J. M. Wu, Mater. Des., 2016, 108, 581 CrossRef CAS.
- U. Kang and H. Park, Appl. Catal., B, 2013, 233, 140 Search PubMed.
- S. H. Yoon and J. H. Lee, Environ. Sci. Technol., 2005, 39, 969 CrossRef.
- P. R. Hu, L. Liu, W. J. An, Y. H. Liang and W. Q. Cui, Appl. Surf. Sci., 2017, 425, 329 CrossRef CAS.
- F. T. Johra and W. G. Jung, Appl. Catal., A, 2015, 491, 52 CrossRef CAS.
- H. Fakhouri, F. Arefi-Khonsari, A. K. Jaiswal and J. Pulpytel, Appl. Catal., A, 2015, 492, 83 CrossRef CAS.
- U. I. Gaya and A. H. Abdulla, J. Photochem. Photobiol., C, 2008, 1, 1 CrossRef.
- J. J. Wu and C. H. Tseng, Appl. Catal., B, 2006, 1, 51 CrossRef.
- K. B. Sundarama and A. Khanb, J. Vac. Sci. Technol., A, 1997, 15, 428 Search PubMed.
- C. L. Ren, B. F. Yang, M. Wu, J. Xu, Z. P. Fu, Y. Lv, T. Guo, Y. X. Zhao and C. Q. Zhu, J. Hazard. Mater., 2010, 1, 123 CrossRef PubMed.
- S. S. Ma, J. J. Xue, Y. M. Zhou and Z. W. Zhang, J. Mater. Chem. A, 2014, 20, 7272 Search PubMed.
- M. R. Hoffmann, S. T. Martin, W. Y. Choi and D. W. Bahnemann, Chem. Rev., 1995, 95, 69 CrossRef CAS.
- F. Kayaci, S. Vempati, C. Ozgit-Akgun, I. Donmez, N. Biyikli and T. Uyar, Nanoscale, 2014, 6, 5735 RSC.
- A. W. Maijenburg, J. Veerbeek, R. de Putter, S. A. Veldhuis, M. G. C. Zoontjes, G. Mul, J. M. Montero-Moreno, K. Nielsch, H. Schafer, M. Steinhart and J. E. ten Elshof, J. Mater. Chem. A, 2014, 2, 2648 CAS.
Footnote |
| † Electronic supplementary information (ESI) available. See DOI: 10.1039/c7nj02302b |
| This journal is © The Royal Society of Chemistry and the Centre National de la Recherche Scientifique 2018 |