Au3Cu tetrapod nanocrystals: highly efficient and metabolizable multimodality imaging-guided NIR-II photothermal agents†
Zhiyi
Wang‡
ab,
Yanmin
Ju‡
ca,
Shiyan
Tong
a,
Hongchen
Zhang
a,
Jian
Lin
d,
Baodui
Wang
 *b and
Yanglong
Hou
 *a
*a
aBeijing Key Laboratory for Magnetoelectric Materials and Devices, Department of Materials Science and Engineering, College of Engineering, Peking University, Beijing Innovation Centre for Engineering Science and Advanced Technology, Beijing 100871, China. E-mail: hou@pku.edu.cn
bState Key Laboratory of Applied Organic Chemistry and Key Laboratory of Nonferrous Metal Chemistry and Resources Utilization of Gansu Province and, Lanzhou University, Gansu, Lanzhou, 730000, China. E-mail: wangbd@lzu.edu.cn
cCollege of Life Science, Peking University, Beijing 100871, China
dSynthetic and Functional Biomolecules Center, Department of Chemical Biology, College of Chemistry and Molecular Engineering, Peking University, Beijing 100871, China
First published on 10th July 2018
Abstract
Gold and gold-based alloy nanocrystals (NCs) have been widely used in the field of photothermal therapy (PTT). However, the synthesis of multimodal nano-agents for precise and efficient PTT in the second near infrared (NIR-II) region remains a great challenge. Herein, Au3Cu TPNCs were developed as a powerful platform for multimodal image-guided photothermal therapy with significant therapeutic effects and good metabolizability in the NIR-II region.
Conceptual insightsGold and gold-based alloy nanocrystals (NCs) have been widely used in the field of photothermal therapy (PTT). However, the synthesis of multimodal nano-agents for precise and efficient PTT in the second near infrared (NIR-II) region that could be metabolized in vitro after treatment remains a great challenge. Here, Au3Cu tetrapod nanocrystals (TPNCs) were prepared by a facile seed-mediated growth method. Owing to their maximum absorption peak in the NIR-II region, the Au3Cu TPNCs exhibited remarkable photostability, ability for deep tissue photothermal therapy and excellent photothermal performance with a high mass extinction coefficient of up to 53.01 L g−1 cm−1 and 75.27% of photothermal conversion efficiency under irradiation with a 1064 nm laser at a laser power density of 0.8 W cm−2 for 5 min, and could serve as efficient photoacoustic and photothermal agents. After PEG, Cy5, and folic acid (FA) surface modification, the monodisperse Au3Cu@PEG-Cy5,FA not only showed excellent multispectral photoacoustic tomography (MOST) and fluorescence imaging potential but also could selectively and quickly eradicate tumors. Furthermore, Au3Cu@PEG-Cy5,FA could achieve renal clearance through degradation in the tumor microenvironment after the process of PTT. This design paves the way to design a multimodal imaging-guided nanoplatform as a precision theranostic agent in the NIR-II region with appropriate metabolizability. |
Traditional cancer treatment methods, including surgery, chemotherapy, radiation therapy and immunotherapy, have many disadvantages and detrimental side effects such as painful recoveries, potential damage to healthy tissues and systems, and an increased risk of tumor metastasis. Photothermal therapy (PTT), using light to cause thermal damage, is a revolutionary approach in tumor therapy because of its spatiotemporal controllability, high efficiency and minimal harm to normal tissues.1–4 However, without using imaging contrast agents, it is very difficult for PTT to achieve its precise therapeutic effects since its accuracy is compromised. In order to solve such problems, multimodal imaging-guided PTT has recently emerged and achieved rapid development in cancer diagnosis and treatment.5–9 The combination of multiple imaging techniques could provide more comprehensive and accurate information, enabling us to visualize the size and location of tumors, monitor the treatment process, and analyze the treatment efficiency during PTT.10–13 However, until now, there have been few all-in-one theranostic nanoagents that have the advantages such as excellent stability and biocompatibility of the resultant composites during therapy and metabolizability after therapy.14–16 Therefore, it is urgent to develop multifunctional all-in-one nanoagents possessing both theranostic capabilities for PTT and metabolizability after treatment.
Recently, various nanomaterials with good NIR optical properties have been synthesized, many of which have shown favorable photothermal properties in vitro and in vivo. Among these nanomaterials, Au and Au-based nanocrystals (NCs) have attracted much attention in the biomedical field because of their satisfactory biocompatibility, tunable optical absorption/scattering properties for photothermal treatment,17–23 and easy modification with different moieties (e.g., peptides, DNAs, and antibodies). These nanostructures include nanoshells,24–26 nanorods,27 nanocages,28 nanostars,29 and Au-based hybrid nanoparticles (NPs).30–34 The biological transparency windows of the above Au-based photosensitive agents are mainly located in the 650–950 nm range (NIR-I window). The latest research results demonstrate that the second region (NIR-II window) located in the 1000 and 1350 nm range can provide more efficient tissue penetration relative to the NIR-I window.35 In addition, nanoparticles in the size range of 10–30 nm can penetrate deep into the tumor and avoid blood clearance, which is most suitable for tumor targeting therapy.36–38 For clinical purposes, these nanomaterials must be biodegradable to avoid long-term toxicity.39 However, the synthesis of small sized and metabolizable Au and Au-based NCs with efficient photothermal performance in the NIR-II window still faces challenges.
Herein, Au3Cu tetrapod nanocrystals (TPNCs) were prepared by a facile seed-mediated growth method for highly efficient multimodal imaging-guided PTT for tumors in the NIR-II window. In the synthesis of Au3Cu TPNCs, we used Cl− as a surface-confining agent to ensure the growth of flake branches with (111) as the main exposed surface. The length of the arms can be easily adjusted from a few to tens of nanometers by controlling the reaction time. In our current work, we mainly focused on Au3Cu tetrapods with 22.8 ± 4.6 nm of arm length. Owing to their maximum absorption peak completely located in the NIR-II region, the Au3Cu TPNCs showed good photostability, deep tissue photothermal therapy, and excellent NIR-II photothermal performance with a large extinction coefficient of 53.0 L g−1 cm−1 and a significantly high photothermal conversion efficiency of 75.27%. PEG, Cy5, and FA modification can respectively endow the NCs with excellent physiological stability, fluorescence imaging capability, and active targeting capacity for cancer cells with high expression of folate receptors. In vivo experiment results demonstrated that intravenous-injected Au3Cu@PEG-FA can actively target tumor sites through MSOT imaging and eliminate tumors under laser irradiation at 1064 nm. What's more, the Au3Cu TPNCs could achieve renal clearance through degradation in the tumor microenvironment after the process of PTT. Thus, Au3Cu TPNCs showed great potential as highly efficient and metabolizable multimodality imaging-guided NIR-II photothermal agents.
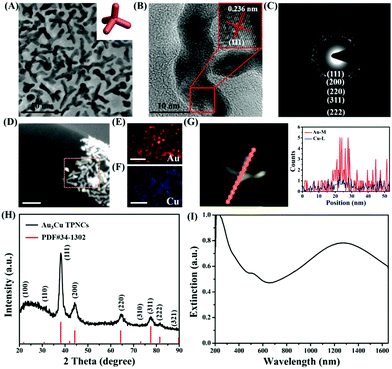
The synthesis of Au3Cu TPNCs was based on a seeded growth approach. Briefly, 3 nm Au seeds were first synthesized according to a previous work (Fig. S1, ESI†).40 Then Au seeds were added into an aqueous solution containing HAuCl4·3H2O, CuCl2·2H2O, D-(+)-glucose, 1-hexadecylamine, and NH4Cl, which was subsequently heated to 100 °C and kept for 40 min under a nitrogen atmosphere. Because surfactant 1-hexadecylamine could change the polarity of water solution, Au seeds could be dispersed in water solutions under constant stirring conditions. Transmission electronic microscopy (TEM) images revealed that the produced Au3Cu TPNCs have an average arm length of around 22.8 ± 4.6 nm (Fig. 1A and Fig. S2, ESI†). The high-resolution TEM (HRTEM) image indicated the crystalline structure of the Au3Cu TPNCs, and a lattice spacing of 0.236 nm corresponded to the (111) planes (Fig. 1B, inset). The selected-area electron diffraction (SAED) pattern (Fig. 1C) proved the preserved bcc structure of the tetrapod because only one set of diffraction spots could be observed. The elemental mapping images in Fig. 1D–F clearly indicated that Au and Cu were homogeneously distributed, which was further confirmed by the EDX spectrum in Fig. S3 (ESI†). A line-scan EDX evaluation (Fig. 1G) further indicated that the two elements present a uniform distribution. The X-ray diffraction (XRD) pattern showed the successful synthesis of Au3Cu phases (PDF#34-1302) (Fig. 1H), which was consistent with the inductively coupled plasma atomic emission spectroscopy (ICP-AES) result with a Au/Cu molar ratio of about 3![[thin space (1/6-em)]](https://www.rsc.org/images/entities/char_2009.gif) :
:![[thin space (1/6-em)]](https://www.rsc.org/images/entities/char_2009.gif) 1 (Table S1, ESI†). The surface chemical composition of the Au3Cu TPNCs was analyzed by X-ray photoelectron spectroscopy (XPS). Fig. S4 (ESI†) showed that the Cu, Au, C and N elements coexisted in the NCs. Two weak peaks at 931.6 eV and 951.1 eV were assigned to the Cu 2p3/2 and Cu 2p1/2 from Cu0 (Fig. S4B, ESI†). The peaks of Au 4f5/2 at 87.6 and Au 4f7/2 at 84.1 eV were attributed to the Au atoms with a chemical valence of zero (Fig. S4C, ESI†).
1 (Table S1, ESI†). The surface chemical composition of the Au3Cu TPNCs was analyzed by X-ray photoelectron spectroscopy (XPS). Fig. S4 (ESI†) showed that the Cu, Au, C and N elements coexisted in the NCs. Two weak peaks at 931.6 eV and 951.1 eV were assigned to the Cu 2p3/2 and Cu 2p1/2 from Cu0 (Fig. S4B, ESI†). The peaks of Au 4f5/2 at 87.6 and Au 4f7/2 at 84.1 eV were attributed to the Au atoms with a chemical valence of zero (Fig. S4C, ESI†).
From the extinction spectra, the Au3Cu TPNCs exhibited a weak extinction coefficient at ∼510 nm, a strong broad peak in the spectral region of 700–1400 nm, and full coverage of the desired biological windows I (650–950 nm) and II (1000–1350 nm) (Fig. 1I). The weak peak at ∼510 nm corresponded to the transverse plasmon absorption, and the strong and broad resonance in the range of 700–1400 nm originated from the longitudinal plasmon resonance, which was explained by the high aspect ratio of the branches.41,42 The wide range of NIR extinction coefficients of Au3Cu TPNCs made them an outstanding candidate for PTT.
The growth and evolution processes of the Au3Cu TPNCs in our system were monitored by TEM at different time intervals. As shown in Fig. 2 and Fig. S5 (ESI†), when the reaction was carried out for 5 minutes, the NCs began to deform, and a few NCs began to grow with branches. When the reaction was kept for 40 minutes, the tetrapod morphology progressively became more evident with the enlargement of size. Subsequently, when the NCs grew up to one hour, only the arm length of the tetrapod NCs grew further. At the same time, we also used UV-Vis-NIR absorption spectroscopy to trace the growth process of the nanostructures. The experiment results showed that the maximum absorption peak of the nanostructures was shifted from 510 nm to 1265 nm (Fig. S6, ESI†). These results indicated that the branched feature of the Au3Cu TPNCs was not caused by etching, although etching is an effective way to create branched noble metal nanostructures.43,44 During the reaction, D-(+)-glucose acted as a reducing agent for two metal salts (hydrogen tetrachloroaurate(III) hydrate and copper(II) chloride dehydrate). There was excessive glucose in the reaction system. The kinetic process of both reactions was very similar. Moreover, a certain amount of Cl− ions played a significant role in the formation of the tetrapod structure because no Au3Cu TPNCs were obtained when Cl− ions were replaced with other halide ions (F−, Br− and I−) (Fig. S7, ESI†). There is still ongoing work aimed at revealing the mechanism of how Cl− ions influence the phase and shape of nanostructures although it is widely accepted that the presence of Cl− ions can affect the surface energy of nuclei.45,46 TEM images of the obtained NCs with different nAu/nCu ratios are provided in Fig. S8 (ESI†). These results demonstrated that the nAu/nCu ratio can influence the final shape of the nanoparticles.
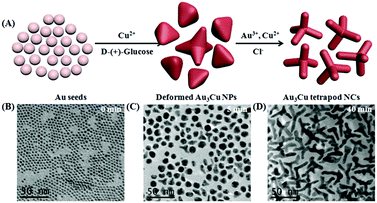 | ||
| Fig. 2 (A) Schematic diagram of the NC growth process. TEM images of the Au3Cu TPNCs at different growth stages: (B) 0 min, (C) 5 min, and (D) 40 min. | ||
To endow them with excellent physiological stability, fluorescence imaging capability, and specific targeting capacity for cancer therapy, hydrophobic Au3Cu TPNCs were further modified with HS-PEG-NH2, HS-PEGNH-Cy5, and HS-PEGNH-FA, respectively (Fig. S9 and S10, ESI†). The successful conjugation of Cy5 and FA onto the surface of the Au3Cu TPNCs was demonstrated by FT-IR spectra (Fig. S11, ESI†), UV-Vis absorption spectra (Fig. S12, ESI†) and fluorescence spectrum (Fig. S13, ESI†). Through calculations we also found that there were about 486 and 430 FA molecules per Au3Cu@PEG-FA and Au3Cu@PEG-Cy5,FA, respectively (Fig. S14, ESI†). TEM images showed that the morphology, size, and crystal lattice of the Au3Cu TPNCs have no change after this modification (Fig. S15, ESI†). The corresponding hydrodynamic diameter of the Au3Cu TPNCs increased from 39.87 nm to 44.93 nm after the formation of Au3Cu@PEG-Cy5,FA (Fig. S16, ESI†), and the zeta potential achieved −3.02 mV (Fig. S17 and Table S2, ESI†), which was suitable for biomedical application. The resultant Au3Cu@PEG-Cy5,FA displayed excellent stability in PBS solution, deionized water, and RPMI 1640 cell culture medium with 10% FBS, respectively (Fig. S18 and Table S3, ESI†). It was found that they could remain stable for at least 15 days in PBS solution (Fig. S19, ESI†).
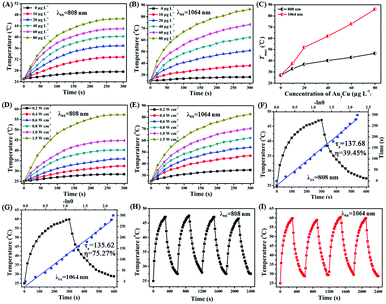
As shown in Fig. S20 (ESI†), a strong NIR-II absorption of Au3Cu@PEG TPNCs was observed in water. There are two main parameters that determine the photothermal performance of nanomaterials, the photothermal-conversion efficiency (η) and extinction coefficient (ε).47 Combining the Lambert–Beer law (ESI†) with UV-Vis-NIR absorbance spectra of Au3Cu@PEG TPNC dispersions at various concentrations (Fig. S20A, ESI†), we calculated the mass extinction coefficient values of Au3Cu@PEG TPNCs to be 33.1 L g−1cm−1 at λ = 808 nm (Fig. S20B, ESI†) and 53.0 L g−1 cm−1 at λ = 1064 nm (Fig. S20C, ESI†), which show more obvious advantages compared with previously reported inorganic photothermal agents with small size.4,5,47 The photothermal effect of Au3Cu@PEG TPNCs in vitro was evaluated under 808 and 1064 nm irradiation at laser densities of 1.0 W cm−2 and 0.8 W cm−2 respectively. As shown in Fig. 3A and B, the temperature of Au3Cu@PEG TPNC dispersions rapidly increased at the beginning and then reached a plateau after 5 min of laser irradiation both at 880 nm and 1064 nm versus no significant temperature increase in the control sample of water (Fig. S21, ESI†), which demonstrates the superior photothermal property of Au3Cu@PEG TPNCs. Interestingly, the temperature increase under the 1064 nm irradiation treatment is greater than that at 808 nm (Fig. 3C), which corresponds to the higher absorption strength of Au3Cu@PEG TPNCs at 1064 nm. Clear power-density-dependent temperature was shown at 808 nm (Fig. 3D) and 1064 nm (Fig. 3E). According to the method of Roper and co-workers's report (detailed in the ESI†), the photothermal-conversion efficiency (η) values of Au3Cu TPNCs were calculated to be 39.45% at 808 nm and 75.27% at 1064 nm (Fig. 3F and G). The morphology of Au3Cu@PEG TPNCs revealed no significant change after irradiation (Fig. S22, ESI†). It is worth noting that the photothermal-conversion efficiency value at 1064 nm was higher than those of previously reported articles and other morphologies of gold–copper bimetallic nanostructures (Fig. S23–S25, Tables S4 and S5, ESI†).1,3 The photothermal effect of the Au3Cu@PEG TPNCs remained stable after four cycles (Fig. 3H and I).
In order to illustrate the greater penetration depth of the NIR-II window than the NIR-I window, the residual NIR laser energy changes at different depths of tissues with various laser densities were measured (Fig. S26A and B, ESI†). As shown in Fig. S26C and D (ESI†), compared with the 808 nm NIR-I laser, there is a stronger energy attenuation trend while using the 1064 nm NIR-II laser with increased tissue thickness. Normalized penetration energy was plotted versus tissue depth and numerically fitted by an exponential decay curve, in which attenuation coefficients of 0.9245 and 0.8982 were obtained for 808 nm and 1064 nm respectively (Fig. S26C and D, inset, ESI†). In addition, the tissue penetration performance of Au3Cu@PEG TPNCs under 808 and 1064 nm laser irradiation was also evaluated. As shown in Fig. 4A and B, when the NIR-I and NIR-II lasers penetrated the same thickness of tissue, the attenuation of photothermal heating of the NIR-II laser was weaker than that of the NIR-I laser (Fig. 4C). Overall, the deep tissue penetration performance of Au3Cu@PEG TPNCs in the NIR-II region showed great promise for in vivo photothermal therapy.
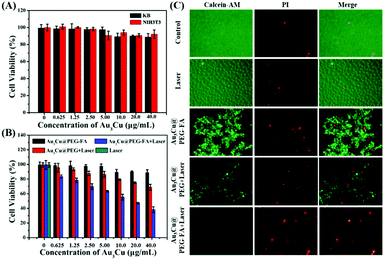
To assess the cytotoxicity and PTT efficacy of Au3Cu@PEG TPNCs, NIH3T3 and KB cells were used. As KB cells overexpress the folate receptor (FR), Au3Cu@PEG-FA can specifically bind to the surface of KB cells through interactions between FA and overexpressed FR. Fig. 5A shows that cell viability was higher than 90% for both NIH3T3 and KB cells with concentrations of TPNCs up to 40 μg mL−1, indicating the very low cytotoxicity of Au3Cu@PEG-FA. Subsequently, we examined the enhanced phototherapy efficacy in the case of KB cells treated with Au3Cu@PEG and Au3Cu@PEG-FA after exposure to the 1064 nm laser (0.8 W cm−2) for 5 min. As shown in Fig. 5B, a more significant laser-induced therapeutic effect was observed for Au3Cu@PEG-FA. Meanwhile, no cytotoxicity was found in the cases with only Au3Cu@PEG-FA or only laser irradiation. The laser-triggered PTT effect was further evaluated by live/dead cell staining experiments. As shown in Fig. 5C, green fluorescence was observed in cells treated with only Au3Cu@PEG-FA or only laser irradiation. However, red fluorescence was observed in cells treated with Au3Cu@PEG-FA under laser irradiation. The amount of dead cells treated with Au3Cu@PEG-FA was higher than that with Au3Cu@PEG under the same conditions, which was consistent with the CCK8 assay results (Fig. 5B). These results demonstrated that Au3Cu@PEG-FA can specifically kill the FR overexpressed cancer cells by photothermal treatment. In addition, no reactive oxygen species (ROS) were detected in this system (Fig. S27, ESI†), further indicating that such a process was mainly hyperthermia-induced cancer cell death. Additionally, the specific targeting ability of Au3Cu@PEG-Cy5,FA toward the FR overexpressed cancer cells was also confirmed by fluorescence imaging (Fig. S28, ESI†).
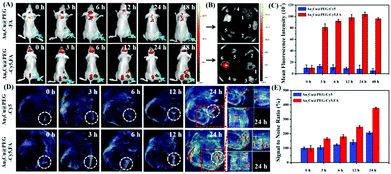
Based on the favorable in vitro results, in vivo tumor-targeting ability of Au3Cu@PEG-FA on mice bearing KB tumors was also evaluated by fluorescence imaging. After Au3Cu@PEG-Cy5 and Au3Cu@PEG-Cy5,FA (20 mg kg−1, 200 μL) were injected into nude mice bearing the KB tumor, respectively, fluorescence images were taken. As shown in Fig. 6A, strong fluorescence signals were mainly present in the tumor site after 24 h. For Au3Cu@PEG-Cy5, however, no fluorescence signal appeared in the tumor site after 24 h. In addition, the targeting capacity of Au3Cu@PEG-Cy5,FA was assessed by ex vivo imaging of the main organs and tumors of mice at 48 h after injection. As shown in Fig. 6B, although the liver and spleen have strong signals, fluorescence signals are clearly observed in the tumor. Moreover, it is noteworthy that a higher tumor site signal was observed in mice injected with Au3Cu@PEG-Cy5,FA than with Au3Cu@PEG-Cy5, which was consistent with the ICP-MS results (Fig. S29, ESI†). These results suggested that Au3Cu@PEG-Cy5,FA accumulated more at the tumor sites than Au3Cu@PEG-Cy5, because the former one had active targeting relying on FA and the FA receptor in addition to passive targeting.49–52 In addition, the Au3Cu@PEG-Cy5,FA exhibited a longer retention time (48 h) in vivo, which was confirmed by the semi-quantified fluorescence intensity (Fig. 6C).
Next, the in vivo tumor-targeting ability of Au3Cu@PEG-Cy5,FA in mice bearing KB tumors was evaluated by MSOT imaging. In vivo MSOT imaging is noninvasive and provides easy to collect anatomical and functional information, since it has higher penetration and higher spatial resolution. As shown in Fig. 6D, after the injection of Au3Cu@PEG-Cy5,FA for 3 h, the photoacoustic signal was detected around the tumor, indicating the ability of Au3Cu TPNCs as agents for MSOT imaging in vivo. Moreover, the photoacoustic signal intensity in tumors injected with Au3Cu@PEG-Cy5,FA was higher than that of the mice injected with Au3Cu@PEG-Cy5, suggesting higher accumulation and deeper penetration of Au3Cu@PEG-Cy5,FA at the tumor sites, which is consistent with the fluorescence imaging results (Fig. 6A). We further studied the different signals of the tumor region in more detail after injection of Au3Cu@PEG-Cy5 and Au3Cu@PEG-Cy5,FA respectively. As shown in Fig. 4E, after injection of Au3Cu@PEG-Cy5,FA for 24 h, the photoacoustic signal intensity of the tumor was increased by about 380%, while the enhancement was less than 208% for Au3Cu@PEG-Cy5, indicating higher accumulation and deep penetration of Au3Cu@PEG-Cy5,FA at the tumor sites.
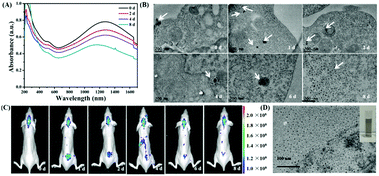
Biodegradation into nontoxic subparts is an ideal property for injected inorganic nanoparticle based PTT, as long-term toxicity of the carriers would be of less concern.48 To evaluate the metabolizability of Au3Cu TPNCs, we dispersed Au3Cu@PEG in phosphate buffer at pH = 7.4 and pH = 5.0. As shown in Fig. S30A and B (ESI†), there was no obvious change in morphology and size of Au3Cu@PEG from the TEM images of Au3Cu@PEG dispersed in phosphate buffer (pH = 7.4) between 0 and 8 days. Nevertheless, the branch of the Au3Cu TPNCs could be degraded when the pH value was changed to 5.0, which is close to the pH value of the tumor microenvironment (Fig. S30C and D, ESI†). The transformation of the UV-Vis-NIR absorption spectrum of Au3Cu@PEG dispersed in phosphate buffer with pH = 5.0 after different times (0, 2, 4 and 8 d) gave a reasonable explanation for the above results (Fig. 7A). The absorption peak in NIR-II showed a big blue shift from 1278 nm (0 d) to 1180 nm (8 d). Furthermore, the ratio A1278 nm/A1278 nm (0 d) was bigger than A1180 nm/A1278 nm (8 d). These results indicated a possibility that the Au3Cu TPNCs could have degraded into smaller nanoparticles. To further prove the above speculation, the biodegradation behavior and structural evolution of Au3Cu@PEG were further evaluated in cells (Fig. 7B). After 8 days of intracellular co-incubation, Au3Cu TPNCs were almost degraded into ultrasmall nanoparticles with the same phase as the initial Au3Cu TPNCs (Fig. S31, ESI†). The reason for the degradation of Au3Cu TPNCs was that copper was more active than gold on the nanoscale. The oxidation of copper on the surface of Au3Cu TPNCs could lead to the instability of the entire nanostructure under acidic conditions. And then they were degraded into smaller nanoparticles. For most of the inorganic nanoparticles renal clearance has been demonstrated to be the most practical means for evading undesirable toxic effects. One of the major challenges facing renal clearable inorganic nanoparticles is their specific accumulation in tumor tissues in vivo. The real-time fluorescence images of tumor-bearing mice at different time points (0, 1, 2, 4, 6 and 8 d) after intravenous injection of Au3Cu@PEG-FA,Cy5 into KB-tumor bearing mice are shown in Fig. 7C. After 2 days, Au3Cu@PEG-FA,Cy5 NCs were mainly accumulated in the kidney of mice from the fluorescence images. However, the fluorescence signal became weaker and weaker after 4 days. This result was consistent with the above findings. In addition, we collected the urine of mice and carried out TEM characterization (Fig. 7D and inset). A large number of nanoparticles appeared in the TEM image. To sum up, Au3Cu@PEG-FA,Cy5 could undergo renal clearance in vivo after degradation in the tumor microenvironment.
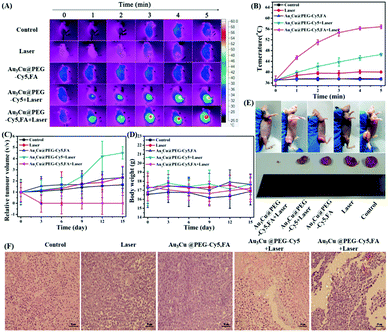
The PTT capability of Au3Cu@PEG-Cy5,FA was monitored by using a KB tumor mouse model. Mice bearing 200 mm3 KB tumors were randomly divided into five groups: (1) Au3Cu@PEG-Cy5,FA and laser irradiation; (2) Au3Cu@PEG TPNCs and laser irradiation; (3) only Au3Cu@PEG-Cy5,FA; (4) only saline; (5) saline and laser irradiation. Each group contained five mice. After an intravenous injection of 200 μL of saline or 20 mg kg−1 TPNCs for 24 h, mice were exposed to a 1064 nm laser (0.8 W cm−2) for 5 min. As shown in Fig. 8A and B, the local temperature of the tumor site in mice treated with Au3Cu@PEG-Cy5,FA and laser irradiation rapidly increased from 37 °C to 56.8 °C within 5 min. Hyperthermia relies on the generation of heat at a tumor site to activate degradation mechanisms of cancer cells leading to cell death. When the local temperature of the tumor is higher than 42 °C, the tumor cells would be killed.53–55 These experiment results suggested that Au3Cu@PEG-Cy5,FA was sufficient to ablate tumors under laser irradiation. In addition, compared with the other four groups, a significant inhibition and elimination of tumor volume further demonstrated the excellent PTT efficacy of Au3Cu@PEG-Cy5,FA in vivo (Fig. 8C). As in the other groups, a decrease in the weight of the mice was not observed during the treatment (Fig. 8D), which further demonstrated the low toxicity of the TPNCs. Moreover, the tumor of harvested mice injected with only Au3Cu@PEG-Cy5,FA was completely eradicated without further reoccurrence after treatment (Fig. 8E).
A typical hematoxylin and eosin (H&E) method was used to examine the potential toxicity of Au3Cu@PEG-Cy5,FA in vivo. As indicated in Fig. 8F, there was severe damage to tumor cells of mice as evidenced by cell necrosis and apoptosis in the group of injection with Au3Cu@PEG-Cy5,FA and laser irradiation. Mice treated with Au3Cu@PEG-Cy5 and laser irradiation showed less necrotic areas. Negligible necrosis was found in the other three groups. Also, the heating curves of Au3Cu@PEG-Cy5 and Au3Cu@PEG-Cy5,FA solutions had no obvious difference under laser irradiation (Fig. S32, ESI†). These results showed that Au3Cu@PEG-Cy5,FA NCs were efficient as selective targeting nanomaterials with PTT effects in FR overexpressed mice models. In addition, there was no obvious damage and inflammation in the major organs (e.g., spleen, heart, lung, liver, and kidney) of mice that were harvested from the treatment group after H&E staining (Fig. S33, ESI†).
Conclusions
In summary, Au3Cu TPNCs were synthesized through a facile seed-mediated growth method, which were further demonstrated to serve as multimodality imaging-guided NIR-II agents with metabolizability. Since their maximum absorption peak completely located in the NIR-II region, the Au3Cu TPNCs exhibited good photostability, ability for deep tissue photothermal therapy, and excellent NIR-II photothermal performance with a large extinction coefficient of 53.0 L g−1 cm−1 and a significantly high photothermal conversion efficiency of 75.27% under 1064 nm laser irradition. In vivo MSOT imaging, flourescence imaging and NIR thermal imaging results indicated that Au3Cu TPNCs modified with FA exhibited significantly improved tumor active targeting performance. The obtained Au3Cu@PEG-Cy5,FA NCs could selectively and quickly eradicate tumors in the NIR-II biowindow without obvious side effects in tumor-bearing mice. Furthermore, Au3Cu@PEG-Cy5,FA could achieve renal clearance through degradation in the tumor microenvironment after the process of PTT. This study opens up a novel approach to develop gold–copper bimetallic nanostructures as a powerful platform for application in multimodal image-guided photothermal therapy with significant therapeutic effects and good metabolizability in the NIR-II region.Conflicts of interest
There are no conflicts to declare.Acknowledgements
The work was supported by the National Natural Science Foundation of China (51672010, 21671088, 21431002, 51631001, 81421004, 51590882, 51602285, 21575161), the National Key R&D Program of China (2017YFA0206301 and 2016YFA0200102), and the Key Laboratory of Biomedical Effects of Nanomaterials and Nanosafety, National Center for Nanoscience and Technology, Chinese Academy of Sciences (No. NSKF201607).References
- X. Zhao, C.-X. Yang, L.-G. Chen and X.-P. Yan, Nat. Commun., 2016, 7, 12104 CrossRef PubMed
.
- Q. Chen, L. Xu, C. Liang, C. Wang, R. Peng and Z. Liu, Nat. Commun., 2016, 7, 13193 CrossRef PubMed
.
- M. Ji, M. Xu, W. Zhang, Z. Yang, L. Huang, J. Liu, Y. Zhang, L. Gu, Y. Yu, W. Hao, P. An, L. Zheng, H. Zhu and J. Zhang, Adv. Mater., 2016, 28, 3094–3101 CrossRef PubMed
.
- H. Chen, T. Liu, Z. Su, L. Shang and G. Wei, Nanoscale Horiz., 2018, 3, 74–89 RSC
.
- X. Yi, K. Yang, C. Liang, X. Zhong, P. Ning, G. Song, D. Wang, C. Ge, C. Chen, Z. Chai and Z. Liu, Adv. Funct. Mater., 2015, 25, 4689–4699 CrossRef
.
- W. Li, R. Zamani, P. R. Gil, B. Pelaz, M. Ibáñez, D. Cadavid, A. Shavel, R. A. Alvarez-Puebla, W. J. Parak, J. Arbiol and A. Cabot, J. Am. Chem. Soc., 2013, 135, 7098–7101 CrossRef PubMed
.
- J. Shao, H. Xie, H. Huang, Z. Li, Z. Sun, Y. Xu, Q. Xiao, X.-F. Yu, Y. Zhao, H. Zhang, H. Wang and P. K. Chu, Nat. Commun., 2016, 7, 12967 CrossRef PubMed
.
- X. Deng, K. Li, X. Cai, B. Liu, Y. Wei, K. Deng, Z. Xie, Z. Wu, P. Ma, Z. Hou, Z. Cheng and J. Lin, Adv. Mater., 2017, 29, 1701266 CrossRef PubMed
.
- Q. Zou, M. Abbas, L. Zhao, S. Li, G. Shen and X. Yan, J. Am. Chem. Soc., 2017, 139, 1921–1927 CrossRef PubMed
.
- Y. Ju, H. Zhang, J. Yu, S. Tong, N. Tian, Z. Wang, X. Wang, X. Su, X. Chu, J. Lin, Y. Ding, G. Li, F. Sheng and Y. Hou, ACS Nano, 2017, 11, 9239–9248 CrossRef PubMed
.
- X. Ding, C. H. Liow, M. Zhang, R. Huang, C. Li, H. Shen, M. Liu, Y. Zou, N. Gao, Z. Zhang, Y. Li, Q. Wang, S. Li and J. Jiang, J. Am. Chem. Soc., 2014, 136, 15684–15693 CrossRef PubMed
.
- A. N. Bashkatov, E. A. Genina, V. I. Kochubey and V. V. Tuchin, J. Phys. D: Appl. Phys., 2005, 38, 2543 CrossRef
.
- H. Lin, S. Gao, C. Dai, Y. Chen and J. Shi, J. Am. Chem. Soc., 2017, 139, 16235–16247 CrossRef PubMed
.
- A. M. Smith, M. C. Mancini and S. Nie, Nat. Nanotechnol., 2009, 4, 710–711 CrossRef PubMed
.
- G. Hong, J. T. Robinson, Y. Zhang, S. Diao, A. L. Antaris, Q. Wang and H. Dai, Angew. Chem., Int. Ed., 2012, 51, 9818–9821 CrossRef PubMed
.
- Z. Sun, H. Xie, S. Tang, X. Yu, Z. Guo, J. Shao, H. Zhang, H. Huang, H. Wang and P. K. Chu, Angew. Chem., Int. Ed., 2015, 54, 11526–11530 CrossRef PubMed
.
- L. Cheng, K. Yang, Y. Li, J. Chen, C. Wang, M. Shao, S.-T. Lee and Z. Liu, Angew. Chem., Int. Ed., 2011, 50, 7385–7390 CrossRef PubMed
.
- S. E. Skrabalak, J. Chen, Y. Sun, X. Lu, L. Au, C. M. Cobley and Y. Xia, Gold Nanocages: Synthesis, Properties, and Applications, Acc. Chem. Res., 2008, 41, 1587–1595 CrossRef PubMed
.
- Y. Chen and J. Shi, Adv. Mater., 2016, 28, 3235–3272 CrossRef PubMed
.
- X. Huang, S. Neretina and M. A. El-Sayed, Adv. Mater., 2009, 21, 4880–4910 CrossRef PubMed
.
- Q. Dong, X. Wang, X. Hu, L. Xiao, L. Zhang, L. Song, M. Xu, Y. Zou, L. Chen, Z. Chen and W. Tan, Angew. Chem., Int. Ed., 2018, 57, 177–181 CrossRef PubMed
.
- Y. Cheng, Y. Chang, Y. Feng, H. Jian, Z. Tang and H. Zhang, Angew. Chem., Int. Ed., 2018, 57, 246–251 CrossRef PubMed
.
- C. Tan, L. Zhao, P. Yu, Y. Huang, B. Chen, Z. Lai, X. Qi, M. H. Goh, X. Zhang, S. Han, X.-J. Wu, Z. Liu, Y. Zhao and H. Zhang, Angew. Chem., Int. Ed., 2017, 56, 7842–7846 CrossRef PubMed
.
- W. Tao, X. Ji, X. Xu, M. A. Islam, Z. Li, S. Chen, P. E. Saw, H. Zhang, Z. Bharwani, Z. Guo, J. Shi and O. C. Farokhzad, Angew. Chem., Int. Ed., 2017, 56, 11896–11900 CrossRef PubMed
.
- L. R. Hirsch, R. J. Stafford, J. A. Bankson, S. R. Sershen, B. Rivera, R. E. Price, J. D. Hazle, N. J. Halas and J. L. West, Proc. Natl. Acad. Sci. U. S. A., 2003, 100, 13549–13554 CrossRef PubMed
.
- C. Loo, A. Lowery, N. Halas, J. West and R. Drezek, Nano Lett., 2005, 5, 709–711 CrossRef PubMed
.
- H. Liu, D. Chen, L. Li, T. Liu, L. Tan, X. Wu and F. Tang, Angew. Chem., Int. Ed., 2011, 50, 891–895 CrossRef PubMed
.
- J. Chen, D. Wang, J. Xi, L. Au, A. Siekkinen, A. Warsen, Z.-Y. Li, H. Zhang, Y. Xia and X. Li, Nano Lett., 2007, 7, 1318–1322 CrossRef PubMed
.
- J. Hao, L. Yong, H. J. Yang, P. Wei, W. Sun, M. Shen, G. Zhang and X. Shi, Biomaterials, 2015, 38, 10–21 CrossRef PubMed
.
- W.-P. Li, P.-Y. Liao, C.-H. Su and C.-S. Yeh, J. Am. Chem. Soc., 2014, 136, 10062–10075 CrossRef PubMed
.
- A. Kumar Rengan, A. B. Bukhari, A. Pradhan, R. Malhotra, R. Banerjee, R. Srivastava and A. De, Nano Lett., 2015, 15, 842–848 CrossRef PubMed
.
- C. Wang, J. Chen, T. Talavage and J. Irudayaraj, Angew. Chem., Int. Ed., 2009, 48, 2759–2763 CrossRef PubMed
.
- B. Pang, Y. Zhao, H. Luehmann, X. Yang, L. Detering, M. You, C. Zhang, L. Zhang, Z.-Y. Li, Q. Ren, Y. Liu and Y. Xia, ACS Nano, 2016, 10, 3121–3131 CrossRef PubMed
.
- H. Zhu, Y. Wang, C. Chen, M. Ma, J. Zeng, S. Li, Y. Xia and M. Gao, ACS Nano, 2017, 11, 8273–8281 CrossRef PubMed
.
- A. L. Antaris, H. Chen, K. Cheng, Y. Sun, G. Hong, C. Qu, S. Diao, Z. Deng, X. Hu, B. Zhang, X. Zhang, O. K. Yaghi, Z. R. Alamparambil, X. Hong, Z. Cheng and H. Dai, Nat. Mater., 2016, 15, 235–342 CrossRef PubMed
.
- K. Welsher, Z. Liu, S. P. Sherlock, J. T. Robinson, Z. Chen, D. Daranciang and H. Dai, Nat. Nanotechnol., 2009, 4, 773–780 CrossRef PubMed
.
- A. Sizovs, X. Z. Song, M. Neal Waxham, Y. L. Jia, F. D. Feng, J. W. Chen, A. C. Wicker, J. M. Xu, Y. Yu and J. Wang, J. Am. Chem. Soc., 2014, 136, 234–240 CrossRef PubMed
.
- M.-F. Tsai, S.-H. Gilbert Chang, F.-Y. Cheng, V. Shanmugam, Y.-S. Cheng, C.-H. Su and C.-S. Yeh, ACS Nano, 2013, 7, 5330–5342 CrossRef PubMed
.
- P. Vijayaraghavan, C.-H. Liu, R. Vankayala, C.-S. Chiang and K. C. Hwang, Adv. Mater., 2014, 26, 6689–6695 CrossRef PubMed
.
- W. Yin, T. Bao, X. Zhang, Q. Gao, J. Yu, X. Dong, L. Yan, Z. Gu and Y. Zhao, Nanoscale, 2018, 10, 1517–1531 RSC
.
- S. Link and M. A. El-Sayed, J. Phys. Chem. B, 1999, 103, 4212–4217 CrossRef
.
- L. Zhang, J. Zhang, Q. Kuang, S. Xie, Z. Jiang, Z. Xie and L. Zheng, J. Am. Chem. Soc., 2011, 133, 17114–17117 CrossRef PubMed
.
- P. D. Cozzoli, E. Snoeck, M. A. Garcia, C. Giannini, A. Guagliardi, A. Cervellino, F. Gozzo, A. Hernando, K. Achterhold, N. Ciobanu, F. G. Parak, R. Cingolani and L. Manna, Nano Lett., 2006, 6, 1966–1972 CrossRef PubMed
.
- X. Huang, S. Tang, J. Yang, Y. Tan and N. Zheng, J. Am. Chem. Soc., 2011, 133, 15946–15949 CrossRef PubMed
.
- Z. Yang, T. Zhao, X. Huang, X. Chu, T. Tang, Y. Ju, Q. Wang, Y. Hou and S. Gao, Chem. Sci., 2017, 8, 473–481 RSC
.
- S. Zhang, G. Jiang, G. T. Filsinger, L. Wu, H. Zhu, J. Lee, Z. Wu and S. Sun, Nanoscale, 2014, 6, 4852–4856 RSC
.
- L. Zhang, S.-I. Choi, J. Tao, H.-C. Peng, S. Xie, Y. Zhu, Z. Xie and Y. Xia, Adv. Funct. Mater., 2014, 24, 7520–7529 CrossRef
.
- E. B. Ehlerding, F. Chen and W. Cai, Adv. Sci., 2016, 3, 1500223 CrossRef PubMed
.
- B. Wang, J. Hai, Q. Wang, T. Li and Z. Yang, Angew. Chem., Int. Ed., 2011, 50, 3063–3066 CrossRef PubMed
.
- E. C. Cho, Q. Zhang and Y. Xia, Nat. Nanotechnol., 2011, 6, 385–391 CrossRef PubMed
.
- X. Yang, M. Yang, B. Pang, M. Vara and Y. Xia, Chem. Rev., 2015, 115, 10410–10488 CrossRef PubMed
.
- Y. Dai, C. Xu, X. Sun and X. Chen, Chem. Soc. Rev., 2017, 46, 3830–3852 RSC
.
- L. Wang, C. Gao, K. Liu, Y. Liu, L. Ma, L. Liu, X. Du and J. Zhou, Adv. Funct. Mater., 2016, 26, 3480–3489 CrossRef
.
- S. Wang, Y. Tian, W. Tian, J. Sun, S. Zhao, Y. Liu, C. Wang, Y. Tang, X. Ma, Z. Teng and G. Lu, ACS Nano, 2016, 10, 8578–8590 CrossRef PubMed
.
- C. Wang, H. Xu, C. Liang, Y. Liu, Z. Li, G. Yang, L. Cheng, Y. Li and Z. Liu, ACS Nano, 2013, 7, 6782–6795 CrossRef PubMed
.
Footnotes |
| † Electronic supplementary information (ESI) available: See DOI: 10.1039/c8nh00135a |
| ‡ These authors contributed equally to this work. |
| This journal is © The Royal Society of Chemistry 2018 |

