
 Open Access Article
 This Open Access Article is licensed under a
 Creative Commons Attribution 3.0 Unported Licence
Metallome of cerebrovascular endothelial cells infected with Toxoplasma gondii using μ-XRF imaging and inductively coupled plasma mass spectrometry†
Alaa T.
Al-sandaqchi‡
a,
Chris
Brignell
b,
Joanna F.
Collingwood
 c,
Kalotina
Geraki
d,
Evgeny M.
Mirkes
e,
Kenny
Kong
f,
Marcos
Castellanos
g,
Sean T.
May
g,
Carl W.
Stevenson
a and
Hany M.
Elsheikha
*h
c,
Kalotina
Geraki
d,
Evgeny M.
Mirkes
e,
Kenny
Kong
f,
Marcos
Castellanos
g,
Sean T.
May
g,
Carl W.
Stevenson
a and
Hany M.
Elsheikha
*h
aSchool of Biosciences, University of Nottingham, Sutton Bonington Campus, Loughborough, LE12 5RD, UK
bSchool of Mathematical Sciences, University of Nottingham, Nottingham, NG7 2RD, UK
cSchool of Engineering, University of Warwick, Coventry, CV4 7AL, UK
dDiamond Light Source, Harwell Science and Innovation Campus, Didcot, OX11 0DE, UK
eMathematics Department, University of Leicester, University Road, Leicester, LE1 7RH, UK
fSchool of Physics and Astronomy, University of Nottingham, University Park, Nottingham NG7 2RD, UK
gNottingham Arabidopsis Stock Centre, School of Biosciences, University of Nottingham, Loughborough LE12 5RD, UK
hFaculty of Medicine and Health Sciences, School of Veterinary Medicine and Science, University of Nottingham, Sutton Bonington Campus, Leicestershire, LE12 5RD, UK. E-mail: hany.elsheikha@nottingham.ac.uk
First published on 5th September 2018
Abstract
In this study, we measured the levels of elements in human brain microvascular endothelial cells (ECs) infected with T. gondii. ECs were infected with tachyzoites of the RH strain, and at 6, 24, and 48 hours post infection (hpi), the intracellular concentrations of elements were determined using a synchrotron–microfocus X-ray fluorescence microscopy (μ-XRF) system. This method enabled the quantification of the concentrations of Zn and Ca in infected and uninfected (control) ECs at sub-micron spatial resolution. T. gondii-hosting ECs contained less Zn than uninfected cells only at 48 hpi (p < 0.01). The level of Ca was not significantly different between infected and control cells (p > 0.05). Inductively Coupled Plasma Mass Spectrometry (ICP-MS) analysis revealed infection-specific metallome profiles characterized by significant increases in the intracellular levels of Zn, Fe, Mn and Cu at 48 hpi (p < 0.01), and significant reductions in the extracellular concentrations of Co, Cu, Mo, V, and Ag at 24 hpi (p < 0.05) compared with control cells. Zn constituted the largest part (74%) of the total metal composition (metallome) of the parasite. Gene expression analysis showed infection-specific upregulation in the expression of five genes, MT1JP, MT1M, MT1E, MT1F, and MT1X, belonging to the metallothionein gene family. These results point to a possible correlation between T. gondii infection and increased expression of MT1 isoforms and altered intracellular levels of elements, especially Zn and Fe. Taken together, a combined μ-XRF and ICP-MS approach is promising for studies of the role of elements in mediating host–parasite interaction.
Significance to metallomicsBrain infection with the parasite Toxoplasma gondii remains a prevalent and potentially life-threatening health problem worldwide. We established a novel use of synchrotron–microfocus X-ray fluorescence microscopy (μ-XRF) together with inductively coupled plasma mass spectrometry and microarray technology to profile metals and examine gene expression of metal-binding proteins in cerebrovascular endothelial cells infected with this parasite. This cross-disciplinary approach revealed novel biomarkers and metal-dependent mechanisms that underpin parasite infection of the main constituent of the blood brain barrier. |
1. Introduction
Toxoplasma gondii is an obligate intracellular apicomplexan pathogen causing diseases by reiterating its lytic cycle, comprising host cell invasion, parasite replication and parasite egress. The ability of this parasite to invade host cells, disseminate through tissues and cause disease depends critically on its ability to locate and engage with the target host central nervous system (CNS). The blood–brain barrier (BBB) plays an important role as the biological interface that separates the host neural tissues from circulating blood. Human brain microvascular endothelial cells (ECs) constitute the fundamental component of the BBB, and together with basal lamina, astrocytic foot processes, pericytes, and tight junctions strictly regulate substance entry to neuronal tissue.1–3 Overcoming this protective barrier is a fundamental step in the establishment of brain infection.4T. gondii invades and survives in host cells by modulating host cell processes and evading innate defenses, but the mechanisms are not fully defined. Metal dyshomeostasis during T. gondii infection implicates a significant role for metals in mediating parasite–host interaction. Fe, Cu and Zn are essential elements required for a multitude of cellular functions, such as enzymatic reactions, DNA synthesis, metabolic processes, and gene expression.5 These metals play key roles in the host response to infection, including the development of the immune response and influencing the virulence of microorganisms.6–8 The intracellular homeostasis of these elements is tightly regulated, and alteration of their levels can have adverse impacts on the host cell and its ability to respond to microbial infection. T. gondii infection has been shown to alter the levels of Zn, Fe, Mg and Cu in the blood of seropositive sheep9 and humans,10 compared to their seronegative counterparts. Therefore, it is reasonable to hypothesize that host cell elemental content will change in response to T. gondii infection, especially in tissues with high metabolic demand such as the CNS.
This study establishes a novel use of synchrotron–microfocus X-ray fluorescence microscopy (μ-XRF) to determine changes in the cellular levels of Fe, Cu, Zn, and other elements in ECs challenged with T. gondii. μ-XRF is a chemical, non-invasive, element imaging technique, which can be used to generate X-ray fluorescent 2D elemental maps of biological samples,11,12 with detection sensitivity and spatial resolution well-suited to characterize host–parasite interaction. μ-XRF imaging can enable in situ interrogation of the spatial distribution of one or more elements to submicron spot sizes and offers enough sensitivity and precision to detect metal distribution even at the single cell and subcellular levels.13 However, absolute quantification of elements is not so straightforward using μ-XRF imaging, and in this respect the method is usually considered semi-quantitative. We therefore compared these results with those obtained from inductively coupled plasma mass spectrometry (ICP-MS), which is currently a gold-standard technique for the determination of absolute trace element concentrations and has been widely used for the elemental analysis of various tissues.14
2. Experimental
2.1. Parasite strain
Toxoplasma gondii genotype I (RH strain) tachyzoites were maintained by passage in Madin-Darby Canine Kidney (MDCK) cell cultures grown in complete Dulbecco's modified Eagle's medium (DMEM), supplemented with 10% heat-inactivated fetal bovine serum (FBS), 2 mM glutamine, and 1% antibiotic–antimycotic solution at 37 °C under a humidified atmosphere of 5% CO2. The tachyzoites were purified from their feeder MDCK cell cultures by passage through PD-10 desalting columns filled with Sephadex, as described previously.15 The purified parasites were centrifuged at 800 × g, re-suspended in fresh medium, and quantified using a hemocytometer. The final volume of pure tachyzoite suspension was adjusted with fresh Roswell Park Memorial Institute (RPMI) 1640 medium.2.2. Cell culture
Human brain microvascular endothelial cells (ECs) were used at passage 9 and were maintained in vitro, as described previously.16,17 Briefly, ECs were propagated in tissue-culture medium composed of RPMI 1640 medium supplemented with 20% (v/v) heat inactivated FBS, 2 mM L-glutamine, 1 mM sodium pyruvate, 1% non-essential amino acids, 1% MEM vitamins, and 2% penicillin/streptomycin (Invitrogen, GIBCO, UK). Cells were maintained in an incubator in a humidified atmosphere at 37 °C and 5% CO2. ECs were trypsinized twice a week using trypsin–EDTA (Invitrogen, GIBCO, UK). Cells were examined daily under light microscopy and were considered confluent when their expansion had reached a point where cells touched each other on all sides, leaving no intercellular gaps. To exclude the possibility that cell viability had influenced elemental concentration of the ECs or parasite interactions with the ECs and any subsequent measurement, the viability of the cells was assessed for a minimum of 100 cells using 0.15% trypan blue exclusion assay prior to use in any experiment.2.3. Quantification of elements using ICP-MS
ECs were seeded in T-175 cm2 tissue culture flasks at 1010 cells per flask and grown in RPMI medium, as described above. Once a confluent cell monolayer was formed (∼24 h), tachyzoites were added at a multiplicity of infection (MOI) of 2 (i.e., a host![[thin space (1/6-em)]](https://www.rsc.org/images/entities/char_2009.gif) :parasite ratio of 1:2). The culture medium (500 μl) was collected 6, 24 and 48 hours post-infection (hpi) from the infected and non-infected (control) cultures and diluted to 10 ml (1:20 dilution) with 1% nitric acid, before running on the inductively coupled plasma mass spectrometry (ICP-MS; Varian Ultramass, Melbourne, VIC, Australia) system fitted with a direct injection nebulizer (CETAC, Omaha, NE, USA) using Rh (10 ng l−1) as an internal standard in order to quantify the concentrations of the extracellular trace elements. At identical time points after infection (ESI;† Fig. S1), infected and uninfected cells were harvested using a sterile cell scraper, followed by washing three times with deionized water. The cells (infected or uninfected) and purified tachyzoites were centrifuged for 5 min at 800 × g. The cell or tachyzoite pellets were lyophilized by a Modulyo freeze-dryer (Thermo Savant, USA). These lyophilized pellets were digested for 1 h at ambient temperature using a solution containing 3 ml HNO3, 3 ml H2O, and 2 ml H2O2. The samples were heated in a microwave for 90 min. The intracellular concentration of the elements was then determined using ICP-MS. The accuracy of the method for element analysis was evaluated using bovine liver standard reference material (SRM) obtained from the National Institute of Standards and Technology (NIST SRM 1577b, USA). A total of 24 elements were measured, including iron (Fe), manganese (Mn), calcium (Ca), potassium (K), sulfur (S), barium (Ba), zinc (Zn), magnesium (Mg), phosphorous (P), boron (B), sodium (Na), vanadium (V), chromium (Cr), cobalt (Co), nickel (Ni), copper (Cu), arsenic (As), selenium (Se), rubidium (Rb), strontium (Sr), molybdenum (Mo), cesium (Cs), cadmium (Cd), and silver (Ag).
:parasite ratio of 1:2). The culture medium (500 μl) was collected 6, 24 and 48 hours post-infection (hpi) from the infected and non-infected (control) cultures and diluted to 10 ml (1:20 dilution) with 1% nitric acid, before running on the inductively coupled plasma mass spectrometry (ICP-MS; Varian Ultramass, Melbourne, VIC, Australia) system fitted with a direct injection nebulizer (CETAC, Omaha, NE, USA) using Rh (10 ng l−1) as an internal standard in order to quantify the concentrations of the extracellular trace elements. At identical time points after infection (ESI;† Fig. S1), infected and uninfected cells were harvested using a sterile cell scraper, followed by washing three times with deionized water. The cells (infected or uninfected) and purified tachyzoites were centrifuged for 5 min at 800 × g. The cell or tachyzoite pellets were lyophilized by a Modulyo freeze-dryer (Thermo Savant, USA). These lyophilized pellets were digested for 1 h at ambient temperature using a solution containing 3 ml HNO3, 3 ml H2O, and 2 ml H2O2. The samples were heated in a microwave for 90 min. The intracellular concentration of the elements was then determined using ICP-MS. The accuracy of the method for element analysis was evaluated using bovine liver standard reference material (SRM) obtained from the National Institute of Standards and Technology (NIST SRM 1577b, USA). A total of 24 elements were measured, including iron (Fe), manganese (Mn), calcium (Ca), potassium (K), sulfur (S), barium (Ba), zinc (Zn), magnesium (Mg), phosphorous (P), boron (B), sodium (Na), vanadium (V), chromium (Cr), cobalt (Co), nickel (Ni), copper (Cu), arsenic (As), selenium (Se), rubidium (Rb), strontium (Sr), molybdenum (Mo), cesium (Cs), cadmium (Cd), and silver (Ag).
2.4. Cell infection and sample preparation for μ-XRF imaging
Endothelial cells were seeded on quartz slides (UQG Ltd, Cambridge, England) until they formed a monolayer (∼24 h). T. gondii tachyzoites were then added to the cell monolayer at a MOI of 2. Control samples included quartz slides that were also seeded with the same number of cells, but without addition of tachyzoites. At 6, 24 and 48 hpi, three slides from each of the infected and non-infected ECs were washed 3× in sterile phosphate buffered saline (PBS; 137 mM sodium chloride, 2.7 mM potassium chloride, 10 mM disodium phosphate, and 1.8 mM monopotassium phosphate; pH 7.4) and fixed in 4% paraformaldehyde in PBS for 30 minutes at ambient temperature. The slides were washed again 3× in PBS and left at 4 °C in deionized water (17.8 MΩ cm) until μ-XRF imaging.2.5. Microfocus X-ray fluorescence imaging of metals
The synchrotron microprobe of beamline I1818 at Diamond Light Source, Oxfordshire, UK was utilized to map, and thereby quantify and compare, the individual distributions of Fe, Ca, and Zn within the ECs. Control samples were also analyzed to establish a baseline for the levels of these metals. Incubation times of 6, 24 and 48 hpi were measured for control and infected cells in order to evaluate the relative metal levels within the host cells at different stages after infection. The elemental distribution map of Fe could not be determined because the signals did not exceed the background level. It is likely that the ECs might have taken up Fe from the cell culture serum because ECs were cultured in media supplemented with animal serum. In contrast, the elemental distribution maps of Ca and Zn were successfully produced at a resolution of approximately 3 microns, over sample areas of 400 μm2. As the levels measured were known to be in the low parts per million (ppm) region, 4 s per point dwell time was used for improved counting statistics. The elemental concentration was determined by measuring a reference material for μ-XRF measurements (AXO, Dresden GmbH) in the same conditions as the samples in order to deduce the photon flux on the sample. The reference material was composed of nm-thick layers of metals with known numbers of atoms per unit area. The resulting concentration maps were produced using PyMca, where the reference material and our sample were modelled in terms of main composition, density and thickness.19 This analysis enabled fitting of the acquired spectra and translation of the fluorescence intensity maps for individual elements into estimated concentration distributions with an approximation to the composition of the cellular matrix. The net peak areas from the sample spectra were translated into concentrations resulting in elemental maps in units of ppm (mg g−1 dry weight), which were then imported as tiff images in ImageJ for further statistical analysis. From the concentration maps, regions of interest (ROIs) within cells were identified based on contrast to surrounding using the auto-threshold tool in ImageJ. From each ROI an average elemental value was extracted and plotted in scatter plots.The dehydration of the samples did not change the quantity of each material element sampled by the beam, as hydrogen and oxygen were not considered here, and the X-ray beam penetrated the full thickness of the sample. However, the absolute concentrations were necessarily an estimate due to the limitations of matrix matching with the reference standards, and to the inevitable variation in the thickness profile of individual cells. Also, it is important to note that the examined cell matrix was not a homogeneous bulk sample. ECs were not uniform in shape, or volume, their diameter ranged from 35–50 μm, and the cell monolayer thickness might also vary. Therefore, considerable heterogeneity effects might have occurred, which can reduce the accuracy of estimated concentrations. The obtained values were tested for statistically significant differences between control and infected cells using Student's t test (two tailed). A p-value of <0.05 was considered the cut-off for a significant difference.
2.6. Elemental analysis at a single cell level
We have developed a data-processing pipeline to estimate the elemental concentration in single cells (Fig. 1). To avoid issues of pile-up cells, we excluded spots where there was microscopic evidence of crowding and overlapping of cells. First, we aligned the bright field image (Fig. 1a) to the μ-XRF fluorescent image (Fig. 1b) to ensure that the offset, scale, orientation and resolution of both images were completely matched. From the bright field image, ROIs (i.e. individual cells) were selected, and the contour of each individual cell was manually drawn (Fig. 1c). These outlined cells were used as masks to crop and extract the information only from the ROIs in the μ-XRF fluorescent images. The image annotated with the ROIs (Fig. 1c) was then transformed into a Boolean image, where the ROIs were coded as 1 and anything else as 0, as shown in Fig. 1d. The Boolean image was resized to the same resolution as the μ-XRF fluorescent image (Fig. 1b) to ensure the correctness of the measured fluorescence intensity (Fig. 1e). The fluorescence intensity of the ROIs within the μ-XRF fluorescent binary image was extracted (Fig. 1f). We used the connected-component labelling algorithm in MATLAB 2016b (MathWorks, Inc.) to quantify the fluorescence intensity signal from individual cells, at a single pixel scale, by labelling adjacent pixels (Fig. 1f). Each area of a connected component represented the number of the adjacent pixels in a single cell. The data represent the means of the element concentrations from at least 20 individual cells per sample ± the SD. Although our image processing approach may not have fully quantified the complete fluorescence that represents the XRF spectra from single cells, its sensitivity was sufficient to quantify metal content inside individual cells in an objective and quantitative manner.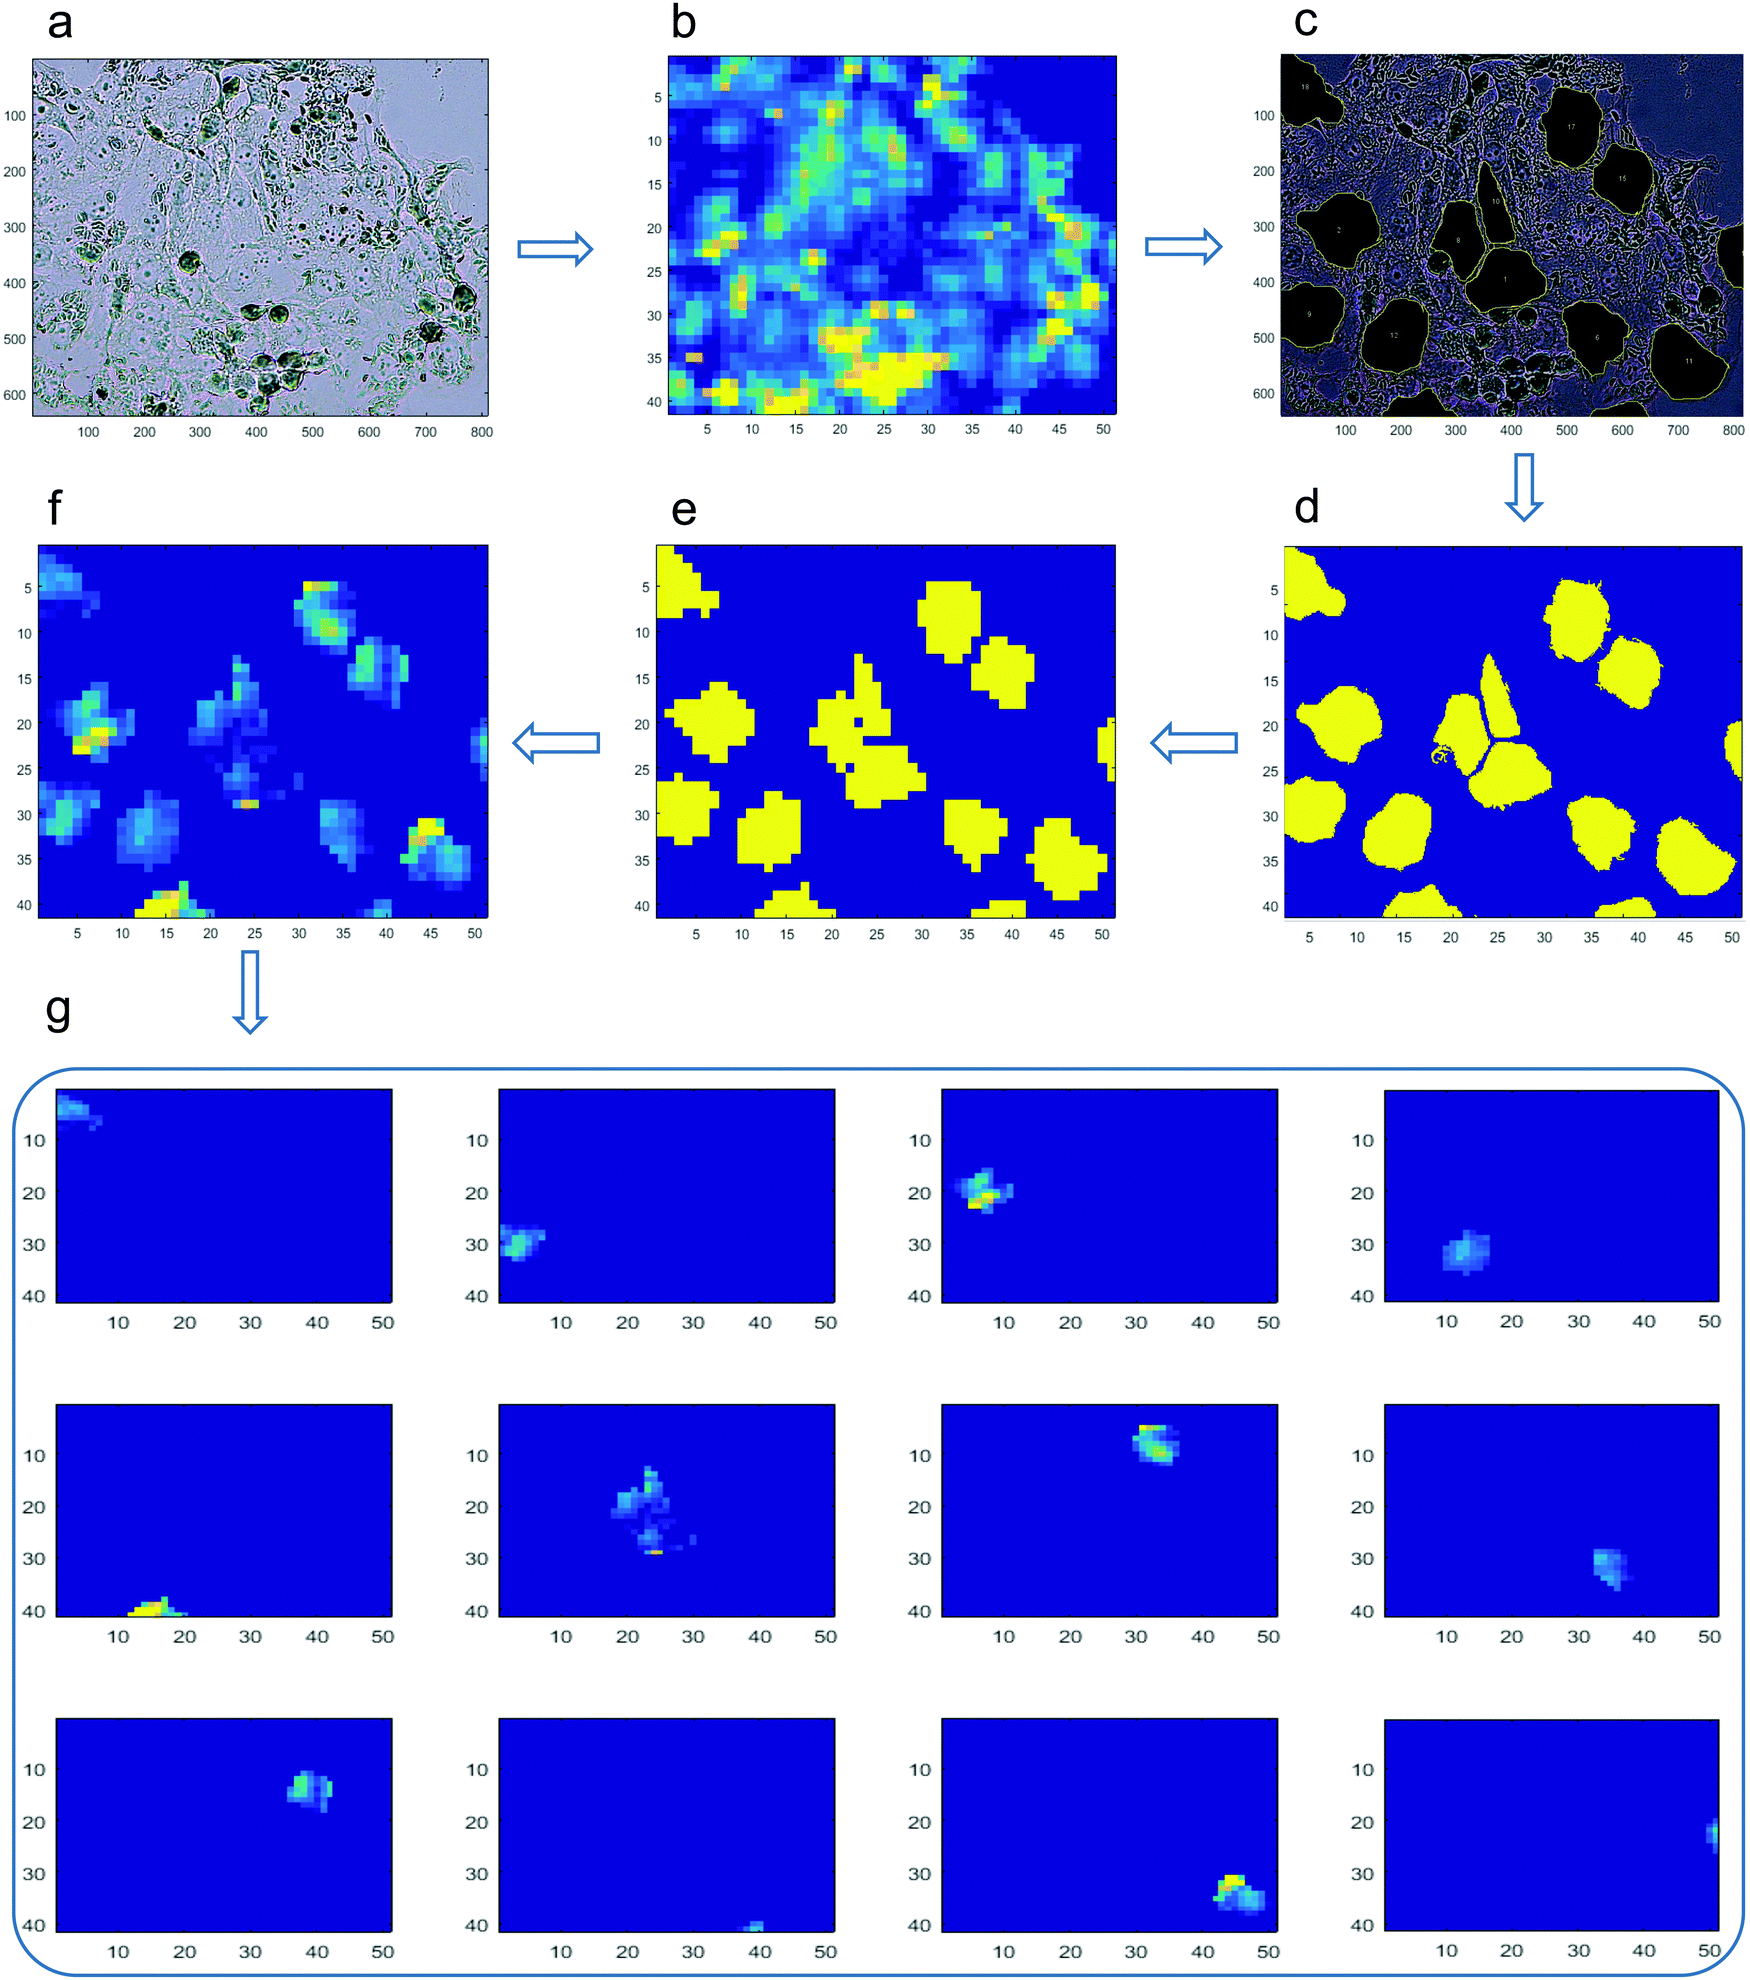 | ||
| Fig. 1 Single cell elemental analysis workflow. (a) The bright field image was aligned against (b) the μ-XRF elemental map, and (c) regions of interest (i.e. single cells) in the bright field image were outlined. We then masked the regions of interest on the μ-XRF elemental map (d–f). Individual cells were separated, and the mean and standard deviation of each element were derived per cell, followed by calculating the mean and standard error for each time point (g). | ||
2.7. Gene expression analysis
We explored whether T. gondii infection induced metal dyshomeostasis through modulation of metal transporters or metallothionein. EC monolayers were harvested using trypsin and lysed with QIAshredder columns (Qiagen). Total RNA was isolated using an RNeasy Mini Kit (Qiagen), and eluted with nuclease-free water. RNA was stored at −80 °C for 1 week prior to microarray analysis. All subsequent sample handling, labelling and microarray (GeneChip™ Human Gene 2.1 ST, Affymetrix) processing was performed at the Nottingham Arabidopsis Stock Centre (NASC). The RNA concentration and quality was assessed using the Agilent 2100 Bioanalyzer (Agilent Technologies Inc., Palo Alto, CA) and the RNA 600 Nano Kit (Caliper Life Sciences, Mountain View, CA). Samples with a minimum RNA concentration of 100 ng μl−1 and RNA Integrity Number (RIN) ≥ 8 were used for gene expression analysis. Single stranded complementary DNA was prepared from 200 ng of total RNA as per the GeneChip™ WT PLUS Reagent Kit (Applied Biosystems and Affymetrix). Total RNA was first converted to cDNA, followed by in vivo transcription to make cRNA. Single stranded cDNA was synthesized, end labeled and hybridized for 16 h at 45 °C to GeneChip™ Human Gene 2.1 ST arrays. All steps were performed by a GeneAtlas™ Personal Microarray system (Affymetrix). Gene expression data were analyzed using Partek Genomics Suite 7.0 software (Partek Incorporated). The raw CEL files were normalized using the RMA background correction with quantile normalization, log base 2 transformation and mean probe-set summarization with adjustment for GC content. Differentially expressed genes were considered significant if p-value with false discovery rate (FDR) was ≤0.05 and fold change of >2 or <−2.2.8. Statistical analysis of the ICP-MS data
Differences in the mass spectrometry-based elemental concentrations between control and infected cells at different time points were assessed by two-way ANOVA and Tukey's multiple comparison test (*, p < 0.05; **, p < 0.01; ***, p < 0.001) using Graphpad Prism version 5.0 (Graphpad Software Inc., San Diego, CA). The data were presented as the mean and standard deviation (SD) from at least three independent experiments. A heatmap was produced to demonstrate the average elemental concentrations over the three time points post-infection, with the elements ordered according to the cluster analysis. The dendrograms were calculated using Ward's method on Euclidean distances. Because the dataset was not normally distributed, statistical analysis was performed on the transformed data (log10). Next, we, performed a volcano plot analysis where for each element and intra/extra-cellular condition we considered the most significant time point (the time point with the smallest p-value). Briefly, a linear model was fitted for each element, with the measurement as the response variable. The covariates were the time (treated as a factor with three levels) and the interaction between time and the control/infected condition, giving six parameters. The parameter estimate for the interaction parameters provided an estimate of the difference between the infected and control groups. The standard errors, t-values and p-values for the estimates were also evaluated. After correcting for multiple comparisons, a threshold of p < 0.00088 was deemed to be significant. To classify sample by measurement of individual elements we applied a z-score classifier: mean and standard deviations of infected and uninfected samples were estimated. This method corresponds to one-dimensional Fisher's linear discriminant with a significance level of 99.9%.3. Results
3.1. Elemental levels in T. gondii-infected ECs using ICP-MS
The levels of elements in culture medium and within ECs infected with T. gondii compared with uninfected cells were determined using ICP-MS. Notably, the majority of elements did not show significant differences between control and infected cells. However, our analysis identified patterns associated with T. gondii infection and detected significant differences (p < 0.001) between control and infected cell cultures (Fig. 2). We also noted that the intra- and extra-cellular measurements often differed by orders of magnitude. The intracellular concentrations of Zn, Fe, Mn, and Cu increased over time (p < 0.01), whereas the levels of their counterparts in the extracellular culture medium, except Cu, remained nearly unchanged. Intracellular levels of Co, Cu, Mo, V, and Ag remained unaltered, whereas their concentrations in the extracellular culture medium decreased over time (p < 0.01).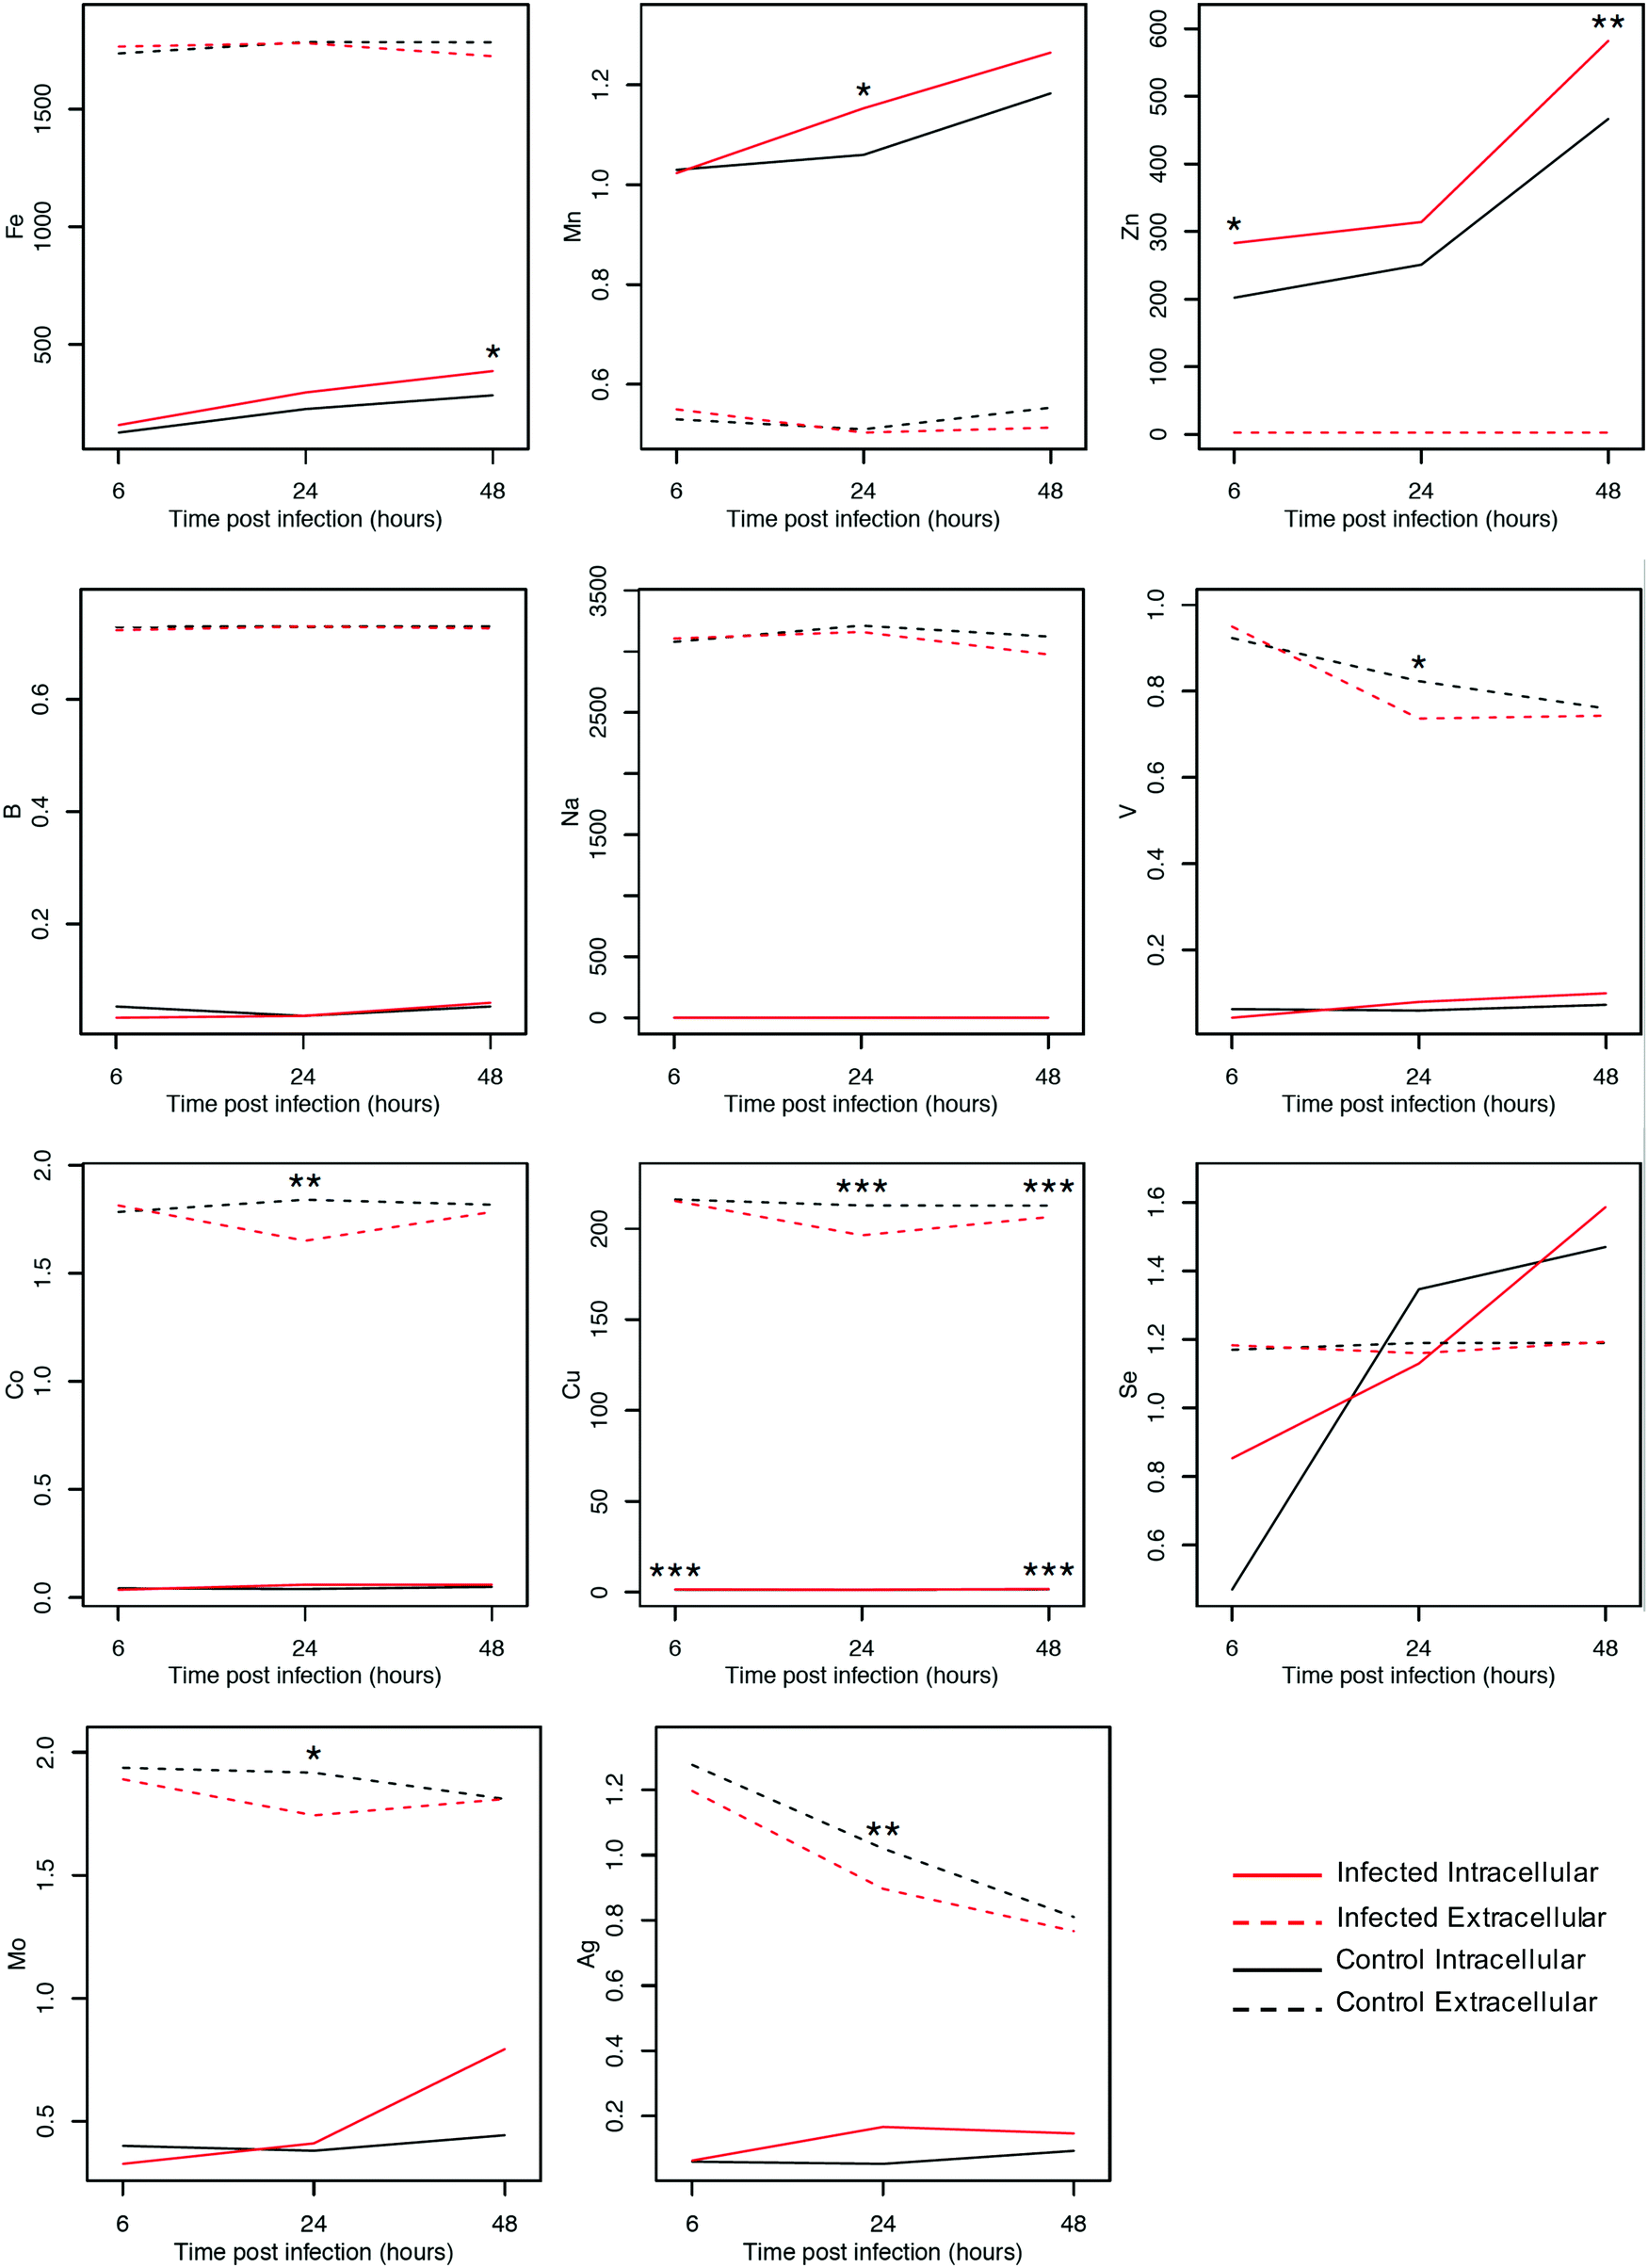 | ||
| Fig. 2 Plots showing dynamic changes in the levels of elements within cells and in culture medium following infection using ICP-MS. Results shown represent the mean value with one standard deviation width interval for each group after taking the arithmetic average across the three replicates available for each element at each time point. Each panel shows the kinetic signature of one element detected inside the EC culture or in the supernatant at 6, 24 and 48 hours post infection (hpi) with T. gondii (X-axis). The Y-axis denotes concentrations of the metals (μg L−1). Black and red lines represent control and infected samples, respectively. Solid and dashed lines represent the intracellular and extracellular elemental concentrations, respectively. Following infection the levels of Zn, Fe, Mn, and Cu displayed increasing levels inside the cells, whereas Co, Cu, Mo, V, and Ag displayed decreasing levels outside the cells (*p < 0.05, **p < 0.01, ***p < 0.001). | ||
To further validate the results, we looked at the differences in individual elements between infected and control cells using t-tests. The intracellular levels of Zn, Fe and Mn were significantly increased in infected cells compared with uninfected cells (p < 0.01). The intracellular level of Cu also showed significant differences at 6 and 48 hpi (p < 0.001, as determined by ANOVA). The extracellular concentrations of Co, V, Mo, and Ag showed no difference as indicated by the overlap of intervals of infected and uninfected samples at 6 and 48 hpi and significant decrease in samples observed at 24 hpi (p < 0.05 for V and Mo; p < 0.01 for Co and Ag, as determined by ANOVA). The accuracy of the z-score classifier for the intracellular level of Cu was 98.3%, 50% and 99.9%, whereas for the extracellular level it was 65.5%, 99.9% and 86.3%, at 6, 24 and 48 hpi, respectively.
The difference in elemental levels between control and infected cells was plotted against the corresponding −log(base 10) p-value for testing significant differences. As shown in the ESI,† Fig. S2, the Cu inside and outside the cells was the only element that was located above the horizontal line that represents the threshold of significance. This finding, together with the result showed in Fig. 2, suggests that the level of Cu was significantly different between infected and control samples.
We also performed unsupervised hierarchical clustering of the element concentrations. In the constructed dendrograms, the samples were separated based on the mean concentration of elements in the control and infected samples at 6, 24 and 48 hpi. The heatmap provided a graphical display of the temporal changes in the concentration of each element, with one row representing the mean control (Con) and one row representing the mean infected (Inf) cells of each sample (Fig. 3). Results shown in the heatmap further point out the significant increase in the concentration of Zn (p < 0.01) and Fe (p < 0.05) at 48 hpi. Next, the dendrogram (tree) in the heatmap was divided to produce six different groups. The mean (±1 standard deviation) of the individual replicates of the elements that constituted each group were plotted at 6, 24, and 48 hpi. Elements within each of the six cluster groups shared an overall unique pattern (Fig. 4).
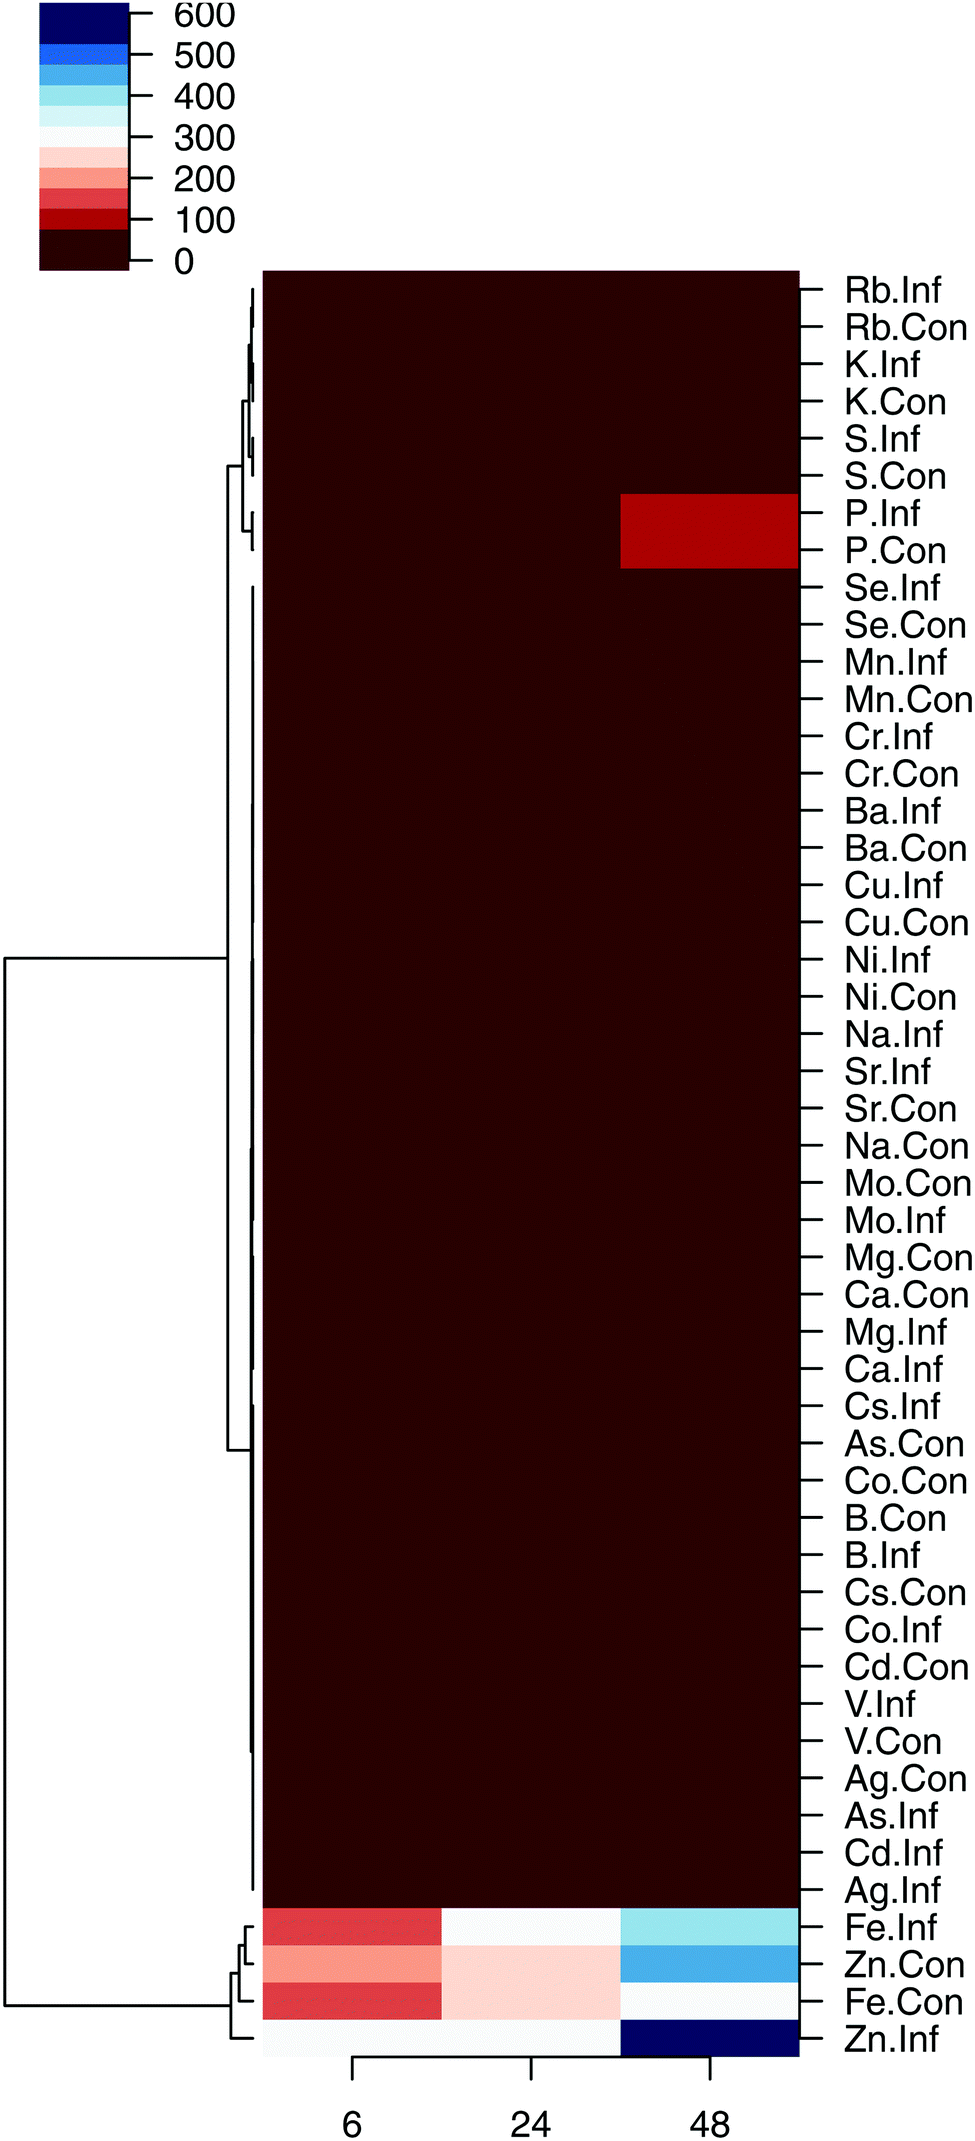 | ||
| Fig. 3 A heatmap and cluster tree representation showing the fluctuations in the concentration of elements between infected and uninfected ECs over the course of infection using a colour-scale, with the elements ordered according to the cluster analysis. Average concentrations of the control and infected samples over the course of infection were calculated for each element by taking the mean over control replicates and infected replicates, respectively. Hierarchical cluster analysis combined with a heat map revealed trends across time points after infection (X-axis) and between the measured elements (Y-axis). Each element is represented by two rows, average control (Con) and average infected (Inf), and each time point after infection by a column. The colour scale indicates the concentration value (dark red indicates lower elemental concentration values and dark blue indicates higher concentration values). The dendrogram was calculated using Ward's method on Euclidean distances between the average response vectors. | ||
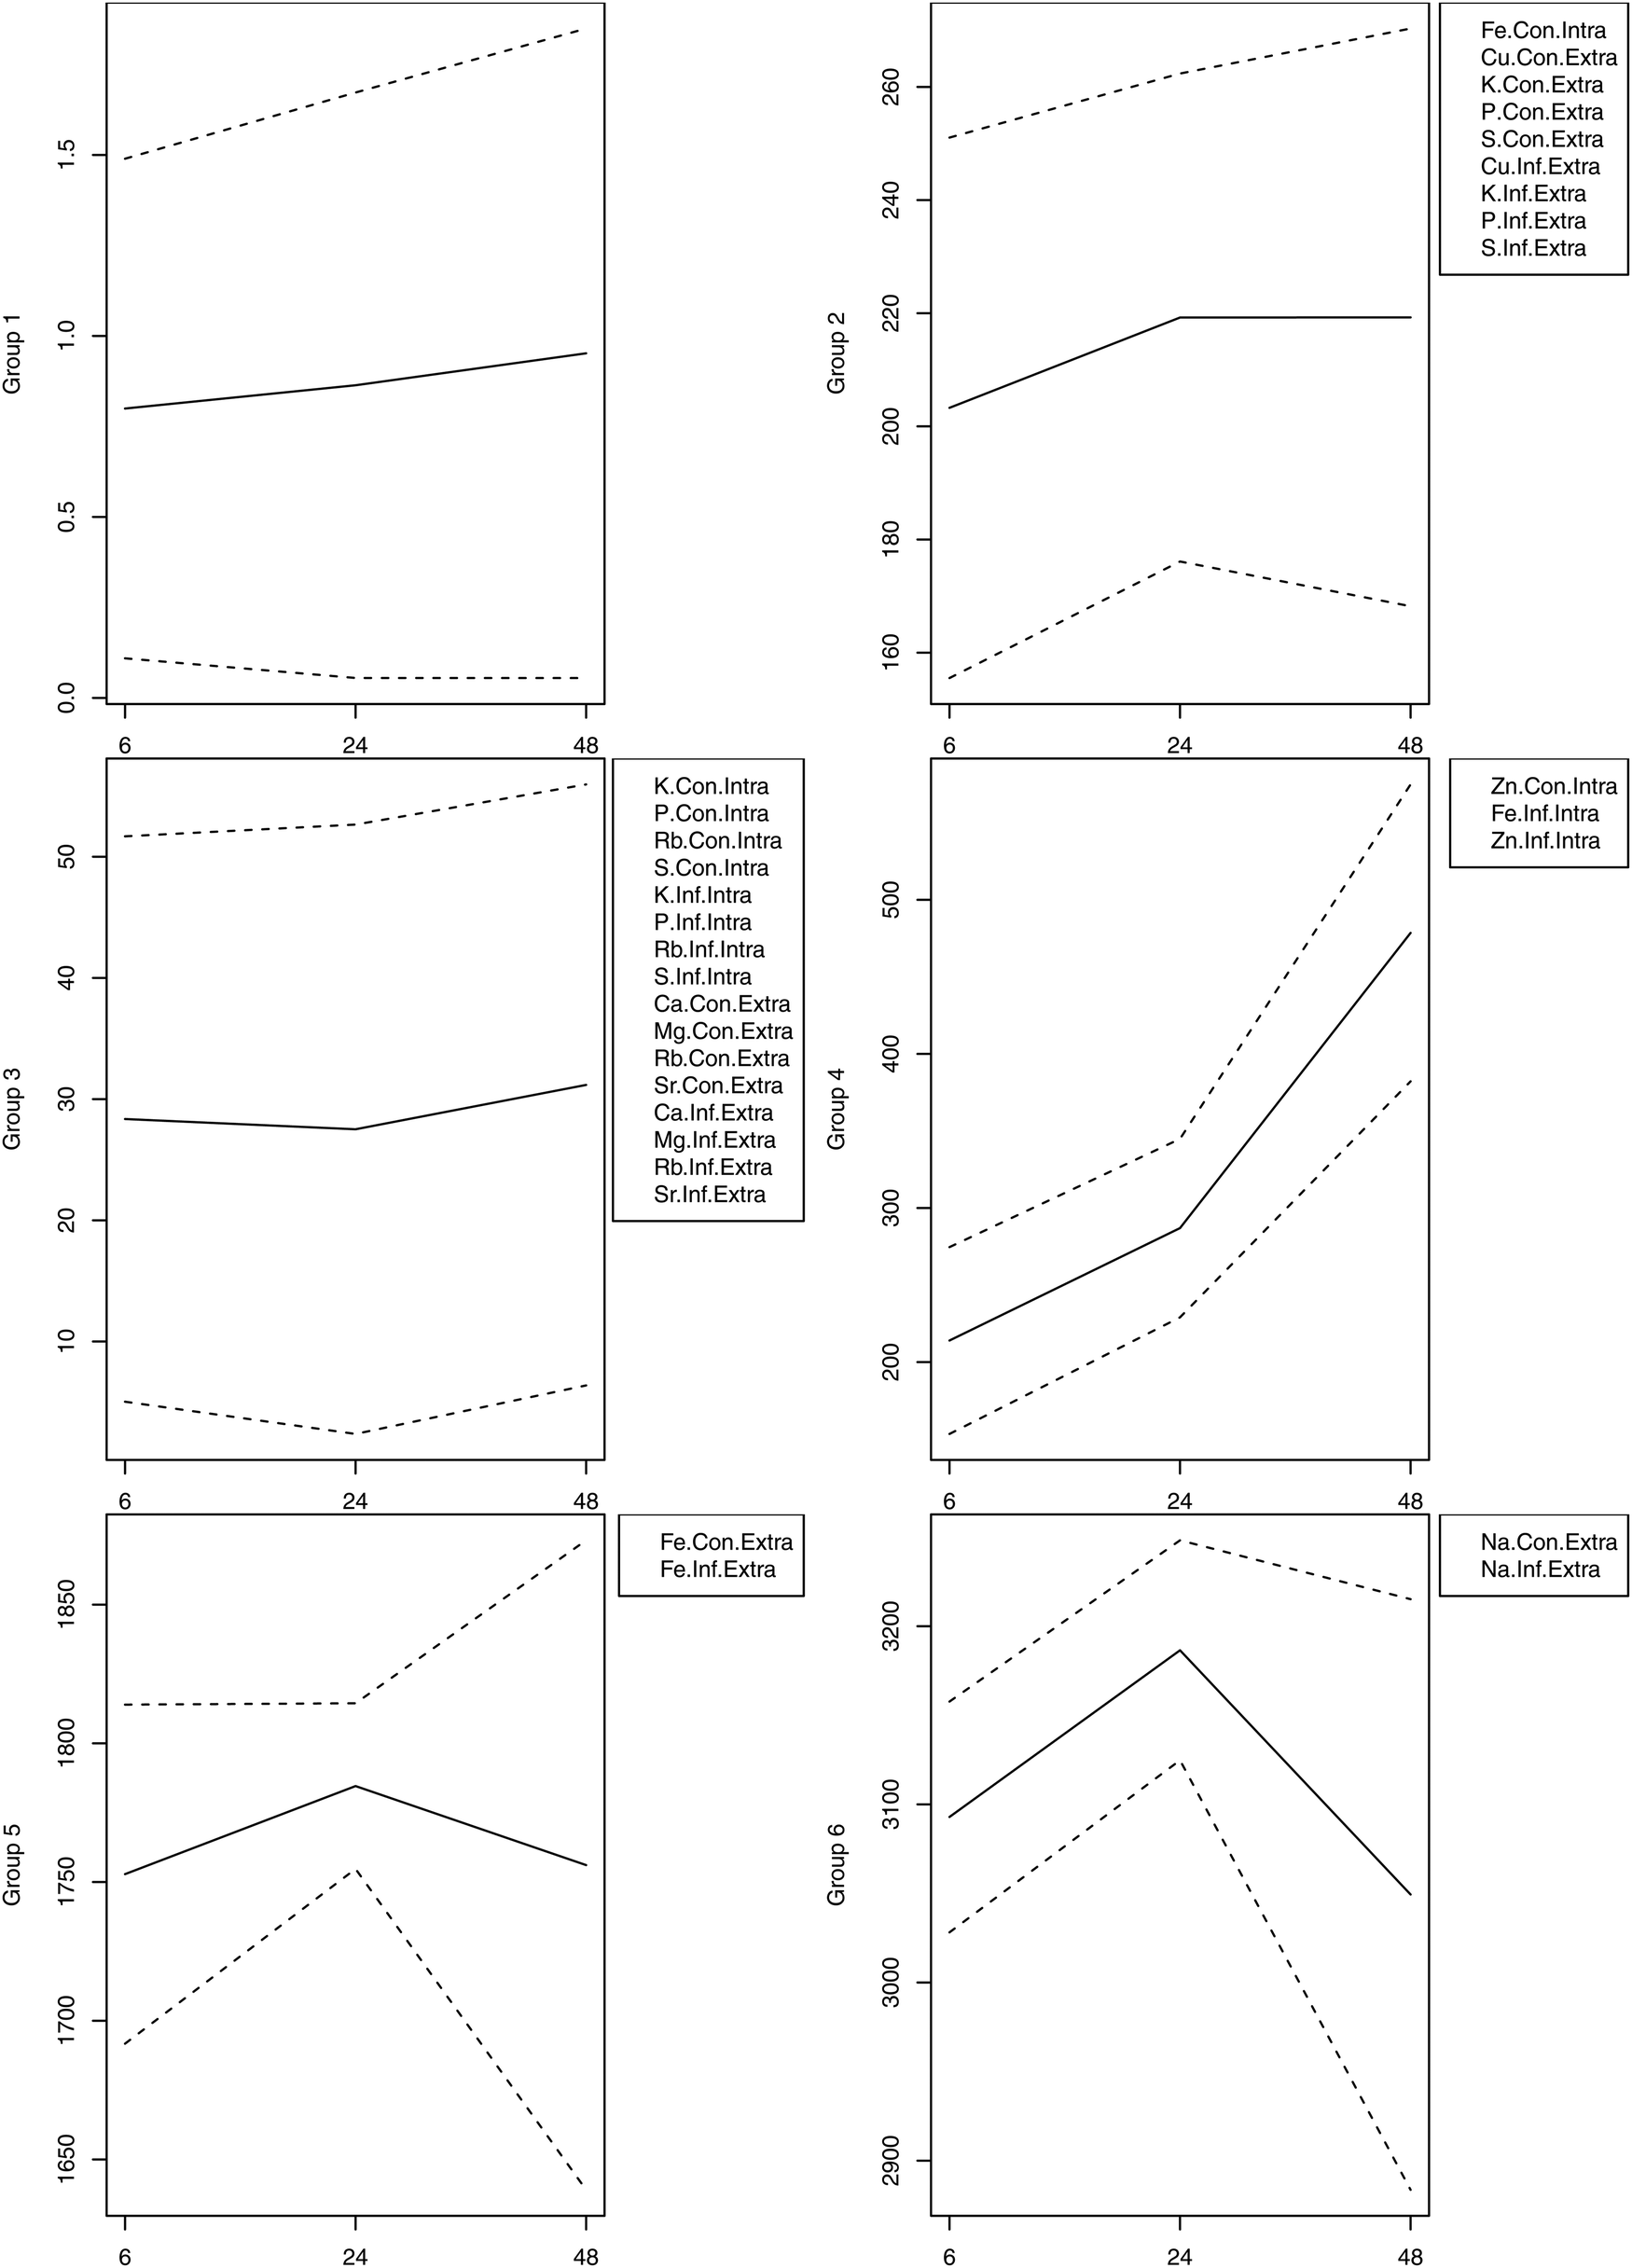 | ||
| Fig. 4 Overall trends of the elements within the sub-clusters. The hierarchical clustering was divided into six groups of elements. The number of elements, including infected (Inf) and control (Con), and intracellular (Intra) and extracellular (Extra), in each cluster are listed in the box next to the corresponding group, with the exception of group 1, which contained the remaining elements. The mean (solid line) was calculated across the individual replicates, which constituted the elements in each group. The kinetic shape templates (mean ± 1 SD; dashed line) represent the span of all the elemental profiles of similar dynamic patterns in a single cluster. The x-axis denotes time in hours post infection and the y-axis represents the elemental concentration. | ||
3.2. Elemental content of purified parasite preparation
The elemental composition of T. gondii tachyzoites was also determined. Zn and Cu were the most abundant elements, representing 74% and 13% of the total parasite elemental content, respectively. Fe, Mn and P constituted 5%, 3% and 2%, respectively, whereas each of Na, S, and Rb accounted for ∼1% (Fig. 5).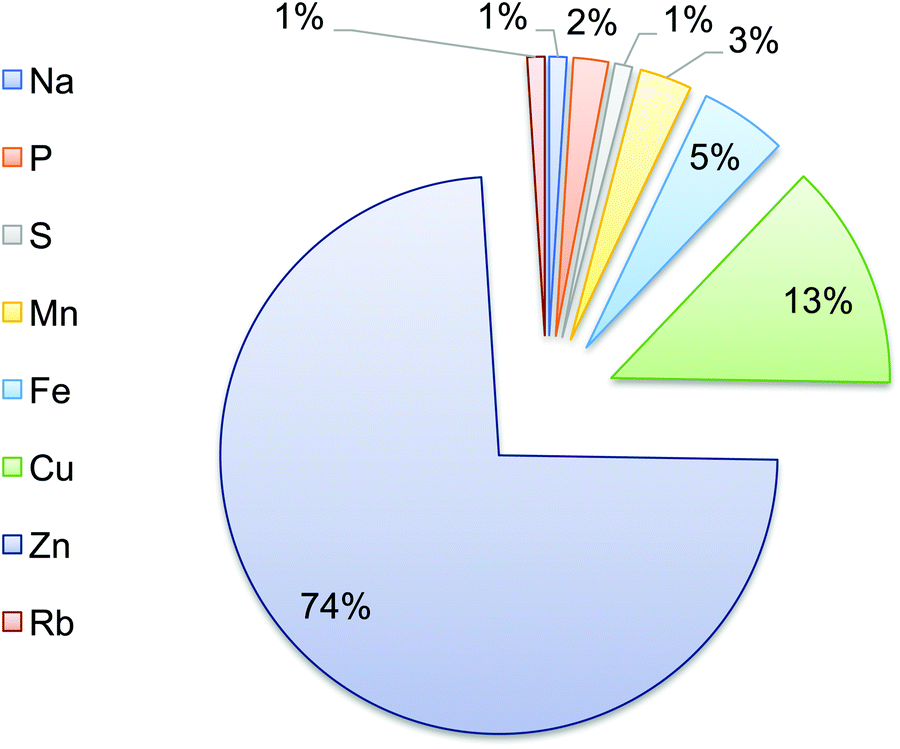 | ||
| Fig. 5 Elemental composition of the parasite. Proportions of trace elements in T. gondii tachyzoites. Sodium (Na), phosphorous (P), sulfur (S), manganese (Mn), iron (Fe), copper (Cu), zinc (Zn), and rubidium (Rb). | ||
3.3. Trace element levels in T. gondii-infected ECs using synchrotron μ-XRF
The micrometer resolution of synchrotron-based X-ray fluorescence microscopy (μ-XRF) enabled mapping and quantification of the level of elements in ECs infected with T. gondii. Maps of Ca and Zn at 6, 24, and 48 hpi of infected and control cells are shown in (ESI,† Fig. S3 and S4). Elemental imaging showed that Zn was significantly reduced only at 48 hpi compared with uninfected cells (p < 0.05), whereas Ca was increased at 48 hpi in infected cells, but the difference was not statistically significant (Fig. 6). Average concentration of the metal content inside single cells was calculated using a connected-components labelling algorithm. The levels of Ca and Zn obtained using this image processing approach showed a similar trend to the results obtained based on the analysis of hot spots in the cell monolayer (Fig. 7).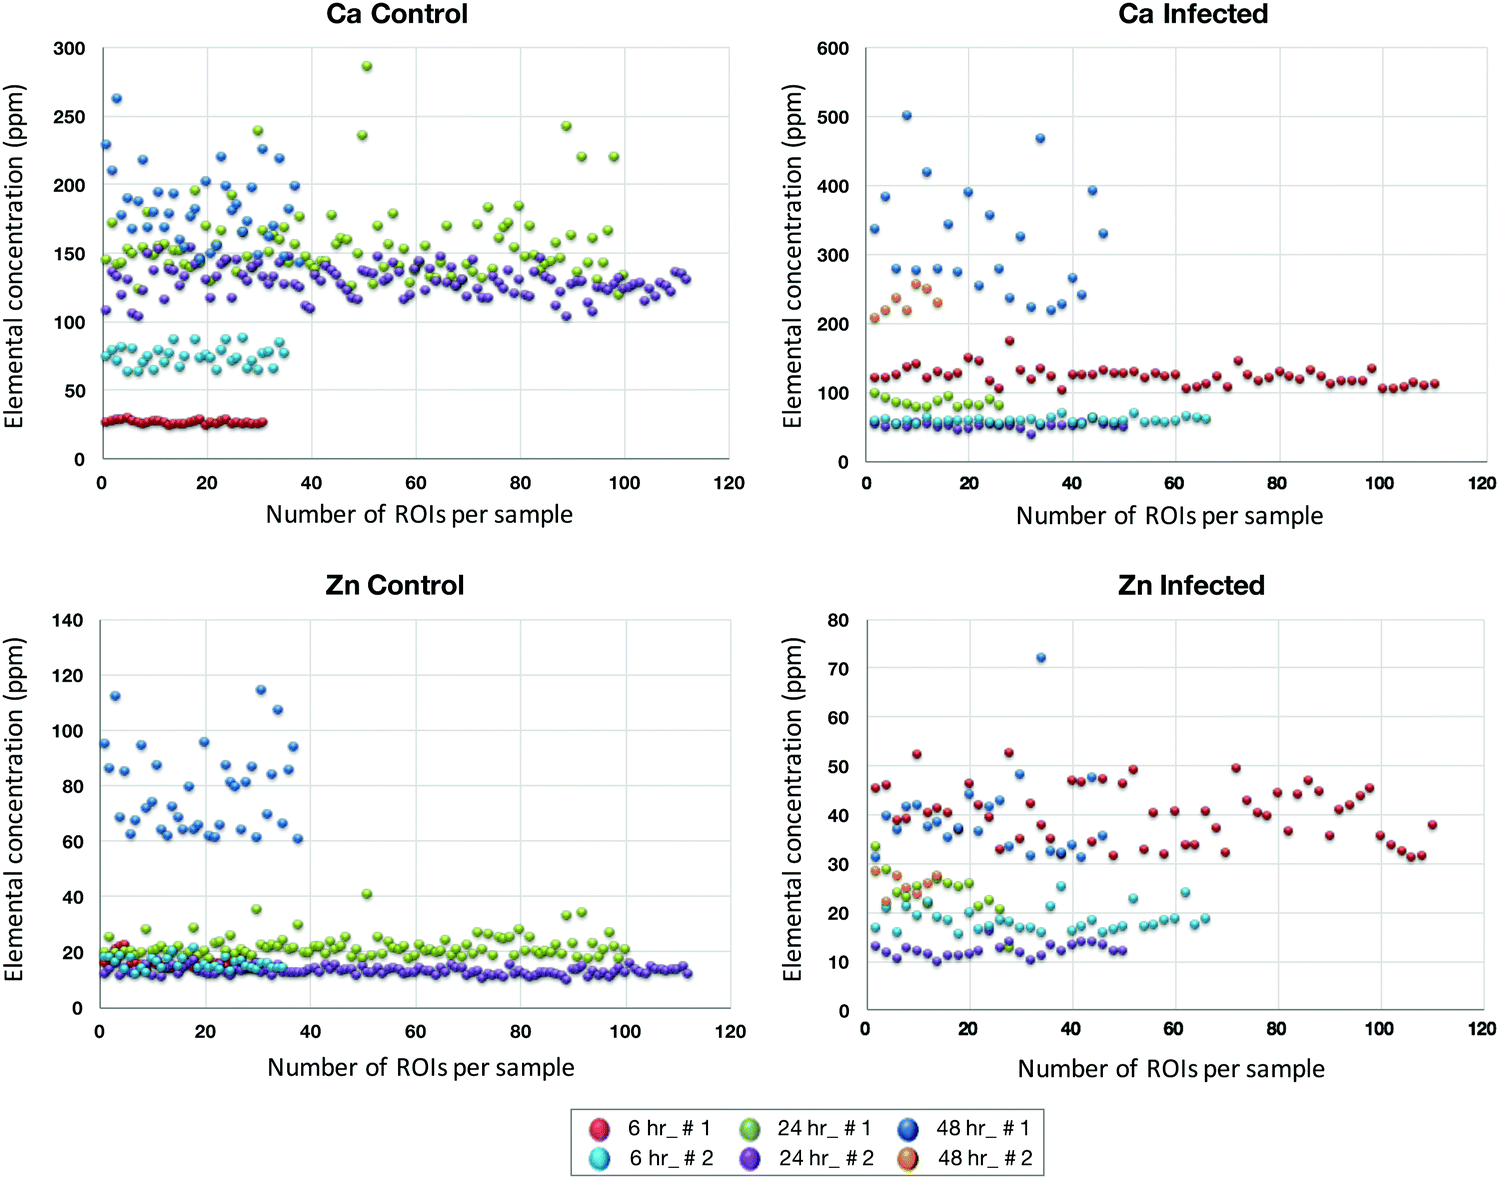 | ||
| Fig. 6 Scatter plots showing the differences in the levels of Ca and Zn measured by μ-XRF at different time points after infection, in the infected cells and their corresponding controls. The X-axis indicates the number of the regions of interest (ROIs) analyzed per sample and the Y-axis represents the concentrations of the elements (ppm). The values represent two biological replicates (indicated as # 1 and # 2) from infected and uninfected (control) samples at the three indicated time points following infection. | ||
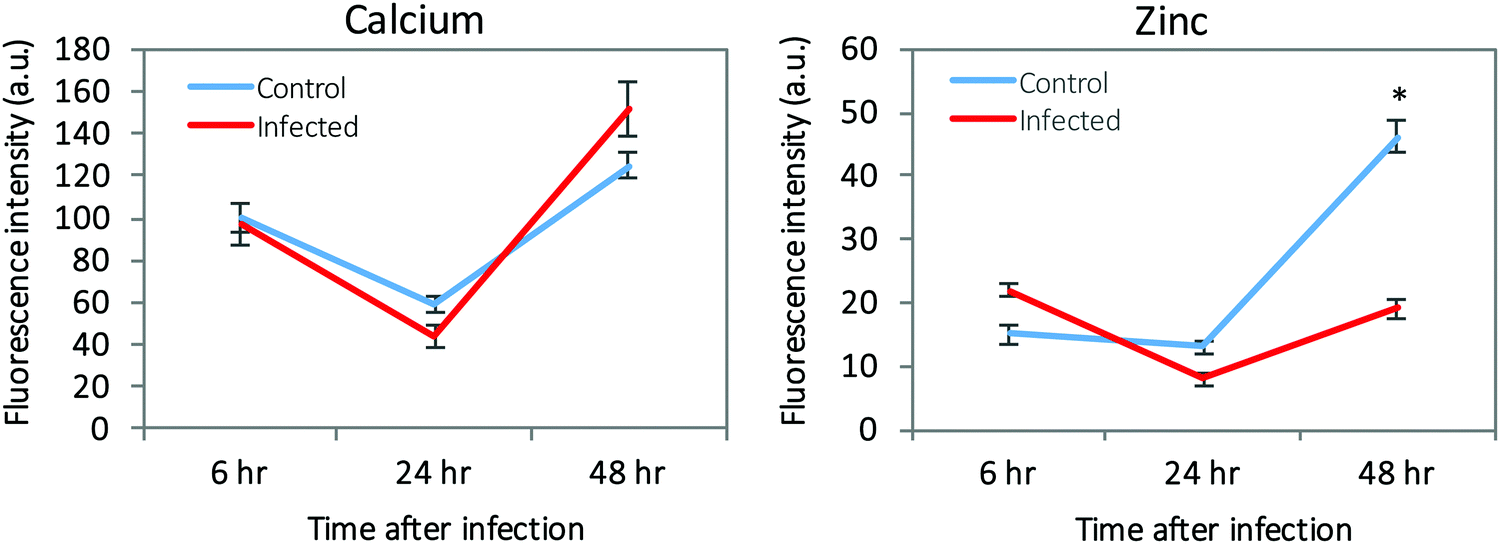 | ||
| Fig. 7 The intracellular levels of Ca and Zn determined by single cell analysis of the μ-XRF elemental maps. p < 0.05 is indicated by (*). | ||
3.4. Gene expression microarray data
Affymetrix GeneChip™ Human Gene 2.1 ST microarray analysis of mRNA isolated from ECs, 6, 24, and 48 hpi revealed significant changes in overall gene expression. Principal component analysis (PCA) of gene expression profiles showed distinct transcriptional signatures among the six groups of samples (Fig. 8). Further analysis showed significant gene expression values (p-value with FDR was ≤0.05 and fold change >2 or <−2) in the metallothioneins (MT) – cysteine-rich, metal-binding proteins. Intensity values (LS mean) of the MT1JP, MT1M, MT1E, MT1F, and MT1X genes increased as the time of the infection reached 48 hpi (Fig. 9). These results were also confirmed by the heatmap and hierarchical clustering dendrogram (Fig. 10). Differential expression of MT1M and MT1JP genes was detected at 6, 24 and 48 hpi. Interestingly, MT1E, MT1F, MT1X genes showed lower gene expression at 6 hpi compared to MT1M and MT1JP. Gene expression increased gradually at 24 hpi for these three genes. The five genes showed similar gene expression after 48 hpi. These results show that the expression of MT1 isoforms JP, E, F, and X increased significantly in cells infected with T. gondii compared to uninfected cells.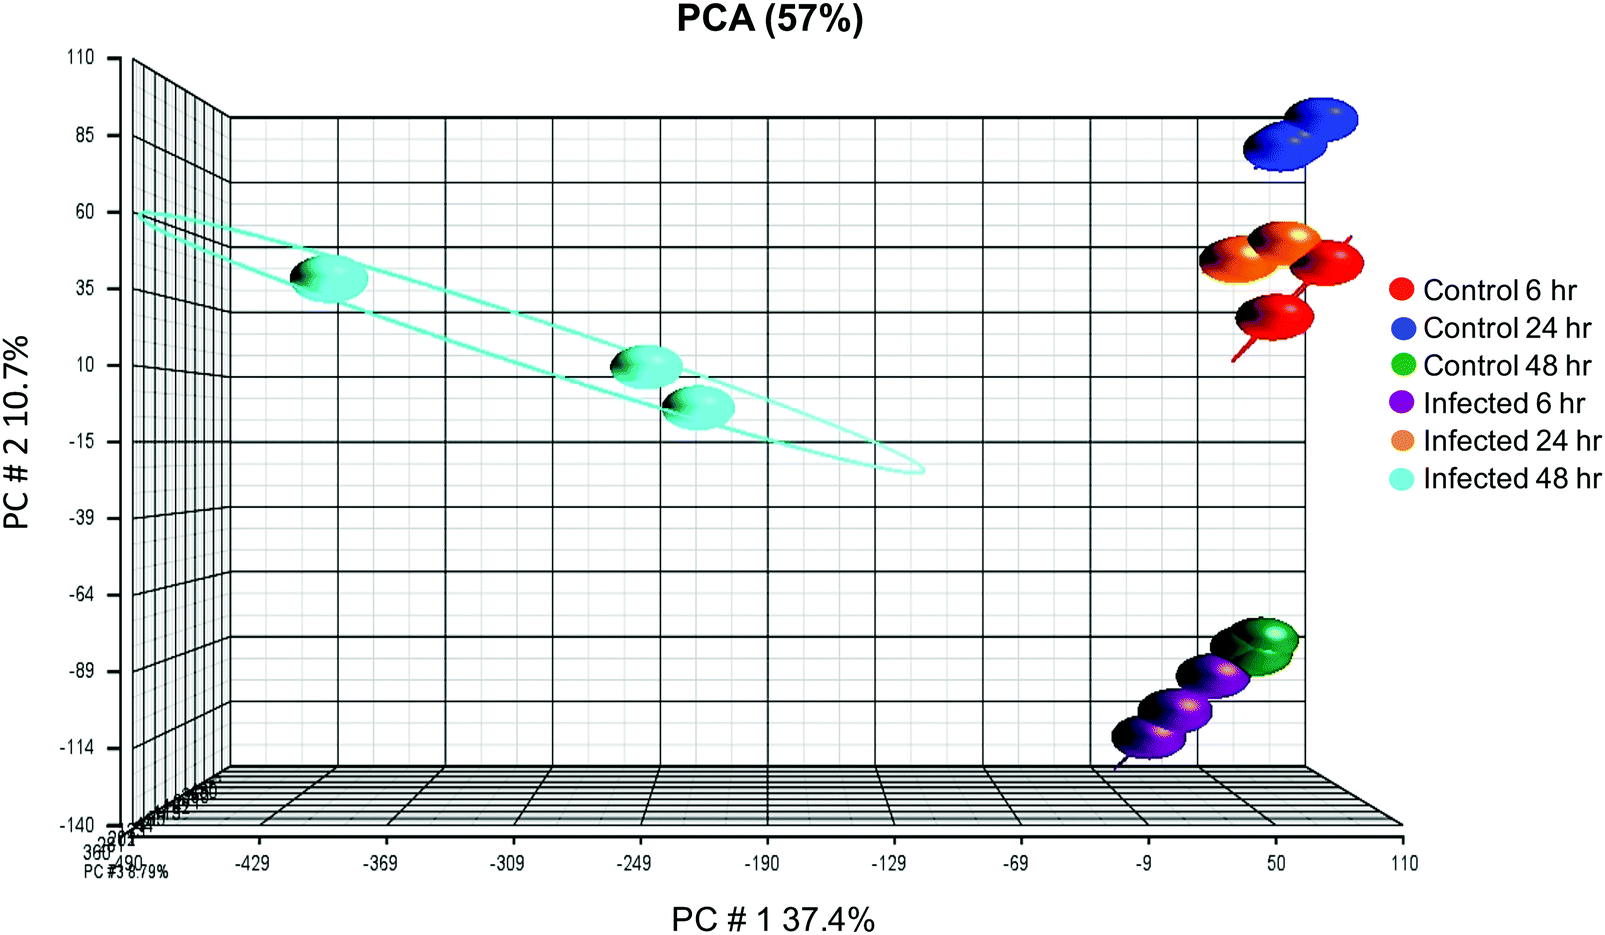 | ||
| Fig. 8 Principal component analysis (PCA) showing transcriptomic differences between expression microarray data of both uninfected and infected ECs. Samples were analyzed at 6, 24 and 48 h after exposure to T. gondii. Each sample group is represented by a sphere and is color-coded to indicate the corresponding control/infection category. There was a clear difference in the transcriptomic clustering at 48 h between uninfected and infected samples, suggesting that infection had an influence on gene expression changes in the host cells over time. | ||
 | ||
| Fig. 9 XY plots showing the intensity of each metallothionein gene (MT1X, MT1E, MT1F, MT1M and MT1JP) across sample groups. Each point (triangle) is the LS mean value of all samples from the same group. The intensity value for the five metallothionein genes increased as the time of the infection progressed compared to controls. | ||
 | ||
| Fig. 10 Heatmap and hierarchical clustering dendrogram for five metallothionein genes (MT1X, MT1E, MT1F, MT1M and MT1JP). Results are expressed as fold change of gene expression of infected ECs compared to uninfected ECs at 6 h, 24 h and 48 h after exposure to T. gondii. The red color represents upregulation of expression, grey color indicates an unchanged expression, and blue color represents downregulation of expression. The pattern and length of the branches in the dendrogram reflect the relatedness of the samples. Expression of the metallothionein genes was mostly downregulated in all uninfected samples, whereas in infected samples gene expression increases as infection progresses. | ||
4. Discussion
The availability and restriction of elements are important aspects of the host–pathogen interaction.7 In the present study, we determined the changes in the concentrations of 24 elements in T. gondii-infected and uninfected ECs, the main constituent of the BBB, at 6, 24 and 48 hpi using ICP-MS. Significant increases were noted in the intracellular levels of Zn, Fe, Mn, and Cu (p < 0.01) in infected cells compared with control cells. Significant decreases were noted in the extracellular levels of Co, Cu, Mo, V, and Ag in infected cells compared with the controls. Zn was also the most abundant element in the parasite elemental composition.We also used synchrotron radiation-based μ-XRF with <5 micron spatial resolution to assess the alterations in levels of Zn, Ca, Fe, and Cu distribution, as well as other elements in ECs following T. gondii infection. This elemental imaging showed Zn as the element most likely to be influenced during T. gondii infection of ECs. We also developed an image analysis pipeline to uniquely identify and analyse individual cells within cell monolayers and to quantify the metal content inside the selected individual cells. Results obtained by μ-XRF imaging, whether based on cell monolayers or single cell levels, were consistent and showed a reduction in the level of Zn in infected cells at 48 hpi, indicating that single cell analysis was sufficiently sensitive to be representative of the intracellular metal concentration in the infected cell population. Reduction of Zn in infected cells at 48 hpi may be attributed to Zn sequestration by host cells, as a defense strategy to limit the intracellular growth of this parasite.
While the bulk ICP-MS analysis suggested elevated Zn in the infected cells, μ-XRF imaging showed reduced concentration of Zn at 48 hpi. This discrepancy between the results obtained by the two methods might be accounted for by factors such as the heterogeneity of the cell population, as the ECs can have variable sizes, metal content, and in some cases cell overlapping occurred, which makes absolute quantification of metal content from the measured μ-XRF difficult. By contrast, the bulk ICP-MS sampling could not be restricted to individual cells or well-characterized single monolayers. It is also likely that the concentration of Zn examined by μ-XRF imaging may have been altered by fixation. The spatial distribution and concentration of the elements can be significantly altered in formalin-fixed samples20 and in samples subjected to immunochemical treatment prior to imaging.21 For example, 40% and 77% reduction in endogenous Fe and Zn, respectively has been observed in brain tissues fixed in formalin.22 Substantial leaching of elements from the brain tissue into the formalin has been also detected, and the leaching varied considerably between different elements and was time-dependent.23 Therefore, fixation of the infected ECs, for health and safety reasons, with 4% paraformaldehyde prior to μ-XRF imaging may have inevitably introduced an artificial effect and caused leaching of some elements from the cells into the fixative. It is therefore appropriate to cautiously interpret μ-XRF imaging-based metal data derived from fixed cells in the present study. Future studies could compare the elemental differences between fixed samples and fresh or frozen samples, and assess new ways of preparing the samples with less potentially-disruptive protocols for μ-XRF imaging analysis.
Microarray analysis of gene expression performed on infected and control cells using Affymetrix GeneChip revealed infection-specific upregulation of five genes; MT1JP, MT1M, MT1E, MT1F, and MT1X. These genes belong to the metallothionein (MT) gene family, encoding small, cysteine-rich, heavy metal-binding proteins, which play an important role in the homeostasis of transition metals (e.g. Fe, Zn and Cu) and detoxification of non-essential trace elements, such as cadmium (Cd) and mercury (Hg),24 and cell proliferation.25 MTs are also stress response proteins that are induced in response to triggers, such as oxidative stress, infection, inflammation, and heavy metals,26 to protect against reactive oxygen species (ROS),27via their free radical scavenging ability.28,29 Because agents that produce reactive oxygen intermediates are known to induce MT, one should anticipate a marked induction of MTs during T. gondii infection. Increased expression of these MT genes in infected cells compared to uninfected cells support the results obtained by ICP-MS, emphasizing the key role of Zn and other differentially abundant elements in mediating the host–parasite interaction.
Although the main focus of our work was a search for differential elemental levels in infected versus uninfected cells, it is noteworthy to highlight the clinical relevance of our findings. T. gondii infection stimulates immune cells to produce ROS and Th1-derived cytokines, such as interferon-gamma (IFN-γ) to limit parasite growth.4 The increased level of Zn in infected cells might be related to its anti-inflammatory and antioxidant activities30–32 to protect host cells from oxidative stress and DNA damage,33,34 known to be associated with T. gondii infection.35 Zn can reduce the production of tumor necrosis factor-alpha (TNF-α) and prevents the formation of free radicals.32 This anti-oxidative stress (OS) effect of Zn has been attributed to down-regulation of the expression of ROS-producing inflammatory cytokines, such as TNF-α and interleukin-1β.36 Zn can also limit nitric oxide (NO) production in endothelial cells by inhibiting NF-κB-dependent expression of inducible NO synthase (iNOS).37,38 Further, Zn plays a role in maintaining the integrity of vascular endothelial cells, possibly by regulating signaling events to inhibit host cell death.39–41 Zn deficiency can induce apoptosis42 and disrupts cell membrane barrier integrity and increases the secretion of IL-8 and neutrophil transmigration.43
Our results also showed elevated levels of Fe in infected cells, indicating that Fe is essential for parasite growth. Fe is a cofactor of many enzymes involved in diverse cellular processes including respiration and DNA replication.44 Obligatory intracellular parasites, such as T. gondii, possess mechanisms to obtain Fe from the host cell to sustain its own replication. This parasite hijacks Fe from the host cells by binding to transferrin receptor (TfR) during cell entry. The host expression of TfR was up-regulated in T. gondii-infected cells, suggesting that the parasite uses the host endocytic pathway and H.O.S.T. structure for Fe acquisition.45 Our data also showed increases in the levels of Mn and Cu in T. gondii-infected cells compared with uninfected controls. Finally, a significant decrease in the extracellular levels of Co, Cu, Mo, V, and Ag was detected between infected and uninfected cells. The biological relevance of the differential levels of these elements in the pathogenesis of T. gondii infection remains to be elucidated.
5. Conclusion
Elemental profiling of ECs infected with T. gondii was accomplished using a combination of sensitive ICP-MS analysis and non-invasive μ-XRF imaging. Overall, our in vitro time course study showed a correlation between T. gondii infection and increased intracellular levels of Zn, Fe, Mn and Cu in the ECs, and increased expression of MT1 isoforms. These ICP-MS-based data suggest that T. gondii parasite promotes a rise in the intracellular level of Zn, potentially to sustain its own growth. Five metallothionein genes; MT1JP, MT1M, MT1E, MT1F, and MT1X, were upregulated in infected cells, providing support for increased intracellular zinc levels. These genes should be included in further studies of the effects of T. gondii infection on the regulation of metal transporters in host cells. μ-XRF imaging of a heterogeneous cell population both at monolayer and individual cell levels revealed that Zn decreases in infected cells at 48 hpi. These findings demonstrate the importance of further understanding of the regulatory processes involved in metal dyshomeostasis during T. gondii infection.Conflicts of interest
There are no conflicts of interest to declare.Acknowledgements
The authors gratefully acknowledge the support provided by The UK's National Synchrotron Science facility, Diamond Light Source at Harwell Science and Innovation Campus, Oxfordshire, for access to I18-the microfocus spectroscopy beamline (proposal number SP8504) that contributed to the X-ray fluorescence results presented in the manuscript. A. T. A. was supported by a PhD studentship from Ministry of Higher Education of Iraq.Notes and references
- N. J. Abbott, Astrocyte–endothelial interactions and blood–brain barrier permeability, J. Anat., 2002, 200, 629–638 CrossRef PubMed.
- U. Kniesel and H. Wolburg, Tight junctions of the blood–brain barrier, Cell. Mol. Neurobiol., 2000, 20, 57–76 CrossRef PubMed.
- S. Eyal, P. Hsiao and J. D. Unadkat, Drug interactions at the blood–brain barrier: fact or fantasy?, Pharmacol. Ther., 2009, 123, 80–104 CrossRef PubMed.
- H. M. Elsheikha and N. A. Khan, Protozoa traversal of the blood–brain barrier to invade the central nervous system, FEMS Microbiol. Rev., 2010, 34, 532–553 CrossRef PubMed.
- J. M. Berg and Y. Shi, The galvanization of biology: a growing appreciation for the roles of zinc, Science, 1996, 271, 1081–1085 CrossRef PubMed.
- A. H. Shankar and A. S. Prasad, Zinc and immune function: the biological basis of altered resistance to infection, Am. J. Clin. Nutr., 1998, 68, 447S–463S CrossRef PubMed.
- U. E. Schaible and S. H. Kaufmann, Iron and microbial infection, Nat. Rev. Microbiol., 2004, 2, 946–953 CrossRef PubMed.
- E. D. Weinberg, Iron loading and disease surveillance, Emerging Infect. Dis., 1999, 5, 346–352 CrossRef PubMed.
- K. Seyerk, S. Pasa, F. Kiral, A. Bildik, C. Babur and S. Kilic, Levels of zinc, copper and magnesium in sheep with toxoplasmosis, Uludag Univ. J. Fac. Vet. Med., 2004, 23, 39–42 Search PubMed.
- E. M. Al-Khshab and H. S. Al-Bakry, Zinc and copper levels in seropositive toxoplasmosis women in Mosul-Iraq, Rafidain J. Sci., 2009, 20, 37–41 Search PubMed.
- L. Yang, R. McRae, M. M. Henary, R. Patel, B. Lai, S. Vogt and C. J. Fahrni, Imaging of the intracellular topography of copper with a fluorescent sensor and by synchrotron X-ray fluorescence microscopy, Proc. Natl. Acad. Sci. U. S. A., 2005, 102, 11179–11184 CrossRef PubMed.
- C. J. Fahrni, Biological applications of X-ray fluorescence microscopy: exploring the subcellular topography and speciation of transition metals, Curr. Opin. Chem. Biol., 2007, 11, 121–127 CrossRef PubMed.
- E. Malucelli, M. Fratini, A. Notargiacomo, A. Gianoncelli, L. Merolle, A. Sargenti, C. Cappadone, G. Farruggia, S. Lagomarsino and S. Iotti, Where is it and how much? Mapping and quantifying elements in single cells, Analyst, 2016, 141, 5221–5235 RSC.
- D. Hare, C. Austin and P. Doble, Quantification strategies for elemental imaging of biological samples using laser ablation-inductively coupled plasma-mass spectrometry, Analyst, 2012, 137, 1527–1537 RSC.
- H. M. Elsheikha, B. M. Rosenthal, A. J. Murphy, D. B. Dunams, D. A. Neelis and L. S. Mansfield, Generally applicable methods to purify intracellular coccidia from cell cultures and to quantify purification efficacy using quantitative PCR, Vet. Parasitol., 2006, 135, 223–234 CrossRef PubMed.
- H. M. Elsheikha, C. L. McKinlay, N. A. Elsaied and P. A. Smith, Effects of Neospora caninum infection on brain microvascular endothelial cells bioenergetics, Parasites Vectors, 2013, 6, 24 CrossRef PubMed.
- H. M. Elsheikha, M. Alkurashi, K. Kong and X. Q. Zhu, Metabolic footprinting of extracellular metabolites of brain endothelium infected with Neospora caninum in vitro, BMC Res. Notes, 2014, 7, 406 CrossRef PubMed.
- J. F. Mosselmans, P. D. Quinn, A. J. Dent, S. A. Cavill, S. D. Moreno, A. Peach, P. J. Leicester, S. J. Keylock, S. R. Gregory, K. D. Atkinson and J. R. Rosell, I18-the microfocus spectroscopy beamline at the Diamond Light Source, J. Synchrotron Radiat., 2009, 16, 818–824 CrossRef PubMed.
- V. A. Solé, E. Papillon, M. Cotte, P. H. Walter and J. Susini, A multiplatform code for the analysis of energy-dispersive X-ray fluorescence spectra, Spectrochim. Acta, Part B, 2007, 62, 63–68 CrossRef.
- M. Morello, A. Canini, P. Mattioli, R. P. Sorge, A. Alimonti, B. Bocca, G. Forte, A. Martorana, G. Bernardi and G. Sancesario, Sub-cellular localization of manganese in the basal ganglia of normal and manganese-treated rats - An electron spectroscopy imaging and electron energy-loss spectroscopy study, Neurotoxicology, 2008, 29, 60–72 CrossRef PubMed.
- G. Robison, T. Zakharova, S. Fu, W. Jiang, R. Fulper and R. Barrea, et al., X-Ray Fluorescence Imaging: A New Tool for Studying Manganese Neurotoxicity, PLoS One, 2012, 7(11), e48899 CrossRef PubMed.
- M. Schrag, A. Dickson, A. Jiffry, D. Kirsch, H. V. Vinters and W. Kirsch, The effect of formalin fixation on the levels of brain transition metals in archived samples, BioMetals, 2010, 23(6), 1123–1127 CrossRef PubMed.
- K. Gellein, T. P. Flaten, K. M. Erikson, M. Aschner and T. Syversen, Leaching of trace elements from biological tissue by formalin fixation, Biol. Trace Elem. Res., 2008, 121(3), 221–225 CrossRef PubMed.
- C. D. Klaassen, J. Liu and B. A. Diwan, Metallothionein protection of cadmium toxicity, Toxicol. Appl. Pharmacol., 2009, 238, 215–220 CrossRef PubMed.
- R. Jin, J. Huang, P. H. Tan and B. H. Bay, Clinicopathological significance of metallothioneins in breast cancer, Pathol. Oncol. Res., 2004, 10, 74–79 CrossRef PubMed.
- M. Yoshida, Y. Saegusa, A. Fukuda, Y. Akama and S. Owada, Measurement of radical scavenging ability in hepatic metallothionein of rat using in vivo electron spin resonance spectroscopy, Toxicology, 2005, 213, 74–80 CrossRef PubMed.
- B. Ruttkay-Nedecky, L. Nejdl, J. Gumulec, O. Zitka, M. Masarik, T. Eckschlager, M. Stiborova, V. Adam and R. Kizek, The role of metallothionein in oxidative stress, Int. J. Mol. Sci., 2013, 14, 6044–6066 CrossRef PubMed.
- G. K. Andrews, Regulation of metallothionein gene expression by oxidative stress and metal ions, Biochem. Pharmacol., 2000, 59, 95–104 CrossRef PubMed.
- M. Sato and I. Bremner, Oxygen free radicals and metallothionein, Free Radical Biol. Med., 1993, 14, 325–337 CrossRef PubMed.
- B. Bao, A. S. Prasad, F. W. Beck, J. T. Fitzgerald, D. Snell, G. W. Bao, T. Singh and L. J. Cardozo, Zinc decreases C-reactive protein, lipid peroxidation, and inflammatory cytokines in elderly subjects: a potential implication of zinc as an atheroprotective agent, Am. J. Clin. Nutr., 2010, 91, 1634–1641 CrossRef PubMed.
- A. S. Prasad, Effects of zinc deficiency on Th1 and Th2 cytokine shifts, J. Infect. Dis., 2000, 182, S62–S68 CrossRef PubMed.
- A. S. Prasad, F. W. Beck, B. Bao, J. T. Fitzgerald, D. C. Snell, J. D. Steinberg and L. J. Cardozo, Zinc supplementation decreases incidence of infections in the elderly: effect of zinc on generation of cytokines and oxidative stress, Am. J. Clin. Nutr., 2007, 85, 837–844 CrossRef PubMed.
- P. I. Oteiza, M. S. Clegg, M. P. Zago and C. L. Keen, Zinc deficiency induces oxidative stress and AP-1 activation in 3T3 cells, Free Radical Biol. Med., 2000, 28, 1091–1099 CrossRef PubMed.
- E. Ho, C. Courtemanche and B. N. Ames, Zinc deficiency induces oxidative DNA damage and increases p53 expression in human lung fibroblasts, J. Nutr., 2003, 133, 2543–2548 CrossRef PubMed.
- E. Y. Denkers, L. Kim and B. A. Butcher, In the belly of the beast: subversion of macrophage proinflammatory signalling cascades during Toxoplasma gondii infection, Cell. Microbiol., 2003, 5, 75–83 CrossRef PubMed.
- A. S. Prasad, B. Bao, F. W. Beck, O. Kucuk and F. H. Sarkar, Anti-oxidant effect of zinc in humans, Free Radical Biol. Med., 2004, 37, 1182–1190 CrossRef PubMed.
- J. D. Kruse-Jarres, The significance of zinc for humoral and cellular immunity, J. Trace Elem. Electrolytes Health Dis., 1989, 3, 1–8 Search PubMed.
- M. M. Cortese-Krott, L. Kulakov, C. Opländer, V. Kolb-Bachofen, K. D. Kröncke and C. V. Suschek, Zinc regulates iNOS-derived nitric oxide formation in endothelial cells, Redox Biol., 2014, 2, 945–954 CrossRef PubMed.
- P. Meerarani, P. Ramadass, M. Toborek, H. C. Bauer, H. Bauer and B. Hennig, Zinc protects against apoptosis of endothelial cells induced by linoleic acid and tumor necrosis factor alpha, Am. J. Clin. Nutr., 2000, 71, 81–87 CrossRef PubMed.
- F. W. Sunderman Jr., The influence of zinc on apoptosis, Ann. Clin. Lab. Sci., 1995, 25, 134–142 Search PubMed.
- D. Beyersmann and H. Haase, Functions of zinc in signaling, proliferation and differentiation of mammalian cells, Biometals, 2001, 14, 331–341 CrossRef PubMed.
- M. Seve, F. Chimienti and A. Favier, Role of intracellular zinc in programmed cell death, Pathol. Biol., 2002, 50, 212–221 CrossRef PubMed.
- A. Finamore, M. Massimi, L. Conti Devirgiliis and E. Mengheri, Zinc deficiency induces membrane barrier damage and increases neutrophil transmigration in Caco-2 cells, J. Nutr., 2008, 138, 1664–1670 CrossRef PubMed.
- J. E. Cassat and E. P. Skaar, Iron in infection and immunity, Cell Host Microbe, 2013, 13, 509–519 CrossRef PubMed.
- M. Gail, U. Gross and W. Bohne, Transferrin receptor induction in Toxoplasma gondii-infected HFF is associated with increased iron-responsive protein 1 activity and is mediated by secreted factors, Parasitol. Res., 2004, 94, 233–239 CrossRef PubMed.
Footnotes |
| † Electronic supplementary information (ESI) available. See DOI: 10.1039/c8mt00136g |
| ‡ Current address: Department of Veterinary Public Health, College of Veterinary Medicine and Science, Basra University, Iraq. |
| This journal is © The Royal Society of Chemistry 2018 |