Accurate density functional theory (DFT) protocol for screening and designing chain transfer and branching agents for LDPE systems†
Received
3rd September 2017
, Accepted 21st November 2017
First published on 21st November 2017
Abstract
In this work, a density functional theory (DFT) methodology was developed and validated against experimental data for relative hydrogen abstraction (Cs) and monomer reactivity ratio (r1) parameters associated with free radical polymerization. For hydrogen abstraction, we considered ethane, cyclohexane, 2-butanone, propylene, isobutene, isobutane and propanal while methyl methacrylate, vinyl acetate, 1-butene, propylene and isobutene were the molecules of choice for benchmarking r1. It was shown that the M06-2X/6-311+G(3df,2p)//B3LYP/6-31+G(d,p) level of theory along with the counterpoise correction for the basis set superposition error (BSSE) produced estimated values in excellent agreement with experimental data. The calculated parameters were within a factor of 1.5 from the experimental values. This translated into a maximum error of 0.32 kcal mol−1 in Gibbs free energy of activation difference. The only exception was Cs for ethane with an experimental-to-calculated ratio of 3.0. Even then, the DFT estimate was within the experimental error. Furthermore, the approach managed to capture a wide range of empirical parameters as well as distinguish between monomers with close values. This robust and computationally inexpensive method can be applied to elucidate the reactivity of much larger species of industrial importance and rationally design the next generation of branching and chain-transfer agents for low density polyethylene (LDPE) systems.
Design, System, Application
We provide a robust and accurate DFT methodology for estimating the relative hydrogen abstraction and monomer reactivity parameters for LDPE systems. The approach can be used to elucidate the chemical transformations at the atomistic level and, subsequently, design novel chain-transfer and branching agents to affect the molecular weight and polydispersity of materials synthesized by high temperature and pressure free radical polymerization.
|
Introduction
Low-density polyethylene (LDPE) is manufactured via free radical polymerization conducted at high temperature and pressure (up to 350 °C and 3000 bar).1 The mechanistic steps of the process are well known and involve initiation, propagation, termination, chain-transfer to polymer and β-scission reactions.2–4 Ultimately, under typical production conditions, these chemical transformations lead to the formation of long polymer chains and a significant amount of branching which cause lower tensile strength, higher resilience and reduced density.1,5,6 However, control of the molecular weight, polydispersity and branching density through process variables (monomer and initiator feed, temperature, pressure, etc.) is often limited. Hence, it is customary to employ chain-transfer agents (CTAs) and/or branching agents (BAs) to help tailor resin molecular weight distribution and physical properties.7 CTAs are usually small molecules capable of losing a hydrogen atom to a propagating polymer chain via free-radical abstraction. This leads to earlier polymer growth termination and reduced polymer molecular weights while retaining the overall radical concentration (i.e., CTAs do not act as inhibitors). BAs, on the other hand, can be larger species with multiple functionalities whose chief purpose is to incorporate into polymer chains through copolymerization and form so-called H- and T-branches (Fig. 1), increasing branching density and molecular weight. However, BAs can also act as CTAs depending on their chemical structure and hydrogen availability. Therefore, the balance between BA hydrogen abstraction and its propensity to copolymerize will determine its effectiveness, since these two properties work in opposition in terms of managing resin molecular weight and branching distribution.
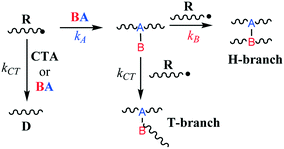 |
| | Fig. 1 Simplified mechanism of H- and T-branch formation. | |
The grand challenge is to elucidate the reactivity of the branching agents and rationally design them to produce polymers with specific properties. Certainly, a good BA will be inexpensive to synthesize and require low dosing to keep production costs low.
Given the high temperature and pressure conditions for LDPE, experimental high-throughput screening of CTAs and BAs would be extremely challenging. Thus, computational approaches using process models to predict branching density become very appealing. However, even the best kinetic models require reliable reaction rate parameters for the various chemical transformations. Unfortunately, generating experimental rate parameter data is often difficult and expensive. Therefore, quantum mechanical (QM) results can help screen potential candidates, recommend novel compounds, and, ultimately, identify the best materials.
In the past three decades, numerous QM studies for a plethora of monomers have appeared in the chemical literature.8–24 With the advances in high-performance computing capability that have accompanied this period, the investigation of larger species has become more tractable. These advances are of particular importance to industry where quick results are often needed to enable decision making. Nonetheless, a compromise between accuracy and speed is often necessitated. In this work, we present a density functional theory (DFT) approach for accurate calculation of the relative rate parameters for hydrogen abstraction and propagation. In order to validate this approach, we focus on small molecules for which experimental data is available. Using the technique described below, much larger and more complex species can be studied. Moreover, we demonstrate that the approach is accurate over a wide range of values as well as capable of distinguishing agents with similar reactivity.
Model development
Density functional theory (DFT) methodology and transition state theory (TST)
All quantum mechanical (QM) calculations were performed using the density functional theory (DFT) formalism as implemented in the Gaussian09 commercial software package.25 The geometries were optimized in the gas phase using Becke's three parameter hybrid exchange functional (B3),26 the correlation functional of Lee, Yang and Parr (LYP),27 and the 6-31+G(d,p) basis set.28–30 The geometry with the lowest electronic energy of all species and transition states (TSs) was found by a combination of conventional optimization and one-dimensional potential energy dihedral scans. All transition states (TSs) were verified by the presence of a single imaginary frequency and its visualization to ensure that the TS led to the desired products and reactants. When visualization of the imaginary vibrational mode was insufficient to validate the TS, the intrinsic reaction coordinate (IRC) was followed in both directions.31 The temperature correction to the free energy was calculated using the frequencies from the full optimization at the B3LYP/6-31+G(d,p) level of theory with the harmonic oscillator (HO) approximation by means of standard formulae from statistical thermodynamics.32 In order to improve the calculated electronic energy contribution, single-point (SP) energy calculations were performed at the M06-2X/6-311+G(3df,2p)//B3LYP/6-31+G(d,p) level of theory, where M06-2X is the hybrid meta-generalized gradient approximation (hybrid-metaGGA) within DFT, developed by Truhlar and co-workers.33 In addition, to reduce the basis set superposition error (BSSE), the counterpoise34,35 correction (CP) calculations were adopted. The calculated Gibbs free energies were used in eqn (1) to estimate the rate parameters associated with hydrogen abstraction and propagation.36| |  | (1) |
In eqn (1), σ is the reaction path degeneracy, κ(T) is the tunneling coefficient, T is the absolute temperature of interest, n is the molecularity of the reaction, C0 is the standard state concentration (the inverse of the reference volume in the translational partition function), ΔG≠ is the Gibbs free energy of activation, and kB, h, and R are the Boltzmann, Plank's and the universal gas constants, respectively. Eqn (1) was also used to derive the Arrhenius pre-exponential factor and activation energy for the reaction steps by constructing a plot of ln(k) versus 1/T. Whenever necessary, different isomers of the molecules and multiple reaction pathways were considered (see discussion below).
In the literature, a significant effort has been done to improve on the accuracy of the calculated rate parameters by adopting the 1D-hindered rotor (1D-HR) corrections to the partition functions8,10,12–14,23,24 as well as various tunneling approximations.10,13,14,37–39 Depending on the nature of the system, choice of basis sets and functionals, the results have had mixed effects at the temperature of LDPE synthesis.10,39 Moreover, in certain cases, these calculations can lead to a significant increase in the computational time.23,24 Therefore, we decided to test the performance of the HO approximation at the M06-2X/6-311+G(3df,2p)//B3LYP/6-31+G(d,p) level of theory. The results ultimately showed that the 1D-HR and tunneling correction were not necessary and may lead to overestimation of the relative rate parameters. Certainly, we do not exclude that the accuracy of the results may partly be due to cancelation of error. Moreover, this investigation places significant emphasis on the importance of multiple reaction pathways and shows that neglecting their contribution can lead to erroneous results.
Multiple reaction pathways
Chemical reactions may proceed via one or more pathways.36,40 A schematic for a bimolecular reaction between a propagation radical (R) and species M (monomer, CTA, BA, etc.) is illustrated in Fig. 2. For clarity, only two distinct pathways are considered. In pathway 1, reactants R and M form the transition state [R–M]≠ which leads directly to the final product R–M. Pathway 2 incorporates two additional intermediates –M′ and R–M′ which are rotational isomers of M and R–M, respectively. In this scheme, no isomers of R were considered. If the addition of M to R is the rate limiting step for the product formation along pathway 2, then M′ and M will be in equilibrium. Ultimately, the total reaction rate for the formation of the product R–M in Fig. 2 is the sum of the rates along each possible pathway. Eqn (2) shows the final result.| |  | (2) |
where| |  | (3) |
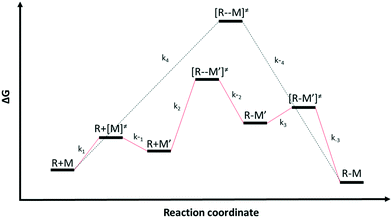 |
| | Fig. 2 Schematics of two different reaction pathways (pathway 1 in black and pathway 2 in red) connecting the reactants (R) and (M) and the final product (R–M). The overall reaction is R + M → R–M | |
R0 and M0 are the total concentrations of R and M distributed among all isomers and ΔG is the Gibbs free energy difference between isomers M and M′. The product Kk2 is the effective rate constant (keffective) along pathway 2 as calculated by applying eqn (1) for k2 and eqn (3) for K. Thus, for a reaction involving i possible pathways and m reactants each with n isomers, the total rate coefficient will be equal to the sum of the effective rate constants associated with each pathway scaled by a factor accounting for the distribution of all isomers (eqn (4)). If only a single isomer is considered, then kieffective = ki and the scaling factor is unity. In this work, eqn (1) was used to calculate the rate coefficient along each pathway and eqn (4) was employed to estimate the total rate coefficient when multiple pathways and/or isomers were present.
| |  | (4) |
Results and discussion
Cluster model
Using full DFT calculations to model reaction rate coefficients involving long polymer chains is an impossible task due to the large size of the system. Therefore, it is important to decide how many repeat units are sufficient to estimate the rate coefficient without sacrificing accuracy. In LDPE systems, the amount of branching or CTA agent is usually much smaller that the concentration of ethylene and the polymer chain can be approximated as consisting entirely of ethylene. We investigated the change in the pre-exponential factor and activation energy for the addition of ethylene to unimer (E˙), dimer (EE˙), trimer (EEE˙), and tetramer (EEEE˙) radical. In addition, all radicals were capped with a methyl moiety at the end. Results are shown in Table 1. Our calculations show that the activation energy changes little with the size of the system. The only significant variation involves the smallest radical. The same is true for the pre-exponential factor. Therefore, we decided that using the trimer-to-tetramer system (EEE˙ + E) which provides a good compromise between computational time and accuracy. Furthermore, the calculated values for the pre-exponential factor and activation energy are in excellent agreement with the results from Goto et al.2 and Buback and Beuermann,41 respectively. The good agreement with the absolute rate parameters, on the other hand, is somewhat fortuitous due to the effect of the system pressure. Eqn (1) does not allow us to calculate activation volume due to cancelation of the pressure dependence in the translational partition function and the standard state correction. Moreover, the variability of the experimentally determined activation volume can be rather large as demonstrated by the values of Goto et al.2 and Buback and Beuermann.41 Therefore, we focused the rest of this study on relative rate parameters, thus, almost eliminating any pressure dependence.44 Chain length dependence for ethylene has been previously studied.8 It was shown that 1D-HR corrections lead to much higher pre-exponential factors than HO and, therefore, it was decided that the 1D-HR model would not be used in this work.
Table 1 Experimental and calculated Arrhenius parameters for the addition of ethylene (E) to a propagating chain consisting of a different number of monomer units
| Species |
A (L mol−1 s−1) |
A/Aunimer |
E
a (kcal mol−1) |
ΔV≠(cc mol−1) |
k
p @ 423 K/2500 bar(L mol−1 s−1) |
| E˙ + E |
1.29 × 10⁸ |
1.00 |
8.52 |
— |
5.18 × 10³ |
| EE˙ + E |
1.92 × 10⁸ |
1.49 |
8.62 |
— |
6.88 × 10³ |
| EEE˙ + E |
1.78 × 10⁸ |
1.38 |
8.62 |
— |
6.35 × 10³ |
| EEEE˙ + E |
1.85 × 10⁸ |
1.43 |
8.63 |
— |
6.59 × 10³ |
|
Exp (Buback)
41
|
1.88 × 10
7
|
0.15
|
8.20
|
−27.4
|
7.48 × 10
3
|
|
Exp (Goto)
2
|
1.56 × 10
8
|
1.21
|
10.5
|
−19.7
|
2.28 × 10
3
|
In Table 1, the estimated pre-exponential factor and activation energy are for the total rate coefficient and take into account multiple reaction pathways. Ethylene is a symmetric molecule which belongs to the D2h point group. It has two equivalent faces and carbon atoms. Hence, ethylene has a rotational symmetry number and reaction path degeneracy of four. On the other hand, there are three approach trajectories and TSs (one anti at 180.0° and two equivalent gauche at −57.7° and +57.7°). They are demonstrated in Fig. 3. The calculated reaction coefficient is the sum of the reaction coefficients along each trajectory with the appropriate reaction path degeneracy.
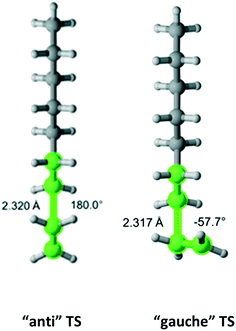 |
| | Fig. 3 Anti (180°) and gauche (−57.7°) transition states for the addition of an ethylene molecule to a propagating radical comprised of three ethylene units and a methyl group. Length of the forming bond at the transition state and dihedral angle of the highlighted atoms are indicated. Carbon and hydrogen atoms are in gray and white, respectively. All images were generated with CYLview.41 | |
A good branching agent will form a large number of branches at very low incorporation concentrations. This is determined by the relative magnitude of its ability to donate a hydrogen atom and being added into the growing polymer chains. CTAs, on the other hand, are solely jugged on their propensity to lose hydrogens. To this end, we investigated the accuracy we could achieve in estimating Cs (the ratio of the rate coefficient of hydrogen abstraction to ethylene homo-propagation) and r1 (the monomer reactivity ratio or the ratio of homo-propagation of ethylene to the addition of a molecule through its double bond). Because ethylene is by far the dominant species in LDPE systems, the terminal polymerization model43 sufficiently describes the process.
Relative parameters for hydrogen abstraction (Cs)
In order to validate the chosen DFT methodology, seven small molecules with a wide range of known experimental Cs values were chosen.44 These were ethane, cyclohexane, 2-butanone, propylene, isobutene, isobutane and propanal.
Ethane
Ethane (Fig. 4) belongs to the D3d symmetry point group. This translates into a reaction path degeneracy of six. We found only one TS which results from an “anti” interaction between the radical and monomer. Table 2 provides the calculated Arrhenius parameters and shows that the calculated Cs is in excellent agreement with the experimental result.
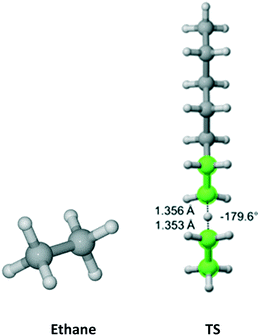 |
| | Fig. 4 Ethane and its “anti” transition state for hydrogen abstraction by the propagating radical. Length of the forming bond at the transition state and dihedral angle of the highlighted atoms are indicated. Carbon and hydrogen atoms are in gray and white, respectively. All images were generated with CYLview.42 | |
Table 2 Calculated Cs value for hydrogen abstraction from ethane
| Species |
σ
|
A (L mol−1 s−1) |
E
a (kcal mol−1) |
k
H@130 °C (L mol−1 s−1) |
C
s
@130 °C |
|
C
s = kH/kp where kp is the calculated homo-propagation rate coefficient for ethylene using the trimer-to-tetramer model presented in Table 1.
|
| Ethane TS |
6 |
8.19 × 10⁸ |
16.7 |
0.729 |
0.0002 |
|
Exp
|
|
|
|
|
0.0006 ± 0.0005
|
Cyclohexane
Cyclohexane (Fig. 5) belongs to the D3d symmetry point group at short time scale – six equivalent equatorial and six equivalent axial hydrogens. We found four distinct TSs associated with abstraction from the axial position and three TSs leading to equatorial abstraction. In Fig. 5, TS2 and TS4 have equivalent in energy, non-superimposable TSs at 132.9° and −134.7°, respectively. This is reflected in the reaction path degeneracy factor (σ) in Table 3. It is clear that lower Ea is associated with abstraction of axial hydrogens. However, on the Gibbs free energy surface, abstraction along the pathway with TS4 is most favorable. Overall, half of the total Cs is due to axial abstraction and half to equatorial.
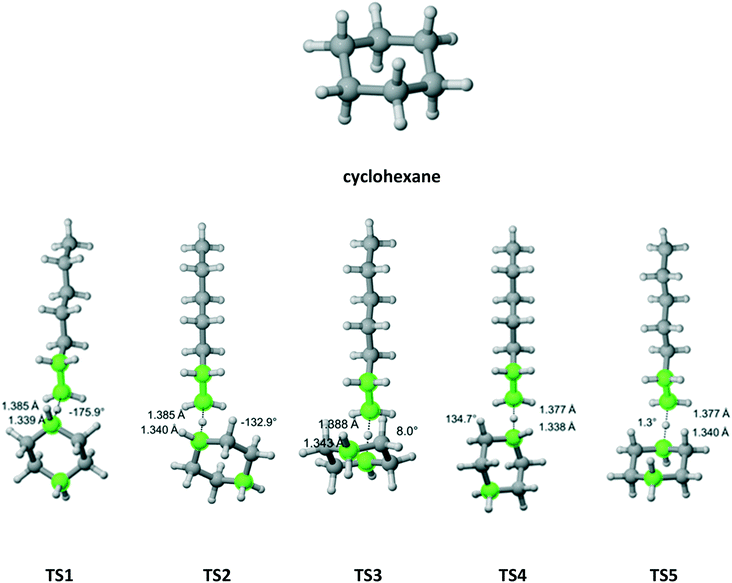 |
| | Fig. 5 Cyclohexane and its seven transition states (there are two equivalent in energy TS4 – one shown forming dihedral angle of 134.7° and the other one at −134.7° and two equivalent in energy TS2 – one shown at −132.9 and one at 132.9°) for hydrogen abstraction by the propagating radical. Length of the forming bond at the transition state and dihedral angle of the highlighted atoms are indicated. Carbon and hydrogen atoms are in gray and white, respectively. All images were generated with CYLview.42 | |
Table 3 Calculated Cs value for hydrogen abstraction from cyclohexane
| Species |
σ
|
A (L mol−1 s−1) |
E
a (kcal mol−1) |
k
H@130 °C (L mol−1 s−1) |
C
s
@130 °C |
|
C
s = kH/kp where kp is the calculated homo-propagation rate coefficient for ethylene using a trimer-to-tetramer model presented in Table 1.
|
| Cyclohexane TS1 |
6 |
2.90 × 10⁸ |
14.6 |
3.41 |
0.0009 |
| Cyclohexane TS2 |
12 |
6.78 × 10⁸ |
14.6 |
7.84 |
0.0021 |
| Cyclohexane TS3 |
6 |
4.16 × 10⁸ |
15.3 |
2.17 |
0.0006 |
| Cyclohexane TS4 |
12 |
1.63 × 10⁹ |
15.1 |
11.1 |
0.0029 |
| Cyclohexane TS5 |
6 |
4.52 × 10⁸ |
15.1 |
2.90 |
0.0008 |
|
Total C
s
|
|
|
|
|
0.0073
|
|
Exp
|
|
|
|
|
0.0095 ± 0.0003
|
2-Butanone
2-Butanone belongs to the Cs symmetry point group. Hydrogen abstraction can occur from the alpha methyl group (3 equivalent hydrogens), the methylene bridge (two equivalent hydrogens) or the beta methyl group (three equivalent hydrogens). Fig. 6 shows that there are three distinct pathways for attack on each of the hydrogens of the methyl groups and two for each of the hydrogens on the methylene bridge. Table 4 summarizes the Arrhenius parameters and Cs values for each pathway. As expected, the most reactive moiety is the methylene bridge, followed by the alpha and beta methyl groups. The overall Cs value is within the experimental error.
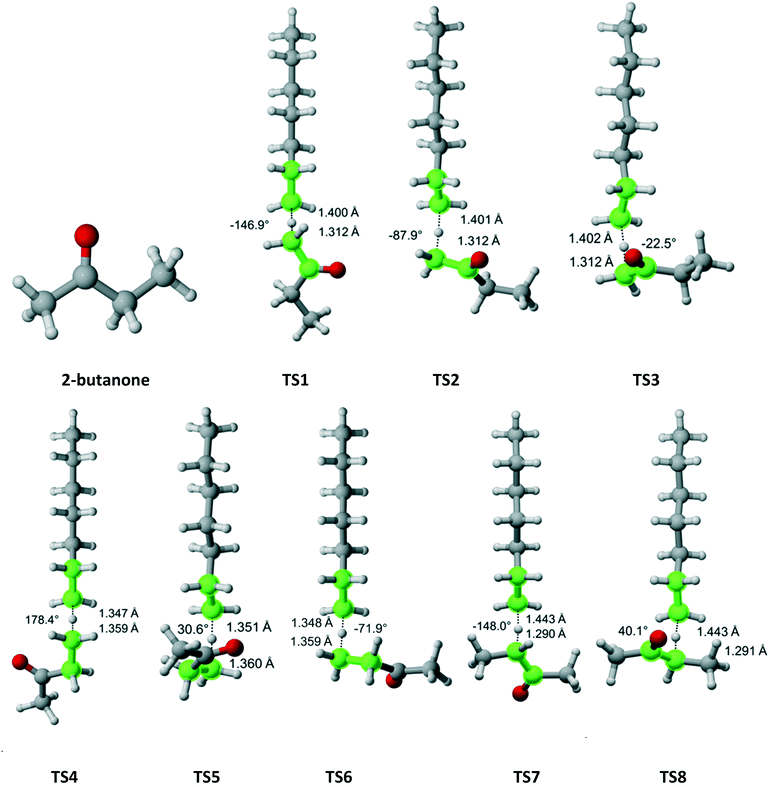 |
| | Fig. 6 2-Butanone and its eight transition states for hydrogen abstraction by the propagating radical. Length of the forming bond at the transition state and dihedral angle of the highlighted atoms are indicated. Carbon and hydrogen atoms are in gray and white, respectively. All images were generated with CYLview.42 | |
Table 4 Calculated Cs value for hydrogen abstraction from 2-butanone
| Species |
σ
|
A (L mol−1 s−1) |
E
a (kcal mol−1) |
k
H@130 °C (L mol−1 s−1) |
C
s
@130 °C |
|
C
s = kH/kp where kp is the calculated homo-propagation rate coefficient for ethylene using a trimer-to-tetramer model presented in Table 1.
|
| 2-Butanone TS1 |
3 |
7.03 × 10⁵ |
12.1 |
0.201 |
0.000 |
| 2-Butanone TS2 |
3 |
1.09 × 10⁸ |
12.9 |
11.6 |
0.003 |
| 2-Butanone TS3 |
3 |
7.58 × 10⁵ |
11.8 |
0.320 |
0.000 |
| 2-Butanone TS4 |
3 |
3.32 × 10⁸ |
16.6 |
0.329 |
0.000 |
| 2-Butanone TS5 |
3 |
6.79 × 10⁷ |
16.5 |
0.077 |
0.000 |
| 2-Butanone TS6 |
3 |
1.57 × 10⁸ |
16.7 |
0.136 |
0.000 |
| 2-Butanone TS7 |
2 |
7.70 × 10⁷ |
11.2 |
63.7 |
0.017 |
| 2-Butanone TS8 |
2 |
1.12 × 10⁸ |
11.0 |
127 |
0.034 |
|
Total C
s
|
|
|
|
|
0.055
|
|
Exp
|
|
|
|
|
0.060 ± 0.005
|
Propylene
Propylene belongs to the Cs point group (Fig. 7). It has a methyl group with three equivalent hydrogen atoms next to a double bond. We found three distinct reaction pathways for each of the methyl hydrogens. The results are summarized in Table 5. The largest contribution to the overall Cs value is from the pathway along TS2.
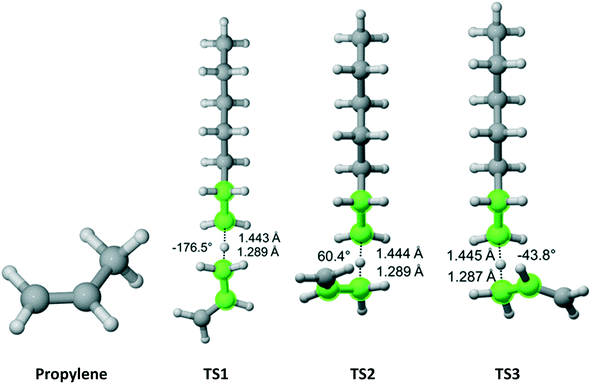 |
| | Fig. 7 Propylene and its three transition states for hydrogen abstraction by the propagating radical. Length of the forming bond at the transition state and dihedral angle of the highlighted atoms are indicated. Carbon and hydrogen atoms are in gray and white, respectively. All images were generated with CYLview.42 | |
Table 5 Calculated Cs value for hydrogen abstraction from propylene
| Species |
σ
|
A (L mol−1 s−1) |
E
a (kcal mol−1) |
k
H@130 °C (L mol−1 s−1) |
C
s
@130 °C |
|
C
s = kH/kp where kp is the calculated homo-propagation rate coefficient for ethylene using a trimer-to-tetramer model presented in Table 1.
|
| Propylene TS1 |
3 |
2.91 × 10⁸ |
13.3 |
17.6 |
0.0047 |
| Propylene TS2 |
3 |
3.27 × 10⁸ |
13.1 |
26.6 |
0.0071 |
| Propylene TS3 |
3 |
1.92 × 10⁸ |
13.0 |
17.3 |
0.0046 |
|
Total C
s
|
|
|
|
|
0.0164
|
|
Exp
|
|
|
|
|
0.0122 ± 0.0008
|
Isobutane
Isobutane has C3v symmetry (Fig. 8) with one hydrogen on the tertiary carbon and nine other hydrogens on three equivalent methyl groups. We discovered one TS that leads to the abstraction of the tertiary carbon hydrogen. Furthermore, we found out that one TS is associated with each hydrogen (three total) pointing in the direction parallel to the one for the hydrogen on the tertiary carbon and two TSs associated with each of the other six hydrogens. The results are summarized in Table 6. As expected, almost all of the overall Cs value is due to hydrogen abstraction from the tertiary carbon.
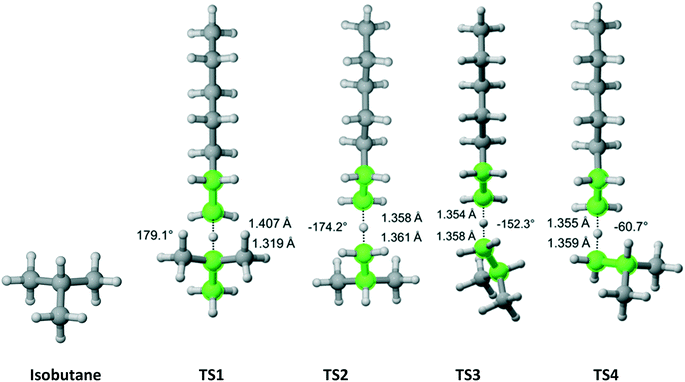 |
| | Fig. 8 Isobutane and its four transition states for hydrogen abstraction by the propagating radical. Length of the forming bond at the transition state and dihedral angle of the highlighted atoms are indicated. Carbon and hydrogen atoms are in gray and white, respectively. All images were generated with CYLview.42 | |
Table 6 Calculated Cs value for hydrogen abstraction from isobutane
| Species |
σ
|
A (L mol−1 s−1) |
E
a (kcal mol−1) |
k
H@130 °C (L mol−1 s−1) |
C
s
@130 °C |
|
C
s = kH/kp where kp is the calculated homo-propagation rate coefficient for ethylene using a trimer-to-tetramer model presented in Table 1.
|
| Isobutane TS1 |
3 |
2.34 × 10⁸ |
12.8 |
26.9 |
0.0072 |
| Isobutane TS2 |
3 |
4.17 × 10⁸ |
16.8 |
0.346 |
0.0001 |
| Isobutane TS3 |
6 |
6.82 × 10⁸ |
16.8 |
0.563 |
0.0001 |
| Isobutane TS4 |
6 |
1.01 × 10⁹ |
16.8 |
0.833 |
0.0002 |
|
Total C
s
|
|
|
|
|
0.0076
|
|
Exp
|
|
|
|
|
0.0072 ± 0.0003
|
Isobutene
Isobutene has C2v point group symmetry and two equivalent methyl groups with a total of 6 hydrogen atoms (Fig. 9). We discovered two distinct pathways associated with each hydrogen. The results are presented in Table 7. The rate coefficient along TS1 accounts for 63.6% of the total Cs parameter.
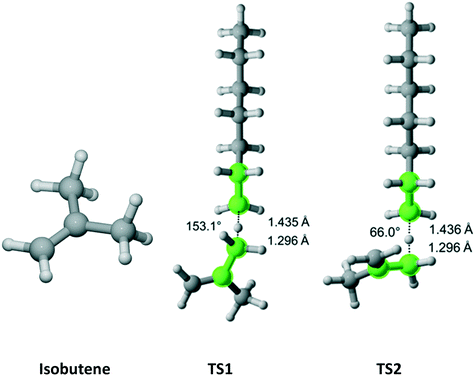 |
| | Fig. 9 Isobutene and its two transition states for hydrogen abstraction by the propagating radical. Length of the forming bond at the transition state and dihedral angle of the highlighted atoms are indicated. Carbon and hydrogen atoms are in gray and white, respectively. All images were generated with CYLview.42 | |
Table 7 Calculated Cs value for hydrogen abstraction from isobutene
| Species |
σ
|
A (L mol−1 s−1) |
E
a (kcal mol−1) |
k
H@130 °C (L mol−1 s−1) |
C
s
@130 °C |
|
C
s = kH/kp where kp is the calculated homo-propagation rate coefficient for ethylene using a trimer-to-tetramer model presented in Table 1.
|
| Isobutane TS1 |
6 |
9.28 × 10⁸ |
13.4 |
52.2 |
0.014 |
| Isobutane TS2 |
6 |
4.39 × 10⁸ |
13.2 |
31.6 |
0.008 |
|
Total C
s
|
|
|
|
|
0.022
|
|
Exp
|
|
|
|
|
0.021 ± 0.001
|
Propanal
Propanal has Cs symmetry (Fig. 10) and six hydrogens – one on the aldehyde group, two equivalent on the methylene bridge and three equivalent on the methyl moiety. We found only a single TS associated with the abstraction of each type of hydrogen. The results for each TS and the calculated Cs are summarized in Table 8. As expected, it was predicted that the aldehyde hydrogen is most reactive.
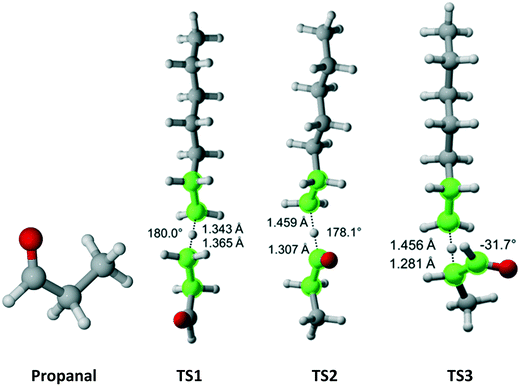 |
| | Fig. 10 Propanal and its three transition states for hydrogen abstraction by the propagating radical. Length of the forming bond at the transition state and dihedral angle of the highlighted atoms are indicated. Carbon and hydrogen atoms are in gray and white, respectively. All images were generated with CYLview.42 | |
Table 8 Calculated Cs value for hydrogen abstraction from propanal
| Species |
σ
|
A (L mol−1 s−1) |
E
a (kcal mol−1) |
k
H@130 °C (L mol−1 s−1) |
C
s
@130 °C |
|
C
s = kH/kp where kp is the calculated homo-propagation rate coefficient for ethylene using a trimer-to-tetramer model presented in Table 1.
|
| Propanal TS1 |
3 |
3.52 × 10⁸ |
17.4 |
0.131 |
0.00 |
| Propanal TS2 |
1 |
4.07 × 10⁸ |
10.7 |
621 |
0.17 |
| Propanal TS3 |
2 |
1.46 × 10⁸ |
10.8 |
193 |
0.05 |
|
Total C
s
|
|
|
|
|
0.22
|
|
Exp
|
|
|
|
|
0.33 ± 0.01
|
The results for the seven small CTAs (ethane, cyclohexane, butanone, propylene, isobutene, isobutane and propanal) indicate that DFT calculations with the M06-2X/6-311+G(3df,2p)//B3LYP/6-31+G(d,p) level of theory provide accuracy within the experimental error. Moreover, it is necessary to account for multiple reaction pathways. Otherwise, in most of the examined cases, severe underestimation of the Cs parameter may occur. Moreover, 1D-HR and tunneling corrections are not going to improve the results.
A robust QM methodology employed for the development of new branching agents would not only accurately predict the Cs values which determine the chain-transfer character of the material but also be able to demonstrate the same precision in estimating the monomer reactivity ratios which will dictate the rate of incorporation into the polymer chains. To this end, we studied the performance of the chosen by us DFT approach to calculate the monomer reactivity ratio for a series of molecules with a carbon–carbon double bond. These were methyl methacrylate, vinyl acetate, 1-butene, propylene and isobutene. Experimental data was obtained from the work of Ehrlich and Mortimer.44
Methyl methacrylate
Methyl methacrylate (MMA) belongs to the Cs point group (Fig. 11). It has two equivalent faces for attack by the propagating radical and, consequently, a twofold reaction path degeneracy. Furthermore, MMA can exist in two isomers – s-cis and s-trans, as defined by rotation around the single bond of the methacrylate group. Calculations showed that the s-trans isomer is more stable with equilibrium constant of 0.51 at 180 °C. We discovered three pathways and TSs associated with each isomer. The calculated r1 and Arrhenius parameters are presented in Table 9. The result indicate that if multiple reaction pathways are not considered, the calculated r1 values can be severely overestimated. When all six transition states are accounted for, excellent agreement with experimental data is achieved.
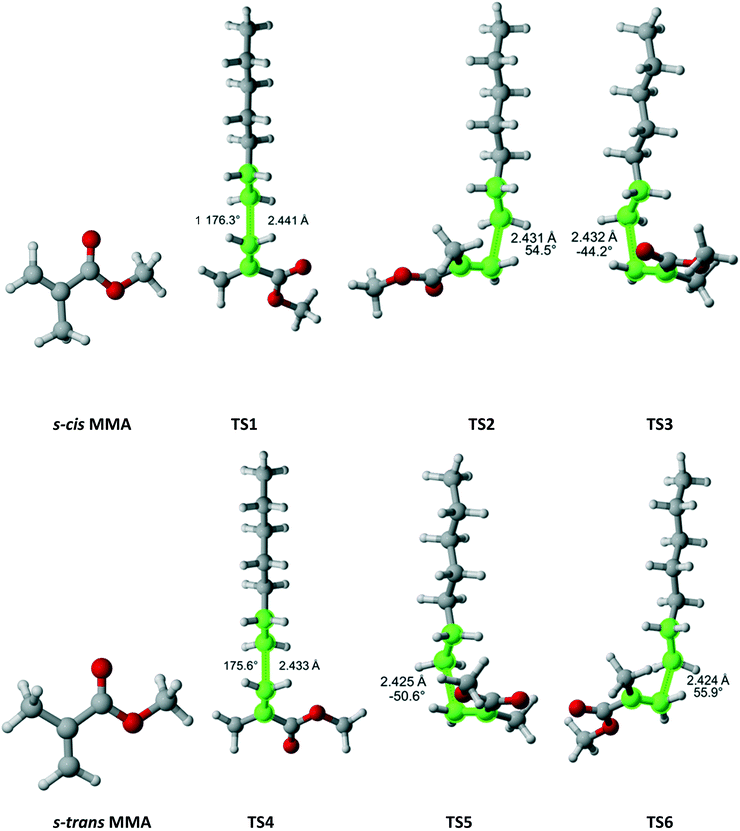 |
| | Fig. 11 MMA and its two isomers and six transition states for incorporation into the propagating radical. Length of the forming bond at the transition state and dihedral angle of the highlighted atoms are indicated. Carbon and hydrogen atoms are in gray and white, respectively. All images were generated with CYLview.42 | |
Table 9 Calculated r1 value for MMA
| Species |
σ
|
A (L mol−1 s−1) |
E
a (kcal mol−1) |
k@180 °C (L mol−1 s−1) |
r
1
@180 °C |
|
r
1 = kp/k where kp is the calculated homo-propagation rate coefficient for ethylene using a trimer-to-tetramer model presented in Table 1.
|
| MMA TS1 |
2 |
2.51 × 10⁷ |
5.05 |
9.25 × 10⁴ |
0.13 |
| MMA TS2 |
2 |
2.46 × 10⁷ |
4.82 |
1.17 × 10⁵ |
0.10 |
| MMA TS3 |
2 |
1.31 × 10⁷ |
4.55 |
8.33 × 10⁴ |
0.15 |
| MMA TS4 |
2 |
3.45 × 10⁷ |
5.09 |
1.21 × 10⁵ |
0.10 |
| MMA TS5 |
2 |
2.39 × 10⁷ |
4.58 |
1.48 × 10⁵ |
0.08 |
| MMA TS6 |
2 |
3.25 × 10⁷ |
4.80 |
1.57 × 10⁵ |
0.08 |
|
Total r
1
|
|
1.51 × 10
8
|
4.81
|
7.18 × 10
5
|
0.02
|
|
Exp
|
|
|
|
|
0.02
|
Vinyl acetate
Vinyl acetate (Fig. 12) has Cs symmetry and two equivalent faces which results in reaction path degeneracy of two. Three TSs were discovered. Table 10 summarizes the results along each pathway. Clearly, if only a single pathway was considered, the r1 value would be drastically overestimated. The final result is in excellent agreement with the experimental values.
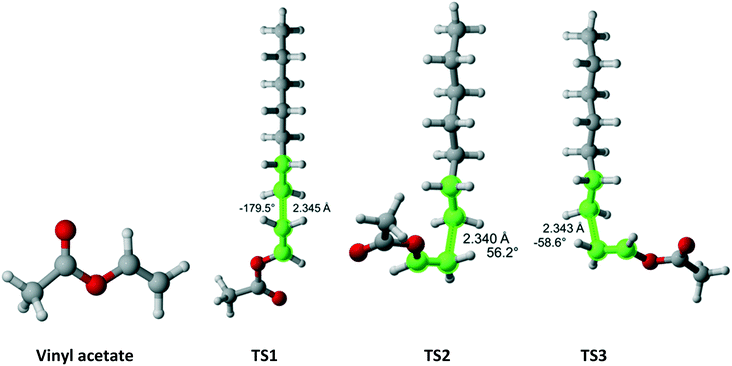 |
| | Fig. 12 Vinyl acetate and its three transition states for incorporation into the propagating radical. Length of the forming bond at the transition state and dihedral angle of the highlighted atoms are indicated. Carbon and hydrogen atoms are in gray and white, respectively. All images were generated with CYLview.42 | |
Table 10 Calculated r1 value for vinyl acetate
| Species |
σ
|
A (L mol−1 s−1) |
E
a (kcal mol−1) |
k@120 °C (L mol−1 s−1) |
r
1
@120 °C |
|
r
1 = kp/k where kp is the calculated homo-propagation rate coefficient for ethylene using a trimer-to-tetramer model presented in Table 1.
|
| Vinyl acetate TS1 |
2 |
5.66 × 10⁷ |
8.53 |
1.02 × 10³ |
2.8 |
| Vinyl acetate TS2 |
2 |
5.46 × 10⁷ |
8.29 |
1.35 × 10³ |
2.1 |
| Vinyl acetate TS3 |
2 |
4.53 × 10⁷ |
8.17 |
1.30 × 10³ |
2.2 |
|
Total r
1
|
|
1.55 × 10
8
|
8.32
|
3.67 × 10
3
|
0.7
|
|
Exp
|
|
|
|
|
0.6 ± 0.1
|
1-Butene
1-Butene belongs to the Ci point group and attack on each face is distinct leading to six different TSs (Fig. 13). If the TS3 (lowest Gibbs free energy) was the only one considered, the r1 value would have been overestimated by a factor of 3.4. When all six TSs are calculated, the computational r1 is very close to the experimental one (Table 11).
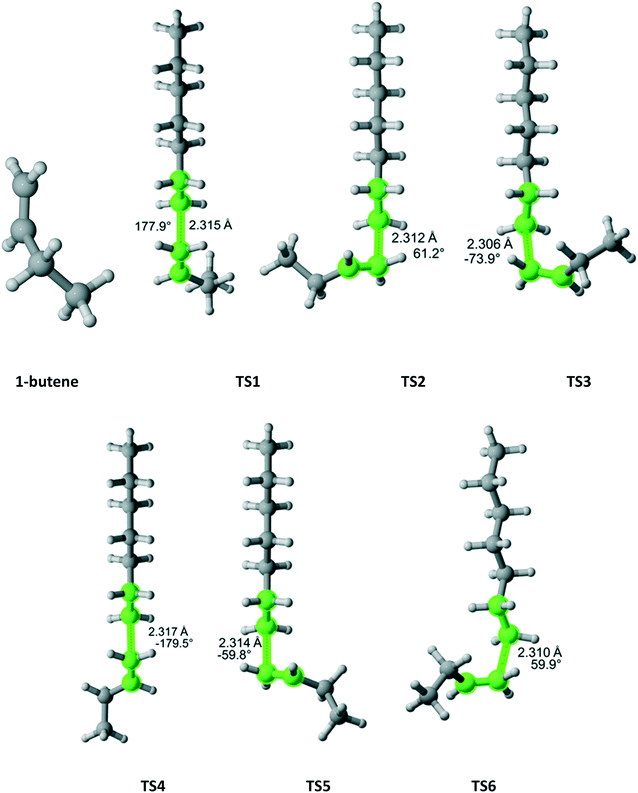 |
| | Fig. 13 1-Butene and its six transition states for incorporation into the propagating radical. Length of the forming bond at the transition state and dihedral angle of the highlighted atoms are indicated. Carbon and hydrogen atoms are in gray and white, respectively. All images were generated with CYLview.42 | |
Table 11 Calculated r1 value for 1-butene
| Species |
σ
|
A (L mol−1 s−1) |
E
a (kcal mol−1) |
k@130 °C (L mol−1 s−1) |
r
1
@130 °C |
|
r
1 = kp/k where kp is the calculated homo-propagation rate coefficient for ethylene using a trimer-to-tetramer model presented in Table 1.
|
| Butene TS1 |
1 |
1.90 × 10⁷ |
9.11 |
2.18 × 10² |
17.2 |
| Butene TS2 |
1 |
1.45 × 10⁷ |
8.66 |
2.93 × 10² |
12.8 |
| Butene TS3 |
1 |
1.33 × 10⁷ |
9.21 |
1.36 × 10² |
27.6 |
| Butene TS4 |
1 |
2.21 × 10⁷ |
9.15 |
2.41 × 10² |
15.6 |
| Butene TS5 |
1 |
1.92 × 10⁷ |
8.79 |
3.30 × 10² |
11.4 |
| Butene TS6 |
1 |
1.78 × 10⁷ |
8.87 |
2.78 × 10² |
13.5 |
|
Total r
1
|
|
1.04 × 10
8
|
8.93
|
1.50 × 10
3
|
2.5
|
|
Exp
|
|
|
|
|
3.4 ± 0.3
|
Isobutene
As previously discussed, isobutene belongs to the C2v point group (Fig. 14). There are three distinct TSs – at 180°, 62.2° and −62.2°. In Fig. 14, only two TSs are shown because the 62.2° and −62.2° are mirror images and identical in energy. Thus, in Table 12, the rate coefficient along pathway 2 is assigned reaction path multiplicity of four rather than two. Furthermore, TS1 and TS2 are very close in energy and, consequently, they contribute equally to the overall r1 of 2.0 which compares very favorably with the experimental value of 2.6 ± 0.2.
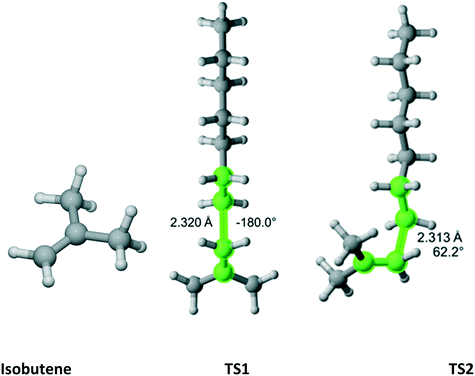 |
| | Fig. 14 Isobutene and its three transition states (TS3 is similar to TS2 with dihedral of −62.2) for incorporation into the propagating radical. Length of the forming bond at the transition state and dihedral angle of the highlighted atoms are indicated. Carbon and hydrogen atoms are in gray and white, respectively. All images were generated with CYLview.42 | |
Table 12 Calculated r1 value for isobutene
| Species |
σ
|
A (L mol−1 s−1) |
E
a (kcal mol−1) |
k@130 °C (L mol−1 s−1) |
r
1
@130 °C |
|
r
1 = kp/k where kp is the calculated homo-propagation rate coefficient for ethylene using a trimer-to-tetramer model presented in Table 1.
|
| Isobutene TS1 |
2 |
5.16 × 10⁷ |
9.10 |
6.03 × 10² |
6.2 |
| Isobutene TS2 |
4 |
8.08 × 10⁷ |
8.87 |
1.25 × 10³ |
3.0 |
|
Total r
1
|
|
1.32 × 10
8
|
8.95
|
1.86 × 10
3
|
2.0
|
|
Exp
|
|
|
|
|
2.6 ± 0.2
|
Propylene
Propylene (Fig. 15) belongs to the Cs point group and its addition to a propagating ethylene radical has a reaction path degeneracy of two. Three distinct trajectories of attack and TSs were discovered. The most energetically favorable one is TS3. However, TS1 and TS2 contribute significantly to the overall r1 value (Table 13).
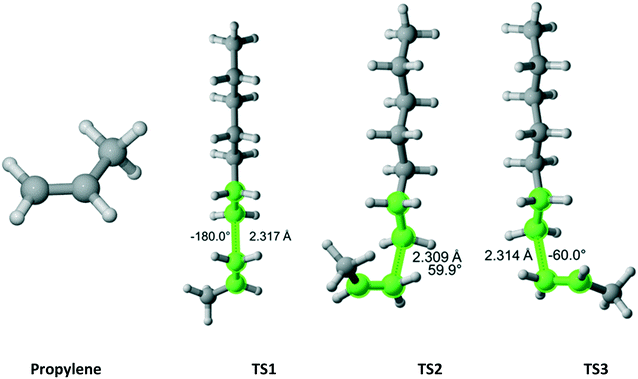 |
| | Fig. 15 Propylene and its three transition states for incorporation into the propagating radical. Length of the forming bond at the transition state and dihedral angle of the highlighted atoms are indicated. Carbon and hydrogen atoms are in gray and white, respectively. All images were generated with CYLview.42 | |
Table 13 Calculated r1 value for propylene
| Species |
σ
|
A (L mol−1 s−1) |
E
a (kcal mol−1) |
k@130 °C (L mol−1 s−1) |
r
1
@130 °C |
|
r
1 = kp/k where kp is the calculated homo-propagation rate coefficient for ethylene using a trimer-to-tetramer model presented in Table 1.
|
| Propylene TS1 |
2 |
4.48 × 10⁷ |
9.19 |
4.67 × 10² |
8.0 |
| Propylene TS2 |
2 |
3.67 × 10⁷ |
8.93 |
5.31 × 10² |
7.1 |
| Propylene TS3 |
2 |
3.69 × 10⁷ |
8.83 |
6.00 × 10² |
6.3 |
|
Total r
1
|
|
1.17 × 10
8
|
8.97
|
1.60 × 10
3
|
2.4
|
|
Exp
|
|
|
|
|
3.1 ± 0.2
|
Conclusions
In this work, a density functional theory (DFT) methodology was developed and validated against experimental data for relative hydrogen abstraction (Cs) and monomer reactivity ratio (r1) parameters associated with free radical polymerization. For hydrogen abstraction, we considered ethane, cyclohexane, 2-butanone, propylene, isobutene, isobutane and propanal while methyl methacrylate, vinyl acetate, 1-butene, propylene and isobutene were the molecules of choice for benchmarking r1. It was demonstrated that the M06-2X/6-311+G(3df,2p)//B3LYP/6-31+G(d,p) level of theory along with the counterpoise correction for the basis set superposition error (BSSE) produced estimated values in excellent agreement with experimental data. Table 14 shows that the calculated parameters are within a factor of 1.5 from the experimental values. This translates into a maximum error of 0.32 kcal mol−1 in Gibbs free energy of activation difference. The only exception is Cs for ethane with an experimental-to-calculated ratio of 3.0. Even then, the DFT estimate is within the experimental error. Furthermore, the approach managed to capture a wide range of empirical parameters as well as distinguish between monomers with close values. This robust and computationally inexpensive method can be applied to elucidate the reactivity of much larger species of industrial importance and rationally design the next generation of branching and chain-transfer agents for low density polyethylene (LDPE) systems.
Table 14 Summary of calculated and experimental Cs and r1 for all species in this study
| Species |
Calculated |
Experimental |
Exp/calc |
Temperature (°C) |
|
C
s
|
| Ethane |
0.0002 |
0.0006 ± 0.0005 |
3.0 |
130 |
| Cyclohexane |
0.0073 |
0.0095 ± 0.0003 |
1.3 |
130 |
| 2-Butanone |
0.055 |
0.060 ± 0.005 |
1.1 |
130 |
| Propylene |
0.016 |
0.0122 ± 0.0008 |
0.7 |
130 |
| Isobutane |
0.0076 |
0.0072 ± 0.0003 |
0.9 |
130 |
| Isobutene |
0.022 |
0.021 ± 0.001 |
1.0 |
130 |
| Propanal |
0.22 |
0.33 ± 0.01 |
1.5 |
130 |
|
r
1
|
| MMA |
0.02 |
0.02 |
1.0 |
180 |
| Vinyl acetate |
0.8 |
0.6 ± 0.1 |
0.8 |
120 |
| 1-Butene |
2.5 |
3.4 ± 0.3 |
1.4 |
130 |
| Isobutene |
2.0 |
2.6 ± 0.2 |
1.3 |
130 |
| Propylene |
2.4 |
3.1 ± 0.2 |
1.3 |
130 |
Conflicts of interest
There are no conflicts to declare.
References
-
M. Spalding, Handbook of Industrial Polyethylene Technology, Wiley, 1st edn, 2017 Search PubMed.
- S. Goto, K. Yamamoto, S. Furui and M. Sugimoto, J. Appl. Polym. Sci.: Appl. Polym. Symp., 1981, 36, 21 CAS.
- G. Verros, M. Papadakis and C. Kiparissides, Polym. React. Eng., 1993, 1, 427 CrossRef.
- C. Kiparissides, G. Verros and J. F. McGregor, J. Macromol. Sci., Rev. Macromol. Chem. Phys., 1993, C33, 437 CrossRef CAS.
-
K. W. Doak, Encyclopedia of Polymer Science and Engineering, Low Density Polyethylene(High Pressure), Wiley, New York, 1989, vol. 6 Search PubMed.
- D. Romanini, Polym.-Plast. Technol. Eng., 1982, 19, 201 CrossRef.
-
P. Neuteboom, et al., SABIC, 2006, EP1861434B1.
- K. Van Cauter, V. Van Speybroeck, P. Vansteenkiste, M.-F. Reyniers and M. Waroquier, ChemPhysChem, 2006, 7, 131 CrossRef CAS PubMed.
- R. G. Susnow, A. M. Dean and W. H. Green Jr., Chem. Phys. Lett., 1999, 312, 262 CrossRef CAS.
- A. G. Vandeputte, M. K. Sabbe, M.-F. Reyniers, V. Van Speybroeck, M. Waroquier and G. B. Marin, J. Phys. Chem. A, 2007, 111, 11771 CrossRef CAS PubMed.
- T. Tan, X. Yang, C. M. Krauter, Y. Ju and E. A. Carter, J. Phys. Chem. A, 2015, 119, 6377 CrossRef CAS PubMed.
- K. Hemelsoet, D. Moran, V. Van Speybroeck, M. Waroquier and L. Radom, J. Phys. Chem. A, 2006, 110, 8942 CrossRef CAS PubMed.
- K. Hemelsoet, D. Moran, V. Van Speybroeck, M. Waroquier and L. Radom, J. Phys. Chem. A, 2006, 110, 13624 CrossRef CAS PubMed.
- E. Mavroudakis, D. Cuccato and D. Moscatelli, J. Phys. Chem. A, 2014, 118, 1799 CrossRef CAS PubMed.
- M. Moghadam, S. Liu, S. Srinivasan, M. C. Grady, M. Soroush and A. M. Rappe, J. Phys. Chem. A, 2013, 117, 2605 CrossRef PubMed.
- J. P. A. Heuts, R. G. Gilbert and L. Radom, Macromolecules, 1995, 28, 8771 CrossRef CAS.
- M. Moghadam, S. Liu, S. Srinivasan, M. C. Grady, M. Soroush and A. M. Rappe, Ind. Eng. Chem. Res., 2015, 54, 4148 CrossRef.
- E. Mavroudakis, D. Cuccato and D. Moscatelli, Polymer, 2015, 7, 1789 CAS.
- V. Van Speybroeck, K. Van Cauter, B. Coussens and M. Waroquier, ChemPhysChem, 2005, 6, 180 CrossRef CAS PubMed.
- G. Zhang, I. A. Konstantinov, S. G. Arturo, D. Yu and L. J. Broadbelt, J. Chem. Theory Comput., 2014, 10, 5668 CrossRef CAS PubMed.
- H. B. Mayes, L. J. Broadbelt and G. T. Beckham, J. Am. Chem. Soc., 2014, 136, 1008 CrossRef CAS PubMed.
- H. B. Mayes and L. J. Broadbelt, J. Phys. Chem. A, 2012, 116, 7098 CrossRef CAS PubMed.
- J. Pfaendtner, X. Yu and L. J. Broadbelt, Theor. Chem. Acc., 2007, 118, 881 CrossRef CAS.
- X. Yu, J. Pfaendtner and L. J. Broadbelt, J. Phys. Chem. A, 2008, 112, 6772 CrossRef CAS PubMed.
-
M. J. Frisch, G. W. Trucks, H. B. Schlegel, G. E. Scuseria, M. A. Robb, J. R. Cheeseman, G. Scalmani, V. Barone, B. Mennucci, G. A. Petersson, H. Nakatsuji, M. Caricato, X. Li, H. P. Hratchian, A. F. Izmaylov, J. Bloino, G. Zheng, J. L. Sonnenberg, M. Hada, M. Ehara, K. Toyota, R. Fukuda, J. Hasegawa, M. Ishida, T. Nakajima, Y. Honda, O. Kitao, H. Nakai, T. Vreven, J. A. Montgomery Jr., J. E. Peralta, F. Ogliaro, M. Bearpark, J. J. Heyd, E. Brothers, K. N. Kudin, V. N. Staroverov, R. Kobayashi, J. Normand, K. Raghavachari, A. Rendell, J. C. Burant, S. S. Iyengar, J. Tomasi, M. Cossi, N. Rega, J. M. Millam, M. Klene, J. E. Knox, J. B. Cross, V. Bakken, C. Adamo, J. Jaramillo, R. Gomperts, R. E. Stratmann, O. Yazyev, A. J. Austin, R. Cammi, C. Pomelli, J. W. Ochterski, R. L. Martin, K. Morokuma, V. G. Zakrzewski, G. A. Voth, P. Salvador, J. J. Dannenberg, S. Dapprich, A. D. Daniels, Ö. Farkas, J. B. Foresman, J. V. Ortiz, J. Cioslowski and D. J. Fox, Gaussian 09, Revision D.01, Gaussian, Inc., Wallingford, CT, 2009 Search PubMed.
- A. D. Becke, J. Chem. Phys., 1993, 98, 5648 CrossRef CAS.
- C. T. Lee, W. T. Yang and R. G. Parr, Phys. Rev. B: Condens. Matter Mater. Phys., 1988, 37, 785 CrossRef CAS.
- M. J. Frisch, J. A. Pople and J. S. Binkley, J. Chem. Phys., 1984, 80, 3265 CrossRef CAS.
- P. C. Harihara and J. A. Pople, Theor. Chim. Acta, 1973, 28, 213 CrossRef.
- W. J. Hehre, R. Ditchfie and J. A. Pople, J. Chem. Phys., 1972, 56, 2257 CrossRef CAS.
- C. Gonzalez and H. B. Schlegel, J. Phys. Chem., 1990, 94, 5523 CrossRef CAS.
-
D. McQuarrie, Statistical Mechanics, University Science Books, Sausalito, CA, 2000 Search PubMed.
- Y. Zhao and D. G. Truhlar, Theor. Chem. Acc., 2008, 120, 215 CrossRef CAS.
- S. F. Boys and F. Bernardi, Mol. Phys., 1970, 19, 553 CrossRef CAS.
- S. Simon, M. Duran and J. J. Dannenberg, J. Chem. Phys., 1996, 105, 11024 CrossRef.
-
C. J. Cramer, Essentials of Computational Chemistry: Theories and Models, John Wiley & Sons, 2004 Search PubMed.
-
H. S. Johnston, Gas Phase Reaction Rate Theory, Ronald Press, New York, 1966 Search PubMed.
- J. O. Hirschfelder and E. Wigner, J. Chem. Phys., 1939, 7, 616 CrossRef CAS.
- D. Cuccato, M. Dossi, D. Polino, C. Cavallotti and D. Moscatelli, Macromol. React. Eng., 2012, 6, 496 CrossRef CAS.
-
J. B. Butt, Reaction Kinetics and Reactor Design, Chemical Industries, CRC Press, 2nd edn, 2000 Search PubMed.
- S. Beuermann and M. Buback, Prog. Polym. Sci., 2002, 27, 191 CrossRef CAS.
-
CYLview 1.0b Copyright © 2009-2012, Claude Y. Legault Search PubMed.
-
G. Odian, Principles of Polymerization, John Wiley & Sons, 2004 Search PubMed.
- P. Ehrlich and G. A. Mortimer, Fortschr. Hochpolym.-Forsch., 1970, 7, 386 CAS.
Footnote |
| † Electronic supplementary information (ESI) available. See DOI: 10.1039/c7me00087a |
|
| This journal is © The Royal Society of Chemistry 2018 |
Click here to see how this site uses Cookies. View our privacy policy here.  *,
Sean
Ewart
,
Hayley
Brown
,
Christopher
Eddy
,
Jonathan
Mendenhall
and
Sarat
Munjal


