
 Open Access Article
 This Open Access Article is licensed under a
 Creative Commons Attribution 3.0 Unported Licence
High-throughput single-molecule bioassay using micro-reactor arrays with a concentration gradient of target molecules†
Rikiya
Watanabe
 *ab,
Toru
Komatsu
bc,
Shingo
Sakamoto
c,
Yasuteru
Urano
c and
Hiroyuki
Noji
*a
*ab,
Toru
Komatsu
bc,
Shingo
Sakamoto
c,
Yasuteru
Urano
c and
Hiroyuki
Noji
*a
aDepartment of Applied Chemistry, The University of Tokyo, 7-3-1 Hongo, Bunkyo-ku, Tokyo 113-8656, Japan. E-mail: wrikiya@nojilab.t.u-tokyo.ac.jp; hnoji@appchem.t.u-tokyo.ac.jp
bPRESTO Network, Japan Science and Technology Agency, 7-3-1 Hongo, Bunkyo-ku, Tokyo 113-8656, Japan
cSchool of Pharmaceutical Sciences, The University of Tokyo, 7-3-1 Hongo, Bunkyo-ku, Tokyo 113-0033, Japan
First published on 9th August 2018
Abstract
Micro-reactor arrays enable highly sensitive and quantitative bioassays at a single-molecule level. Accordingly, they are widely used for sensitive “digital” bioassays, e.g., digital PCR and digital ELISA. Despite high integration, individual reactors in digital bioassays are filled with a uniform reaction solution, thus limiting the ability to simultaneously conduct multiple bioassays under different conditions using integrated reactors in parallel, resulting in the loss of potential throughput. We developed micro-reactor arrays with a concentration gradient of target molecules, in which individual reactors sealed with a lipid-bilayer membrane contained a precise amount of target molecules. Using the arrays, we successfully demonstrated multiple single-molecule bioassays in parallel using alkaline phosphatase or α-hemolysin, key components in various biomedical sensors. This new platform extends the versatility of micro-reactor arrays and could enable further analytical and pharmacological applications.
Introduction
Bioassays with high sensitivity and throughput are broadly needed in life sciences research. Digital single-molecule assays using micro-reactor arrays are an emerging approach to detect various bio-reactions, e.g., hydrolysis, protein synthesis, and membrane transport, with high sensitivity down to the single-molecule level,1–5 enabling biomedical applications, such as digital PCR and digital ELISA.6–9 In digital assays, the reaction solution is partitioned into many micro-reactor arrays integrated on a chip, allowing most compartments to be loaded with 0 or 1 target enzyme. Owing to the small volume of reactors (fL), a minute quantity of enzymatic product is detectable, allowing direct monitoring of the individual activities of isolated single enzymes in a highly sensitive and quantitative manner. However, even though micro-reactors are highly integrated on a chip, it is difficult to conduct multiple bioassays under different conditions using integrated reactors in parallel because the composition of the reaction solution encapsulated in reactors is uniform over entire area of a chip.Various microfluidic systems have thus far been developed to form a concentration gradient of target molecules on a chip.10–16 Concentration gradients on these systems can be controlled by flow parameters, enabling the function of various bioassays in high throughput manner. However, micro-reactor arrays of fL volume have not been equipped with these systems due to technical difficulties at the time of assembly.
Ge et al. recently developed a strategy to form a concentration gradient of target molecules in micro-reactor arrays by Brownian trapping using antibodies.17 This method increases the dynamic range of digital ELISA. However, two major technical limitations remain: i) it can only be used for molecules trapped by an antibody and ii) sample preparation is time-consuming.
In this study, we addressed these technical issues by developing versatile micro-reactor arrays to form a variety of concentration gradients of target molecules in a high throughput manner. Using the arrays, we demonstrated multiple single-molecule bioassays on a chip under various conditions using alkaline phosphatase (ALP) and α-hemolysin, whose reactions are commonly used for various biosensors, e.g., ELISA and nanopore DNA sequencing.7,8,18,19
Experimental
Materials
Alexa Fluor dyes 405 and 488 were purchased from Thermo Fisher Scientific (Waltham, MA, USA). POPC was purchased from NOF Co. (Osaka, Japan) and TopFluor-TMR-PS was obtained from Avanti Polar Lipid (Alabaster, AL, USA). CYTOP-A and AZP4903 were purchased from Asahi-Glass (Tokyo, Japan) and AZ Electronic Materials (Luxembourg), respectively. α-Hemolysin (HT101) was purchased from Toxin Technology (FL, USA). The D101S mutant of alkaline phosphatase (ALP) from Escherichia coli was expressed and purified according to previously described methods.20Fabrication of micro-chip
We fabricated a micro-chip containing an array of more than 100![[thin space (1/6-em)]](https://www.rsc.org/images/entities/char_2009.gif) 000 micro-reactors (ϕ = 4.0 μm; h = 0.5 μm) by conventional photo-lithography on a hydrophilic glass substrate coated with CYTOP-A, a carbon-fluorine hydrophobic polymer (Fig. 1). The orifice of the micro-reactor is suitable to mechanically support the lipid-bilayer membrane owing to its hydrophobicity.3,21–23 First, CYTOP-A was spin-coated on a glass cover slide (32 mm × 24 mm) and baked for 1 h at 180 °C. Photolithography was then performed using a positive photoresist (AZP4903) to pattern mask structures on the CYTOP layer. Subsequently, the resist-patterned substrate was dry-etched with O2 plasma using a reactive ion etching system (RIE-10NR; Samco, Kyoto, Japan) to expose an array of hydrophilic SiO2 glass. Finally, the substrate was cleaned and rinsed with acetone and isopropyl alcohol to remove the photoresist layer. The fabrication success rate was 100%. The flow channel for sample injection (width: 2.0 mm, height: 0.3 mm) was constructed on the microarrays by assembly with a spacer sheet (Frame-Seal; BIO-RAD, Hercules, CA, USA) and a glass block with an access port on the left end (Fig. 1). The volume of the flow channel was ∼15 μL.
000 micro-reactors (ϕ = 4.0 μm; h = 0.5 μm) by conventional photo-lithography on a hydrophilic glass substrate coated with CYTOP-A, a carbon-fluorine hydrophobic polymer (Fig. 1). The orifice of the micro-reactor is suitable to mechanically support the lipid-bilayer membrane owing to its hydrophobicity.3,21–23 First, CYTOP-A was spin-coated on a glass cover slide (32 mm × 24 mm) and baked for 1 h at 180 °C. Photolithography was then performed using a positive photoresist (AZP4903) to pattern mask structures on the CYTOP layer. Subsequently, the resist-patterned substrate was dry-etched with O2 plasma using a reactive ion etching system (RIE-10NR; Samco, Kyoto, Japan) to expose an array of hydrophilic SiO2 glass. Finally, the substrate was cleaned and rinsed with acetone and isopropyl alcohol to remove the photoresist layer. The fabrication success rate was 100%. The flow channel for sample injection (width: 2.0 mm, height: 0.3 mm) was constructed on the microarrays by assembly with a spacer sheet (Frame-Seal; BIO-RAD, Hercules, CA, USA) and a glass block with an access port on the left end (Fig. 1). The volume of the flow channel was ∼15 μL.
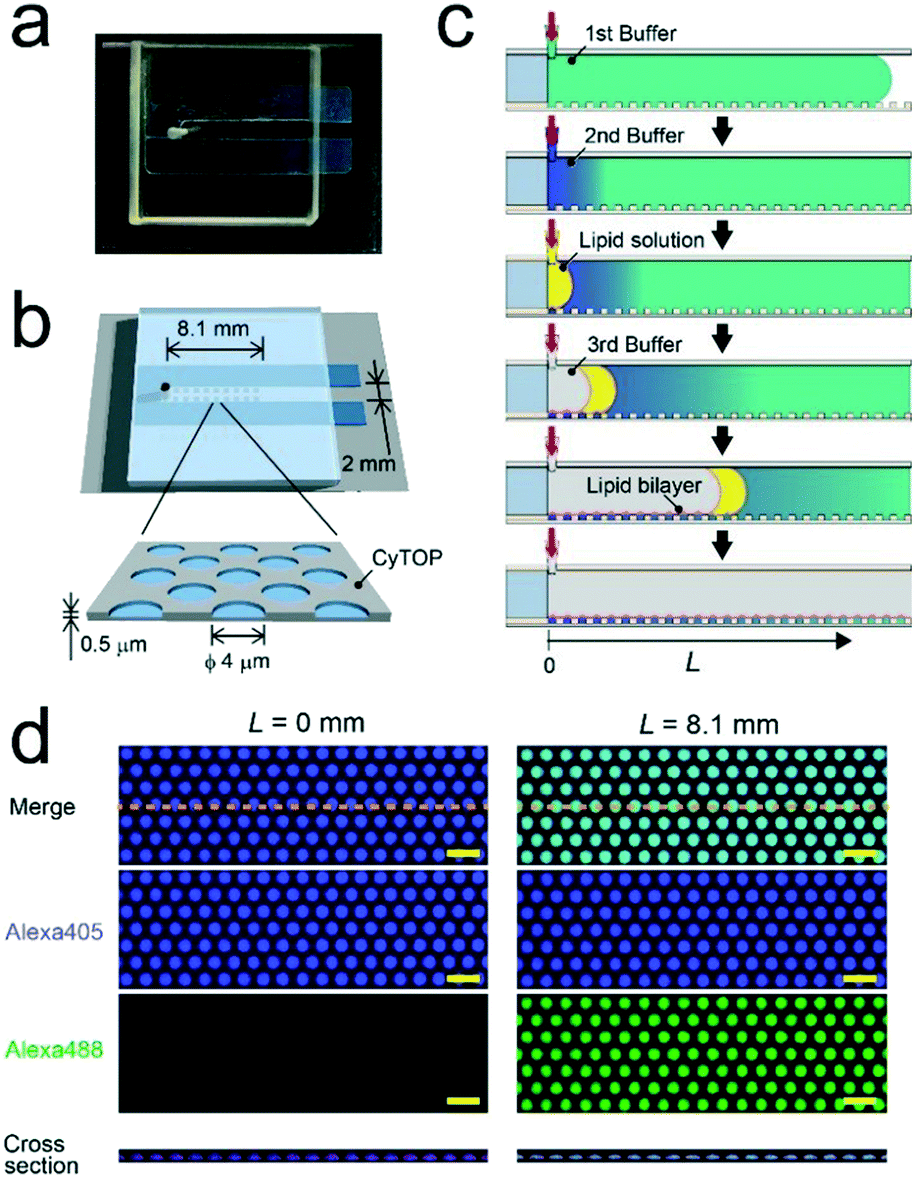 | ||
| Fig. 1 Micro-reactor arrays for concentration gradient formation. (a) Photograph and (b) illustration of the fabricated micro-device. (c) Schematic illustration of the concentration gradient of target molecules. The concentration gradients were formed on individual micro-reactors depending on the distance (L) from the access port for sample injection. The individual micro-reactors were sealed with lipid-bilayer membranes. (d) Fluorescent image (top view) of Alexa 405 (purple) and Alexa 488 (green) encapsulated into micro-reactors sealed by the lipid bilayer membrane (red) at L = 0 mm (left) or 8.1 mm (right). The bottom panel is the cross-section view along the orange dashed lines indicated in top views. Scale bar: 10 μm. | ||
Imaging
Fluorescent time-lapse recordings for single-molecule assays were acquired under a confocal microscope system fitted with photomultiplier tubes and a 60× objective lens (A1R; Nikon, Tokyo, Japan). Alexa 405 was excited at 405 nm, Alexa 488 and sTG were excited at 488 nm, and phospholipids labelled with TopFluor-TMR were excited at 561 nm. Fluorescence intensities were analysed using NIS Elements (Nikon).Results and discussion
Formation of the concentration gradient
We formed the concentration gradient of target molecules along the flow channel on a micro-chip via the sequential injection of a several liquids from the access port (Fig. 1c). The hydrophobicity of the substrate has recently been reported to affect the physical properties of micro-reactors.24 Thus, for the precise control of the gradient profile, we used a stable hydrophobic polymer (CYTOP) as a substrate of the micro-reactors. First, a buffer solution (100 mM Tris-HCl and 1 mM MgCl2 at pH 8.5) containing target molecules was infused into the flow cell. Then, micro-reactors were filled with the solution. Second, an indicated amount of the second buffer solution without target molecules (7–12 μL) was infused at a certain flow rate (0.5–1.5 μL s−1) using an electric pipette. In this step, the concentration gradients were generated based on the advection–diffusion process. The buffer first filled in the flow channel was gradually diluted from the inlet as the second buffer for dilution was infused. Then, the concentration gradients were generated along the flow direction, i.e., the first buffer was not completely diluted because the volume of second buffer is smaller than that of the flow channel. As shown in Fig. S1,† a numerical simulation based on the finite element method (FEM) demonstrated that the concentration gradient of target molecules formed on the bottom of the flow channel, where micro-reactors are embedded. Finally, to encapsulate target molecules into micro-reactors, a lipid solution containing 0.3 mg mL−1 POPC and 0.001 mg mL−1 fluorescent lipid (TopFluor-TMR-PS) in chloroform and the third buffer solution were successively infused. The time interval between the injection of the second buffer and that of the lipid solution was shorter than 1 s. After infusion, lipid-bilayer membranes formed on the orifice of individual reactors, as previously reported,3,23 resulting in the encapsulation of target molecules. Chloroform is a suitable organic solvent for the formation of a lipid membrane on microarrays.3,23,25 Its volume is easily managed owing to its lower viscosity than those of other organic solvents for lipids, such as decane or hexadecane. Lipid bilayer formation was confirmed from the activity of a membrane transporter, α-hemolysin (see below),26 which is not functional unless the lipid membrane becomes as thin as the membrane-spanning structure of α-hemolysin.3,27To examine feasibility, we used fluorescent dyes (Alexa 488 and Alexa 405) as an indicator of the concentration gradient and a reference. The concentration gradient was formed using the first or second buffer solution containing 10 μM Alexa 405 with or without 1 μM Alexa 488, respectively. The concentration of target molecules near the side-wall of the flow channel was not well controlled due to the wall-surface effect, as expected based on the FEM simulation (Fig. S1a†). Therefore, the concentration gradient was analyzed using the micro-arrays located at ±0.5 mm from the center of the flow channel. Three-dimensional fluorescent measurements showed that the lipid-bilayers formed on the orifices of individual micro-reactors (red, Fig. 1d), encapsulating the indicated amount of target molecules. As expected, the fluorescence intensity of Alexa 488 encapsulated in micro-reactors increased along the flow channel, while that of Alexa 405 was constant (Fig. 1d), confirming the formation of a concentration gradient of target molecules in our micro-reactor system. Furthermore, the concentration gradient of target molecules, i.e., Alexa 488, became steeper as the flow rate increased and/or the volume of 2nd buffer decreased (Fig. 2), in a manner similar to what was expected based on FEM simulation (Fig. S1b and c†). The concentration gradient in micro-reactor arrays was proportional to the distance from the access port, L (Fig. 2b and c). Notably, the gradient was reproducibly generated between devices; the coefficient of variation (CV) was 0.15. In addition, physical parameters, i.e., the aging period (>one month) and the height of the micro-arrays (0.5–3.4 μm), did not affect the gradient profile (Fig. S2 and S3†).
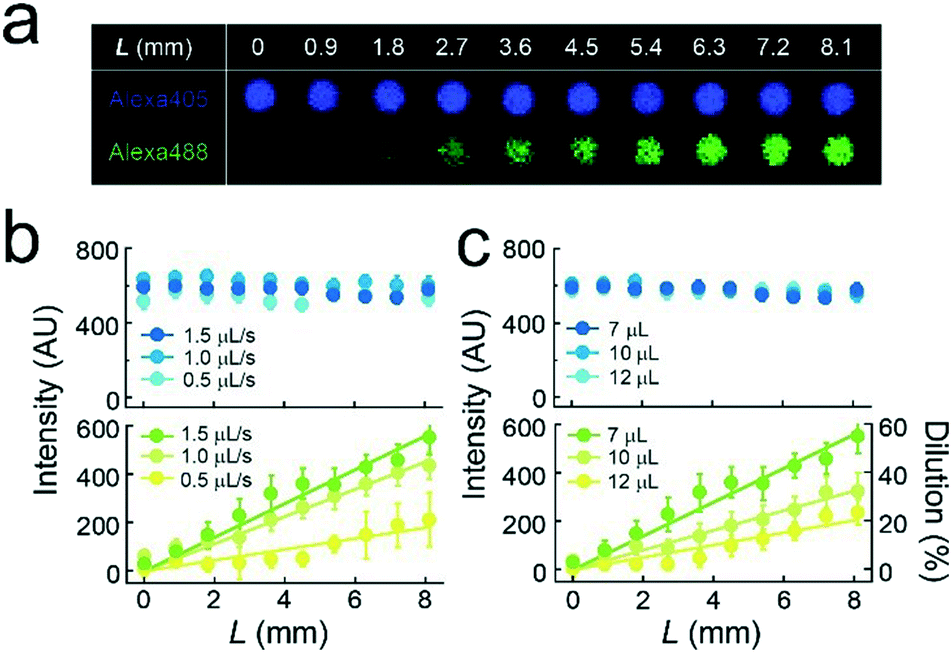 | ||
| Fig. 2 Concentration gradients of target molecules. (a) Fluorescence image of Alexa 405 (purple) and Alexa 488 (green) encapsulated in micro-reactors (h = 0.5 μm) at each L. The flow rate of liquid was 1.5 μL s−1 and the volume of the second buffer solution was 7 μL. (b and c) Fluorescence intensity of Alexa 405 (upper) and Alexa 488 (lower) in micro-reactors are plotted against the flow rate (b) or the volume of the second buffer solution (c) used to generate the concentration gradients. The solid lines represent linear regressions. | ||
Single-molecule enzymatic assay using ALP
A single-molecule enzymatic assay of ALP was conducted under a concentration gradient of a fluorogenic substrate (sTG-phos) (Fig. 3a). The permeability of the fluorescent product (sTG) across the lipid-bilayer membrane was extremely low, enabling the single-molecule enzymatic assay of ALP using this platform. The assay was conducted using less than 5 μM sTG-phos, at which point the turnover rate of ALP is proportional to the concentration of sTG-phos, according to the bulk assay in Fig. S4.† The first or second buffer solution used to form the concentration gradient contained 1 pM ALP and 10 μM Alexa 405 with or without 5 μM sTG-phos, respectively. Notably, Alexa 405 was used as a reference for the ALP concentration. After adding the enzyme to the sTG-phos solution, the reaction mixture was immediately introduced into the device and sealed with lipid bilayers. Based on the calibration curve of the dilution rate (Fig. 2c), the concentration of sTG-phos was calculated at each L.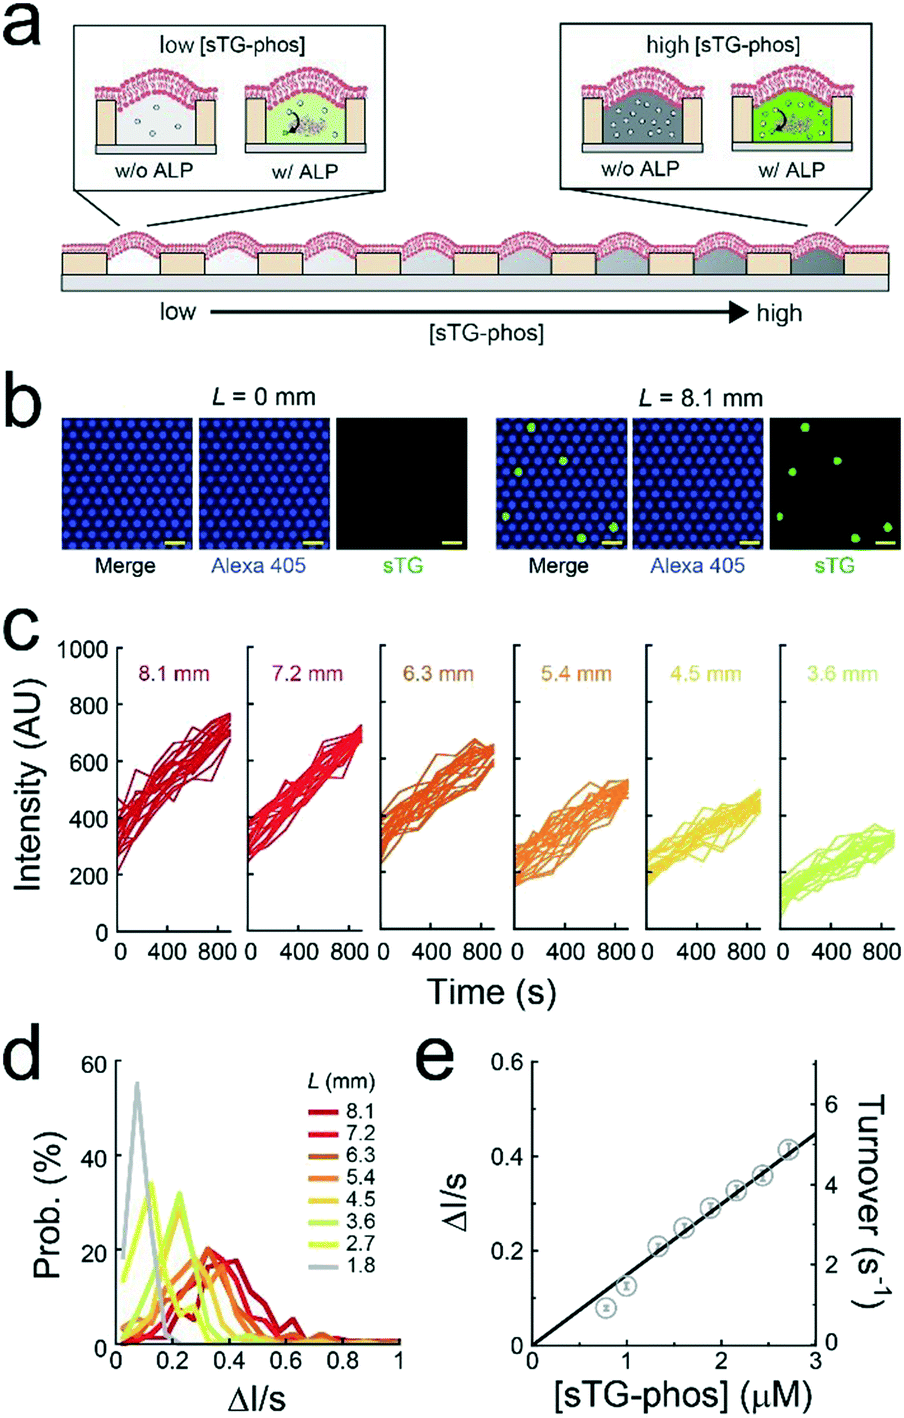 | ||
| Fig. 3 Single-molecule enzymatic assay using ALP. (a) Schematic illustration of the single-molecule enzymatic assay of ALP under the concentration gradient of fluorogenic substrate (sTG-phos). The reaction was monitored by the fluorescence of the reaction product, sTG (green). (b) Fluorescent images of Alexa 405 (purple) and sTG (green) after 500 s at L = 0 mm (left) or 8.1 mm (right). Scale bar: 10 μm. (c) Time courses of the fluorogenic assays of ALP for each L. Fluorescent intensity of sTG from 20 representative reactors are plotted. (d) Distribution of the fluorescent increase rate of sTG for each L. (e) Average rate of fluorescent increase of sTG against the concentration of sTG-phos. The solid line represents a linear regression. | ||
The mean ALP molecules per reactor (λ) was 0.036, which was suitable for single-molecule enzymatic assays. Fig. 3b shows the fluorescence image after 500 s of incubation. The fluorescence intensity of Alexa 405 was unrelated to L, suggesting that the mean number of ALP molecules encapsulated in reactors was uniform over the entire chip. Some chambers showed green fluorescence owing to sTG. The fraction of green fluorescent reactors was 0.044, irrespective of L, from 1.8 mm to 8.1 mm (Fig. S5†), consistent with the above expectation, λ = 0.036. This agreement strongly suggested that individual green fluorescence signals could be attributed to the single-molecule activity of ALP. Obvious green fluorescence was not detectable at L < 1.8 mm because the enzymatic product, sTG, is not detectable owing to the low concentration of substrate, sTG-phos, encapsulated in reactors (Fig. 3b).
The green fluorescence intensity increased in proportion to the observation time, and the slope of the fluorescence increment depended on L (Fig. 3c and d). The CV of the slope obtained from individual ALP molecules was approximately 0.5, irrespective of L. This result suggests that the activity deviation of ALP is not dependent on the substrate concentration. Based on the calibration curves (Fig. 2c and S6†), the turnover rate of single-molecule ALP was calculated against the sTG-phos concentration (Fig. 3e). The turnover rate, i.e., <6 s−1, was in proportion to the sTG-phos concentration. Notably, the volume of micro-reactors used in this study (6 fL) was much less than that those used previously,2,8,9 resulting in the precise detection of slow rates of ALP turnover. The binding rate constant (kon) of sTG-phos was 2.1 × 10⁶ M−1 s−1, in good agreement with the bulk assay (Fig. S4†).
The evaluation of kinetic parameters, e.g., binding constant of the substrate or inhibitory constant of the drug, is indispensable to characterize enzymatic reactions, which contribute to understanding enzyme-related physiological functions as well as to pharmacological research. Thus, our method will pave the way for further analytical and pharmacological application of enzymes.
Single-molecule membrane protein assay
A single-molecule membrane protein assay was conducted under a concentration gradient of α-hemolysin monomers (Fig. 4a), which bind to lipid-bilayer membranes and then oligomerize to form a heptameric transmembrane pore (ϕ = 1–2 nm).26 The first or second buffer solution used to form the concentration gradient contained 1 μM Alexa 488 with or without 10 μg mL−1 α-hemolysin monomer. Based on the calibration curve of the dilution rate (Fig. 2c), the α-hemolysin monomer concentration was modulated for each L. Fig. 3b displays the time course of the fluorescence signals of Alexa 488 after the formation of lipid-bilayer membranes where the fluorescence intensity decays in a single-exponential fashion, representing the passive transport of fluorescent dye molecules through α-hemolysin pores, as previously reported.3,23,27 The fluorescence intensity in the array became heterogeneous over time (inset, Fig. 4a), indicating the stochastic formation of the α-hemolysin complex in the lipid-bilayers, i.e., the active fraction (dark reactor in inset of Fig. 4a) was attributed to the passive transport by single α-hemolysin pores. The active fraction increased according to a seventh order function with respect to the concentration of the α-hemolysin monomer (Fig. 4c). Because the α-hemolysin nanopore is a heptamer,26 nanopore assembly is likely dominated by the concentration of the monomer reconstituted in lipid-bilayer membranes, which is presumably proportional to that encapsulated in micro-reactors. This process is similar to the single-molecule TIRF imaging of the cooperative assembly of γ-hemolysin.28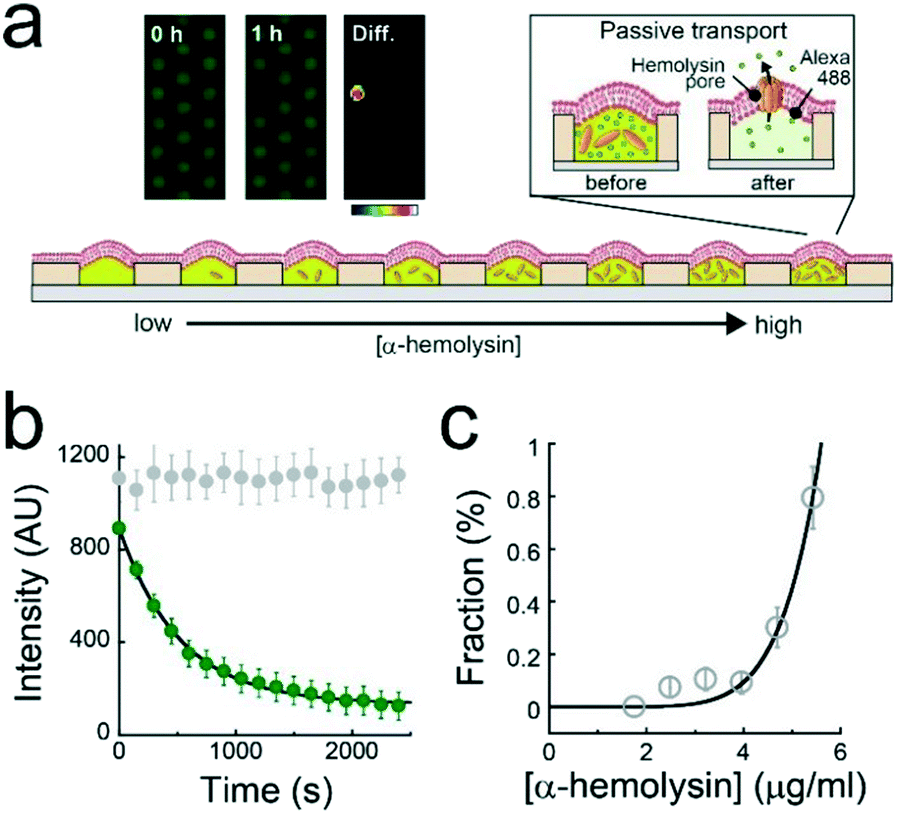 | ||
| Fig. 4 Single-molecule transporter assay using α-hemolysin. (a) Schematic illustration of the single-molecule transporter assay of α-hemolysin with 1 μM Alexa 488. A concentration gradient of the α-hemolysin monomer was generated. The transport substrate (Alexa 488) was exported from micro-reactors via the α-hemolysin pore. Insets are fluorescent images of Alexa 488 recorded just after the formation of the lipid bilayer membrane (left panel) and 1 h later (middle panel). The right panel, diff., shows the intensity difference between these two images, as a color gradient. (b) Time course of fluorescent intensity of Alexa 488 in micro-reactors with (green) or without α-hemolysin (grey). The solid line represents the fitting curve from the first-order reaction scheme. (c) The fraction of active reactors against the concentration of α-hemolysin. The solid line represents the fitting curve with a seventh-order function. | ||
Conclusions
We developed versatile micro-reactor arrays with a concentration gradient of target molecules, overcoming a long-standing technical challenge. The advantage of our method lies in the fast and easy generation of a concentration gradient without the use of antibodies and complicated microfluidic devices. Furthermore, due to the simple design, a large number of micro-reactors can be fabricated onto the entire bottom surface of a chip, which contributes to high-throughput bioassays. The disadvantage, however, is the difficulty to theoretically predicting the gradient profile. The gradient formed as a result of our method was dominated by the advection diffusion process, where the gradient profile can be theoretically calculated by a numerical simulation based on FEM as shown in Fig. S1.† The simulation model, e.g., shape of flow channel, should be simplified because FEM is a time-consuming simulation, and therefore, the precise prediction of concentration gradient using our method is currently difficult compared to other gradient generators, such as the Christmas tree gradient generator.Using the arrays, we successfully demonstrated high-throughput single-molecule bioassays using ALP and α-hemolysin on a chip. Our method has the following advantages on single molecule bioassay: i) high variation in the concentration gradient of target molecules, ii) high sensitivity using ultra-small reactors, and iii) high compatibility to various bioassays.29 These features may extend the applications of high-throughput digital single-molecule bioassays on a chip.
The fluorogenic reaction of ALP and α-hemolysin is used widely for various biosensors.5,18,19 High-throughput measurements under various substrate conditions on a chip, providing kinetic parameters for fluorogenic reactions, would contribute to the identification of candidate fluorogenic substrates or ALP and α-hemolysin variants for biosensors. In addition, ALP itself is an important diagnostic biomarker30 related to a variety of diseases in various organs. Thus, our micro-reactor arrays would be applicable as a fast and quantitative diagnostic tool for ALP-related diseases.
Author contributions
R. W., and T. K. designed research; R. W., T. K., and S. S. performed research; R. W., T. K., Y. U., and H. N. wrote the paper.Conflicts of interest
There are no conflicts to declare.Acknowledgements
Ms. E. Chiyoda, Mr. Y. Obayashi, and Dr. Y. Minagawa for technical support. This work was supported by Grants-in-Aid for Scientific Research (JP17H03660, JP17H05871, JP18H04667) from the Japan Society for the Promotion of Science (to R. W.), a PRESTO Network grant from the Japan Science and Technology Agency (to R. W. and T. K.), a PRIME grant (JP17gm0910020) from the Japan Agency for Medical Research and Development (to R. W.).References
- Y. Rondelez, et al. , Nat. Biotechnol., 2005, 23, 361–365 CrossRef PubMed.
- H. H. Gorris, et al. , Proc. Natl. Acad. Sci. U. S. A., 2007, 104, 17680–17685 CrossRef PubMed.
- R. Watanabe, et al. , Nat. Commun., 2014, 5, 4519 CrossRef PubMed.
- T. Okano, et al. , Lab Chip, 2012, 12, 2704–2711 RSC.
- D. Kim, et al. , Lab Chip, 2015, 15, 17–22 RSC.
- E. A. Ottesen, et al. , Science, 2006, 314, 1464–1467 CrossRef PubMed.
- D. M. Rissin, et al. , Nat. Biotechnol., 2010, 28, 595–599 CrossRef PubMed.
- S. H. Kim, et al. , Lab Chip, 2012, 12, 4986–4991 RSC.
- I. E. Araci, et al. , Lab Chip, 2016, 16, 1573–1578 RSC.
- J. Avesar, et al. , Anal. Chem., 2018, 12, 7480–7488 CrossRef PubMed.
- C. Guermonprez, et al. , Biomicrofluidics, 2015, 9, 054119 CrossRef PubMed.
- M. Sun, et al. , Lab Chip, 2011, 11, 3949–3952 RSC.
- J. Avesar, et al. , Proc. Natl. Acad. Sci. U. S. A., 2017, 114, E5787–E5795 CrossRef PubMed.
- J. Kim, et al. , Lab Chip, 2012, 12, 1813–1822 RSC.
- N. L. Jeon, et al. , Langmuir, 2000, 16, 8311–8316 CrossRef.
- A. E. Kamholz, et al. , Anal. Chem., 1999, 71, 5340–5347 CrossRef PubMed.
- S. Ge, et al. , J. Am. Chem. Soc., 2014, 136, 14662–14665 CrossRef PubMed.
- D. Branton, et al. , Nat. Biotechnol., 2008, 26, 1146–1153 CrossRef PubMed.
- L. Ma and S. L. Cockroft, ChemBioChem, 2010, 11, 25–34 CrossRef PubMed.
- W. Mandecki, et al. , Protein Eng., 1991, 4, 801–804 CrossRef PubMed.
- M. Zagnoni, Lab Chip, 2012, 12, 1026–1039 RSC.
- T. Tonooka, et al. , Small, 2014, 10, 3275–3282 CrossRef PubMed.
- R. Watanabe, et al. , Proc. Natl. Acad. Sci. U. S. A., 2018, 12, 3066–3071 CrossRef PubMed.
- M. Fukuyama, et al. , Lab Chip, 2018, 18, 356–361 RSC.
- R. Watanabe, et al. , Sci. Rep., 2014, 4, 7076 CrossRef PubMed.
- L. Song, et al. , Science, 1996, 274, 1859–1866 CrossRef PubMed.
- A. Tonnesen, et al. , Biophys. J., 2014, 106, 201–209 CrossRef PubMed.
- V. T. Nguyen, et al. , EMBO J., 2003, 22, 4968–4979 CrossRef PubMed.
- R. Santos, et al. , Nat. Rev. Drug Discovery, 2017, 16, 19–34 CrossRef PubMed.
- D. W. Moss, Clin. Biochem., 1987, 20, 225–230 CrossRef PubMed.
Footnote |
| † Electronic supplementary information (ESI) available. See DOI: 10.1039/c8lc00535d |
| This journal is © The Royal Society of Chemistry 2018 |