
 Open Access Article
 This Open Access Article is licensed under a Creative Commons Attribution-Non Commercial 3.0 Unported Licence
Continuous removal of small nonviable suspended mammalian cells and debris from bioreactors using inertial microfluidics†
Taehong
Kwon‡
 a,
Rujie
Yao‡
a,
Jean-François P.
Hamel
*b and
Jongyoon
Han
*acd
a,
Rujie
Yao‡
a,
Jean-François P.
Hamel
*b and
Jongyoon
Han
*acd
aDepartment of Electrical Engineering and Computer Science, Massachusetts Institute of Technology, USA. E-mail: jyhan@mit.edu; Fax: +1 617 258 5846; Tel: +1 617 253 2290
bDepartment of Chemical Engineering, Massachusetts Institute of Technology, USA. E-mail: jhamel@mit.edu; Fax: +1 617 253 9894; Tel: +1 617 258 6665
cDepartment of Biological Engineering, Massachusetts Institute of Technology, USA
dBioSystems and Micromechanics (BioSyM) IRG, Singapore-MIT Alliance for Research and Technology (SMART) Centre, Singapore
First published on 31st July 2018
Abstract
Removing nonviable cells from a cell suspension is crucial in biotechnology and biomanufacturing. Label-free microfluidic cell separation devices based on dielectrophoresis, acoustophoresis, and deterministic lateral displacement are used to remove nonviable cells. However, their volumetric throughputs and test cell concentrations are generally too low to be useful in typical bioreactors in biomanufacturing. In this study, we demonstrate the efficient removal of small (<10 μm) nonviable cells from bioreactors while maintaining viable cells using inertial microfluidic cell sorting devices and characterize their performance. Despite the size overlap between viable and nonviable cell populations, the devices demonstrated 3.5–28.0% dead cell removal efficiency with 88.3–83.6% removal purity as well as 97.8–99.8% live cell retention efficiency at 4 million cells per mL with 80% viability. Cascaded and parallel configurations increased the cell concentration capacity (10 million cells per mL) and volumetric throughput (6–8 mL min−1). The system can be used for the removal of small nonviable cells from a cell suspension during continuous perfusion cell culture operations.
Introduction
Separating nonviable cells from viable cells in bioreactors is critical for enhancing antibody productivity1 and the quality of biological drugs.2 Apoptotic nonviable cells undergo morphological changes and programmed cell death due to various biochemical events,3 some of which are not controllable. These nonviable cells can impair the functionality of stem cell grafts during clinical transplantation4 and can also result in false-positive results for biosensors by nonspecifically binding to reagents.Microfluidic label-free cell sorting technologies5 have been developed and applied for viable and nonviable cell separation.6–14 These technologies are based on differences between live and dead cells with respect to size, deformability, shape, surface properties, density, and electrical polarizability. However, existing microfluidic approaches, such as microfluidic dielectrophoresis, acoustophoretic sorting, and deterministic lateral displacement, have several limitations to be applied for standard bioreactors. The volumetric sample processing throughput is limited to tens to hundreds of μL per minute (maximum of 200 μL min−1 in acoustophoresis).6–14 Test sample cell concentrations are low (up to 2 million mammalian cells per mL).8,11–13 Furthermore, dielectrophoresis6–9,14 and acoustophoresis10,11 require active force fields, such as electric and acoustic fields, thereby increasing the system's complexity15 and compromising its scalability.16 In addition, for sample flow focusing for efficient cell separation, separation methods based on acoustophoresis,10,11 deterministic lateral displacement,12 and cell interaction with periodic ridges13 require buffer input flow in addition to sample flow.
In this study, we demonstrate a novel application of inertial microfluidics for the removal of small (<10 μm) nonviable suspended mammalian cells from a cell culture for standard bioreactors. Inertial microfluidics enables high-throughput, label-free cell sorting and separation.17–19 When particles flow in a confined microchannel, they become focused into specific positions along the channel due to size-dependent hydrodynamic forces.17–19 Inertial microfluidics supports high volumetric flow rates (>mL per minute per channel20), and the throughput can be further increased (as high as 1 L min−1) using multiple devices in parallel.21–23 Moreover, sorting yeast and mammalian cells at high cell concentrations in microchannels can be performed without additional buffer flows.21,24
Chinese hamster ovary (CHO) cells, the top expression system of biological drugs,25 were used to demonstrate our technology. Apoptosis is a main cause of cell death in bioreactor suspension cultures of mammalian cell lines during the production of biopharmaceuticals.26 Due to cell shrinkage during the early stage of apoptosis, nonviable cells are generally smaller than viable cells.3,27,28 Given that particle focusing is sensitive to the size and flow rate in the spiral channel,29 the channel can be used to remove small nonviable cells from the cell culture. We first characterized the device with respect to its capability to remove small (<10 μm) nonviable cells and cell debris at different flow rates, flow split ratios at the outlets, cell viabilities, and cell concentrations. Improvements in the device performance in terms of dead cell removal purity and live cell retention at high cell concentrations (10 million cells per mL) and sample throughputs (6–8 mL min−1) using cascaded and parallel configurations were subsequently demonstrated.
Results and discussion
Design of the microfluidic spiral device
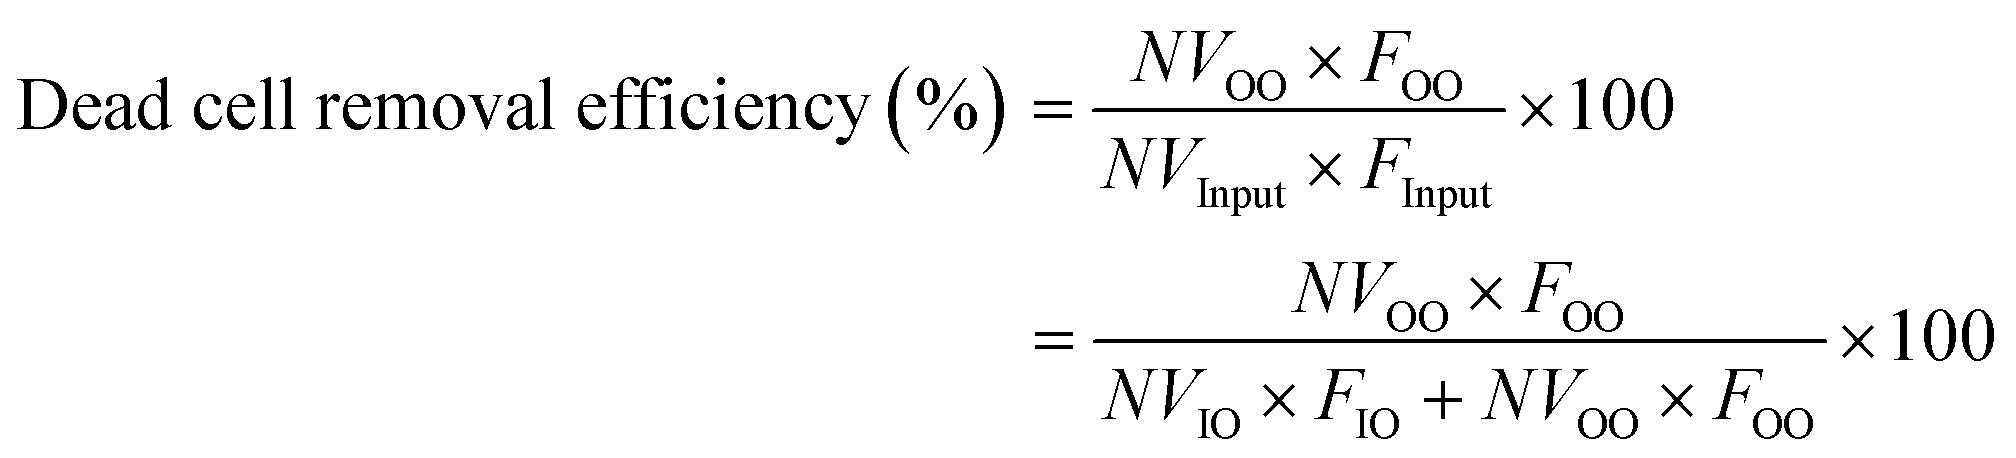
We used a spiral microchannel with a trapezoidal cross-section29,30 to remove small nonviable cells from a suspension culture. Its high separation resolution compared with the spiral channel with a rectangular cross-section was demonstrated before.29,30 The technology has found applications in microfiltration,21,24 blood fractionation,30,31 bacteria detection,32 virus recovery,33 cell isolation (circulating tumor cells,34 stem cells,35,36 and immune cells37), microalgae separation,38 and sorting eggs of a nematode.39Fig. 1 shows the microfluidic cell separation device used in this study. The cell separation is based on inertial sorting that depends on cell size.17–19,40 The finite inertia and viscosity of the fluid at a high Reynolds number in a confined microchannel induce an inertial lift force on cells. Simultaneously, an additional drag force originating from the spiral curvature is exerted on the cells. The combination of these size-dependent hydrodynamic forces focuses the cells at specific equilibrium positions along the channel. Large viable and nonviable (dead) CHO cells are focused near the inner wall of the channel whereas small nonviable CHO cells are sorted near the outer wall of the channel. Each focused stream is collected in different outlets, enabling removal of small nonviable CHO cells from the cell suspension.
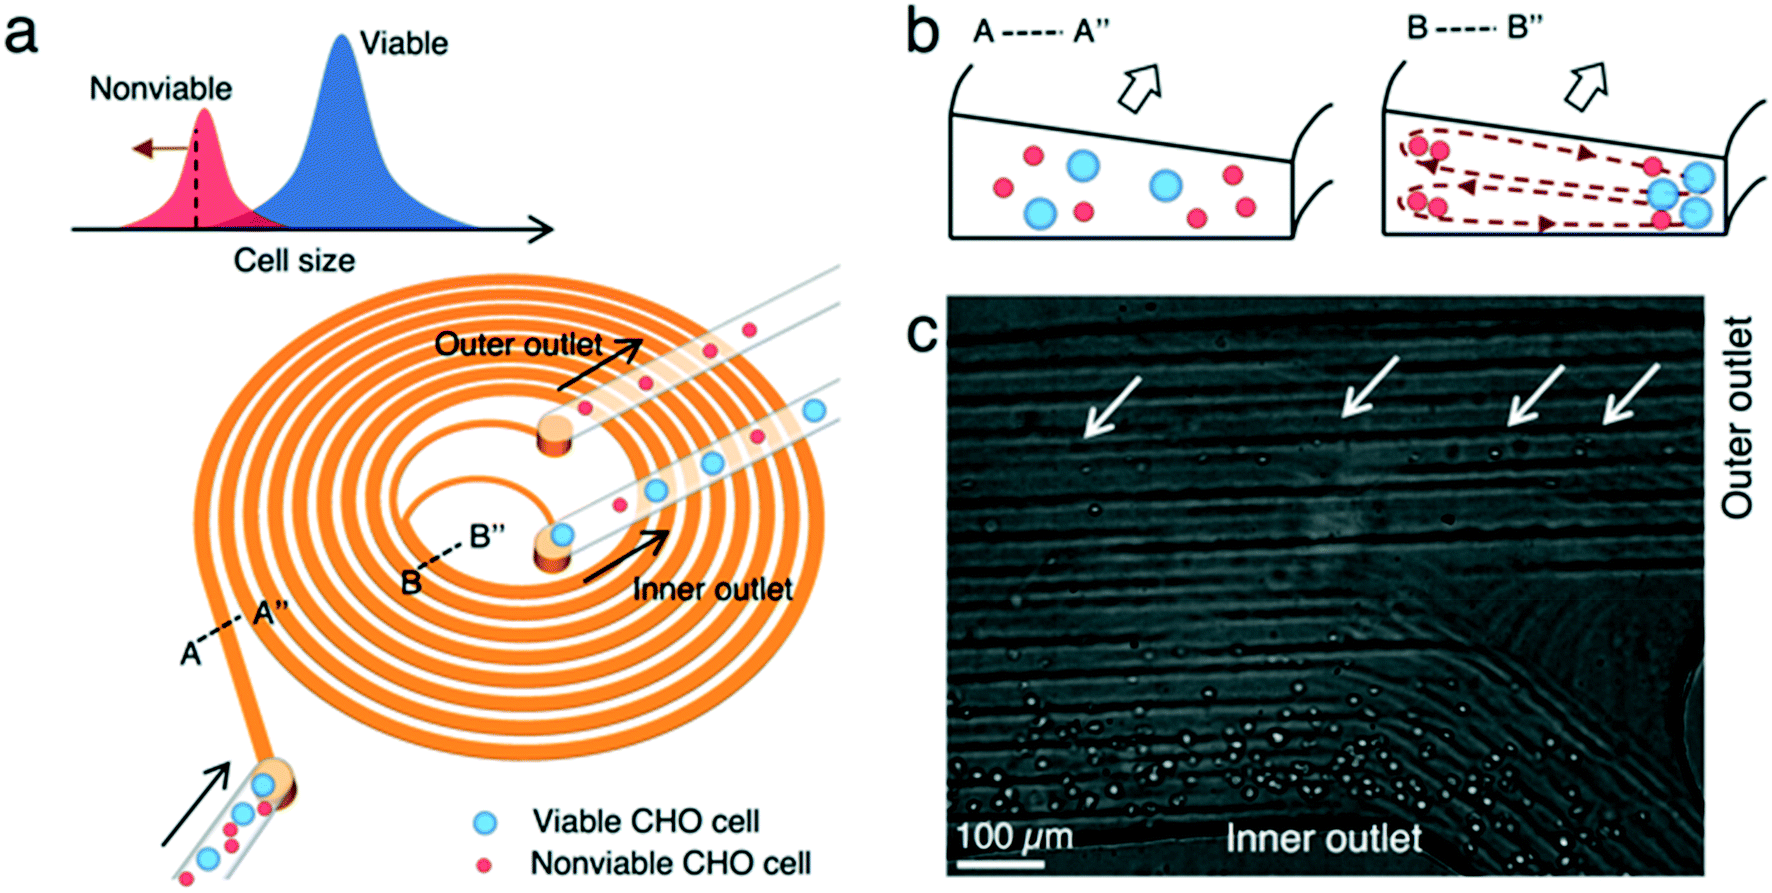 | ||
| Fig. 1 Label-free small nonviable cell removal using inertial microfluidics. (a) Nonviable cells due to apoptosis are generally smaller than viable cells. The spiral microchannel enables size-dependent cell separation. Large viable and nonviable cells are collected in the inner outlet of the channel while small nonviable cells are collected in the outer outlet. (b) Cross-sectional images of the focusing behavior of cells at two different regions, near inlet and near outlets. Initially, cells are randomly dispersed in the channel. A combination of size-dependent inertial lift and Dean drag forces makes the cells occupy distinct equilibrium positions along the channel. Large viable and small nonviable CHO cells occupy their equilibrium positions near the inner and outer walls of the channel, respectively. (c) Separated CHO cells at the outlets. The input total cell concentration was 4 million cells per mL, and its population viability was 67%. | ||
Device performance metrics
To quantify the performance of the microfluidic device, we measured three performance metrics: live cell retention efficiency, dead cell removal efficiency, and dead cell removal purity. Live cell retention efficiency is necessary to know since the primary purpose of the device is to retain viable cells. Similarly, the secondary purpose of the device is to remove nonviable cells, represented by the dead cell removal efficiency parameter. Removal purity represents the purity of the nonviable cells in the outer outlet. The parameters were defined as follows: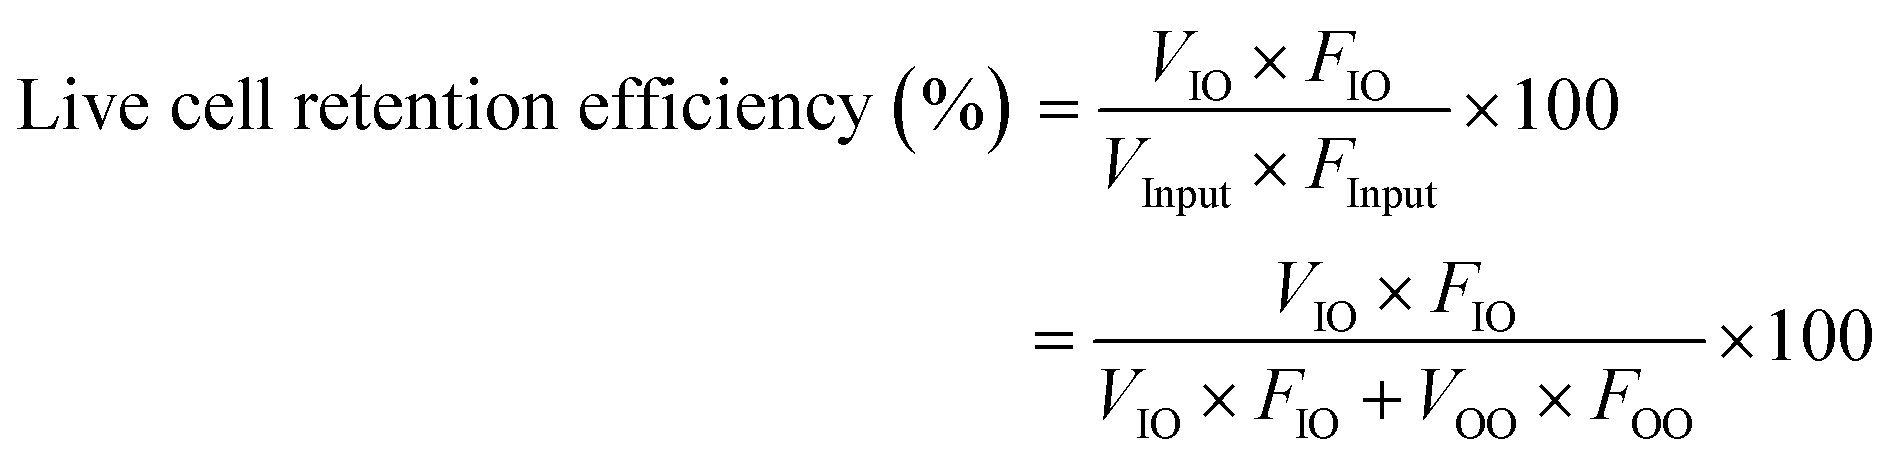
where VInput, VIO, and VOO represent the viable cell concentration in the inlet, inner outlet, and outer outlet, respectively. NVInput, NVIO, and NVOO represent the nonviable cell concentration in the inlet, inner outlet, and outer outlet, respectively. FInput, FIO, and FOO represent the flow rate in the inlet, inner outlet, and outer outlet, respectively.
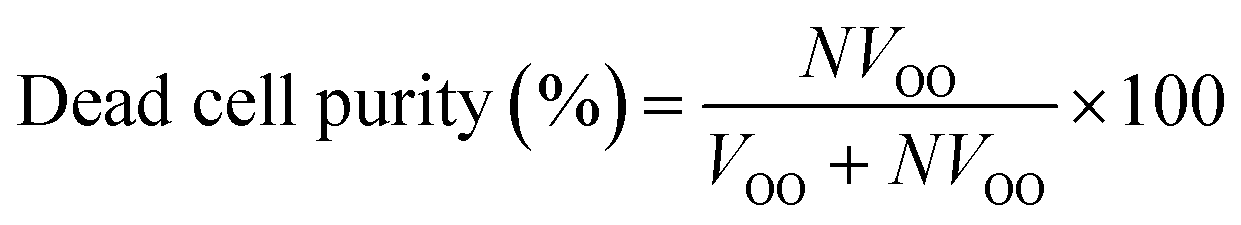
Additionally, the flow split ratio was defined as follows:
The flow split ratio determines the flow streamline boundary between flows into the inner and outer outlets. The outlet flow rates were measured based on the amount of fluid that comes out of the inner and outer outlets per time unit. The flow split ratio was modulated by changing the fluidic resistance of outlet tubing (tubing length and diameter).
Batch culture of CHO cells and cell diameter measurement
Fig. 2a describes the batch culture of CHO cells. The total cell concentration reached 3.5 million cells per mL with a cell viability of 98% on day 3. Subsequently, the cell viability started to decrease. By day 7, the viable cell concentration was 4.9 million cells per mL, and the cell population viability was 93%. The two-color flow cytometry results show different subpopulations of the CHO cells on day 7 (Fig. 2b). The cell diameter was obtained using the correlation between the light forward scatter (FSC) and cell diameter. The diameters of viable, nonviable, and debris were (17.5 ± 2.9) μm (mean ± standard deviation, n = 96![[thin space (1/6-em)]](https://www.rsc.org/images/entities/char_2009.gif) 295), (12.4 ± 3.1) μm (n = 7998), and (2 ± 0.9) μm (n = 12767), respectively. There was a cell diameter overlap between live and nonviable cells. In the range of 10 μm to 14 μm, there were 6.8% viable cells and 44.9% nonviable cells. However, viable cells of <10 μm accounted for only 0.2% of all viable cells, compared with nonviable cells. 25.0% of nonviable cells were <10 μm.
295), (12.4 ± 3.1) μm (n = 7998), and (2 ± 0.9) μm (n = 12767), respectively. There was a cell diameter overlap between live and nonviable cells. In the range of 10 μm to 14 μm, there were 6.8% viable cells and 44.9% nonviable cells. However, viable cells of <10 μm accounted for only 0.2% of all viable cells, compared with nonviable cells. 25.0% of nonviable cells were <10 μm.
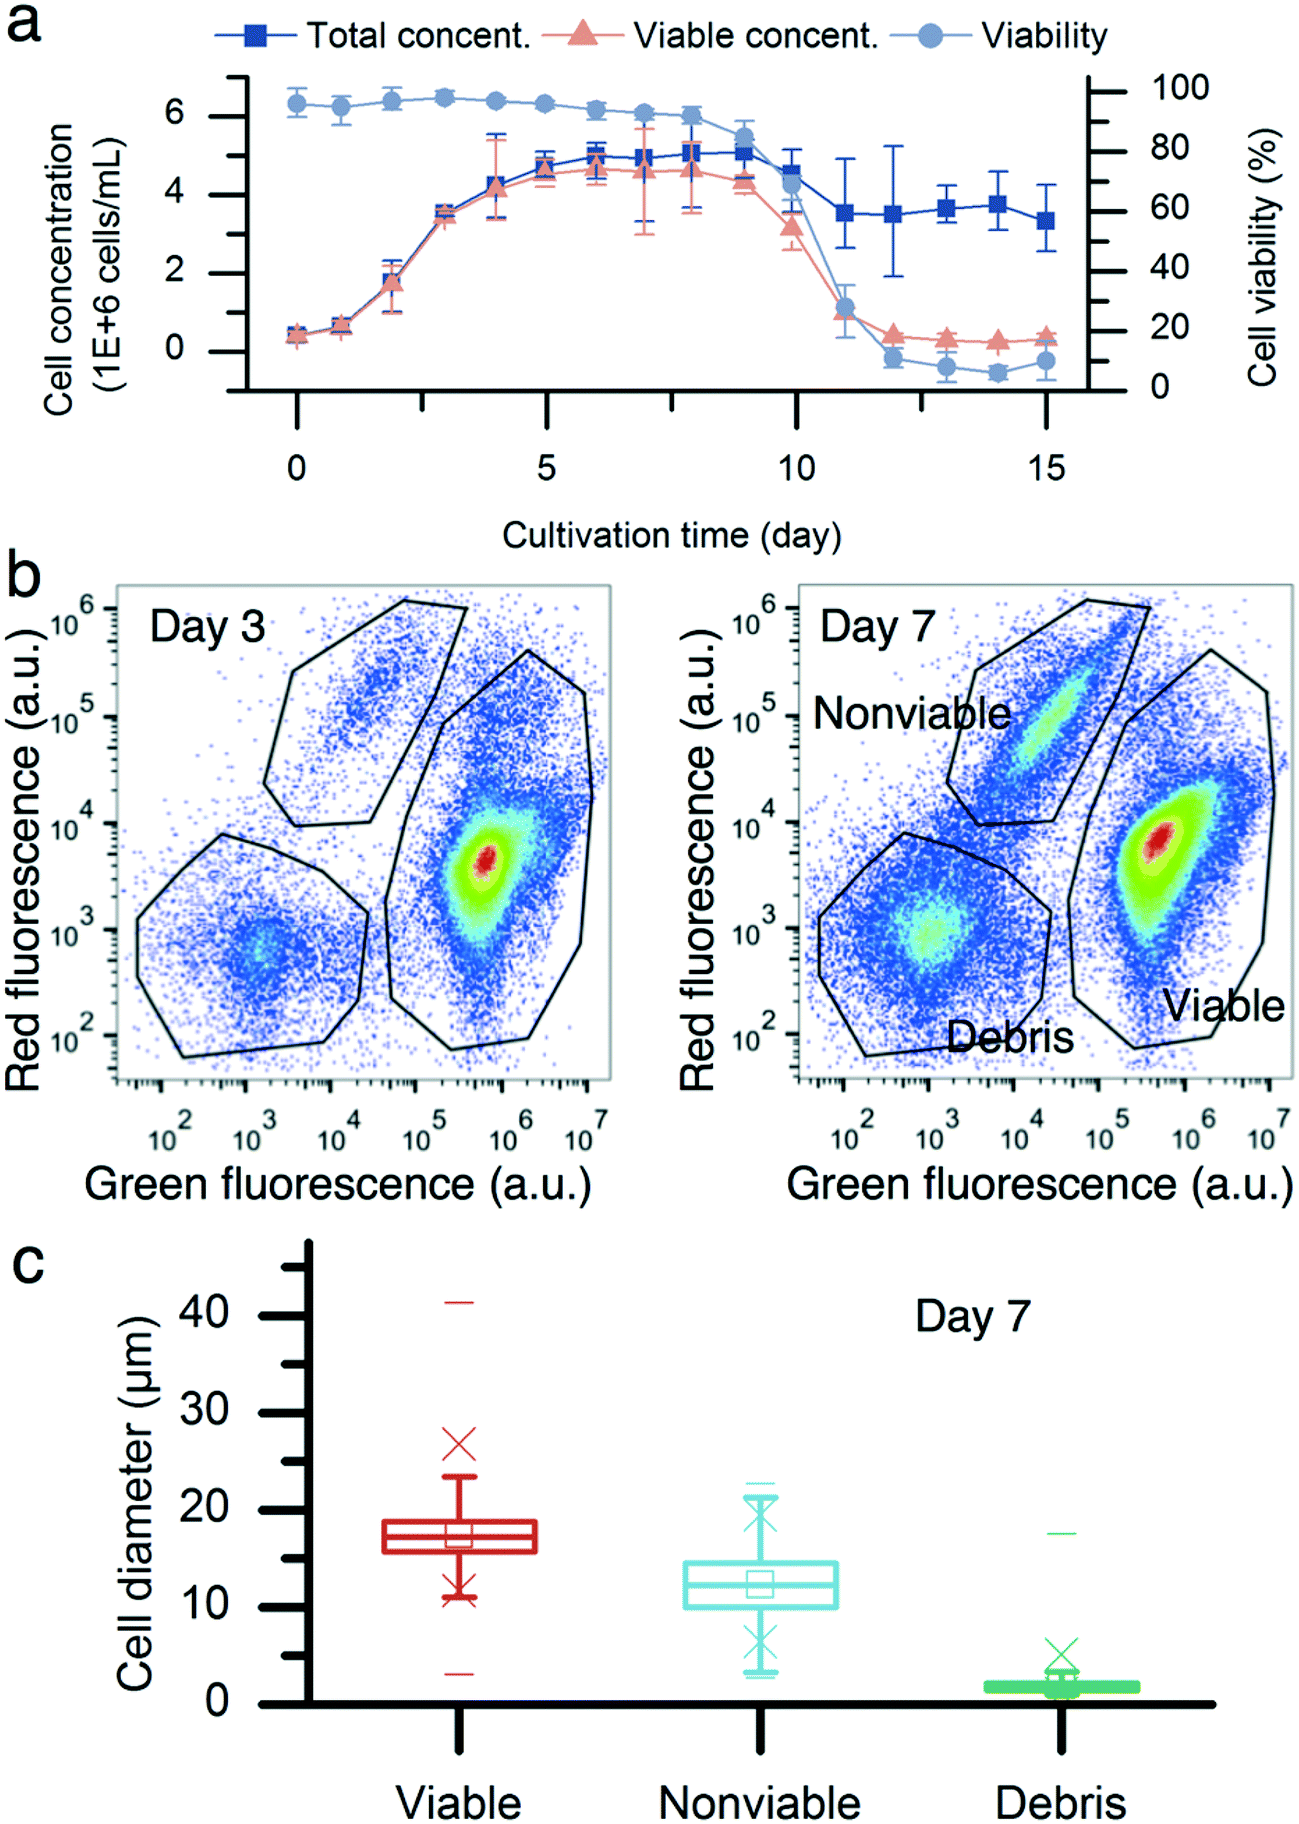 | ||
| Fig. 2 Batch culture results of CHO cells. (a) The batch culture of CHO cells was performed over 15 days. The maximum cell concentration was 4.9 million cells per mL. The cell viability started to decrease from day 3. It was 93% on day 7 while 69% on day 10. Error bars, data range (n = 3, technical replicates, magnified by a factor of five). (b) Comparison between two flow cytometer assay results on day 3 and 7. There are three sub-populations: viable CHO cells, nonviable CHO cells, and cell debris. (c) The cell diameters of viable, nonviable, and cell debris were (17.5 ± 2.9) μm (mean ± standard deviation, n = 96295), (12.4 ± 3.1) μm (n = 7998), and (2 ± 0.9) μm (n = 12767), respectively. The 25th and 75th percentile boxplots with whiskers with the maximum 1.5 interquartile range were used (□: mean, ×: 1% and 99% percentiles, –: minimum and maximum). | ||
Device characterization with microbeads
The input flow rate, flow split ratio, and particle concentration play a role in determining the behavior of particles in the microchannel. We measured three performance metrics: live cell retention efficiency, dead cell removal efficiency, and dead cell removal purity.Characterization experiments were performed to maximize viable cell retention and nonviable cell removal, first using microbeads as a preliminary model. Separating only smaller nonviable cells, rather than separating all the nonviable cells, was prioritized due to the size overlap of nonviable and viable cells (Fig. 2c). CHO cells of <10 μm are highly likely to be nonviable during bioreactor cultivation, as described in the previous section. For example, out of all cells <10 μm, 7.9% were viable and 92.1% were nonviable for 93% cell population viability. In contrast, 94.1% of the CHO cells of >10 μm were viable and 5.9% were nonviable. Therefore, three sizes of microbeads (diameter 15 μm, 10 μm, and 6 μm) were tested. The input flow rate and flow split ratio were varied to separate 6 μm beads from 10 and 15 μm beads. The mean ± standard deviation values for 15 μm, 10 μm, and 6 μm beads were (15.0 ± 0.6) μm, (10.0 ± 0.6) μm, and (5.9 ± 0.3) μm, respectively. Flow rates from 0.3 mL min−1 to 1.5 mL min−1 were tested in increments of 0.1 mL min−1. Flow rates above 1.5 mL min−1 increased the input pressure (>21 pounds per square inch) due to channel resistance and thus caused channel lifting, which is not appropriate for long-term continuous operation (ESI† Fig. S1). The flow split ratio was kept at 0.3 for all flow rate conditions. At low flow rates (<0.8 mL min−1), the 6 μm beads were observed to be more dispersed throughout the microchannel, with higher variance in their distance from the inner wall (Fig. 3b). For 10 μm and 15 μm beads, a flow rate between 0.5 mL min−1 and 1.0 mL min−1 resulted in the two bead sizes focusing at approximately the same region in the microchannel. For flow rates lower than 0.5 mL min−1, the 10 μm and 15 μm beads drifted towards the center of the microchannel, away from the inner wall. However, after the flow rates increased beyond these thresholds, all three sizes of beads settled into a consistent location in the channel. As demonstrated in Fig. 3a, a mixed solution of 15 μm and 6 μm beads was clearly separated at a flow rate of 1.3 mL min−1, while the 6 μm beads were more dispersed among the 15 μm beads at a flow rate of 0.3 mL min−1. The 20 μm beads remained close to the inner wall of the channel (<100 μm from the inner wall) at flow rates of >0.6 mL min−1 (ESI† Fig. S2).
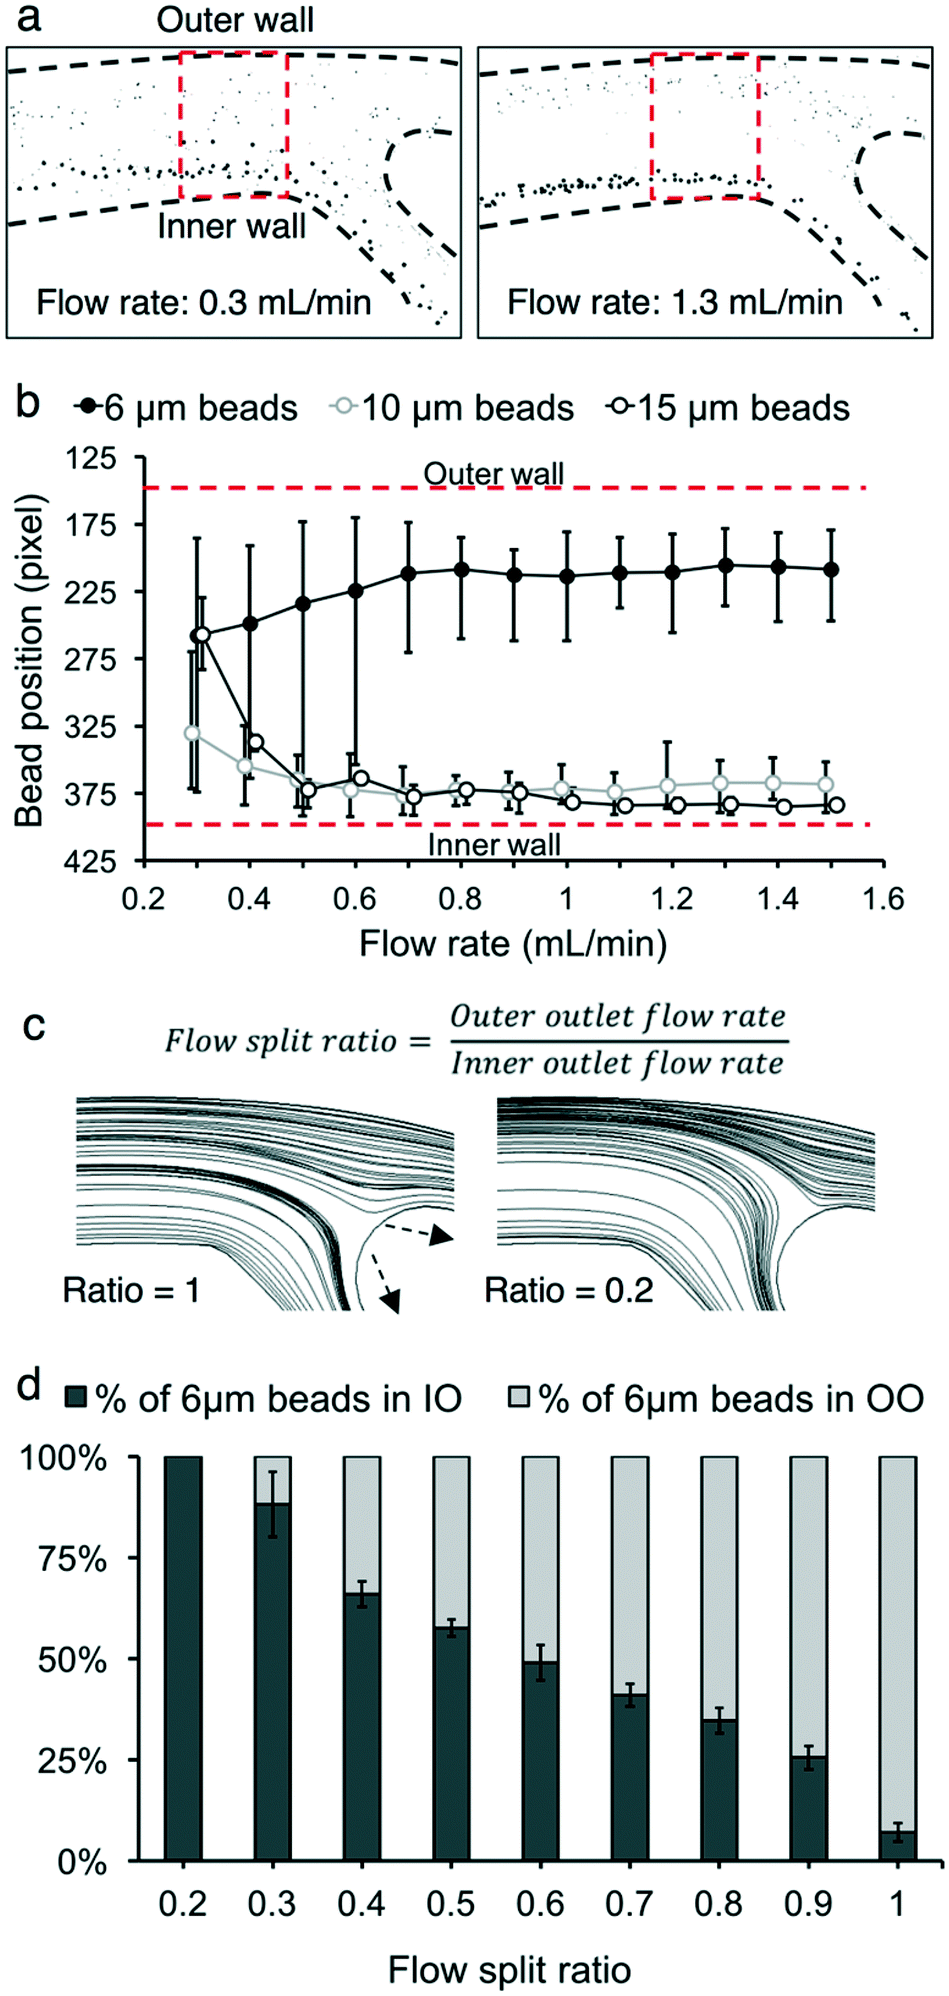 | ||
| Fig. 3 Device characterization using micro beads. (a) Photograms of 6 μm and 15 μm beads at the bifurcation of the microfluidic device obtained at 0.3 mL min−1 and 1.3 mL min−1 flow rates. (b) Quantification of the bead position at different flow rates. The beads' positions were obtained within the region marked in (a). The flow split ratio was maintained at 0.3 in (a) and (b). Error bars, data range (n = 3). (c) The flow split ratio was defined as the ratio of the outer outlet flow rate to the inner outlet flow rate. This adjusts the flow streamline boundary between flows into the inner and outer outlets. The outlet flow rates were measured based on the amount of fluid that comes out of the outlets per time unit. Tubes with different diameters and lengths modulated the fluidic resistance of the outlets. The streamline boundary at a 0.2 flow split ratio moved closer to the outer wall compared with the boundary at a 1 flow split ratio. (d) The effects of the flow split ratio on the distribution of the 6 μm beads in the inner outlet (IO) and outer outlet (OO) of the microfluidic device. 10 μm and 15 μm beads (not shown) were focused into the inner outlet regardless of the flow split ratio. The flow rate was maintained at 1.0 mL min−1. Error bars, data range (n = 3). | ||
Next, the flow split ratio was altered in 0.1 increments from 0.2 to 1.0. This parameter affects the streamline boundary between the inner and outer outlet flows.24,41,42 The flow rate was kept at 1.0 mL min−1 for all flow split ratio conditions. 10 μm and 15 μm bead trajectories were not significantly affected by changing the flow split ratio since their focusing position was close (within 100 μm) to the inner wall at a flow rate of 1.0 mL min−1. Conversely, 6 μm beads were focused much farther (450 μm away) from the inner wall at 1.0 mL min−1. Thus, altering the flow split ratio affected their trajectory at the bifurcation of the microfluidic device. At a flow split ratio of 0.2, all 6 μm beads were collected into the inner outlet (Fig. 3c). As the flow split ratio increased, the streamline boundary between the inner and outer outlet flows shifted to accommodate more fluid entering the outer outlet. The proportion of 6 μm beads collected into the outer outlet increased until 92.9% of 6 μm beads were collected into the outer outlet at a flow split ratio of 1.0.
Nonviable cell removal by the microfluidic device
CHO cells of 3.5 million cells per mL with a cell population viability of 73% were flowed into the microfluidic device at a flow rate of 1.5 mL min−1 with a flow split ratio of 0.36. The processed cells were collected into the inner and outer outlets of the device. The total cell concentrations of the inner and outer outlet output solutions were 4.8 million cells per mL and 0.2 million cells per mL, respectively. The two-dye live/dead flow cytometer assay showed that the microfluidic device removed nonviable cells and cell debris (Fig. 4a and b). The cell population viabilities of the inner and outer outlets were 75% and 2%, respectively. The live cell retention and dead cell removal efficiencies were 99.7% and 6.1%, respectively. As described in Fig. 4c, the cell diameter of the input sample was (15.7 ± 4.0) μm (mean ± standard deviation, n = 60307). The cell diameter of the inner outlet sample was (16.0 ± 4.0) μm (n = 84325) while the cell diameter of the outer outlet sample was (8.6 ± 1.8) μm (n = 4662).
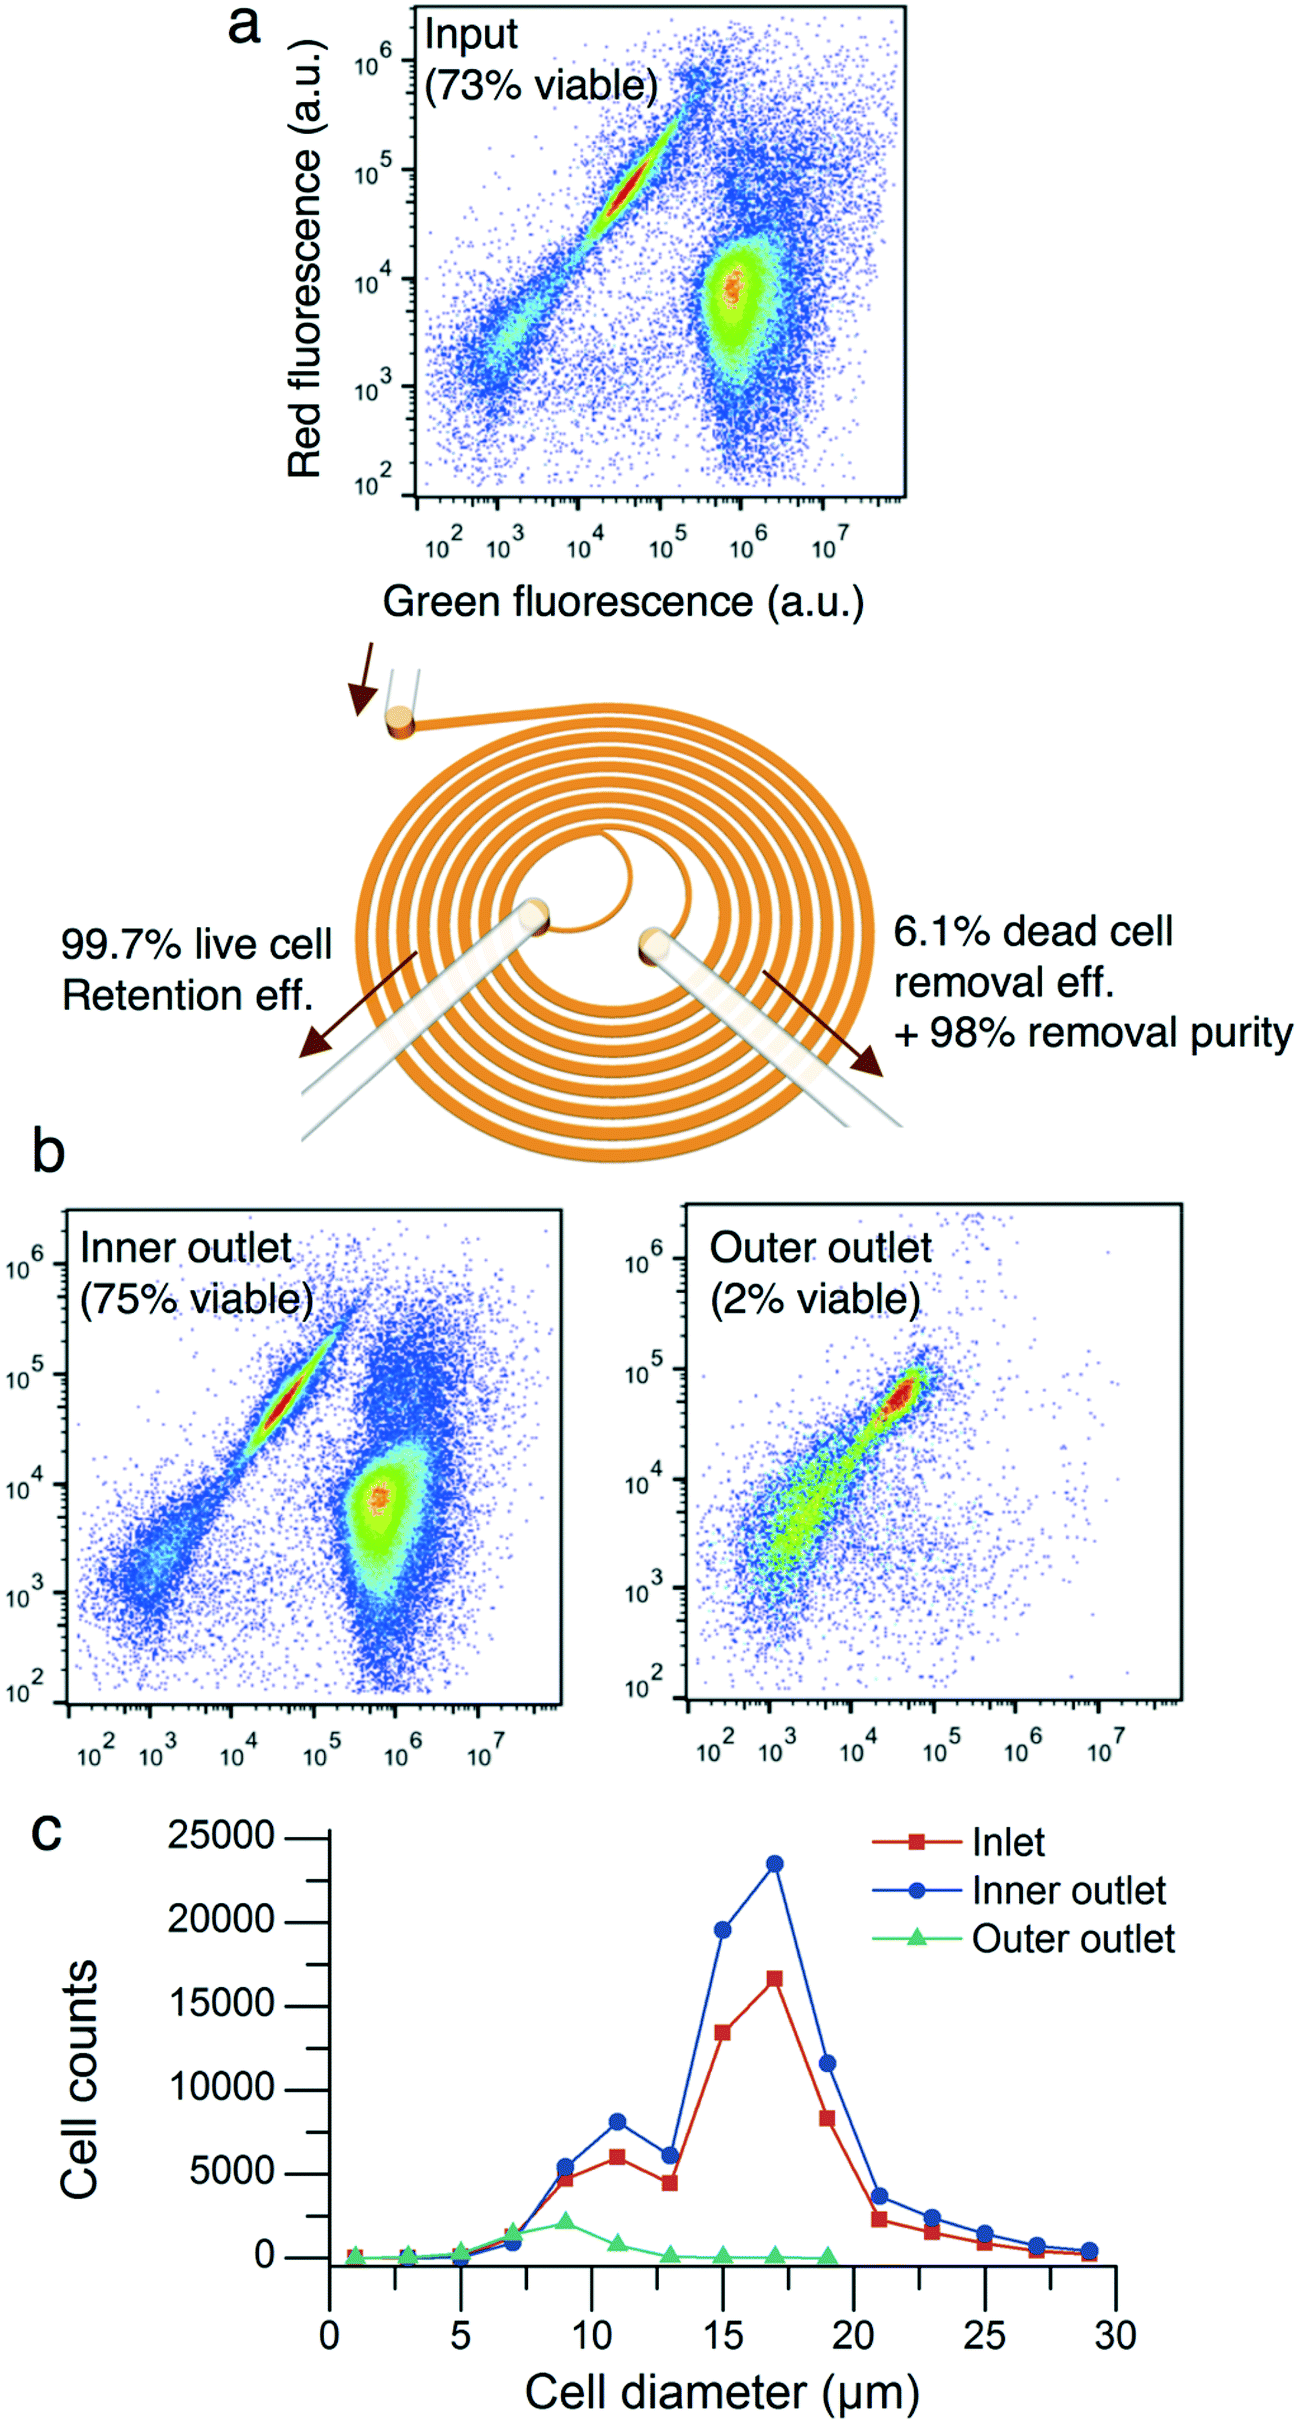 | ||
| Fig. 4 Nonviable cell removal by the microfluidic spiral device. (a) The two-color cell viability assay using a flow cytometer. The input cell solution with a total concentration of 3.5 million cells per mL and a cell population viability of 73% was processed through the device. The flow split ratio was 0.36. (b) The cell population viabilities of the inner and outer outlets were 75% and 2%, respectively. The live cell retention and dead cell removal efficiencies were 99.7% and 6.1%, respectively. (c) The cell diameter of cells in the inner outlet was (16.0 ± 4.0) μm (mean ± standard deviation, n = 84325) while that of cells in the outer outlet was (8.6 ± 1.8) μm (n = 4662). | ||
Since the input flow rate, cell viability, flow split ratio, and cell concentration affect the performance of nonviable cell removal using the microfluidic device, we characterized the device by changing one parameter at a time in the following section.
Device characterization with CHO cells
CHO cell populations at 80% cell viability and a concentration of 4 million cells per mL were infused into the microfluidic device at flow rates from 0.9 mL min−1 to 1.5 mL min−1 in increments of 0.2 mL min−1 with a flow split ratio of 0.36. We did not observe significant changes in viable cell retention efficiency: 99.9% (0.1%) (mean (range), n = 3) at 0.9 mL min−1 and 99.8% (0.1%) at 1.5 mL min−1. However, as the input flow rate increases, more small, nonviable cells were shifted toward the outer wall of the channel and entered the outer outlet, thereby increasing both the dead cell removal efficiency and removal purity. The cell diameter of the nonviable cells collected in the outer outlet decreased from (9.8 ± 2.0) μm (mean ± standard deviation, n = 1435) to (9.2 ± 1.6) μm (n = 3131). The dead cell removal efficiency increased from 1.8% (0.2%) (mean (range), n = 3) to 5.9% (0.3%), and the removal purity increased from 82.9% (1.3%) to 88.6% (1.0%).To determine the effect of cell viability on the performance of the microfluidic device, CHO cell populations with 30%, 45%, 70%, and 80% viabilities were flowed through the device at a constant flow rate (1.5 mL min−1), concentration (4 million cells per mL) and flow split ratio (0.36). For all the viabilities tested, there was no observable difference in viable cell retention efficiency. However, the dead cell removal efficiency and purity increased for lower input viabilities (Fig. 5a). An input cell solution with low population viability has more small, nonviable cells to remove than that with high population viability (Fig. 2), resulting in increased dead cell removal efficiency and purity. The uniform retention efficiency values achieved demonstrates the microfluidic device's ability to retain the viable cells in the inner outlet consistently, while specifically focusing the nonviable cells to the outer outlet, even as the proportion of nonviable cells in the cell solution is increased.
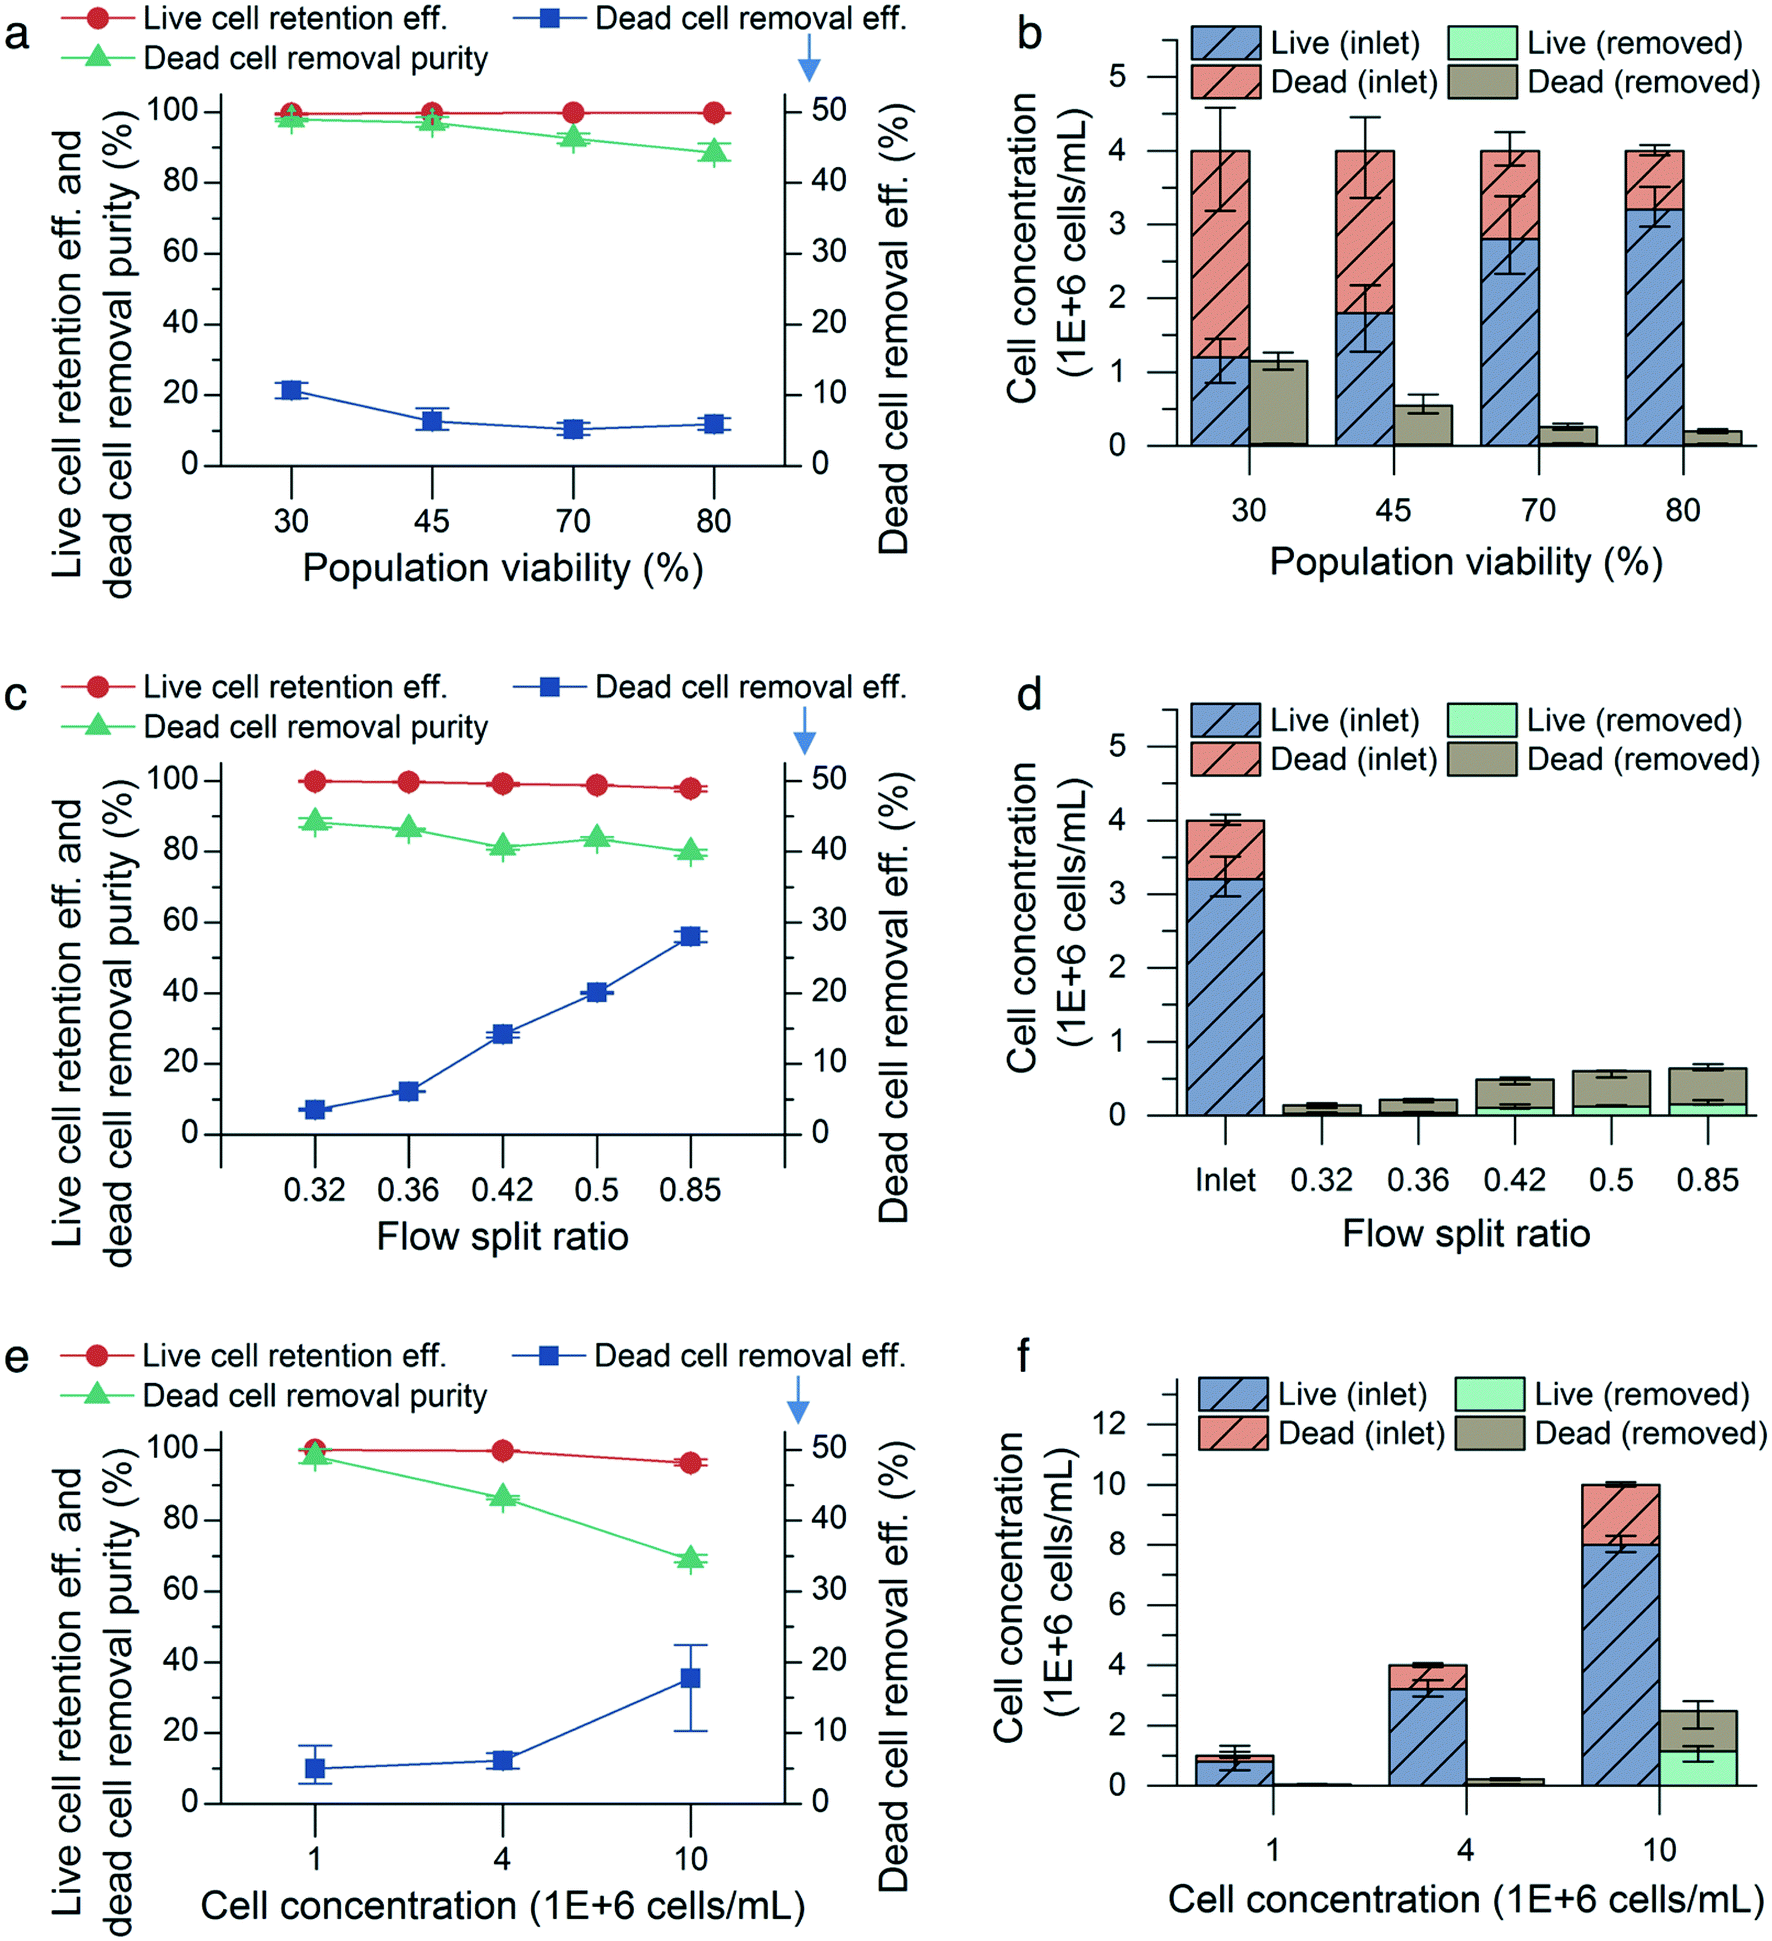 | ||
| Fig. 5 Device characterization using CHO cells. The effects of (a and b) cell viability, (c and d) flow split ratio, and (e and f) cell concentration on live cell retention efficiency, dead cell removal efficiency, dead cell removal purity, and cell concentration in the removed stream (outer outlet). The flow rate was maintained at 1.5 mL min−1 for each condition in (a)–(f). The cell concentration was maintained at 4 million cells per mL in (a)–(d), the flow split ratio was maintained at 0.36 in (a) and (b) and (e) and (f), and the viability was maintained at 80% in (c)–(f). All error bars, data range (n = 3, magnified by a factor of five). | ||
The effect of altering the flow split ratio was more pronounced, increasing the dead cell removal efficiency. The removal efficiency increased from 3.5% (0.5%) to 28.0% (0.6%) (mean (range), n = 3) as the flow split ratio was raised from 0.32 to 0.85 (Fig. 5c). The flow rate was maintained at 1.5 mL min−1, and the cell population viability and concentration were maintained at 80% and 4 million cells per mL, respectively, for each condition. Due to the streamline boundary moving closer to the inner outlet as the flow split ratio was increased, more small, nonviable cells near the outer wall were directed into the outer outlet, thus increasing the dead cell removal efficiency. Additionally, increasing the flow split ratio reduced the viable cell retention efficiency and dead cell purity, which decreased from 99.8% (0.1%) to 97.8% (0.3%) and from 88.3% (2.5%) to 83.6% (0.9%), respectively. This indicated that some small viable cells were directed into the outer outlet as a result of the increased flow split ratio.
The cell concentration is also known to affect the performance of the microfluidic device, as increased cell-to-cell interactions at higher cell concentrations result in broader bands of focused cells and decreased efficiency in inertial focusing.17,21,24 CHO cell populations were flowed through the microfluidic device at concentrations of 1, 4, and 10 million cells per mL, while maintaining a flow rate of 1.5 mL min−1, a viability of 80%, and a flow split ratio of 0.36 for each concentration condition. As expected, the microfluidic device performed worse at 10 million cells per mL in terms of viable cell retention efficiency and dead cell removal purity but not removal efficiency, (Fig. 5e). Decreasing the cell concentration to 1 million cells per mL improved the live cell retention efficiency to 99.9% (0.1%) and the dead cell removal purity to 98.1% (0.8%) with 5% (1.1%) dead cell removal efficiency (mean (range), n = 3).
High-concentration, high-throughput nonviable cell removal by cascaded and parallel configurations
To overcome the drop in live cell retention efficiency and dead cell removal purity in high-concentration culture, we utilized a cascaded configuration22,43–47 with two devices by connecting the outer outlet of a new deep and wide channel device (200 μm inner depth, 140 μm outer depth, 1 mm width) to the inlet of the standard device (Fig. 6a). As described in Fig. 5e, a low input cell concentration (<10 million cells per mL) improves the live cell retention efficiency and dead cell removal purity. The first device reduces the input cell concentration for the second device by focusing CHO cells near the inner wall of the channel. The device with a higher inner depth focuses particles at the inner side regardless of the particle size and flow rate.29 We demonstrated the retention of CHO cells at a high cell concentration (>40 million cells per mL) using this.24 Moreover, its large cross-sectional area (1.7 × 105 μm2) reduces the input pressure to achieve high input flow rates, compared with the 600 μm-wide channel (ESI† Fig. S1). The cascaded configuration was tested with CHO cell populations of similar viability (80%) and cell concentration (10 million cells per mL). The input flow rate to the cascaded device set-up was 8.0 mL min−1 and the flow split ratio of the wide-channel device was adjusted to maintain a flow split ratio of 0.36 and a flow rate of 1.5 mL min−1 into the second device to match the previous experimental conditions. The results from both inner outlets of the first and second devices were combined to calculate the performance metrics. At 10 million cells per mL, the cascaded configuration outperformed the single configuration in terms of live cell retention efficiency and dead cell removal purity, increasing the retention efficiency from 96.2% (0.3%) to 99.9% (0.1%) (mean (range), n = 3) and the dead cell purity from 68.9% (0.4%) to 88.9% (1.2%). The dead cell removal efficiency decreased from 17.7% (2.4%) to 3.4% (0.3%) (Fig. 6b).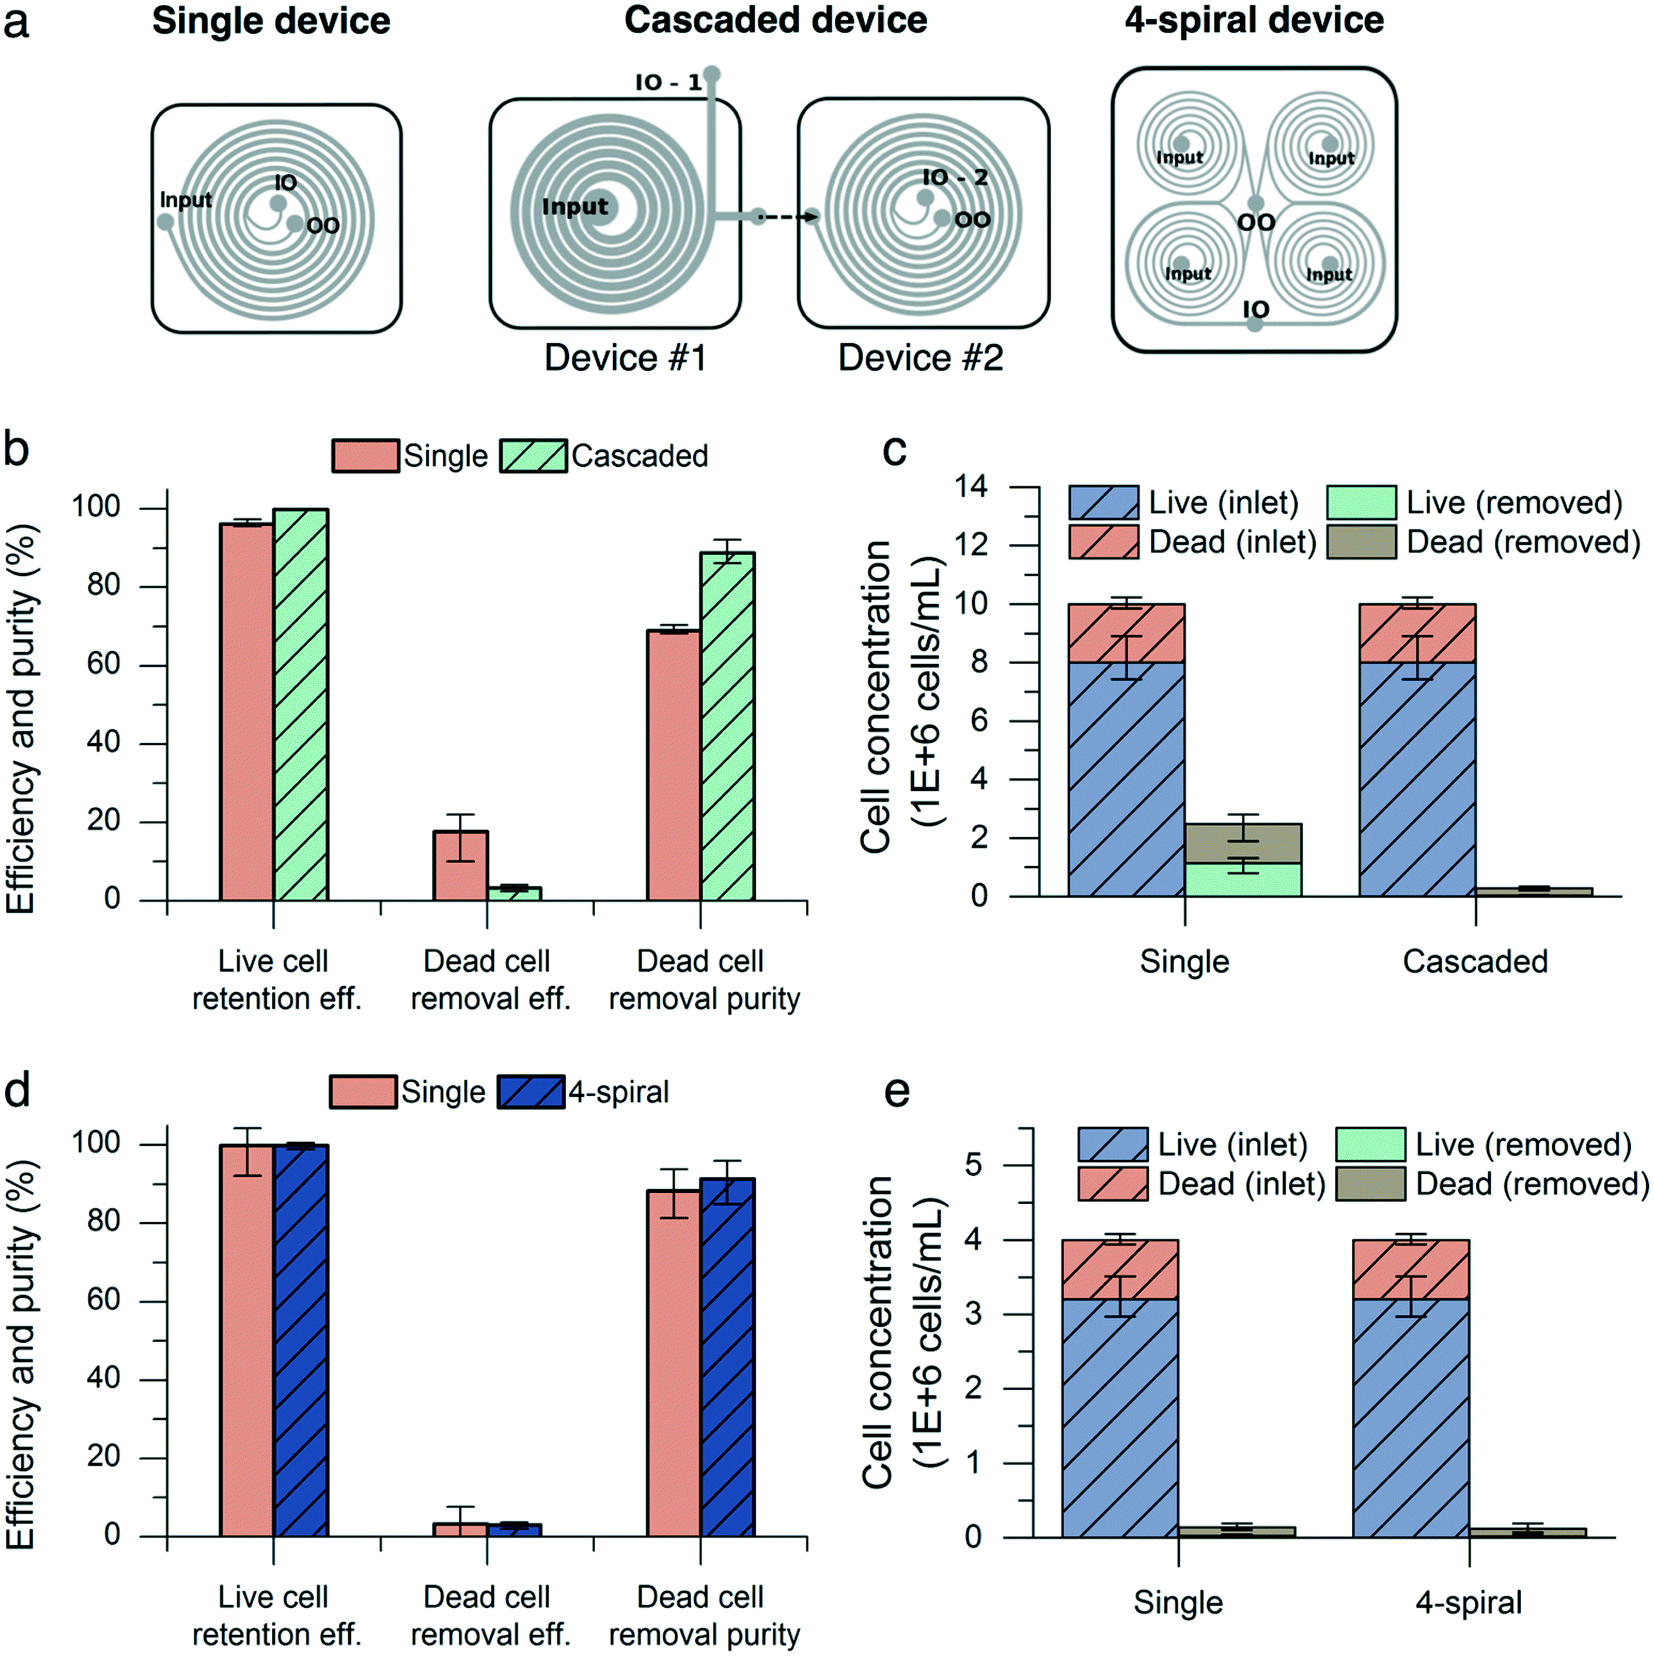 | ||
| Fig. 6 High-concentration, high-throughput nonviable cell removal by cascaded and parallel configurations. (a) Single, cascaded, and parallel spiral configurations (IO: inner outlet, OO: outer outlet). (b and c) Comparison between single and cascaded (for high-concentration) configurations. The flow rate was kept at 1.5 mL min−1 for the single device and at 8 mL min−1 for the cascaded device (equivalent to a flow rate of 1.5 mL min−1 into device #2). The flow split ratio was kept at 0.36 for all conditions. Both configurations were tested with a concentration of 10 million cells per mL to emulate high-concentration culture conditions. Error bars, data range (n = 3, magnified by a factor of five). (d and e) Comparison between single and four-spiral (for high-throughput) configurations. The flow rate was kept at 1.5 mL min−1 for the single device and at 6.0 mL min−1 for the four-spiral device (equivalent to a flow rate of 1.5 mL min−1 into each spiral). The flow split ratio was kept at 0.3 and the concentration was maintained at 4 million cells per mL for all conditions. Error bars, data range (n = 3, magnified by a factor of five). | ||
We next demonstrated the high-throughput capability of the microfluidic device by multiplexing the chips together to form a four-spiral device (Fig. 6a). The four-spiral device was able to accommodate a flow rate of 6.0 mL min−1 (equivalent to a 1.5 mL min−1 flow rate in the single-spiral device), without sacrificing performance when tested with an input concentration of 4 million cells per mL (Fig. 6d). A similar performance was seen in the retention efficiency (99.9% for the four-spiral device and 99.8% for the single chip), dead cell removal efficiency (3.0% for the four-spiral device and 3.4% for the single chip), and dead cell removal purity (91.3% for the four-spiral device and 88.3% for the single chip).
In the parallel configuration, the outlets were combined together, and this changed the direction of the flow to inside-out. This may change the focusing behavior of particles by decreasing the Dean number (increasing the radius of the curvature) over their movement along the fluid path.48 In our parallel device, 57 μm and 180 μm shifts of the equilibrium position were observed for 6 and 10 μm beads, respectively (ESI† Fig. S3). Although the parallel device presented here still exhibits baseline separation of 6 and 10 μm beads and a 0.3 flow split ratio enables selective removal of small particles, preservation of the fluid direction (outside-in) is required for accurate scale-out of the spiral microfluidic device.
Limitation and potential use in perfusion culture
Although many inertial focusing-based cell separation/removal devices with high separation/removal efficiencies (>90%) have been reported previously,49 the size ranges of the cell populations tested were not largely overlapping. Our work demonstrates selective removal of small nonviable cells from mixed viable and nonviable CHO cell populations whose size ranges are overlapping. As there is a size overlap between viable and nonviable cells (Fig. 2c), the maximum nonviable cell removal efficiency that our method can achieve is limited, particularly because the number of viable cells lost should be minimized in this particular application. Thus, the presented work using size-based inertial sorting has a limitation of low single-pass dead cell removal efficiency (<30%), which reflects the distributions of original cell populations. One method to improve the dead cell removal efficiency is to increase the flow split ratio to contain more dead cells in the outer outlet. However, this would in turn decrease the viable cell retention efficiency and dead cell removal purity. Instead, a combination of the presented system with other label-free cell separation technologies such as microstructures, acoustophoresis, or dielectrophoresis based on differences in deformability, shape, surface properties, density, or electrical polarizability5 could be contemplated to increase the dead cell removal efficiency further. However, this will incur additional complexity in the system.The merit of the presented technique should be evaluated by many other factors (cell concentration capacity, volumetric throughput, simplicity, long-term usability, etc.), not just by the single-pass dead cell removal efficiency. The high throughput dead cell removal demonstrated in this work can be used to improve engineering for bioreactors in perfusion culture. Small nonviable cells are continuously generated in the bioreactor over cultivation time.50 Moreover, one typically uses up to 2 vessel volumes per day (VVD) perfusion rates for several weeks to months, meaning 2× the volume of the bioreactor is perfused on a daily basis.24 Therefore, cells in the bioreactor in a perfusion culture will be constantly reprocessed by the viable cell retention/nonviable cell removal system shown in this work, meaning even a marginal removal rate (<30%) can have a significant impact on reducing the number of dead cells present in the bioreactor. A low removal efficiency compounded over the course of several weeks would result in an overall removal of a significant number of nonviable cells. In fact, according to standard Monod growth kinetics for mammalian cell culture,51 reduction of dead cells over continuous culture can be estimated using the death rate, cultivation time, the working volume of a bioreactor, the volumetric flow rate for the perfusate, and single-pass dead cell removal efficiency (ESI† Table S1). For example, a 6.1% single-pass dead cell removal efficiency can achieve 82.8% reduction of total dead cells over continuous 4 day operation, assuming a 350 mL working volume, a 700 mL per day perfusion rate, and a 0.02 h−1 death rate. This idea is related to recirculation-based separation,37 where we demonstrated microfluidics efficient leukocyte recovery from patient airway secretion, simply by repeating the separation operation.
Conclusions
In this work, we demonstrated the ability of a spiral microfluidic device to remove small (<10 μm) nonviable cells and debris from a mammalian suspension culture. Despite the size overlap between viable and nonviable CHO cells, the device showed acceptable nonviable cell removal efficiency (3.5–28.0%) with high removal purity (88.3–83.6%) as well as high live cell retention efficiency (97.8–99.8%) at 4 million cells per mL with 80% viability. Furthermore, we demonstrated two modifications to the device, a multiplexed four-spiral device and a two-spiral cascaded configuration, which enabled the removal of small nonviable cells under high-throughput (6–8 mL min−1) and high-concentration (10 million cells per mL) conditions, respectively. There are significant benefits associated with the removal of nonviable cells from a cell culture, and the method we presented here opens up the potential for further applications (i.e., industrial scale cultures that may require a higher throughput or cell concentration than previous methods are able to support).Experimental
Device fabrication
The devices were fabricated according to standard soft lithography techniques described previously.24 Two different devices were designed; for the removal of nonviable cells and debris in low (<5 million cells per mL) concentration samples, the microfluidic device had an inner depth of 80 μm, an outer depth of 130 μm, and a width of 600 μm. For higher concentration samples, the microchannel dimensions were modified (inner depth: 200 μm, outer depth: 140 μm, width: 1 mm). Aluminum master molds were designed using 3D modeling software (Rhinoceros, McNeel North America, USA) and fabricated via a micromilling machine (Whits Technologies, Singapore). A 10:1 ratio between the polydimethylsiloxane (PDMS) base and curing agent (Sylgard 184, Dow Corning Inc.) was mixed and poured into the master mold after degassing. The mold was cured at 150 °C on a hot plate for 15 minutes and fluidic access holes were punched for the inlet, inner outlet, and outer outlet with a 4 mm biopsy punch (15110–40, Ted Pella, USA). The prepared device was irreversibly bonded to a glass microscope slide (260230, Ted Pella, USA) using an oxygen plasma machine (Harrick Plasma Cleaner, Harrick Plasma, USA) and baked at 95 °C overnight on a hot plate to further enhance the bonding strength.
Batch culture of CHO cells
CHO-DG44 cell lines producing human IgG1 against CD40 ligand were a gift from Biogen Idec (MA, USA). Suspension cultures were performed in a spinner flask (4500-500, PYREX ProCulture Spinner Flask, Corning, USA). A commercial culture medium (12681011, CD OptiCHO™, Thermo Fisher Scientific, USA) was used to grow cells. Daily culture samples were analyzed using automated cell culture analysis equipment (FLEX and CDV bioanalyzers, NovaBiomedical, MA, USA) to measure the cell concentration, viability, live cell diameter, pH, and nutrient/metabolite concentrations.Sample preparation and experimental set-up
Polystyrene beads (Polysciences Inc., USA) and CHO cells were prepared for the characterization of the microfluidic device. Beads were diluted in DI water to reach a concentration of 4 million particles per mL to match typical batch culture concentrations. CHO cells were obtained from batch cultures and diluted with the culture medium to the desired concentration. To achieve a high concentration (>5 million cells per mL), cells were centrifuged at 193g for 5 minutes (Allegra™ X-22 Centrifuge, BECKMAN COULTER, CA, USA).Characterization experiments were conducted by connecting the inlet of the microfluidic device to a syringe (BD Luer-Lok™ tip syringe, Becton, Dickinson and Company, USA) loaded with the input sample. In the cascaded configuration with two connected microfluidic devices, the syringe was connected to the inlet of the deep and wide device (200 μm inner depth, 140 μm outer depth, 1 mm width). The outer outlet of the deep and wide device was connected to the inlet of the second, narrow-channel device with silicone tubing (Masterflex, Cole-Parmer, USA). A syringe pump (Harvard Apparatus, USA) infused the sample into the device at a constant flow rate. The flow split ratio was calculated as the ratio of the weight of the solution collected from the outer outlet to that of the inner outlet. To calibrate the flow split ratio, the length of the small-diameter outer outlet tubing (EW-06420-02, Cole-Parmer, USA) was altered. Increasing the tubing length increased the fluidic resistance of the outer outlet, thereby decreasing the flow split ratio.
For characterization using beads, images of the focusing behavior of the beads in the microchannel were taken with a high-speed camera (Phantom V9.1, Vision Research, USA) and analyzed using ImageJ.52 Image processing was performed by subtracting a background image of the empty microchannel from the captured image and converting the result to 16-bit for threshold adjustment. Bead location coordinates were quantified via ImageJ particle analysis, with the circularity adjusted to 0.5–1.0 to exclude noise and debris.
For characterization using CHO cells, three sets of inner outlet and outer outlet samples (0.5 mL per sample) were taken sequentially for each experimental condition and analyzed using the methods described in the next section.
Viability assay and flow cytometric analysis
Cells collected from the inner and outer outlets were stained with green-fluorescent Calcein-AM (emission = 515 nm) and red-fluorescent ethidium homodimer-1 (emission = 635 nm) (L3224, Thermo Fisher, USA). Calcein-AM indicates intracellular esterase activity, selectively dyeing viable cells, while ethidium homodimer-1 indicates loss of plasma membrane integrity, selectively dyeing nonviable cells. A working solution of Calcein-AM was prepared by making an 80-fold dilution of Calcein-AM stock solution in dimethyl sulfoxide (472301, MilliporeSigma, USA). 0.5 mL samples of cells were stained with 1 μL of Calcein-AM working solution and 0.5 μL of ethidium homodimer-1 stock solution for 30 min at room temperature, protected from light. Afterwards, the samples were analyzed on a BD Accuri C6 flow cytometer (BD Biosciences, USA) to determine performance metrics. Fluorescence was viewed with FL-1 (green) and FL-3 (red) detectors for Calcein-AM and ethidium homodimer-1, respectively. Viable cells exhibited high green fluorescence and low red fluorescence, whereas nonviable cells exhibited low green fluorescence and high red fluorescence. Since the same sample volume was maintained throughout all the experiments performed, the concentrations of viable and nonviable cells were calculated as the number of events (particles) within the corresponding gated regions. Given that there is a correlation between the light forward scatter on the flow cytometer and the cell diameter for spherical cells,53 we generated a size calibration curve using areas of light forward scatter (FSC) and cell diameters measured using the automated analyzer (CDV Bioanalyzer, NovaBiomedical, MA, USA).Author contributions
T. K. designed the devices; T. K. and R. Y. designed the experiments; T. K. and R. Y. maintained the CHO cell line; T. K. and R. Y. fabricated the devices and performed the experiments; T. K., R. Y., J.-F. P. H., and J. H. analyzed the data; the manuscript was written through contributions of all the authors. All the authors have given approval to the final version of the manuscript.Conflicts of interest
There are no conflicts of interest to declare.Acknowledgements
This work was mainly supported by Singapore-MIT Alliance for Research and Technology (SMART) Centre BioSyM IRG, as well as SMART Innovation Centre grants (ING137075-BIO and ING1510101-BIO). T. Kwon acknowledges the financial support from the Samsung Scholarship. R. Yao acknowledges the MIT SuperUROP (the Advanced Undergraduate Research Opportunities Program) for its support during 2016–2017. We also would like to acknowledge the Bioimaging and Chemical Analysis Facilities Core at the MIT Center for Environmental Health Sciences for the use of their flow cytometer.References
- C. D. Gregory, J. D. Pound, A. Devitt, M. Wilson-Jones, P. Ray and R. J. Murray, mAbs, 2009, 1, 370–376 CrossRef PubMed.
- D. C. F. Wong, K. T. K. Wong, L. T. Goh, C. K. Heng and M. G. S. Yap, Biotechnol. Bioeng., 2005, 89, 164–177 CrossRef PubMed.
- S. Elmore, Toxicol. Pathol., 2007, 35, 495–516 CrossRef PubMed.
- F. de Boer, A. M. Dräger, H. M. Pinedo, F. L. Kessler, M. Monnee-van Muijen, G. Weijers, G. Westra, E. van der Wall, T. Netelenbos, J. W. Oberink, P. C. Huijgens and G. J. Schuurhuis, J. Hematother. Stem Cell Res., 2002, 11, 951–963 CrossRef PubMed.
- D. R. Gossett, W. M. Weaver, A. J. MacH, S. C. Hur, H. T. K. Tse, W. Lee, H. Amini and D. Di Carlo, Anal. Bioanal. Chem., 2010, 397, 3249–3267 CrossRef PubMed.
- H. Li and R. Bashir, Sens. Actuators, B, 2002, 86, 215–221 CrossRef.
- C. P. Jen and T. W. Chen, Biomed. Microdevices, 2009, 11, 597–607 CrossRef PubMed.
- H. Shafiee, M. B. Sano, E. a. Henslee, J. L. Caldwell and R. V. Davalos, Lab Chip, 2010, 10, 438–445 RSC.
- S. Patel, D. Showers, P. Vedantam, T. R. Tzeng, S. Qian and X. Xuan, Biomicrofluidics, 2012, 6, 1–12 CrossRef PubMed.
- A. H. J. Yang and H. T. Soh, Anal. Chem., 2012, 84, 10756–10762 CrossRef PubMed.
- M. C. Zalis, J. F. Reyes, P. Augustsson, S. Holmqvist, L. Roybon, T. Laurell and T. Deierborg, Integr. Biol., 2016, 8, 332–340 RSC.
- N. Tottori, T. Nisisako, J. Park, Y. Yanagida and T. Hatsuzawa, Biomicrofluidics, 2016, 10, 14125 CrossRef.
- M. Islam, H. Brink, S. Blanche, C. DiPrete, T. Bongiorno, N. Stone, A. Liu, A. Philip, G. Wang, W. Lam, A. Alexeev, E. K. Waller and T. Sulchek, Sci. Rep., 2017, 7, 1997 CrossRef PubMed.
- Y. Yildizhan, N. Erdem, M. Islam, R. Martinez-Duarte and M. Elitas, Sensors, 2017, 17, 1–13 CrossRef PubMed.
- M. Karle, S. K. Vashist, R. Zengerle and F. Von Stetten, Anal. Chim. Acta, 2016, 929, 1–22 CrossRef PubMed.
- M. A. Hoeve, P. A. De Sousa and N. A. Willoughby, in Bioprocessing for Cell Based Therapies, John Wiley & Sons, Ltd, 2017, pp. 127–165 Search PubMed.
- H. Amini, W. Lee and D. Di Carlo, Lab Chip, 2014, 14, 2739–2761 RSC.
- J. M. Martel and M. Toner, Annu. Rev. Biomed. Eng., 2014, 16, 371–396 CrossRef PubMed.
- J. Zhang, S. Yan, D. Yuan, G. Alici, N.-T. Nguyen, M. Ebrahimi Warkiani and W. Li, Lab Chip, 2016, 16, 10–34 RSC.
- M. E. Warkiani, L. Wu, A. K. P. Tay and J. Han, Annu. Rev. Biomed. Eng., 2015, 17, 1–34 CrossRef PubMed.
- M. E. Warkiani, A. K. P. Tay, G. Guan and J. Han, Sci. Rep., 2015, 5, 11018 CrossRef PubMed.
- B. Miller, M. Jimenez and H. Bridle, Sci. Rep., 2016, 6, 36386 CrossRef PubMed.
- J. P. Dijkshoorn, M. A. I. Schutyser, R. M. Wagterveld, C. G. P. H. Schroën and R. M. Boom, Sep. Purif. Technol., 2017, 173, 86–92 CrossRef.
- T. Kwon, H. Prentice, J. De Oliveira, N. Madziva, M. E. Warkiani, J.-F. P. Hamel and J. Han, Sci. Rep., 2017, 7, 6703 CrossRef PubMed.
- A. Kantardjieff and W. Zhou, in Mammalian Cell Cultures for Biologics Manufacturing, ed. W. Zhou and A. Kantardjieff, Springer Berlin Heidelberg, Berlin, Heidelberg, 2014, pp. 1–9 Search PubMed.
- D. Kuystermans, M. Avesh and M. Al-Rubeai, Cytotechnology, 2016, 68, 399–408 CrossRef PubMed.
- R. P. Singh, M. Al-Rubeai, C. D. Gregory and A. N. Emery, Biotechnol. Bioeng., 1994, 44, 720–726 CrossRef PubMed.
- N. Arden and M. J. Betenbaugh, Trends Biotechnol., 2004, 22, 174–180 CrossRef PubMed.
- G. Guan, L. Wu, A. A. Bhagat, Z. Li, P. C. Y. Chen, S. Chao, C. J. Ong and J. Han, Sci. Rep., 2013, 3, 1475 CrossRef PubMed.
- L. Wu, G. Guan, H. W. Hou, A. A. S. Bhagat and J. Han, Anal. Chem., 2012, 84, 9324–9331 CrossRef PubMed.
- M. Rafeie, J. Zhang, M. Asadnia, W. Li and M. E. Warkiani, Lab Chip, 2016, 16, 2791–2802 RSC.
- W. Lee, D. Kwon, W. Choi, G. Y. Jung and S. Jeon, Sci. Rep., 2015, 5, 7717 CrossRef PubMed.
- K. Choi, H. Ryu, K. J. Siddle, A. Piantadosi, L. Freimark, D. J. Park, P. Sabeti and J. Han, Anal. Chem., 2018, 90, 4657–4662 CrossRef PubMed.
- M. E. Warkiani, G. Guan, K. B. Luan, W. C. Lee, A. A. S. Bhagat, P. K. Chaudhuri, D. S.-W. Tan, W. T. Lim, S. C. Lee, P. C. Y. Chen, C. T. Lim and J. Han, Lab Chip, 2014, 14, 128–137 RSC.
- L. Yin, Y. Wu, Z. Yang, C. A. Tee, V. Denslin, Z. Lai, C. T. Lim, E. H. Lee and J. Han, Lab Chip, 2018, 18, 878–889 RSC.
- Z. Poon, W. C. Lee, G. Guan, L. M. Nyan, C. T. Lim, J. Han and K. J. Van Vliet, Stem Cells Transl. Med., 2015, 4, 56–65 CrossRef PubMed.
- H. Ryu, K. Choi, Y. Qu, T. Kwon, J. S. Lee and J. Han, Anal. Chem., 2017, 89, 5549–5556 CrossRef PubMed.
- M. S. Syed, M. Rafeie, D. Vandamme, M. Asadnia, R. Henderson, R. A. Taylor and M. E. Warkiani, Bioresour. Technol., 2018, 252, 91–99 CrossRef PubMed.
- S. Sofela, S. Sahloul, M. Rafeie, T. Kwon, J. Han, M. E. Warkiani and Y.-A. Song, Lab Chip, 2018, 18, 679–687 RSC.
- J. Zhang, W. Li and G. Alici, in Advanced Mechatronics and MEMS Devices II, ed. D. Zhang and B. Wei, Springer International Publishing, Cham, 2017, pp. 563–593 Search PubMed.
- X. Wang and I. Papautsky, Lab Chip, 2015, 15, 1350–1359 RSC.
- C. Mohamed Yousuff, N. H. B. Hamid, I. H. Kamal Basha and E. T. Wei Ho, AIP Adv., 2017, 7, 085004 CrossRef.
- T. H. Kim, H. J. Yoon, P. Stella and S. Nagrath, Biomicrofluidics, 2014, 8, 64117 CrossRef PubMed.
- A. E. Reece, K. Kaastrup, H. D. Sikes and J. Oakey, RSC Adv., 2015, 5, 53857–53864 RSC.
- L. Sprenger, S. Dutz, T. Schneider, S. Odenbach and U. O. Häfeli, Biomicrofluidics, 2015, 9, 44110 CrossRef PubMed.
- M. Robinson, H. Marks, T. Hinsdale, K. Maitland and G. Coté, Biomicrofluidics, 2017, 11, 24109 CrossRef PubMed.
- A. Abdulla, W. Liu, A. Gholamipour-Shirazi, J. Sun and X. Ding, Anal. Chem., 2018, 90, 4397–4405 CrossRef PubMed.
- J. M. Martel and M. Toner, Phys. Fluids, 2012, 24, 1–13 Search PubMed.
- J. M. Martel-Foley, in Microtechnology for Cell Manipulation and Sorting, ed. W. Lee, P. Tseng and D. Di Carlo, Springer International Publishing, Cham, 2017, pp. 193–223 Search PubMed.
- S. M. Mercier, B. Diepenbroek, D. Martens, R. H. Wijffels and M. Streefland, Biotechnol. Bioeng., 2015, 112, 569–578 CrossRef PubMed.
- K. D. Wittrup, 10.37 Chemical and Biological Reaction Engineering Lecture 13: Biological Reactors- Chemostats, http://ocw.mit.edu/, (accessed 15 July 2018) Search PubMed.
- C. A. Schneider, W. S. Rasband and K. W. Eliceiri, Nat. Methods, 2012, 9, 671–675 CrossRef PubMed.
- V. K. Michelou, M. W. Lomas and D. L. Kirchman, Limnol. Oceanogr., 2011, 56, 323–332 CrossRef.
Footnotes |
| † Electronic supplementary information (ESI) available. See DOI: 10.1039/c8lc00250a |
| ‡ These authors contributed equally. |
| This journal is © The Royal Society of Chemistry 2018 |