
 Open Access Article
 This Open Access Article is licensed under a Creative Commons Attribution-Non Commercial 3.0 Unported Licence
Shear stress induces expression, intracellular reorganization and enhanced Notch activation potential of Jagged1†
R. C. H.
Driessen
 ab,
O. M. J. A.
Stassen
a,
M.
Sjöqvist
c,
F.
Suarez Rodriguez
c,
J.
Grolleman
a,
C. V. C.
Bouten
ab and
C. M.
Sahlgren
*abc
ab,
O. M. J. A.
Stassen
a,
M.
Sjöqvist
c,
F.
Suarez Rodriguez
c,
J.
Grolleman
a,
C. V. C.
Bouten
ab and
C. M.
Sahlgren
*abc
aDepartment of Biomedical Engineering, Eindhoven University of Technology, Eindhoven, The Netherlands. E-mail: c.m.sahlgren@tue.nl
bInstitute for Complex Molecular Systems, Eindhoven University of Technology, Eindhoven, The Netherlands
cFaculty of Science and Engineering, Biosciences, Åbo Akademi University, Turku, Finland
First published on 17th October 2018
Abstract
Notch signaling and blood flow regulate vascular formation and maturation, but how shear stress affects the different components of the Notch pathway in endothelial cells is poorly understood. We show that laminar shear stress results in a ligand specific gene expression profile in endothelial cells (HUVEC). JAG1 expression increases while DLL4 expression decreases. Jagged1 shows a unique response by clustering intracellularly six to nine hours after the onset of flow. The formation of the Jagged1 clusters requires protein production, ER export and endocytosis. Clustering is associated with reduced membrane levels but is not affected by Notch signaling activity. Jagged1 relocalization is reversible, the clusters disappear and membrane levels increase upon removal of shear stress. We further demonstrate that the signaling potential of endothelial cells is enhanced after exposure to shear stress. Together we demonstrate a Jagged1 specific shear stress response for Notch signaling in endothelial cells.
Insight, innovation, integrationHemodynamics and Notch signaling, a highly conserved cell–cell signaling pathway, play an important role in vascular development. Several studies have shown that Notch receptors are essential in endothelial cells (ECs) to respond to shear stress. The response of ECs on a Notch ligand level is however unexplored. Here we show a unique ligand specific response to shear stress on gene expression and protein levels, with a specific role for Jagged1. Jagged1 clusters in response to flow, a process both dependent on protein production and endocytosis. We further demonstrate that the signaling potential of endothelial cells is enhanced after exposure to shear stress. Together we demonstrate a Jagged1 specific shear stress response for Notch signaling in endothelial cells. |
Introduction
Fluid shear stress, the frictional force acting on the vessel wall by blood flow, plays a key role in the development of the vascular system.1 The onset of shear stress is essential for correct vascular remodeling, and reducing fluid shear stress by either reducing flow or viscosity, leads to an underdeveloped vascular tree.2 The cells sensing and responding to shear stress are the endothelial cells (ECs), forming the contact layer between the blood flow and the vessel wall. Shear stress regulates various processes in ECs, such as alignment of ECs with flow direction, vasoconstriction or induction of arteriovenous specification.3–7 The molecular mechanisms by which ECs sense fluid shear stress have long been subject of investigation.8,9The Notch pathway is of key importance for cardiovascular development and homeostasis.10,11 Notch is a cell contact dependent signaling pathway where Notch receptors (Notch 1–4) are activated by binding to Notch ligands (Jagged1, 2 and Delta1, 3, 4) on neighboring cells. Systemic removal of ligands Deltalike ligands, Dll1, Dll4 and Jagged1 in mice results in embryonic lethality at E12, E9.5-10 and E11.5-12.0 respectively, due to vascular defects.12–14 Mutations and deregulation of Notch lead to vascular malformations and cardiovascular diseases, like Alagille syndrome or CADASIL, related to mechanical dysfunction of the vasculature, that in many cases can be aggravated by changes in blood flow.15–18 These findings demonstrate the relevance of Notch signaling in vascular development.
Recent data show that Notch signaling and hemodynamics are coupled. In zebrafish endocardial cells Notch signaling is lost upon inhibition of the heartbeat, showing that Notch is strain and/or shear responsive.19 Specifically, the Notch signaling pathway is responsive to shear stress. Reduction of shear stress and the removal of endothelial lining both lead to reduced expression of Dll4, Jagged1 and Notch1 in zebrafish heart.20 Notch1 expression is required for endothelial alignment and the onset of shear stress activates Notch signaling.21 The transmembrane domain of Notch1, which remains in the membrane after receptor cleavage and activation in response to flow, is required to establish endothelial barrier function via an interaction with VE-cadherin, LAR and Trio.22 Most studies that analyze the effect of hemodynamic forces on Notch signaling in ECs focus on the effect on Notch receptors and Notch signal activation, whereas the effect of shear stress on ligands in ECs is unexplored.
In this study, we investigate the shear stress response of Notch signaling in ECs with a special focus on the Notch ligands. The gene expression and protein localization of both ligands and receptors were analyzed. We elucidated the ligand specific response on gene expression and protein localization in more detail with pharmacological inhibition of protein production, ER export and endocytosis. Finally we analyzed the functional effect of shear stress on ECs by culturing them together with Notch activity reporter cells and assessed the signal sending potential of different ECs exposed to shear stress.
Results
Shear stress alters the subcellular localization of Jagged1
The localization of Notch receptors and ligands is tightly regulated to control Notch activation through the levels of active proteins on the plasma membrane.23–25 To study the influence of shear stress on ligand and receptor localization, ECs exposed to 1 Pa shear stress for 24 hours were fixed and stained for different Notch receptors and ligands (Fig. 1). All detected receptors (Notch1, 3 and 4) exhibited a diffuse or perinuclear localization that was similar under both static and flow conditions. Under static conditions all detected ligands displayed a diffuse distribution. A similar distribution of ligands was found in cells subjected to shear stress, with the exception of the Jagged1 ligand. Interestingly, a distinct relocalization of Jagged1 into subcellular clusters was observed in ECs under flow conditions (Fig. 1L). A similar clustering effect was found in arterial EC (Fig. S1, ESI†). To study if Notch receptor cleavage and activation are important for the response of Jagged1 to shear stress, we inhibited Notch activity by the γ-secretase inhibitor DAPT. The relocalization of Jagged1 under shear stress was not affected by DAPT (Fig. S2, ESI†).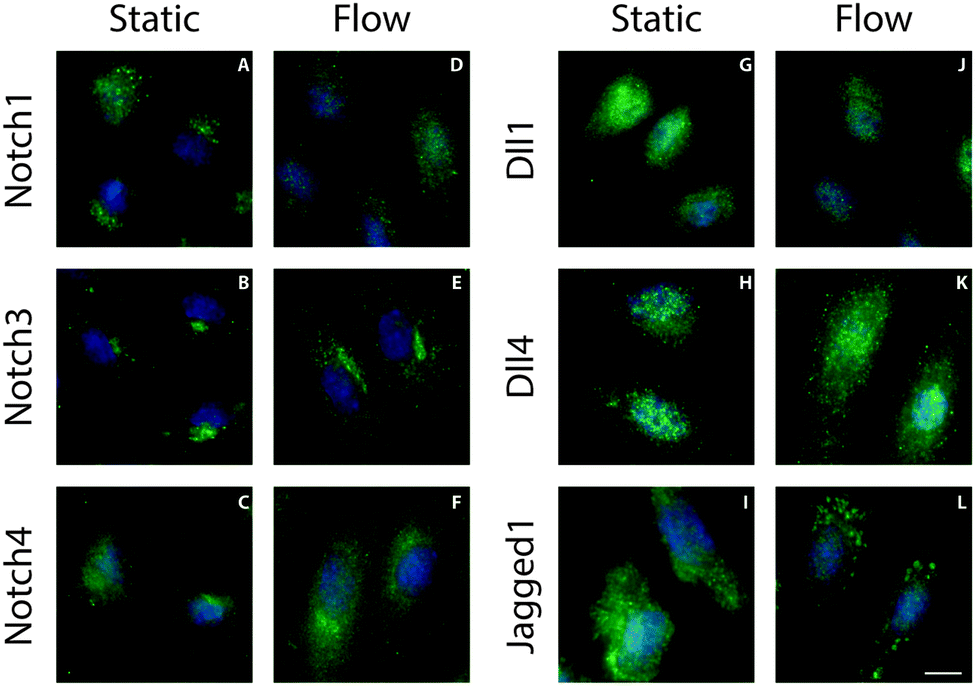 | ||
| Fig. 1 Receptor and ligand localization under static and flow conditions. representative fluorescence microscopy images of Notch1 (A and D), Notch3 (B and E), Notch4 (C and F), Delta1 (G and J), Delta4 (H and K) and Jagged1 (I and L) in endothelial cells that have been cultured under static or flow conditions. The Notch receptors and ligands are shown in green and the nuclei in blue. Only the Jagged1 ligand localized in clusters under flow conditions. Scale bar represents 10 μm. | ||
We next studied the position of these clusters in the cell by immunostaining permeabilized and non-permeabilized cells with an antibody recognizing the extracellular domain of Jagged1. Permeabilization allows penetration of the antibody into the cell and staining of intracellular Jagged1, whereas in non-permeabilized cells the antibody only detects Jagged1 presented on the cell surface. Permeabilized and non-permeabilized cells were stained for Jagged1 and integrin β1 and analyzed with confocal microscopy to distinguish between the total cellular and the membrane-only fraction of Jagged1 (Fig. 2). The integrins could be visualized in both conditions (Fig. 2A and B). However, the large Jagged1 clusters were only detected in the ECs that were permeabilized (Fig. 2D), demonstrating that the shear stress induced large Jagged1 clusters are intracellular close to the plasma membrane. Sectioning (surface rendered) confocal data from the basal membrane upwards further demonstrates that the integrins are located more basally than the Jagged1 clusters (Fig. 2E–G and Fig. S3, ESI†).
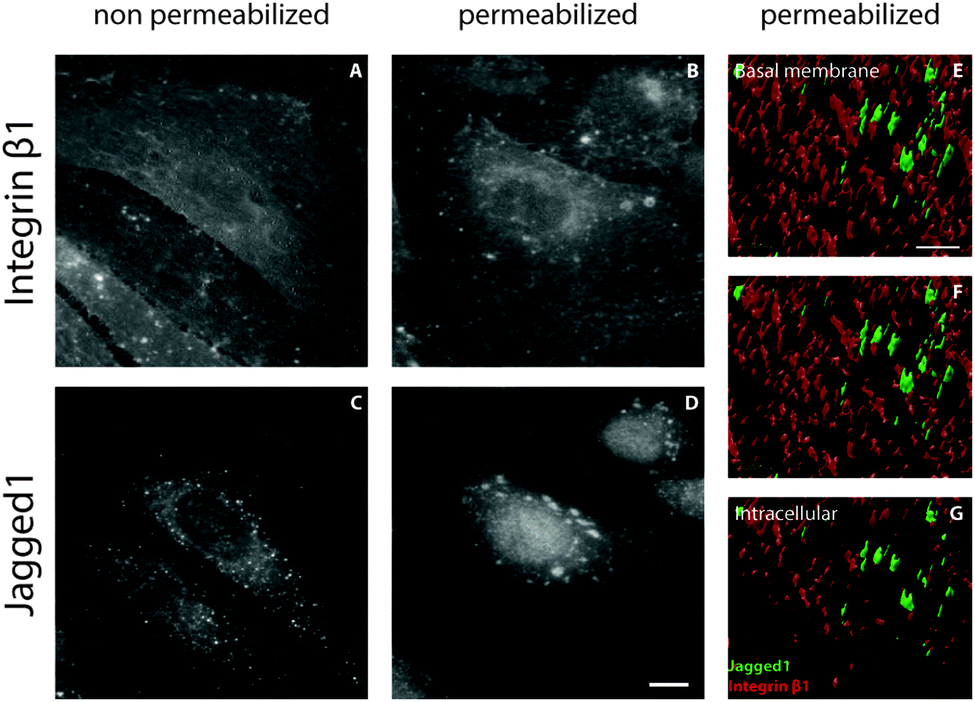 | ||
| Fig. 2 Localization analysis of the Jagged1 clusters. (A–D) Representative fluorescence microscopy images of integrin β1 (A and B) and Jagged1 (C and D) in non-permeabilized and permeabilized cells. Jagged1 clustering was only detected in permeabilized cells. Scale bar represents 10 μm. (E–G) Surface rendered confocal images of Jagged1 (green) and integrin β1 (red). Slicing performed at different confocal sections with Δz = 500 nm and (E) most closest to the cell membrane, (G) most intracellular. Only the basal side is visualized. Scale bar represents 2.5 μm. | ||
Shear stress affects expression of Notch receptors and ligands in a ligand-specific manner
To gain a more detailed understanding of the shear stress response of ECs we analyzed the gene expression profile in ECs exposed to 1 Pa shear stress for 24 hrs. We observed that the expression levels of both NOTCH1 and NOTCH3 were downregulated, 1.8 and 13.7 times respectively (Fig. 3A). No difference in the expression of NOTCH4 was observed between static and flow conditions. In contrast to the Notch receptors, the ligands demonstrated distinct responses (Fig. 3A). Expression of DLL4 was decreased 8.1 fold while the expression of JAG1 was increased 3.3 fold. There was no difference in DLL1 expression. Blocking Notch activity with DAPT did not affect the shear stress response of the Notch receptors and ligands (Fig. S4, ESI†). We observed similar gene expression profiles in response to shear stress (1 Pa, 24 h) in arterial EC (Fig. S5, ESI†).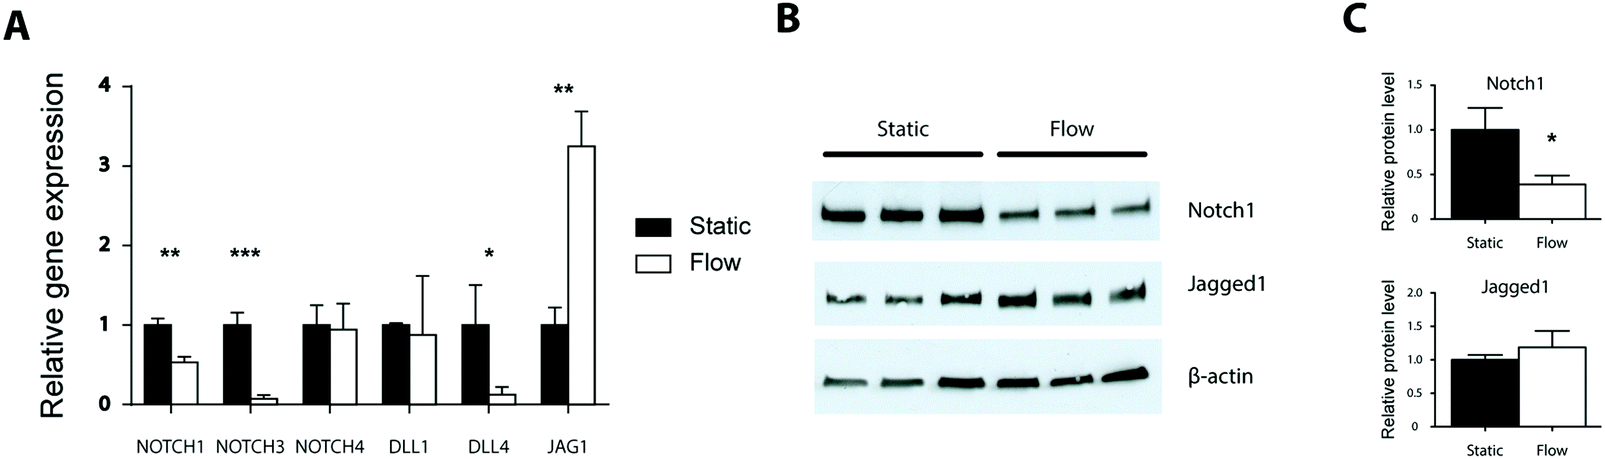 | ||
Fig. 3 Notch gene expression profile and protein levels in ECs in response to shear stress. (A) Gene expression profile of endothelial cells under shear stress. The expression of NOTCH1 and NOTCH3 were downregulated. DLL4 expression was downregulated whereas JAG1 expression was upregulated. Gene expression levels under static conditions (black bars) are normalized to 1. (B) Western blot for Notch1 and Jagged1 with β-actin as loading control. (C) Quantification of Notch1 and Jagged1 levels normalized to β-actin. Significance is indicated as *![[thin space (1/6-em)]](https://www.rsc.org/images/entities/char_2009.gif) p < 0.05, **p < 0.01, ***p < 0.001. Error bars are defined as the standard deviation. p < 0.05, **p < 0.01, ***p < 0.001. Error bars are defined as the standard deviation. | ||
As expression of NOTCH1 and JAG1 was also changed in response to flow, we analyzed the levels of these proteins by western blotting (Fig. 3B and C). Notch1 protein levels were decreased under shear stress in line with the reduced gene expression. Jagged1 protein levels showed an increasing trend.
Jagged1 clustering is a reversible process
To gain more insight into the kinetics of the formation of the Jagged1 clusters, ECs were subjected to shear stress for different periods of time (Fig. 4). After three hours no clustering was visible, but after six hours a small population of the cells started to display distinct clustering of Jagged1. From nine hours after the onset of shear stress most cells showed clear Jagged1 clusters. To verify if clustering is solely a shear stress response the flow was stopped after 24 hours and the cells were cultured statically for a subsequent six or 24 hours. Directly after the flow stopped clear clustering was observed. When the cells were cultured for an additional six hours less prominent clustering was found and at 24 hour static culture post-flow clustering was clearly reduced. These data indicate that clustering is a reversible process and dependent on shear stress.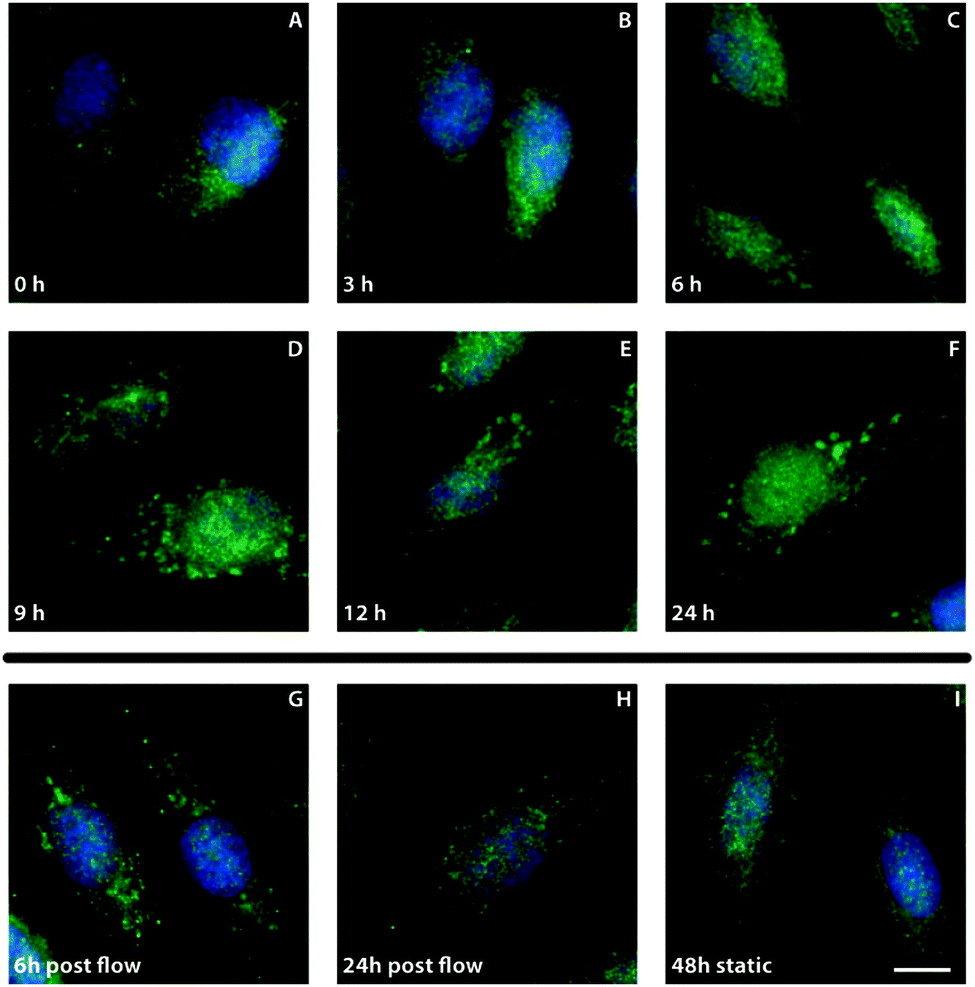 | ||
| Fig. 4 Dynamics of Jagged1 clustering. Representative images of Jagged1 (green) and nuclei (blue) in HUVEC that have been cultured for different periods of time under static and flow conditions. (A–F) HUVEC were subjected to shear stress for 0, 3, 6, 9, 12, or 24 hours. Jagged1 clusters appear between 6 and 9 hours after the onset of flow. (G and H) HUVEC were subjected to shear stress for 24 hours and cultured for a subsequent 6 hours (G) or 24 hours (H). (I) 48 hours static HUVEC culture for end point control. Scale bar represents 10 μm. | ||
Protein production and transport are required for Jagged1 clustering
Since clusters of Jagged1 were observed after six to nine hours after the onset of flow we hypothesized that protein production and transport may play an important role in this process. To test this hypothesis we used pharmacological inhibitors of protein production and ER export. Protein production was inhibited with cycloheximide. When cycloheximide was added to the culture medium during the flow experiments no clustering of Jagged1 could be observed (Fig. 5B and F), demonstrating that protein production is essential for Jagged1 clustering. Inhibition of ER export by FLI-06 also blocked the formation of intracellular Jagged1 clusters (Fig. 5C and G),26 indicating that trafficking from the ER is required for the Jagged1 clusters to form.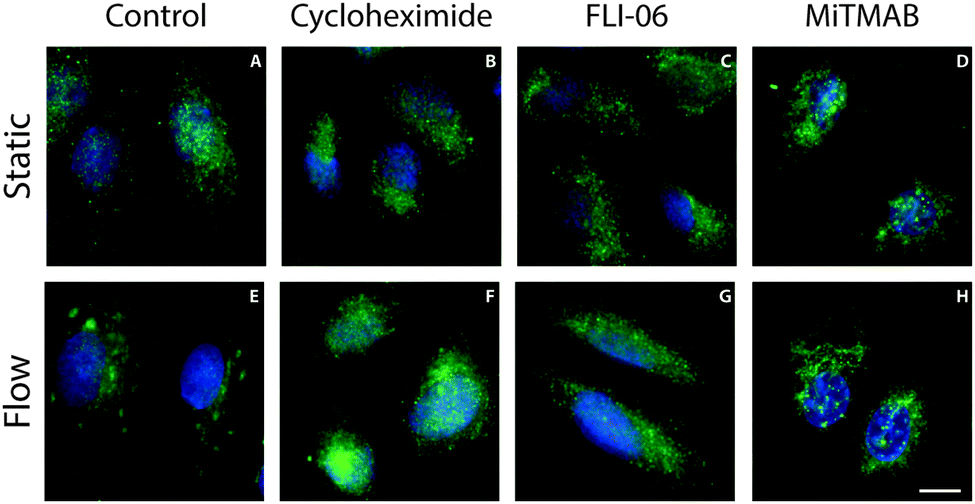 | ||
| Fig. 5 Pharmacological inhibition of protein production, ER export and endocytosis. Representative fluorescence microscopy images of Jagged1 (green) and nuclei (blue) in ECs that have been treated with pharmacological inhibitors in static (A–D) and flow (E–H) conditions. Cycloheximide inhibits protein production (B and F), FLI-06 inhibits ER export (C and G) and MiTMAB inhibits dynamin dependent endocytosis (D and H). Jagged1 clustering was detected only in the untreated control conditions (E). Scale bar represents 10 μm. | ||
Next, we asked if Jagged1 clustering could be an effect of protein accumulation. By blocking the proteasome with MG132 for 24 hours we tested if Jagged1 accumulation resulted in clusters. Stainings for Jagged1 showed accumulation of Jagged1 in small vesicles, but not to a degree nor with a similar pattern that was observed in response to shear stress (Fig. S6, ESI†).
Notch ligands have been shown to be trafficked through the endocytotic pathway to gain signaling activity27 and to provide the pulling force on the receptor necessary for receptor activation.28 To assess if endocytosis contributed to Jagged1 clustering under shear stress we inhibited dynamin, a key protein in endocytosis, during shear stress.29,30 No clusters could be detected in the ECs cultured under flow with MiTMAB, a dynamin inhibitor (Fig. 5D and H), indicating that dynamin-dependent endocytosis is required for the intracellular clustering of Jagged1.
We next analyzed Jagged1 surface levels under shear by a biotinylation assay. Jagged1 membrane levels were lower when ECs were exposed to shear stress (Fig. 6A and B). Jagged1 membrane levels increased when ECs were cultured for a subsequent 24 hours in static conditions corresponding to the disappearance of the clusters (Fig. 4G, H and 6B and Fig. S9, ESI†). These data indicate that Jagged1 subcellular localization is regulated by shear stress.
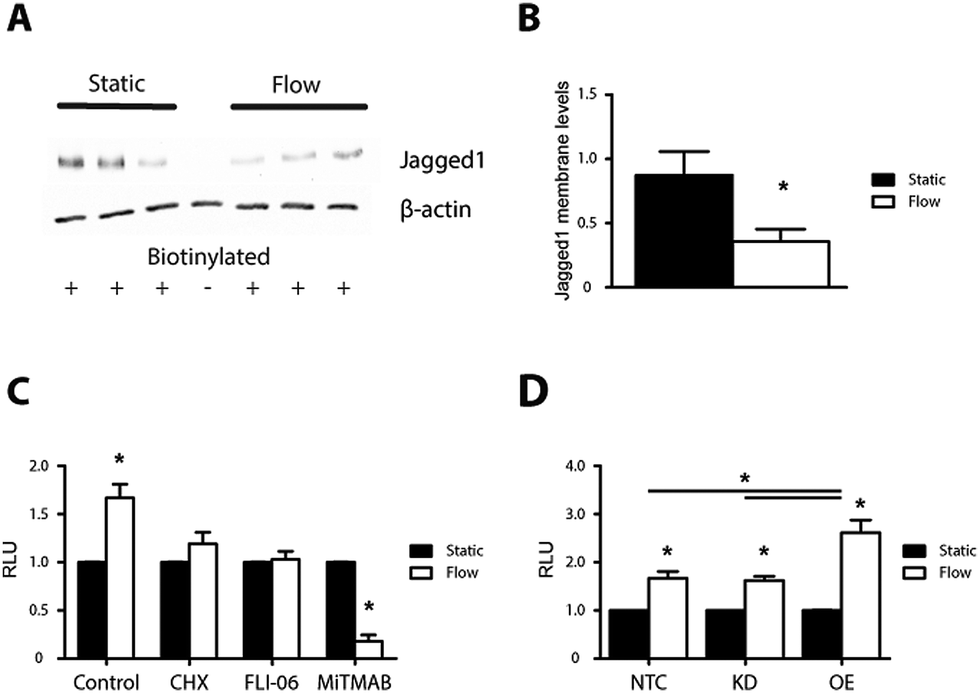 | ||
| Fig. 6 Jagged1 membrane levels and signaling potential of endothelial cells. (A) Immunoblot of Jagged1 on streptavidin immunoprecipitates of biotin-labelled surface protein under shear stress, β-actin as loading control. Membrane levels of Jagged1 are decreased after shear stress. (B) Quantification of Jagged1 membrane levels. Shear stress significantly reduces Jagged1 in the membrane. (C) Quantification of Notch activity in Notch reporter cells cultured on HUVECs under shear and treated with specific inhibitors. Increased Notch activation in reporter cells seeded on sheared ECs. No increase when ECs were treated with cycloheximide or FLI-06. MiTMAB reduced shear effect. (D) Quantification of Notch activity in reporter cells onto Jagged1 overexpressing and Jagged1 knockdown HUVEC. Significance is indicated as *p < 0.05. Error bars are defined as the standard deviation. | ||
Shear stress increases the signaling potential of endothelial cells
To study the functional effect of shear stress on ECs we used a Notch reporter cell assay to measure the signal sending potential of the ECs. For the reporter assay HEK293T cells were transfected with a 12xCSL luciferase reporter construct.31,32 To measure the signal sending potential of the ECs, transfected HEK293T were seeded on top of ECs that have been subjected to shear stress for 24 hours or on the respective static controls. After a subsequent 24 hour co-culture, the luciferase levels in cells on top of sheared ECs were 1.7 fold higher than the static controls (Fig. 6C).We next tested whether the signaling capacity of the cells was affected by inhibition of protein production, ER export or dynamin with the reporter cell assay. Inhibition of protein production and ER export ablated the shear induced increase in signal sending potential, indicating that protein production and ER export are required. Inhibition of dynamin with MiTMAB reduced the reporter cell signal 5.5 fold as compared to the static control (Fig. 6C). Of note, MiTMAB affected the adherence of cells upon shear and the reduced number of adhering cells might have added to the effect.
We then asked if Jagged1 contributes to the increased signaling response after exposure to shear stress by knockdown and overexpression of Jagged. Overexpression of Jagged1 (3-fold increase, Fig. S7, ESI†) in ECs led to a further increase in the signal sending potential in response to shear stress of 2.6 fold compared to the 1.7 fold increase for control ECs (Fig. 6D). Reducing Jagged1 levels by 42% did not affect the shear stress response and EC cells with reduced Jagged1 levels still demonstrated enhanced signal sending potential upon shear stress. The data demonstrates that Jagged1 levels can have an in impact on signaling, but also suggest that other mechanisms such as protein trafficking may play a significant role, in line with previous data decoupling Jagged1 membrane levels from signal activation potential31,33
Discussion
In this work, we show that Notch is mechanoresponsive in ECs and that Notch ligands show distinct responses to shear stress. Expression of JAG1 increases, whereas DLL4 expression decreases in response to shear stress in both HUVECs and arterial ECs. However, on the protein levels the changes are not significant although there is a trend towards increased Jagged1 levels under shear stress. In terms of ligand distribution, Jagged1 relocalizes into intracellular assemblies (clusters). This relocalization is reversible and requires protein production, ER transport and endocytosis, suggesting that both Jagged1 production and recycling from the membrane contribute to the cluster formation. Both shear induced transcriptional changes and Jagged1 distribution are independent of receptor cleavage and Notch activity. Functionally the Notch signal sending potential of ECs is increased after shear stress. This effect is enhanced by Jagged1 overexpression, but not affected by a 42% reduction in Jagged1 levels. The inhibition of protein production and ER transport and dynamin dependent endocytosis prevents shear response of Jagged1.We observed a decrease in NOTCH1 and NOTCH3 expression, in contrast to others that have reported no changes or an increase in NOTCH1 expression in response to shear stress.21,34–36 In their studies, different ECs, different shear stress magnitudes and exposure times were used. We exposed both HUVECs and arterial ECs to shear stress. NOTCH1 expression did not change in response to shear stress in arterial ECs (Fig. S5, ESI†). The gene expression profiles for the other Notch components, including the ligands, were consistent in both cell types. When HUVEC are exposed to shear stress for three hours, NOTCH3 and HES1 demonstrated a reversed response. These genes were upregulated after three hours, but downregulated after 24 hours of shear stress exposure. (Fig. S8, ESI†). This further demonstrates the temporal regulation of the shear stress response that was recently reported by Ajami and colleagues.37 Cells adapt to the new environment after the onset of flow, and to study the effect of flow in a native-like environment during cellular homeostasis a prolonged period of shear stress application is needed.
Whereas most Notch proteins display a diffuse distribution under both static and flow conditions, Jagged1 clusters in response to flow. Jagged1 clusters appear six hours after the onset of flow and the clustering is reversible and disappears by stopping the flow. Relocalization of proteins in response to shear stress has been observed by others as well, suggesting that protein trafficking and relocalization are part of the cellular responses to shear stress.21,38 One of the most well-known effects of shear stress is cytoskeletal remodeling.39,40 Boycott and colleagues also showed that arterial myocytes increase their membrane concentration of potassium channels from a cytoplasmic pool in response to shear stress.41 Mack et al. recently showed that Notch1 clusters are formed downstream of the nucleus when exposed to high shear stress levels. However, for the 1 Pa shear stress levels, used in our study, they did not observe Notch1 clustering. In our study, there was no preferred cellular localization of the Jagged1 clusters.
Exposure to shear stress increased the signaling potential of ECs, an effect that requires protein production, ER transport and dynamin dependent endocytosis. The shear stress induced signal sending potential of ECs was further elevated in cell overexpressing Jagged, however a reduction of Jagged1 levels by 42% did not reduce the shear stress response suggesting that not only Jagged1 levels but also other mechanisms contributes to the signal sending potential. Intriguingly, shear stress reduced Jagged1 membrane levels, in line with the formation of intracellular Jagged1 clusters, and relieving the cells from shear stress increased membrane levels (Fig. S9, ESI†). This indicates that shear stress affects Jagged1 trafficking. Considering the importance of protein trafficking in Notch regulation this hypothesis warrants further investigation.
Notch signaling is dose-sensitive and Notch activity needs to be tightly regulated. Overexpression of Jagged1 in mice with induced diabetes leads to microvasculopathy.42 The upregulation of Jagged1 in ECs promotes cancer cell survival and metastasis of breast cancer cells.43 Loss of endothelial Jagged1 leads to embryonic lethality and Jagged1 deregulation causes vascular defects. The most well-known example of Jagged1 mutations is linked to vascular defects in the multisystem disorder Alagille syndrome.18,44 These examples emphasize the importance of tight control of Jagged1 signaling. Assembly of Jagged1 into intracellular clusters may be a mechanisms to balance gene expression, protein production, endocytosis and degradation to tightly control Jagged1-mediated Notch activation under shear stress. Ligand endocytosis is also required for signaling activity and shear induced endocytosis may contribute to receptor activation. Notch mechanobiology is an emerging but rapidly developing field. In light of our data, further studies on the regulation and function of the different ligands under hemodynamic conditions would extend our knowledge in this field significantly.
Methods
Cell culture
Pooled human umbilical vein endothelial cells (HUVEC) (Lonza) and human arterial endothelial cells (HAEC) (Lonza) were cultured in endothelial growth medium with growth supplements (EGM-2 bulletkit, Lonza). Medium was changed every 2–3 days. Cells were seeded into collagen IV coated 1-channel or 6-channel slides (ibidi GmbH), 106 cells per ml, for gene expression analysis or immunocytochemistry respectively. After one day of culture the ECs were subjected to shear stress using the ibidi pump system (ibidi GmbH) or kept in culture as a static control. All experiments were performed on a confluent monolayer of ECs between passage 2 and 5 for HUVEC and passage 4 and 7 for HAEC. Human Embryonic Kidney 293T (HEK293T) cells (Sigma-Aldrich) were cultured in DMEM (Gibco) supplemented with 10% FBS (Greiner Bio One) and 1% Pen/Strep (Lonza). For transfection HEK293T cells were seeded in 6 well plates at 650.000 cells per well. All cultures were maintained at 37 °C and 5% CO2 in a humidified incubator.Shear stress experiments
For the shear stress experiments the standard perfusion sets were adjusted to gain a stable flow speed and pressure. Resistance tubing (0.5 mm inner diameter) was added after the channel slides to stabilize the fluctuations in flow speed. The cells were exposed to 1 Pa shear stress for 24 hours at 80 mmHg pressure. Pressure and flow were constantly measured to ensure correct flow speed and pressure (ME2PXL flow sensor, Transonic Systems Inc. and P10EZ pressure sensor, BD). For immunoprecipitation HUVEC were seeded in 6-well plates. The next day upon confluency they were subjected to shear stress by placing the plates on an orbital shaker, 100 rpm, for 24 hours. For the recovery experiments the cells were cultured for an additional 24 hours statically.Pharmacological inhibitions
ECs were treated with 5 μg ml−1N-[N-(3,5-difluorophenacetyl)-L-alanyl]-S-phenylglycine t-butyl ester (DAPT) to inhibit Notch signaling activity. To inhibit protein production the cell culture medium was supplemented with cycloheximide at 0.5 μg ml−1. Dynamin was inhibited by tetradecyl trimethylammonium bromide (MiTMAB) at 10 μM. 1,4,5,6,7,8-Hexahydro-2,7,7-trimethyl-4-(4-nitrophenyl)-5-oxo-3-quinolinecarboxylic acid cyclohexyl ester, also known as FLI-06, was used at 10 μM to inhibit ER export. Proteasome activity was blocked with MG132 at 20 μM concentration. All small molecule inhibitors were purchased from Sigma and dissolved in DMSO. All control experiments were performed in the presence of the same amount of DMSO as vehicle control. In all experiments a 0.2 (v/v)% DMSO concentration was used.Immunocytochemistry
After the flow experiments ECs were washed twice with PBS and fixed with 4% formaldehyde for 15 minutes. Cells were washed 3 times with PBS and permeabilized with 0.1% Triton X-100 in PBS for 15 minutes. Samples were blocked with 4% horse serum in NET-gel buffer (50 mM Tris pH = 7.5, 150 mM NaCl, 0.1% nonidet P-40, 1 mM EDTA and 0.25% gelatin) for 15 min. The cells were stained with primary antibodies in NET-gel buffer for 1.5 hours at RT. Cells were stained for Jagged1 (H-66), Delta1 (H-265), Delta4 (C-20), Notch1 (C-20), Notch3 (M-20), Notch4 (N-17) and integrin β1 (TS2/16; Santa Cruz Biotechnology), all 1:50 dilutions. Afterwards the cells were washed with NET-gel buffer and incubated with donkey anti-rabbit or donkey anti-goat for 45 minutes, all 1:200 dilutions. Cell nuclei were stained with DAPI (Sigma) for 5 minutes. After a final washing step with NET-gel buffer Mowiol was injected into the channels. Stained cells were observed with a Zeiss Axiovert 200 M fluorescent microscope, using a 40×/0.95 or 63×/1.4 objective.
Western blots
Proteins were separated by SDS-PAGE and transferred to a Protran nitrocellulose membrane (GE Healthcare Life Sciences) using a wet transfer apparatus (Amersham Bioscience). The membranes were blocked for unspecific binding with 5% nonfat dry milk at RT for 1 hour. Primary antibody incubation was performed for 1 hour at RT, followed by a secondary antibody incubation for 1 hour at RT (1:4000). Proteins were detected using SuperSignal West Pico PLUS Enhanced chemiluminescence substrate (ThermoFisher) following the manufacturer's instructions. The following antibodies were used for western blot: β-actin (Cell Signaling Technology), Notch1 (C20, Santa Cruz), Jagged1 (28H8, Cell Signaling Technology), both 1:1000 dilution.
Biotinylation experiments
Protein surface levels were detected as reported previously.31 Briefly, cells on ice were washed three times with cold PBS, followed by surface labeling with 0.5 mg ml−1 EZ-link sulfoNHS-SS-biotin in PBS for 30 min at 4 °C. Afterwards the cells were washed three times with 0.1 M glycine in PBS and three times with PBS. The cells were lysed in immunoprecipitation (IP) buffer (50 mM Tris pH 8.0, 150 mM NaCl, 1% Nonidet P-40, 0.5% deoxycholic acid, 0.05% SDS, 5 mM EDTA, 5 mM EGTA and protease inhibitor (Complete protease inhibitor mixture, Roche)) for 30 minutes on ice. The samples were subsequently spun down at 15000g for 10 min at 4 °C, the pellet was discarded. Immunoprecipitation was performed with agarose beads for 4 hours at 4 °C. Finally, the pellet was washed three times with IP buffer and resuspended in Laemmli sample buffer for analysis.
Gene expression
RNA was isolated with the Qiagen RNeasy kit. The β-mercaptoethanol – RLT buffer mixture was directly added to the cells in the 1-channel slides. The synthesis of cDNA was performed with M-MLV reverse transcriptase (Invitrogen). For each experiment (n = 3) 3 were slides used and pooled for PCR. For six reference genes tested GAPDH was the most stably expressed, as analyzed with GeNorm.45 The PCR protocol consisted of 3 min at 95 °C, followed by 40 cycles of 20 s at 95 °C, 20 s at 60 °C and 30 s at 72 °C. Data were analyzed using the ΔΔCt method. Primers used can be found in supplemental data Table S1 (ESI†).Jagged1 knockdown and overexpression
For the production of Jagged1 knockdown (KD) and overexpression (OE) cells the lentivirus system was employed. HEK293T cells were transfected with pCMVR8.74, pMD2.g and Jagged1-shRNA or Jagged1 coding cDNA (NM_000214.2 cloned into a pLenti-PGK-Puro backbone) for overexpression as described above. Medium was replaced the next morning, followed by 3 viral particle harvests at 8–12 hours interval. The collected medium was stored at 4 °C. Afterwards the viral particles were spun down at 50000g for 2 hours at 4 °C. Afterwards the pellet was resuspended in PBS and stored at −80 °C until use. After transduction the transduced HUVEC were selected by culturing in the presence of puromycin (1 μg ml−1). Transduction efficiency was determined by PCR and western blot. pCMVR8.74 and pMD2.g were a gift from Didier Trono (Addgene plasmid #12259 & 22036). pLenti PGK Puro DEST (w529-2) was a gift from Eric Campeau & Paul Kaufman (Addgene plasmid #19068).
Notch reporter cell assay
HEK293T cells were transfected with 12xCSL-luciferase46 or GFP as a transfection control using polyethylenimine (PEI), 1 mg ml−1. For transfection DNA and PEI were mixed at 1:2 in medium. After 5 minute incubation the DNA-PEI mixture was added to the HEK293T cell culture. After overnight incubation the cells were washed with PBS and used for the reporter assay.
After flow experiments ECs were washed twice with PBS. Transfected HEK293T cells were seeded directly on top of ECs and cultured in EGM2 medium for 24 hours. Afterwards the cells were lysed and luciferase reporter activity was measured with a Biotek Synergy plate reader using a luciferase Assay (Promega).
Statistical analysis
All experiments were performed at n = 3, the gene expression experiments were also performed in technical triplicates. Data is represented as the mean ± standard deviation. To test for significant differences between static and flow conditions a student-test was performed using GraphPad Prism 6 software, p < 0.05 was considered to be significant.Conflicts of interest
There are no conflicts to declare.Acknowledgements
We acknowledge the support from the 1Valve consortium, funded by the Netherlands Cardiovascular Research Initiative (CVON 2012-01): the Dutch Heart Foundation, Dutch Federation of University Medical Centers, the Netherlands Organization for Health Research and Development and the Royal Netherlands Academy of Sciences. We further acknowledge the support from the ForceMorph project, funded by the ERC, project number 771168. We thank Rob Hoeben and Martijn Rabelink from Leiden University Medical Center for providing us with the Jagged1 shRNA plasmid.References
- J. C. Culver and M. E. Dickinson, Microcirculation, 2010, 17, 164–178 CrossRef PubMed.
- J. L. Lucitti, E. A. V. Jones, C. Huang, J. Chen, S. E. Fraser and M. E. Dickinson, Development, 2007, 134, 3317–3326 CrossRef CAS PubMed.
- M. Sato and N. Ohshima, Biorheology, 1994, 31, 143–153 CAS.
- E. A. Osborn, A. Rabodzey, C. F. Dewey Jr. and J. H. Hartwig, Am. J. Physiol.: Cell Physiol., 2006, 290, C444–C452 CrossRef CAS PubMed.
- T. Masumura, K. Yamamoto, N. Shimizu, S. Obi and J. Ando, Arterioscler., Thromb., Vasc. Biol., 2009, 29, 2125–2131 CrossRef CAS PubMed.
- M. Hirashima and T. Suda, Endothelium, 2006, 13, 137–145 CrossRef CAS PubMed.
- M. Mudau, A. Genis, A. Lochner and H. Strijdom, Cardiovasc. J. Afr., 2012, 23, 222–231 CrossRef PubMed.
- S. Baratchi, K. Khoshmanesh, O. L. Woodman, S. Potocnik, K. Peter and P. McIntyre, Trends Mol. Med., 2017, 23, 850–868 CrossRef CAS PubMed.
- N. Resnick, H. Yahav, A. Shay-Salit, M. Shushy, S. Schubert, L. C. M. Zilberman and E. Wofovitz, Prog. Biophys. Mol. Biol., 2003, 81, 177–199 CrossRef PubMed.
- S. Bray, Nat. Rev. Mol. Cell Biol., 2006, 7, 678–689 CrossRef CAS PubMed.
- T. Gridley, Development, 2007, 134, 2709–2718 CrossRef CAS PubMed.
- N. W. Gale, M. G. Dominguez, I. Noguera, L. Pan, V. Hughes, D. M. Valenzuela, A. J. Murphy, N. C. Adams, H. C. Lin, J. Holash, G. Thurston and G. D. Yancopoulos, Proc. Natl. Acad. Sci. U. S. A., 2004, 101, 15949–15954 CrossRef CAS PubMed.
- M. Hrabĕ de Angelis, J. McIntyre and A. Gossler, Nature, 1997, 386, 717–721 CrossRef PubMed.
- Y. Xue, X. Gao, C. E. Lindsell, C. R. Norton, B. Chang, C. Hicks, M. Gendron-Maguire, E. B. Rand, G. Weinmaster and T. Gridley, Hum. Mol. Genet., 1999, 8, 723–730 CrossRef CAS PubMed.
- S. S. Huppert, A. Le, E. H. Schroeter, J. S. Mumm, M. T. Saxena, L. A. Milner and R. Kopan, Nature, 2000, 405, 966–970 CrossRef CAS PubMed.
- L. T. Krebs, Y. Xue, C. R. Norton, J. R. Shutter, M. Maguire, J. P. Sundberg, D. Gallahan, V. Closson, J. Kitajewski, R. Callahan, G. H. Smith, K. L. Stark and T. Gridley, Genes Dev., 2000, 14, 1343–1352 CAS.
- J. Boucher, T. Gridley and L. Liaw, Front. Physiol., 2012, 3, 1–13 Search PubMed.
- N. B. Spinner, R. P. Colliton, C. Crosnier, I. D. Krantz, M. Hadchouel and M. Meunier-Rotival, Hum. Mutat., 2001, 17, 18–33 CrossRef CAS PubMed.
- J. Pestel, R. Ramadass, S. Gauvrit, C. Helker, W. Herzog and D. Y. R. Stainier, Development, 2016, 143, 2217–2227 CrossRef CAS PubMed.
- J. Lee, P. Fei, R. R. S. Packard, H. Kang, H. Xu, K. I. Baek, N. Jen, J. Chen, H. Yen, C. C. J. Kuo, N. C. Chi, C. M. Ho, R. Li and T. K. Hsiai, J. Clin. Invest., 2016, 126, 1679–1690 CrossRef PubMed.
- J. J. Mack, T. S. Mosqueiro, B. J. Archer, W. M. Jones, H. Sunshine, G. C. Faas, A. Briot, R. L. Aragón, T. Su, M. C. Romay, A. I. McDonald, C. H. Kuo, C. O. Lizama, T. F. Lane, A. C. Zovein, Y. Fang, E. J. Tarling, T. Q. De Aguiar Vallim, M. Navab, A. M. Fogelman, L. S. Bouchard and M. L. Iruela-Arispe, Nat. Commun., 2017, 8, 1–18 CrossRef CAS PubMed.
- W. J. Polacheck, M. L. Kutys, J. Yang, J. Eyckmans, Y. Wu, H. Vasavada, K. K. Hirschi and C. S. Chen, Nature, 2017, 552, 258–262 CAS.
- K. Hori, A. Sen, T. Kirchhausen and S. Artavanis-Tsakonas, Commun. Integr. Biol., 2012, 5, 374–376 CrossRef CAS PubMed.
- M. E. Fortini and D. Bilder, Curr. Opin. Genet. Dev., 2009, 19, 323–328 CrossRef CAS PubMed.
- S. Yamamoto, W. L. Charng and H. J. Bellen, Curr. Top. Dev. Biol., 2010, 92, 165–200 CAS.
- A. Krämer, T. Mentrup, B. Kleizen, E. Rivera-Milla, D. Reichenbach, C. Enzensperger, R. Nohl, E. Täuscher, H. Görls, A. Ploubidou, C. Englert, O. Werz, H. D. Arndt and C. Kaether, Nat. Chem. Biol., 2013, 9, 731–738 CrossRef PubMed.
- W. Wang and G. Struhl, Development, 2004, 131, 5367–5380 CrossRef CAS PubMed.
- L. Meloty-Kapella, B. Shergill, J. Kuon, E. Botvinick and G. Weinmaster, Dev. Cell, 2012, 22, 1299–1312 CrossRef CAS PubMed.
- A. Quan, A. B. McGeachie, D. J. Keating, E. M. van Dam, J. Rusak, N. Chau, C. S. Malladi, C. Chen, A. McCluskey, M. A. Cousin and P. J. Robinson, Mol. Pharmacol., 2007, 72, 1425–1439 CrossRef CAS PubMed.
- M. Van Lessen, M. Nakayama, K. Kato, J. M. Kim, K. Kaibuchi and R. H. Adams, Arterioscler., Thromb., Vasc. Biol., 2015, 35, 1815–1825 CrossRef CAS PubMed.
- D. Antfolk, M. Sjöqvist, F. Cheng, K. Isoniemi, C. L. Duran, A. Rivero-Muller, C. Antila, R. Niemi, S. Landor, C. V. C. Bouten, K. J. Bayless, J. E. Eriksson and C. M. Sahlgren, Proc. Natl. Acad. Sci. U. S. A., 2017, 114, E4574–E4581 CrossRef CAS PubMed.
- E. M. Hansson, A. I. Teixeira, M. V. Gustafsson, T. Dohda, G. Chapman, K. Meletis, J. Muhr and U. Lendahl, Dev. Neurosci., 2006, 28, 118–127 CrossRef CAS PubMed.
- E. M. Hansson, F. Lanner, D. Das, A. Mutvei, U. Marklund, J. Ericson, F. Farnebo, G. Stumm, H. Stenmark, E. R. Andersson and U. Lendahl, J. Cell Sci., 2010, 123, 2931–2942 CrossRef CAS PubMed.
- L. A. Samsa, C. Givens, E. Tzima, D. Y. R. Stainier, L. Qian and J. Liu, Development, 2015, 142, 4080–4091 CrossRef CAS PubMed.
- D. T. Sweet, Z. Chen, C. S. Givens, A. P. Owens, M. Rojas and E. Tzima, Circ. Res., 2013, 113, 32–39 CrossRef CAS PubMed.
- E. D. Jahnsen, A. Trindade, H. C. Zaun, S. Lehoux, A. Duarte and E. A. V. Jones, PLoS One, 2015, 10, 1–14 CrossRef PubMed.
- N. E. Ajami, S. Gupta, M. R. Maurya, P. Nguyen, J. Y.-S. Li, J. Y.-J. Shyy, Z. Chen, S. Chien and S. Subramaniam, Proc. Natl. Acad. Sci. U. S. A., 2017, 114, 201707517 CrossRef PubMed.
- C. Hahn and M. A. Schwartz, Nat. Rev. Mol. Cell Biol., 2009, 10, 53–62 CrossRef CAS PubMed.
- P. F. Davies, Physiol. Rev., 1995, 75, 519–560 CrossRef CAS PubMed.
- B. P. Helmke, R. D. Goldman and P. F. Davies, Circ. Res., 2000, 86, 745–752 CrossRef CAS PubMed.
- H. E. Boycott, C. S. M. Barbier, C. A. Eichel, K. D. Costa, R. P. Martins, F. Louault, G. Dilanian, A. Coulombe, S. N. Hatem and E. Balse, Proc. Natl. Acad. Sci. U. S. A., 2013, 110, E3955–E3964 CrossRef CAS PubMed.
- C. H. Yoon, Y. E. Choi, Y. R. Cha, S. J. Koh, J. Il Choi, T. W. Kim, S. J. Woo, Y. B. Park, I. H. Chae and H. S. Kim, Circulation, 2016, 134, 233–247 CrossRef CAS PubMed.
- P. Ghiabi, J. Jiang, J. Pasquier, M. Maleki, N. Abu-Kaoud, S. Rafii and A. Rafii, PLoS One, 2014, 9, e112424 CrossRef PubMed.
- J. Mašek and E. R. Andersson, Development, 2017, 144, 1743–1763 CrossRef PubMed.
- J. Vandesompele, K. De Preter, F. Pattyn, B. Poppe, N. Van Roy, A. De Paepe and F. Speleman, Genome Biol., 2002, 3, 34.1-34.11 CrossRef.
- H. Kato, Y. Taniguchi, H. Kurooka, S. Minoguchi, T. Sakai, S. Nomura-Okazaki, K. Tamura and T. Honjo, Development, 1997, 124, 4133–4141 CAS.
Footnote |
| † Electronic supplementary information (ESI) available. See DOI: 10.1039/c8ib00036k |
| This journal is © The Royal Society of Chemistry 2018 |