 Open Access Article
Creative Commons Attribution 3.0 Unported Licence
Rapid pretreatment of Miscanthus using the low-cost ionic liquid triethylammonium hydrogen sulfate at elevated temperatures†
Florence J. V.
Gschwend
,
Francisco
Malaret
,
Somnath
Shinde
 ,
Agnieszka
Brandt-Talbot
 and
Jason P.
Hallett
 *
*
Department of Chemical Engineering, Imperial College London, London, SW7 2AZ, UK. E-mail: j.hallett@imperial.ac.uk; Web: http://www.imperial.ac.uk/people/j.hallett Tel: +44 (0)2075945388
First published on 29th June 2018
Abstract
Deconstruction with low-cost ionic liquids (ionoSolv) is a promising method to pre-condition lignocellulosic biomass for the production of renewable fuels, materials and chemicals. This study investigated process intensification strategies for ionoSolv pretreatment of Miscanthus × giganteus with the low-cost ionic liquid triethylammonium hydrogen sulfate ([TEA][HSO4]) in the presence of 20 wt% water, using high temperatures and a high solid to solvent loading of 1![[thin space (1/6-em)]](https://www.rsc.org/images/entities/char_2009.gif) :
:![[thin space (1/6-em)]](https://www.rsc.org/images/entities/char_2009.gif) 5 g/g. The temperatures investigated were 150, 160, 170 and 180 °C. We discuss the effect of pretreatment temperature on lignin and hemicellulose removal, cellulose degradation and enzymatic saccharification yields. We report that very good fractionation can be achieved across all investigated temperatures, including an enzymatic saccharification yield exceeding 75% of the theoretical maximum after only 15 min of treatment at 180 °C. We further characterised the recovered lignins, which established some tunability of the hydroxyl group content, subunit composition, connectivity and molecular weight distribution in the isolated lignin while maintaining maximum saccharification yield. This drastic reduction of pretreatment time at increased biomass loading without a yield penalty is promising for the development of a commercial ionoSolv pretreatment process.
5 g/g. The temperatures investigated were 150, 160, 170 and 180 °C. We discuss the effect of pretreatment temperature on lignin and hemicellulose removal, cellulose degradation and enzymatic saccharification yields. We report that very good fractionation can be achieved across all investigated temperatures, including an enzymatic saccharification yield exceeding 75% of the theoretical maximum after only 15 min of treatment at 180 °C. We further characterised the recovered lignins, which established some tunability of the hydroxyl group content, subunit composition, connectivity and molecular weight distribution in the isolated lignin while maintaining maximum saccharification yield. This drastic reduction of pretreatment time at increased biomass loading without a yield penalty is promising for the development of a commercial ionoSolv pretreatment process.
Introduction
Renewable energy, chemicals and fuels have gained much attention over the past decades, even more so recently in light of concerted international efforts to decarbonise the economy.1 If produced in a responsible manner, bio-energy and bio-products can help achieve carbon reduction targets while improving soil and water quality.2 The production of biofuels and renewable chemicals from food crops, such as biodiesel from rapeseed or bioethanol from sugar beets, can afford CO2 savings, but these are often limited due to the relatively intensive farming required, including fertiliser use.3 Additionally, their cultivation may result in land-use change that is coupled with a decrease in carbon stored in the soil, reducing or potentially negating CO2 savings afforded from replacing petroleum.4 Conversely, perennial lignocellulosic crops, such as Miscanthus, have low fertilizer requirements and do not deplete soil carbon,5 while the cultivation of perennial biomass crops can have beneficial effects on biodiversity compared to conventional agriculture.6Lignocellulosic biomass is comprised of three bio-polymers, namely cellulose, hemicellulose and lignin. The cellulose and hemicellulose are polysaccharides and can be converted into bio-derived products after hydrolysis and fermentation. Lignocellulose is recalcitrant and requires a pretreatment step in order to release the majority of sugar contained within.7 Various pretreatment methods are currently under development, such as steam explosion,8 AFEX,9 concentrated acid,10 dilute acid,11 hot water,12 organosolv13,14 and ionic liquid pretreatments,15–17 including ionoSolv fractionation.18,19 Different strategies are followed, from disrupting the lignocellulosic cell wall structure without separation,20–23 to selectively isolating lignin, hemicelluloses and cellulose.15,24,25 While the ultimate goal of pretreatment for enzymatic hydrolysis and fermentation is the isolation of a maximum amount of fermentable sugar, process economics are influenced by a number of factors, such as the number of process steps, the cost and recyclability of additives or solvents, energy requirements, and reactor size, which all influence capital and/or operating costs.26,27 Reactor size specifically is dictated by the biomass to liquid ratio and residence time.
In addition to high sugar yields, utilization of the co-product lignin is required for a profitable biorefinery.28,29 The lignin can be burned for energy or more ideally converted into value-added products. Applications proposed for isolated lignin are building blocks for thermoplastics,30 sorbents for heavy metals,31 active ingredients of suncream,32 antioxidants, thermal stabilisers,33,34 flame retardants,35 components in biocompatible nanofibres,34 or to replace phenol in phenol-formaldehyde resins.36 Different characteristics of lignin are important for the various applications, for example the presence of sulfonic acid groups and a large surface area are beneficial for heavy metal adsorption,31 while absence of carbohydrate impurities and sulfur,32 low polydispersity,37 and high phenolic hydroxyl group content are important for thermal stabilisation, antioxidant properties33 and the replacement of phenol.36 Most lignin available today is derived from paper pulping processes, which are optimised for cellulose characteristics and not necessarily for downstream applications of lignin. Hence, understanding lignin properties as a function of extraction conditions is important for future lignin co-valorisation.
The reason for ionic liquid based pretreatments coming into focus is the ability of some ILs to decrystallise or dissolve cellulose.7 This has opened up new processing options for biomass, including one-pot biofuel production,2,17 the Ionocell-F spinning of cellulose fibres for fabrics,38 production of thermally responsive cellulose composites,39 and production of cellulosic films.40 Cellulose dissolving ILs have been reported to be amongst the highest-yielding and most feedstock-independent lignocellulose pretreatment technologies,41 however, the high cost of the required ILs as well as their low thermal stability and their requirement for dry conditions is turning out to be generally prohibitive for biofuel and bulk chemical applications.42 Low-cost ILs based on choline cations in dilute aqueous solutions (3–15% IL) have been suggested as economical alternative in terms of solvent cost.17,43 High saccharification yields of over 90% have been achieved for bagasse by Ninomiya et al.43 and cornstover by Xu et al.17 While both approaches are promising, they have relied on rather long processing times of 21 h at 110 °C43 and 3 h at 140 °C,17 respectively, and may face IL recovery issues.
IonoSolv pretreatment is a lignocellulose fractionation technology that uses ionic liquid–water mixtures to extract lignin and hemicellulose from the biomass while leaving behind a cellulose rich pulp.19 Addition of water to the ionic liquid solution after pretreatment leads to the precipitation of a modified lignin, and removal of this water recovers the IL solvent.44
In recent studies, low-cost protic versions of the originally used ionic liquids have been studied in detail.42,45 For the low-cost ionic liquid triethylammonium hydrogen sulfate [TEA][HSO4], we recently demonstrated excellent solvent recovery while maintaining high saccharification yields from the pretreated biomass over four solvent use cycles with minimum conditioning in between uses.46 We have also demonstrated substantially higher thermal stability for [TEA][HSO4] (277 °C) compared to [emim][OAc] (215 °C).42 However, a limitation of this and other studies was that the pretreatment was only carried out at 120 °C. The optimal pretreatment time at this temperature was 4–9 h, which is a long residence time for an industrial pretreatment process (most thermochemical pretreatment are carried out for around 30 min). Faster pretreatment was achieved by increasing the acidity of the protic ionic liquid. However, it was shown that saccharification yields may suffer significantly as a result of more extensive glucan degradation in excess acid solutions. Therefore, in an attempt to shorten pretreatment time while reducing or avoiding the yield penalty, we have here refrained from using an IL with an excess of acid. We have also investigated the use of a higher biomass to solvent ratio of 1![[thin space (1/6-em)]](https://www.rsc.org/images/entities/char_2009.gif) :
:![[thin space (1/6-em)]](https://www.rsc.org/images/entities/char_2009.gif) 5 g/g, as opposed to 1
5 g/g, as opposed to 1![[thin space (1/6-em)]](https://www.rsc.org/images/entities/char_2009.gif) :
:![[thin space (1/6-em)]](https://www.rsc.org/images/entities/char_2009.gif) 10 g/g, which is insufficient for economical biofuel production. The combination of higher biomass loading and much shorter pretreatment would greatly decrease pretreatment reactor size and hence capital expenditure, leading to a significantly intensified process.
10 g/g, which is insufficient for economical biofuel production. The combination of higher biomass loading and much shorter pretreatment would greatly decrease pretreatment reactor size and hence capital expenditure, leading to a significantly intensified process.
Results and discussion
Pretreatment temperature profiles
IonoSolv pretreatment was carried out at four different oven temperatures between 150 °C and 180 °C for pretreatment times and between 15 min and 150 min, using a bench-scale protocol developed in our group.47 We applied non-isothermal processing, as there is no straightforward way of applying isothermal heating at the small lab-scale. This means that the reaction vessels have a heating up and cooling down time, which is of particular importance for short pretreatments and for higher treatment temperature. We hence set out to investigate the temperature profiles for our experiments, which were carried out in unstirred 15 mL glass pressure tubes. According to our protocol,47 the tubes were filled at room temperature, then placed inside a preheated oven for the duration of the pre-treatment and allowed to cool by natural convection upon removal.In order to track the temperature profile of the reaction medium, a thermocouple was placed in the glass pressure tubes used, containing the same amount of ionic liquid solution as applied in the biomass containing experiments. A typical reaction medium temperature profile is given in Fig. 1 (here for 180 °C). It can be seen that the reaction medium reached 160 °C at the end of a 15 min heating period and 178 °C after 30 min. The cooling time from reaction to room temperature was about 30 min, demonstrating that the biomass spent some time in a heated state after the nominal pretreatment time had elapsed. Similar profiles were observed for the other temperatures (Fig. S1 in the ESI†). Although this is not a prohibitive issue for this work, it is important to keep in mind that the actual pretreatment temperature was not uniform over time. The fact that the set oven temperature was not reached for short pretreatment times (30 min or less), means that pretreatment would be shorter, if isothermal conditions could be achieved.
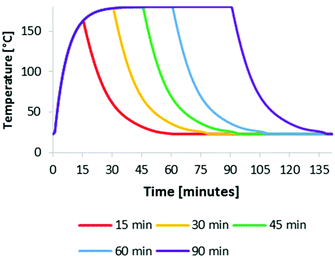 | ||
| Fig. 1 Reaction medium temperature in an unstirred reaction tube at an oven temperature of 180 °C for several pretreatment times. | ||
Effect of intensified [TEA][HSO4] pretreatment on saccharification yields
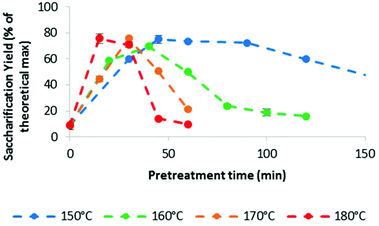
The main indicator for pretreatment effectiveness was the enzymatic saccharification yield, and the trends for the higher temperatures are summarised in Fig. 2. At 120 °C, maximum glucose release was observed after 8 h of pretreatment (ref. 46, and Fig. S2 in the ESI†).46Fig. 2 shows that higher pretreatment temperatures resulted in substantially earlier peak saccharification yields, which were 45 min at 150 °C (75%), 40 min at 160 °C (70%), 30 min at 170 °C (76%) and 15 min at 180 °C (76%). It can be seen that the acceleration of ionoSolv pretreatment occurred without a yield penalty, which is in contrast to applying ionic liquid solutions with increased acidity. In our previous study at 120 °C, treatment time decreased from 8 h to 2 h when using an IL with 9% excess acid, but the maximum saccharification yield also fell from 77% to 61%.25,46 Using 180 °C, the shortest pretreatment time investigated in this study, led to the highest saccharification yield. We note that the saccharification optima at 170 and 180 °C occurred at a point when the ionic liquid solution had not reached the set oven temperature, as indicated by the heating profiles. Hence the optima in a fully heated reactor would likely occur even earlier than the observed 30 and 15 min, respectively.Effect of intensified [TEA][HSO4] pretreatment on fractionation
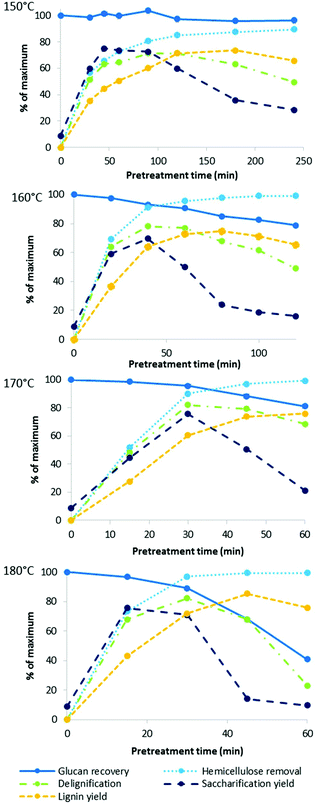
We also investigated the effect of process intensification on other characteristics of ionoSolv pretreatment. Fig. 3 shows a number of fractionation indicators monitored over time for each temperature: lignin and hemicellulose removal from the biomass, glucose retention in the pulp, and the yield of lignin precipitate as well as enzymatic saccharification after 7 days. Numerical data for the compositional analysis of the pulps can be found in Table S1 in the ESI.†Our data show that lignin removal was important for a successful enzymatic saccharification, with delignification peaking at approximately the time when saccharification yield was highest, which is consistent with trends observed at 120 °C.46
In our previous study conducted at 120 °C, cellulose showed very little degradation, even at excessively long pretreatment times (24 h).46 In this work, good cellulose stability was also demonstrated at 150 °C, with a 3.7 ± 0.6% glucan loss after 4 h. At higher oven temperatures, the saccharification yield was limited by cellulose recovery after only 30–40 min. These results are consistent with research carried out using other pretreatment technologies which show that cellulose degradation is significantly enhanced at high temperatures.48 It has been proposed that this behaviour can be explained by a “breaking temperature” for the disruption of crystalline cellulose.49 It has been recognised that amorphous cellulose is easier to hydrolyse as water and protons can more easily penetrate into amorphous cellulose regions, causing the cleavage of the β-1,4-glycosidic bonds.50
Hemicellulose removal proceeded rapidly at all four temperatures and was complete within the first 60 min at 170 and 180 °C. For comparison, in our previous study at 120 °C, 80% of hemicelluloses were extracted over the first 8 h of pretreatment.46
Delignification of the pulp reached a maximum followed by a decrease in the observed lignin removal at longer pretreatment times. This has been attributed to the formation of condensed higher molecular weight lignins as well as pseudo-lignin (humins), which can deposit onto the pulp surface.46 Pseudo-lignin has been shown to negatively impact enzymatic saccharification of isolated pulps,22 so such ‘overtreatment’ is undesirable.
The lignin yield also peaked, albeit later than saccharification yield and lignin removal, also consistent with previous observations.46 At all studied temperatures, lignin recovery eventually exceeded delignification, further confirming that non-lignin components can become incorporated into lignin during fractionation with acidic ionic liquid solutions. These non-lignin components are likely to originate from hemicellulose, which dissolves and hydrolyses in the acidic IL and can then undergo dehydration reactions to 5-HMF and furfural as well as participate in condensation reactions. Evidence for this has been discussed in our previous study.46 It is a drawback of the employed compositional analysis protocol that it is impossible to distinguish between acid insoluble lignin and other acid insoluble organic matter, such as pseudo-lignin.
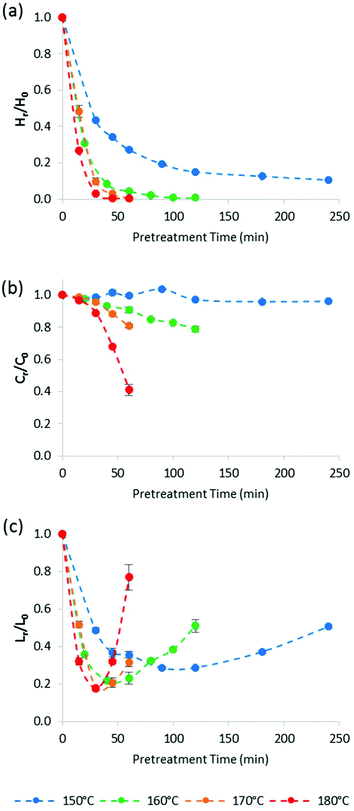
Fig. 4 plots the time course trends for the removal of each main biomass component rather than each temperature. Using the compositional data, we calculated the mass fraction of hemicellulose [Hr/H0], cellulose [Cr/C0], and lignin [Lr/L0] remaining in the pulp after pretreatment as a function of time for different temperatures.
Fig. 4a shows that the amount of hemicellulose in the biomass decreased rapidly during the heating period (i.e. first 30 min) at all investigated temperatures. Above 150 °C, hemicellulose removal was complete within 90 min. Removal was accelerated as pretreatment temperature increased. For example, 90 ± 2% of the hemicellulose was solubilised at 170 °C/30 min, compared with 97.1 ± 0.3% at 180 °C/30 min.
Although cellulose stability (Fig. 4b) was increasingly compromised at higher pretreatment temperatures, the glucan appeared to be more stable than expected, especially when comparing with acidic aqueous pretreatments. For example, Yan et al. reported that at 180 °C, the cellulose recovery from switchgrass (a feedstock that is similar to Miscanthus) was only 12.1% after 60 min of dilute sulfuric acid pre-treatment (equivalent to a Cr/Co of 0.12),51 while 41.4% of the cellulose (Cr/Co = 0.41) could be recovered after ionoSolv pretreatment under the same conditions. As we have noted above, in our experimental set-up the reaction temperature is only reached after 30 min inside the oven. However, even for the 30 min pretreatment time, Yan et al. found that the recovery of cellulose from switchgrass was only 25% (Cr/Co = 0.25), so even when discounting the heating-up time, at least 60% more cellulose was recovered after ionoSolv pretreatment than after dilute acid pretreatment. This suggests that cellulose is more stable under ionoSolv pretreatment conditions than in dilute acid (1 wt% H2SO4). In summary, Fig. 4 shows that cellulose degradation was significantly slower than hemicellulose or lignin removal, and significantly lower than cellulose degradation in acidic aqueous solvents.
Fig. 4c highlights that the lignin content in the Miscanthus pulp first decreased, reached a minimum, and then increased for all investigated pretreatment temperatures, as mentioned earlier. In our previous study at 120 °C, an increase of the residual lignin content as a result of lignin and hemicellulose condensation was negligible compared to delignification for most conditions.46 Indeed, it took more than 10 h before the measured lignin content in the pulp started to rise. For higher temperatures, the minimum lignin content was shifted to much shorter times. The minimum lignin content in the pulp as a percentage of initial lignin content was 18 ± 1% after 30 min pretreatment at 180 °C oven temperature. As observed previously, lignin removal did not lead to complete delignification. The lowest lignin content in the pulp, as a percentage of initial lignin content, was 18 ± 1% after 30 min pretreatment at 180 °C oven temperature. We speculate that the slight improvement in lignin removal at higher temperatures is a consequence of surpassing the glass transition temperature (Tg) of lignin, which has been reported to be at around 150 °C.52 Indeed, Li et al. report much accelerated dissolution of bagasse and pine into the IL 1-ethyl-3-methylimidazolum acetate when the suspension was heated above 170 °C compared to 110 °C.52 It appears that higher temperatures facilitate extraction of lignin more than they accelerate lignin condensation reactions.
We note that the complexity of lignin extraction makes modelling very difficult, as it involves removal of lignin, the deposition of condensed lignin and the deposition of carbohydrate derived humins, which cannot be studied independently at present. Indeed, the deposition rate should be a function of the lignin and hemicellulose concentration in solution. This makes kinetic modelling of the lignin extraction challenging and further chemical and mathematical analysis is required. It is noteworthy that during the washing of the pulp with ethanol, lignin can precipitate from solution; therefore data regarding lignin content in the pulp shown in this and previous studies include lignin precipitated during the washing steps which also contributes to the residual lignin content. Modification of the washing protocols may lead to different lignin contents in the pulp in the future.
Regarding the kinetic models for cellulose/hemicellulose hydrolysis in biomass pre-treatment, two main approaches are discussed in the literature: pseudo-homogeneous kinetics and time-dependent rates (fractal kinetics).53–55 Due to the non-isothermal nature of the experiments, further mathematical analysis is needed to establish the best kinetic model to explain the experimental observations for cellulose and hemicellulose degradation in [TEA][HSO4] and 20 wt% water. This is outside the scope of this work and will be presented in a dedicated future paper.
In summary, the compositional and saccharification data show that increasing the temperature from 120 °C to 150 °C or above can shorten pretreatment times by at least 90% without adverse outcomes for glucose release and fractionation at optimised pretreatment times.
Lignin characterisation
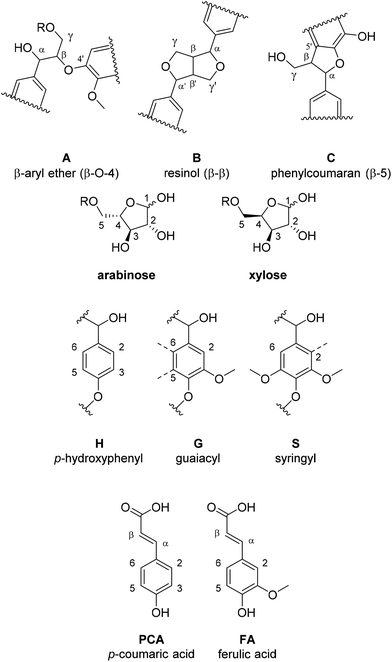
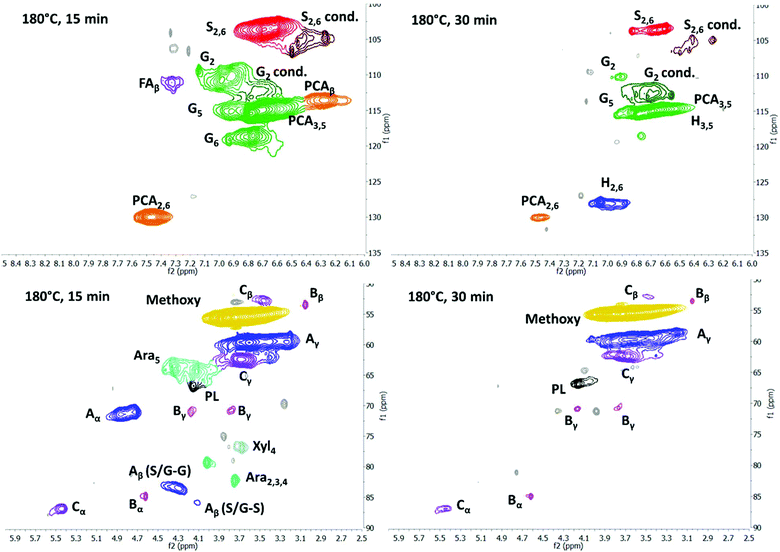
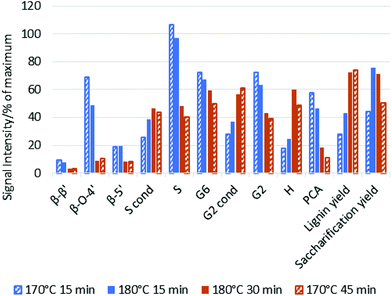
Since saccharification yields were shown to be closely linked to delignification, we set out to understand the characteristics of the isolated lignin, which then allowed us to better understand the mechanisms behind lignin removal in ionoSolv solutions. Pretreatment conditions not only affect saccharification yields12 but also suitability of the lignin for value-added applications. Lignins isolated around the optimal intensified pretreatment conditions were therefore analysed for their chemical properties. The lignins chosen for analysis were the ones that accompanied saccharification yields exceeding 70%, together with a number of lignins obtained under conditions of under- or overtreatment, so that trends could be established. 31P NMR and 2D HSQC NMR spectroscopy were applied to characterise the functional groups present in the isolated lignins. Gel Permeation Chromatography (GPC) was used to determine molecular weights of the lignins and CHNS elemental analysis was used to assess ionic liquid incorporation into the lignins at high pretreatment temperatures and to establish trends in the higher heating value (HHV).The general trends observed in this study (Fig. 6 and 7) are in agreement with what was reported in the past,44,46 namely that the signal intensities for ether linkages (β-O-4′, β-5′, β–β′), syringyl (S2,6), guaiacyl (G2 and G6) and p-coumaric acid (PCA2.6) subunits decreased with longer pretreatment time, while the signal intensity of condensed syringyl (Scond.), condensed guaiacyl (G2,cond) and for p-hydroxyphenyl (H2,6) increased. This shows that ether bonds were cleaved, condensation reactions occured on the S and G units and PCA was converted into an H-type polymer as pretreatment progressed.
Fig. 6 shows annotated HSQC spectra for two 180 °C lignins (15 min and 30 min). We note that these lignins were generated around the optimum time point for this temperature (76% and 71% glucose release from the pulp, respectively). It can be seen that the isolated lignins significantly differed in structural characteristics, despite both being associated with high saccharification yields. The signals for ether linkages, S2,6 and G6 reduced drastically in strength between 15 and 30 min, and the G2 signal shifted towards the G2,cond area. The changes in the S and G subunit signals indicate alterations of the substitution pattern on the aromatic rings, initiated by lignin condensation. Similar to findings in our previous studies, the PCA signal reduced while the H signal increased, indicating that decarboxylation/polymerisation of PCA takes place in the IL solution, further suggesting that the two optimum lignins have distinct compositions and hence material properties.44
Fig. 7 compares the size of the volume integrals for the major side chain and subunit signals for the two optimum lignins, plus two lignins that were isolated under non-optimal conditions, 15 min and 45 min at 170 °C, and gave rise to saccharification yields of 45.5 and 55.5%, respectively. The data confirm that there was no clear link between the structure of the isolated lignin and the saccharification yield. We note that the difference in functionality content between lignins obtained at conditions resulting in a high saccharification yield could be larger than the difference between a lignin from an optimised condition and a lignin from a non-optimised condition. For example, the lignins obtained at 15 min/180 °C and 30 min/180 °C exhibited an 80% difference in β-O-4′ ether linkage abundance, while only a 30% difference was observed for the 15 min/180 °C and 15 min/170 °C condition pair. Similarly, the uncondensed syringyl signal exhibited a difference of 50% for the 15 min/180 °C and 30 min/180 °C conditions compared to only a 10% difference for the 15 min/180 °C and 15 min/170 °C condition pair. This indicates that there is potential to adapt pretreatment conditions so that high saccharification yields are maintained while tuning the degree of ether cleavage and condensation of the lignin, presenting scope for co-optimising the pretreatment for sugar and lignin valorisation. We note that there appears to be a link between lignin yield and lignin connectivity, with lower lignin yields being associated with less condensed lignin and more ether bonds.
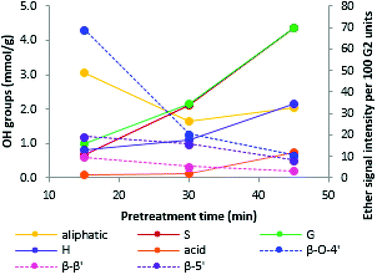
Similar to previous findings,44 we observed a decrease in aliphatic OH groups when pretreatment, progressed followed by a slight increase at longer pretreatment times. The abundance of all other OH groups increased over time, namely the phenolic S, G and H hydroxyl groups and the carboxylic acid groups (Fig. 8). Aromatic OH groups become available upon hydrolysis of β-O-4′ bonds as well as the phenylcoumaran linkage.56
The initial decrease in aliphatic OH groups was likely a result of the dominance of β-O-4′ bond hydrolysis, resulting in the loss of aliphatic OH groups due to dehydration at the α position and the elimination of formaldehyde at the γ-position of the side chain.44 It has further been suggested that a decrease in aliphatic OH content is linked to the degradation of carbohydrate residues and the transformation of the α- and γ-OH groups to ketones, aldehydes and alkene structures.56 During later stages, formation of novel aliphatic hydroxyl groups became dominant, leading to the observed increase in aliphatic OH group content. An increase in aliphatic hydroxyl group content is thought to be caused by cleavage of the other two ether bond types. Cleavage of the ether (α-O-4′) in the phenylcoumaran linkage is expected to give rise to one new aliphatic OH group, while cleavage of the two ether bonds in the resinol structure should result in four new aliphatic OH groups.56
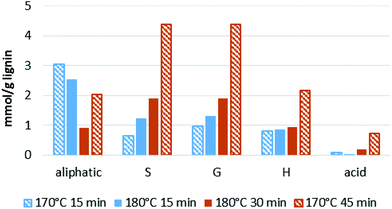
We note that the OH group content increased substantially when the optimal pretreatment times were exceeded (Fig. 9). The lignin isolated at over-treatment conditions (170 °C/45 min) had a much higher OH group content than the lignins isolated at optimal or under-treatment conditions (170 °C/15 min, 180 °C/15 min, 180 °C/30 min). This is due to the faster increase in phenolic group content when the optimal pretreatment condition is passed (Fig. 8).
In summary, similar to the results obtained with HSQC NMR spectroscopy, we could not find a straightforward correlation between hydroxyl group content and saccharification yield. As an exception, a high phenolic hydroxyl group content seems to be a strong indicator for over-treatment, which results in sub-optimal sugar release from the pulp.
![[thin space (1/6-em)]](https://www.rsc.org/images/entities/char_2009.gif) :
:![[thin space (1/6-em)]](https://www.rsc.org/images/entities/char_2009.gif) 5 g/g biomass to solvent ratio in 80% [TEA][HSO4] with 20% water
5 g/g biomass to solvent ratio in 80% [TEA][HSO4] with 20% water
| t (min) | T (°C) | M n | M w | PDI |
|---|---|---|---|---|
| M w: weight average molar mass (Da); Mn: number average molar mass (Da); PDI: polydispersity index. | ||||
| 30 | 150 | 1375 | 3870 | 2.8 |
| 45 | 150 | 1233 | 3550 | 2.9 |
| 60 | 150 | 1011 | 3614 | 3.6 |
| 90 | 150 | 999 | 3239 | 3.2 |
| 120 | 150 | 1015 | 3187 | 3.1 |
| 180 | 150 | 996 | 3780 | 3.8 |
| 15 | 170 | 1666 | 4889 | 2.9 |
| 30 | 170 | 1059 | 3486 | 3.3 |
| 45 | 170 | 1018 | 3533 | 3.5 |
| 60 | 170 | 1019 | 3453 | 3.4 |
| 15 | 180 | 1292 | 4179 | 3.2 |
| 30 | 180 | 1028 | 3314 | 3.2 |
| 45 | 180 | 999 | 3582 | 3.6 |
| 60 | 180 | 993 | 3765 | 3.8 |
Similar to the findings for the HSQC NMR and for the hydroxyl group content analysis, there was no obvious characteristic in the molar mass that reliably indicated high saccharification yields. For example, the lignin isolated after 30 and 60 min at 170 °C had very similar Mn and Mw values but differed significantly in their saccharification yields (Table 2).
![[thin space (1/6-em)]](https://www.rsc.org/images/entities/char_2009.gif) :
:![[thin space (1/6-em)]](https://www.rsc.org/images/entities/char_2009.gif) 5 g/g. 7-day saccharification yield shown for reference
5 g/g. 7-day saccharification yield shown for reference
| t (min) | T (°C) | M n | M w | PDI | Saccharification yield |
|---|---|---|---|---|---|
| M n: number average molar mass (Da); Mw: weight average molar mass (Da); PDI: polydispersity index. | |||||
| 30 | 170 | 1059 | 3486 | 3.3 | 75.7% |
| 60 | 170 | 1019 | 3453 | 3.4 | 21.3% |
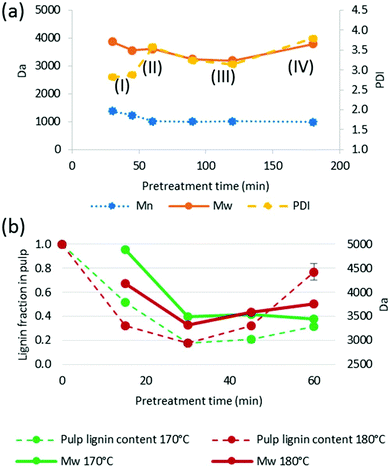
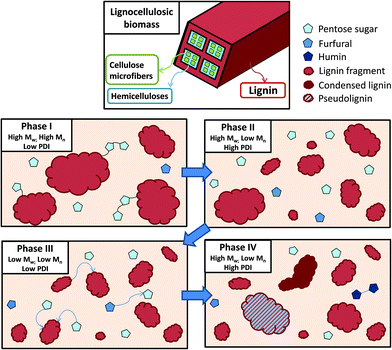
Phase I: Early extraction and precipitation phase. The Mn and Mw are lower than that for Miscanthus lignin isolated by ball-milling.57 This indicates that lignin macromolecules must undergo a certain amount of cleavage inside the lignocellulose matrix before they can escape, although the dissolved fragments still contain a significant number of cleavable ether linkages, resulting in a recovered lignin with high Mw, and Mn compared to later phase lignins, and also a low PDI. Lignin isolated at this stage is mostly uncondensed and the lignin yield is low, since a substantial proportion of lignin has not been extracted.
Phase II: continued extraction of lignin fragments from the biomass overlaps with further hydrolysis of the already extracted lignin fragments, resulting in a decrease in the Mn while the Mw remains largely unchanged, resulting in a higher PDI. The lignin yield is fairly low compared to the advanced delignification due to the prevalence of small fragments that do not precipitate.
Phase III: lignin extraction from the biomass has ceased and most extracted lignin fragments have broken down to smaller fragments, as evidenced by a decrease in both Mn and Mw and as a result also a lower PDI. The lignin yield peaks in phase III and content of condensed structures increases rapidly.
Phase IV: Lignin hydrolysis has ceased and condensation of lignin chains with soluble lignin fragments and possibly hemicellulose derived molecules is dominant, forming a subpopulation of new, long chains. These co-exist with small, unreactive lignin fragments, contributing to an increasing Mw while the Mn barely changes, resulting in a high PDI. The lignin yield is reduced, due to the newly formed polymers re-precipitating onto the pulp.
We note that there was a remarkable decrease in Mw between 15 and 30 min at 170 °C (29% drop) and between 15 and 30 min at 180 °C (21% drop), which we attribute to the lignin extraction having finished around this time. It also appears that the sharp decrease in Mw coincided with the minimum lignin content in the pulp (Fig. 10b), providing further evidence for a staged lignin extraction.
Other changes that occurred when pretreatment time and oven temperature increased were an increase in carbon and a decrease in hydrogen content. This is well in line with the findings discussed above, which indicate the dehydration of interunit linkages and formation of new C–C bonds during condensation, both resulting in a reduction in the lignin's hydrogen and oxygen content, and hence a higher carbon content.
A main use of lignin will be its use as energy source for the lignocellulose-based biorefinery, its combustion providing process heat. In order to estimate the heating value of lignin obtained at intensified ionoSolv pretreatment conditions, we calculated the Higher Heating Value (HHV). The HHV is directly proportional to the carbon, sulfur and hydrogen content of a fuel. We calculated the lignins’ HHV using two different methods. One was a method commonly used for coal combustion (Dulong's formula),58 taking into account the carbon, hydrogen, sulfur and oxygen content, and one method that is specific to lignin, proposed by Jablonský et al.,59 which only takes into account the carbon content. The HHVs predicted by both methods are listed in Table 3.
![[thin space (1/6-em)]](https://www.rsc.org/images/entities/char_2009.gif) :
:![[thin space (1/6-em)]](https://www.rsc.org/images/entities/char_2009.gif) 5 g/g biomass to solvent ratio in 80% [TEA][HSO4] with 20% water
5 g/g biomass to solvent ratio in 80% [TEA][HSO4] with 20% water
| t (min) | T (°C) | HHVa (MJ kg−1) | HHVb (MJ kg−1) | Difc [%] |
|---|---|---|---|---|
| a By Dulong's formula. b By Jablonský formula. c Difference between HHV values calculated with Dulong's and Jablonský formula. | ||||
| 45 | 150 | 23.9 | 25.0 | 4 |
| 60 | 150 | 24.1 | 25.4 | 5 |
| 90 | 150 | 24.2 | 25.7 | 6 |
| 15 | 170 | 23.0 | 24.4 | 6 |
| 30 | 170 | 24.0 | 25.5 | 6 |
| 45 | 170 | 24.5 | 26.1 | 6 |
| 15 | 180 | 23.3 | 24.7 | 6 |
| 30 | 180 | 24.2 | 25.9 | 7 |
It can be seen that the HHVs predicted by both methods are in the same order of magnitude and show similar behaviour: the HHV of the lignin increased slightly with the severity of the pretreatment, i.e. it increased with temperature and/or time. As Jablonský's formula was developed for lignin, it is expected that the actual HHV values will be closer to the ones predicted by this method. This shows that the heating value of lignin is largely independent of pretreatment conditions, although condensed lignins tend to have a slightly higher HHV. Fractionation of ionoSolv lignin in more and less condensed parts may be used to obtain a fraction with further increased heating value, while the less condensed lignin may be a more attractive feedstock for materials or chemical applications.
Experimental
Materials
Starting materials for ionic liquid synthesis were purchased from Sigma Aldrich and, unless stated otherwise, used as received. 1H NMR was recorded on a Bruker 400 MHz spectrometer. Chemical shifts (δ) are reported in ppm, the DMSO signal at 2.500 (1H dimension) and 39.520 (13C dimension). Mass spectrometry was measured by Dr Lisa Haigh (Imperial College London, Chemistry Department) on a Micromass Premier spectrometer. Elemental analysis was carried out by Stephen Atkin from Sheffield University, UK. The Karl-Fisher titrator used in this work was a V20 volumetric Titrator (Mettler-Toledo) and the analytical balance a Sartorius CPA 1003 S balance (±0.001 g).Synthesis of triethylammonium hydrogen sulfate [TEA][HSO4]
Triethylamine (75.9 g, 750 mmol) was cooled with an ice bath in a round-bottom flask. Under stirring, 150 mL of 5 M H2SO4 (750 mmol) were added dropwise. The water was removed using a rotary evaporator and the product dried using the Schlenk line at 40 °C overnight. The ionic liquid was recovered as a white, hygroscopic solid.1H NMR: δH (400 MHz, DMSO-d6)/ppm: 3.39 (s (br), HSO4−, N–H+), 3.10 (q, J = 7.3 Hz, 6H, N–CH2), 1.20 (t, J = 7.3 Hz, 9H, N–CH2–CH3). 13C NMR: δC (101 MHz, DMSO-d6)/ppm: 46.21 (N–CH2), 9.15 (N–CH2–CH3).
MS (Magnet FB+) m/z: 102 ([TEA]+, 100%), (Magnet FB−) m/z: 79 ([HSO4]−, 100%).
Feedstock
Miscanthus × giganteus was obtained from Silwood Park campus (Imperial College London, UK). It was air-dried, chopped and sieved (180–850 μm, 20 + 80 US mesh scale) prior to use and stored in plastic bags at room temperature in the dark.Fractionation of biomass
Pretreatments, determination of oven dried weight and ionic liquid water content measurements were conducted according to the standard operating procedure from our laboratory.47 8 g of triethylammonium hydrogen sulfate and 2 g of water were used as the solvent and 2 g of Miscanthus (on an oven-dried weight basis) was used as the biomass, corresponding to a biomass to solvent ratio of 1![[thin space (1/6-em)]](https://www.rsc.org/images/entities/char_2009.gif) :
:![[thin space (1/6-em)]](https://www.rsc.org/images/entities/char_2009.gif) 5 g/g.
5 g/g.
Feedstock and pulp characterisation
 | (1) |
Hemicellulose removal was calculated using the following equation:
 | (2) |
 | (3) |
 | (4) |
 | (5) |
Where-by Celluoseuntreated is the cellulose content in untreated Miscanthus and Cellulosepulp is the cellulose content in the pulp.
The letters C, H, and L stand for cellulose, hemicellulose and lignin respectively. The subscripts “r” stands for the mass remaining in the pulp after pre-treatment and “0” for the mass in the raw biomass before pretreatment. The other terms have the same meaning as explained in the previous section.
Lignin characterisation
Spectra were analysed using MestReNova (Version 8.0.0, Mestrelab Research 2012). All spectra were referenced to the DMSO peak at 2.500 ppm (1H) and 39.520 ppm (13C). Integral areas were the same for all spectra. This was ensured by copying all relevant spectra into one file and selecting all of them while drawing the oval integration area. The position of the integration areas were selected according to literature.44 For ether linkages, the C–Hα-signals were integrated and for PCA and H, the 2,6-signals were integrated. Integrals are reported with respect to 100 (G2 + G2,cond) signals. All spectra can be found in the ESI.†
![[thin space (1/6-em)]](https://www.rsc.org/images/entities/char_2009.gif) :
:![[thin space (1/6-em)]](https://www.rsc.org/images/entities/char_2009.gif) 1 (v/v) of pyridine and deuterated chloroform was prepared. The solvent solution was used to prepare a mixture solution containing around 20 mg ml−1 of cyclohexanol (as internal standard) and a second around 5 mg ml−1 solution of chromium(III) acetylacetonate solution (relaxation reagent). Previously dried ionoSolv lignin (ca. 10 mg) was accurately weighed and dissolved in 100 μl of anhydrous pyridine/deuterated chloroform solvent solution (1.6
1 (v/v) of pyridine and deuterated chloroform was prepared. The solvent solution was used to prepare a mixture solution containing around 20 mg ml−1 of cyclohexanol (as internal standard) and a second around 5 mg ml−1 solution of chromium(III) acetylacetonate solution (relaxation reagent). Previously dried ionoSolv lignin (ca. 10 mg) was accurately weighed and dissolved in 100 μl of anhydrous pyridine/deuterated chloroform solvent solution (1.6![[thin space (1/6-em)]](https://www.rsc.org/images/entities/char_2009.gif) :
:![[thin space (1/6-em)]](https://www.rsc.org/images/entities/char_2009.gif) 1, v/v). 50 μL of the cyclohexanol solution, 50 μL of the chromium(III) solution and 50 μL the phosphitylating agent 2-chloro-4,4,5,5-tetramethyl-1,3,2-dioxaphospholane (TMDP) were added to the lignin and the sealed vial was mixed by vortex for several minutes or until it was completely dissolved. The samples were transferred into Shigemi NMR tubes for subsequent NMR analysis. The NMR experiments were carried out at 298 K on a Bruker Avance 500 MHz NMR spectrometer. To obtain quantitative spectra a relaxation delay of 25 s was used between 30° pulses, the number of scans was 127 and an inverse gated decoupling pulse sequence was used. Chemical shifts were calibrated relative to the internal standard, i.e. the cyclohexanol peak signal centred at δ 144.2 ppm. Peak areas were obtained through integration with MestReNova (Version 8.0.0, Mestrelab Research 2012) and converted to mmol of hydroxyl groups using the signal of the internal standard. The original spectra can be found in the ESI.†
1, v/v). 50 μL of the cyclohexanol solution, 50 μL of the chromium(III) solution and 50 μL the phosphitylating agent 2-chloro-4,4,5,5-tetramethyl-1,3,2-dioxaphospholane (TMDP) were added to the lignin and the sealed vial was mixed by vortex for several minutes or until it was completely dissolved. The samples were transferred into Shigemi NMR tubes for subsequent NMR analysis. The NMR experiments were carried out at 298 K on a Bruker Avance 500 MHz NMR spectrometer. To obtain quantitative spectra a relaxation delay of 25 s was used between 30° pulses, the number of scans was 127 and an inverse gated decoupling pulse sequence was used. Chemical shifts were calibrated relative to the internal standard, i.e. the cyclohexanol peak signal centred at δ 144.2 ppm. Peak areas were obtained through integration with MestReNova (Version 8.0.0, Mestrelab Research 2012) and converted to mmol of hydroxyl groups using the signal of the internal standard. The original spectra can be found in the ESI.†
![[thin space (1/6-em)]](https://www.rsc.org/images/entities/char_2009.gif) 000) were used to calibrate the instrument.
000) were used to calibrate the instrument.
Dulong:58
| HHV [Btu lb−1] = 145.44C + 620.28H + 40.5S − 77.54O | (6) |
1 Btu lb−1 = 2326 J kg−1.
Jablonský:59
| HHV [MJ kg−1] = 0.40659C | (7) |
In the above equation, HHV is the higher heating value on dry basis and C, H, S and O and are the respective contents of carbon, hydrogen, sulfur and oxygen in weight percent and on dry basis.
Conclusions
We have demonstrated that a low-cost ionic liquid solution can be used to achieve high saccharification yields from lignocellulosic biomass at a solid loading of 1![[thin space (1/6-em)]](https://www.rsc.org/images/entities/char_2009.gif) :
:![[thin space (1/6-em)]](https://www.rsc.org/images/entities/char_2009.gif) 5 g/g and at short reaction times. The latter was achieved by raising the pretreatment temperature from the previously used 120 °C to up to 180 °C. Glucose released by enzymatic saccharification was the highest at 76% after pretreatment for 30 min at 170 °C and for 15 min at 180 °C, showing the process intensification does not lead to a glucose yield penalty. Hemicellulose removal proceeded fast at temperatures above 150 °C, and over 90% of the hemicellulose was removed after 30 min (at 170 and 180 °C). A maximum of 82% of lignin was removed after 30 min at 170 °C and 180 °C. This is significantly faster than previously seen at 120 °C, where optimum conditions were around 8 h. We have further demonstrated that raising the temperature not only accelerated lignin removal but also improved it at optimum conditions.
5 g/g and at short reaction times. The latter was achieved by raising the pretreatment temperature from the previously used 120 °C to up to 180 °C. Glucose released by enzymatic saccharification was the highest at 76% after pretreatment for 30 min at 170 °C and for 15 min at 180 °C, showing the process intensification does not lead to a glucose yield penalty. Hemicellulose removal proceeded fast at temperatures above 150 °C, and over 90% of the hemicellulose was removed after 30 min (at 170 and 180 °C). A maximum of 82% of lignin was removed after 30 min at 170 °C and 180 °C. This is significantly faster than previously seen at 120 °C, where optimum conditions were around 8 h. We have further demonstrated that raising the temperature not only accelerated lignin removal but also improved it at optimum conditions.
The two effects combined (increased temperature and loading) will lead to a 64-times-smaller reactor compared to the pre-treatment run at 120 °C, since a doubling of biomass loading from 1![[thin space (1/6-em)]](https://www.rsc.org/images/entities/char_2009.gif) :
:![[thin space (1/6-em)]](https://www.rsc.org/images/entities/char_2009.gif) 10 to 1
10 to 1![[thin space (1/6-em)]](https://www.rsc.org/images/entities/char_2009.gif) :
:![[thin space (1/6-em)]](https://www.rsc.org/images/entities/char_2009.gif) 5 g/g would halve the required reactor volume, and a reduction in pretreatment time from 8 h to 15 min would reduce the required reactor volume by a factor of 32, resulting in a significant reactor cost reduction, estimated to be around 90–95% (based on power law economies of scale for standard process vessels).
5 g/g would halve the required reactor volume, and a reduction in pretreatment time from 8 h to 15 min would reduce the required reactor volume by a factor of 32, resulting in a significant reactor cost reduction, estimated to be around 90–95% (based on power law economies of scale for standard process vessels).
We further show that there are only weak links between the characteristics of the isolated lignin and the obtained glucose yields, which gives scope to optimise the pretreatment conditions for both lignin and pulp quality. A high phenolic OH content was shown to be generally indicative of a condensed lignin and an over-treated cellulose pulp. Additionally, we show that higher temperatures do not induce IL incorporation in the lignin. We also use the data set on lignin characterisation in combination with previously published characterisations at 120 °C to propose a 4-stage model for the lignin extraction during ionoSolv pretreatment.
The ability to intensify pretreatment and tune lignin properties independently of saccharification yield provide exciting opportunities for larger-scale development of the ionoSolv pretreatment.
Conflicts of interest
There are no conflicts to declare.Acknowledgements
The authors wish to acknowledge financial support from the Grantham Institute for Climate Change and the Environment and Climate KIC for a studentship for FJVG, and the Engineering and Physical Sciences Research Council (EPSRC; EP/K014676/1 and EP/K038648/1) for funding for ABT and SS. The authors are grateful to Pedro Nakasu Souza for illustrating the 4 stage lignin extraction model.Notes and references
-
United Nations, Adoption of the Paris Agreement, 21st Conference of the Parties, Paris, 2015
.
- B. E. Dale, J. E. Anderson, R. C. Brown, S. Csonka, V. H. Dale, G. Herwick, R. D. Jackson, N. Jordan, S. Kaffka, K. L. Kline, L. R. Lynd, C. Malmstrom, R. G. Ong, T. L. Richard, C. Taylor and M. Q. Wang, Environ. Sci. Technol., 2014, 48, 7200–7203 CrossRef PubMed
.
- G. P. Hammond, S. Kallu and M. C. McManus, Appl. Energy, 2008, 85, 506–515 CrossRef
.
- T. Searchinger, R. Heimlich, R. A. Houghton, F. Dong, A. Elobeid, J. Fabiosa, S. Tokgoz, D. Hayes and T.-H. Yu, Science, 2008, 319, 1238–1240 CrossRef PubMed
.
- F. Cherubini, N. D. Bird, A. Cowie, G. Jungmeier, B. Schlamadinger and S. Woess-Gallasch, Resour., Conserv. Recycl., 2009, 53, 434–447 CrossRef
.
- A. J. Haughton, A. J. Bond, A. A. Lovett, T. Dockerty, G. Sünnenberg, S. J. Clark, D. A. Bohan, R. B. Sage, M. D. Mallott, V. E. Mallott, M. D. Cunningham, A. B. Riche, I. F. Shield, J. W. Finch, M. M. Turner and A. Karp, J. Appl. Ecol., 2009, 46, 315–322 CrossRef
.
- A. Brandt, J. Gräsvik, J. P. Hallett and T. Welton, Green Chem., 2013, 15, 550 RSC
.
- F. Cotana, G. Cavalaglio, M. Gelosia, A. Nicolini, V. Coccia and A. Petrozzi, Energy Procedia, 2014, 45, 42–51 CrossRef
.
- H. Alizadeh, F. Teymouri, T. I. Gilbert and B. E. Dale, Appl. Biochem. Biotechnol., 2005, 121–124, 1133–1141 CrossRef PubMed
.
- Y. P. Wijaya, R. D. D. Putra, V. T. Widyaya, J. M. Ha, D. J. Suh and C. S. Kim, Bioresour. Technol., 2014, 164, 221–231 CrossRef PubMed
.
- F. Hu and A. Ragauskas, RSC Adv., 2014, 4, 4317 RSC
.
- T. Pielhop, G. O. Larrazábal and P. Rudolf von Rohr, Green Chem., 2016, 18, 5239–5247 RSC
.
- Y. Xu, K. Li and M. Zhang, Colloids Surf., A, 2007, 301, 255–263 CrossRef
.
- M. Li, M. Tu, D. Cao, P. Bass and S. Adhikari, J. Agric. Food Chem., 2013, 61, 646–654 CrossRef PubMed
.
- A. M. Socha, R. Parthasarathi, J. Shi, S. Pattathil, D. Whyte, M. Bergeron, A. George, K. Tran, V. Stavila, S. Venkatachalam, M. G. Hahn, B. A. Simmons and S. Singh, Proc. Natl. Acad. Sci., 2014, 111, E3587–E3595 CrossRef PubMed
.
- J. Shi, J. M. Gladden, N. Sathitsuksanoh, P. Kambam, L. Sandoval, D. Mitra, S. Zhang, A. George, S. W. Singer, B. A. Simmons and S. Singh, Green Chem., 2013, 15, 2579 RSC
.
- F. Xu, J. Sun, N. V. S. N. M. Konda, J. Shi, T. Dutta, C. D. Scown, B. A. Simmons and S. Singh, Energy Environ. Sci., 2016, 9, 1042–1049 RSC
.
- B. J. Cox and J. G. Ekerdt, Bioresour. Technol., 2013, 134, 59–65 CrossRef PubMed
.
- A. Brandt, M. J. Ray, T. Q. To, D. J. Leak, R. J. Murphy and T. Welton, Green Chem., 2011, 13, 2489 RSC
.
- P. Langan, L. Petridis, H. M. O'Neill, S. V. Pingali, M. Foston, Y. Nishiyama, R. Schulz, B. Lindner, B. L. Hanson, S. Harton, W. T. Heller, V. Urban, B. R. Evans, S. Gnanakaran, A. J. Ragauskas, J. C. Smith and B. H. Davison, Green Chem., 2014, 16, 63 RSC
.
- N. Sathitsuksanoh, B. Xu, B. Zhao and Y.-H. P. Zhang, PLoS One, 2013, 8, e73523 CrossRef PubMed
.
- F. Hu, S. Jung and A. Ragauskas, ACS Sustainable Chem. Eng., 2013, 1, 62–65 CrossRef
.
- M. Normark, S. Winestrand, T. A. Lestander and L. J. Jönsson, BMC Biotechnol., 2014, 14, 20 CrossRef PubMed
.
- H. Wang, M. L. Maxim, G. Gurau and R. D. Rogers, Bioresour. Technol., 2013, 136, 739–742 CrossRef PubMed
.
- P. Verdía, A. Brandt, J. P. Hallett, M. J. Ray and T. Welton, Green Chem., 2014, 16, 1617 RSC
.
- P. Oleskowicz-Popiel, D. Klein-Marcuschamer, B. A. Simmons and H. W. Blanch, Bioresour. Technol., 2014, 158, 294–299 CrossRef PubMed
.
- L. Tao, A. Aden, R. T. Elander, V. R. Pallapolu, Y. Y. Lee, R. J. Garlock, V. Balan, B. E. Dale, Y. Kim, N. S. Mosier, M. R. Ladisch, M. Falls, M. T. Holtzapple, R. Sierra, J. Shi, M. A. Ebrik, T. Redmond, B. Yang, C. E. Wyman, B. Hames, S. Thomas and R. E. Warner, Bioresour. Technol., 2011, 102, 11105–11114 CrossRef PubMed
.
- R. Rinaldi, R. Jastrzebski, M. T. Clough, J. Ralph, M. Kennema, P. C. A. Bruijnincx and B. M. Weckhuysen, Angew. Chem., Int. Ed., 2016, 55, 8164–8215 CrossRef PubMed
.
- A. J. Ragauskas, G. T. Beckham, M. J. Biddy, R. Chandra, F. Chen, M. F. Davis, B. H. Davison, R. A. Dixon, P. Gilna, M. Keller, P. Langan, A. K. Naskar, J. N. Saddler, T. J. Tschaplinski, G. A. Tuskan and C. E. Wyman, Science, 2014, 344, 1246843 CrossRef PubMed
.
- T. Bova, C. D. Tran, M. Y. Balakshin, J. Chen, E. A. Capanema and A. K. Naskar, Green Chem., 2016, 18, 5423–5437 RSC
.
- F. Xu, T.-T. Zhu, Q.-Q. Rao, S.-W. Shui, W.-W. Li, H.-B. He and R.-S. Yao, J. Environ. Sci., 2017, 53, 132–140 CrossRef PubMed
.
- Y. Qian, X. Qiu and S. Zhu, ACS Sustainable Chem. Eng., 2016, 4, 4029–4035 CrossRef
.
- D. Ye, S. Li, X. Lu, X. Zhang and O. J. Rojas, ACS Sustainable Chem. Eng., 2016, 4, 5248–5257 CrossRef
.
- D. Kai, W. Ren, L. Tian, P. L. Chee, Y. Liu, S. Ramakrishna and X. J. Loh, ACS Sustainable Chem. Eng., 2016, 4, 5268–5276 CrossRef
.
- L. Liu, G. Huang, P. Song, Y. Yu and S. Fu, ACS Sustainable Chem. Eng., 2016, 4, 4732–4742 CrossRef
.
- N. Tachon, B. Benjelloun-mlayah and M. Delmas, BioResources, 2016, 11, 5797–5815 CrossRef
.
- H. Sadeghifar and D. S. Argyropoulos, ACS Sustainable Chem. Eng., 2016, 4, 5160–5166 CrossRef
.
- H. Sixta, A. Michud, L. Hauru, S. Asaadi, Y. Ma, A. W. T. King, I. Kilpeläinen and M. Hummel, Nord. Pulp Pap. Res. J., 2015, 30, 43–57 Search PubMed
.
- A. Hufendiek, V. Trouillet, M. A. R. Meier and C. Barner-Kowollik, Biomacromolecules, 2014, 15, 2563–2572 CrossRef PubMed
.
- N. Hameed and Q. Guo, Cellulose, 2010, 17, 803–813 CrossRef
.
- C. Li, B. Knierim, C. Manisseri, R. Arora, H. V. Scheller, M. Auer, K. P. Vogel, B. A. Simmons and S. Singh, Bioresour. Technol., 2010, 101, 4900–4906 CrossRef PubMed
.
- A. George, A. Brandt, K. Tran, S. M. S. N. S. Zahari, D. Klein-Marcuschamer, N. Sun, N. Sathitsuksanoh, J. Shi, V. Stavila, R. Parthasarathi, S. Singh, B. M. Holmes, T. Welton, B. A. Simmons and J. P. Hallett, Green Chem., 2015, 17, 1728–1734 RSC
.
- K. Ninomiya, A. R. I. Utami, Y. Tsuge, K. Kuroda, C. Ogino, T. Taima, J. Saito, M. Kimizu and K. Takahashi, Chem. Eng. J., 2018, 334, 657–663 CrossRef
.
- A. Brandt, L. Chen, B. E. van Dongen, T. Welton and J. P. Hallett, Green Chem., 2015, 17, 5019–5034 RSC
.
- L. Chen, M. Sharifzadeh, N. Mac Dowell, T. Welton, N. Shah and J. P. Hallett, Green Chem., 2014, 16, 3098 RSC
.
- A. Brandt-Talbot, F. J. V. Gschwend, P. S. Fennell, T. M. Lammens, B. Tan, J. Weale and J. P. Hallett, Green Chem., 2017, 19, 3078–3102 RSC
.
- F. J. V. Gschwend, A. Brandt, C. L. Chambon, W.-C. Tu, L. Weigand and J. P. Hallett, J. Visualized Exp., 2016, e54246 Search PubMed
.
- Q. Xiang, Y. Y. Lee, O. Petersson and R. W. Torget, Appl. Biochem. Biotechnol., 2003, 105, 505–515 CrossRef PubMed
.
- Q. Xiang, Y. Y. Lee, P. O. Pettersson and R. W. Torget, Appl. Biochem. Biotechnol., 2003, 107, 505–514 CrossRef
.
- Q. Xiang, J. S. Kim and Y. Y. Lee, Appl. Biochem. Biotechnol., 2003, 106, 337–352 CrossRef
.
- L. Yan, A. A. Greenwood, A. Hossain and B. Yang, RSC Adv., 2014, 4, 23492 RSC
.
- W. Li, N. Sun, B. Stoner, X. Jiang, X. Lu and R. D. Rogers, Green Chem., 2011, 13, 2038 RSC
.
- D. Montane, J. Salvado, X. Farriol, P. Jollez and E. Chornet, Wood Sci. Technol., 1994, 28, 387–402 Search PubMed
.
- N. Abatzoglou, E. Chornet, K. Belkacemi and R. P. Overend, Chem. Eng. Sci., 1992, 47, 1109–1122 CrossRef
.
- R. Kopelman, Science, 1988, 241, 1620–1626 CrossRef PubMed
.
- Q. Sun, Y. Pu, X. Meng, T. Wells and A. J. Ragauskas, ACS Sustainable Chem. Eng., 2015, 3, 2203–2210 CrossRef
.
- R. El Hage, N. Brosse, L. Chrusciel, C. Sanchez, P. Sannigrahi and A. Ragauskas, Polym. Degrad. Stab., 2009, 94, 1632–1638 CrossRef
.
- D. M. Mason and K. N. Gandhi, Fuel Process. Technol., 1983, 7, 11–22 CrossRef
.
-
M. Jablonský, A. Ház, A. Orságová, M. Botková, L. Šmatko and J. Kočiš, in 4th International Conference Renewable Energy Sources 2013, 2013
.
-
A. Sluiter, B. Hames, D. Hyman, C. Payne, R. Ruiz, C. Scarlata, J. Sluiter, D. Templeton and J. Wolfe, Determination of total solids in biomass and total dissolved solids in liquid process samples, 2008 Search PubMed
.
-
A. Sluiter, B. Hames, R. Ruiz, C. Scarlata, J. Sluiter, D. Templeton and D. Crocker, Determination of Structural Carbohydrates and Lignin in Biomass, 2012 Search PubMed
.
-
M. G. Resch, J. O. Baker and S. R. Decker, Low Solids Enzymatic Saccharification of Lignocellulosic Biomass Laboratory Analytical Procedure (LAP), 2015 Search PubMed
.
- Y. Pu, S. Cao and A. J. Ragauskas, Energy Environ. Sci., 2011, 4, 3154 RSC
.
Footnote |
| † Electronic supplementary information (ESI) available: Details of fractionation, compositional analysis, saccharification assay procedures, additional tables and figures and HSQC and 31P NMR spectra. See DOI: 10.1039/c8gc00837j |
| This journal is © The Royal Society of Chemistry 2018 |

