
 Open Access Article
 This Open Access Article is licensed under a Creative Commons Attribution-Non Commercial 3.0 Unported Licence
Elucidating transfer hydrogenation mechanisms in non-catalytic lignin depolymerization†
Florent P.
Bouxin
a,
Henri
Strub
b,
Tanmoy
Dutta
 ac,
Julie
Aguilhon
b,
Trevor J.
Morgan
d,
Florence
Mingardon
e,
Murthy
Konda
a,
Seema
Singh
ac,
Blake
Simmons
a and
Anthe
George
*ac
ac,
Julie
Aguilhon
b,
Trevor J.
Morgan
d,
Florence
Mingardon
e,
Murthy
Konda
a,
Seema
Singh
ac,
Blake
Simmons
a and
Anthe
George
*ac
aJoint BioEnergy Institute, Lawrence Berkeley National Laboratory, Berkeley, CA 94720, USA. E-mail: ageorge@lbl.gov
bTotal Raffinage Chimie, 2 Pl. Jean Millier, 92400 Courbevoie, France
cBiological and Engineering Sciences Center, Sandia National Laboratories, Livermore, California 94551, USA
dHawaii Natural Energy Institute, University of Hawaii at Manoa, Honolulu, Hawaii 96822, USA
eTotal New Energies Inc., Emeryville, CA, USA
First published on 6th July 2018
Abstract
Lignin undergoes catalytic depolymerization in the presence of a variety of transfer hydrogenation agents, however the mechanisms for non-catalytic depolymerization of lignin via transfer hydrogenation are not well understood; this makes process optimization difficult. Herein, for the first time a mechanism for this process is proposed. For the purposes of understanding the mechanisms involved in these non-catalytic lignin depolymerization processes, this study investigates the equilibrium system of formic acid, methyl formate and carbon monoxide, as agents for the depolymerization of lignin, in the presence of either water or methanol as solvents. In the methyl formate/water (at 300 °C) system, 73 wt% oil was produced which contained a significant amount of low molecular weight alkylphenols, with less than 1 wt% char produced. In aqueous media, the results showed that methyl formate maintains an equilibrium with formic acid which is itself in equilibrium with carbon monoxide. It was found that using either formic acid or methyl formate for non-catalytic transfer hydrogenation of lignin can produce high amounts of oil, and can be described as a two-stage mechanism. After 10 min of reaction at 300 °C, around a quarter of the formic acid is consumed via hydride transfer of the formate proton, preventing the condensation of lignin fragments. At the same time, approximately three quarters of the formic acid decomposes to carbon dioxide and carbon monoxide. Once the formic acid is consumed, the carbon monoxide was identified as the precursor to a reactive reductive reagent and was able to activate the proton of the water molecule preventing further condensation of the lignin fragments. It has been previously thought that transfer hydrogenation in lignin using formic acid occurs via the production of molecular hydrogen. Here it is demonstrated that formic acid reacts directly with the lignin, without this hydrogen formation. Therefore the key parameters for efficient transfer hydrogenation of the lignin to maximize bio-oil yield appear to involve controlling the reactions between lignin and formic acid, methyl formate or carbon monoxide under aqueous conditions, thereby reducing the reagent cost and loading while maintaining efficient lignin conversion.
Introduction
The environmental impact of fossil fuel consumption is increasing and the transition to more sustainable energy is underway. More environmentally benign methods for producing energy are developing and biomass has a key role to play in these mitigation strategies. For the past decade, significant efforts have been made in the production of lignocellulosic biofuels.1 Several biofuel processes based on biological conversion of the cellulosic fraction of the pretreated biomass are at the scale-up phase. However, the economic viability of such processes requires the valorization of the lignin fraction.2 Currently, lignin is usually burned for process heat. However, lignin could be more profitable as a feedstock for the production of bulk aromatic bio-based synthons.3The depolymerization of lignin to lower molecular weight is often seen as the critical step for its efficient valorization.4 Improving our understanding of the lignin depolymerization and charring mechanisms has significance in a number of related areas of study such as the production of alternative and biomass derived biofuels. For example, there is a need for a pathway to produce low molecular weight aromatics as additives to aliphatic oils produced via the hydrotreated esters and fatty acids (HEFA) process.5–8 Understanding biomass and more specifically lignin reaction mechanisms is also vital for the optimization of bio-carbon production through methods such as hydrothermal carbonization, flash carbonization™ and constant volume pyrolysis.9–11 All these areas of study rely on the control, and thereby understanding, of reaction conditions to tailor product properties while reducing costs.
Reductive approaches for the depolymerization of lignin have recently received significant attention.4,12,13 Among them, catalytic depolymerization of lignin in the presence of hydrogen has been extensively studied.13–15 It is well established that formic acid (FA) can be used as an in situ source of hydrogen and is often used in combination with noble metal catalysts for the depolymerization and deoxygenation of the lignin (Table S.1†). Previous studies reported the efficient depolymerization of lignin in FA-water media using bifunctional noble metal catalysts or in isopropanol-FA media using Ru/C catalyst.16,17 In these two studies, the non-catalytic control conditions were reported to generate significantly lower amounts of oil and higher amount of char. On the other hand, the addition of a noble metal catalyst limited char production and increased the monomeric phenolic yields. Inversely, another study at lower temperatures (265 °C) showed that the oil yield was not improved when the Pd/C catalyst was added in the system. In non-catalytic and catalytic conditions, catechol (1,2-dihydroxybenzene, CAS 120-80-9) was the major product of the monomeric fraction.12 In alkaline conditions, another study reported that the depolymerization of eucalyptus lignin in the presence of sodium formate at 300 °C in water led to guaiacol (2-methoxyphenol, CAS 90-05-1) and syringol (1,3-dimethoxy-2-hydroxybenzene, CAS 91-10-1) as the main products.18 In a recent study, Onwudili et al. used a two-stage catalytic hydrothermal process to depolymerize lignin to phenols. Interestingly, the author reported higher oil yield as well as monomer yield using non-catalytic conditions. On the other hand, a greater amount of char was produced in catalytic conditions which could be attributed to the use of an acidic alumina supported Pt catalyst which is known to favor coking.19 According to previous studies, the non-catalytic transfer hydrogenation of lignin produced similar or higher yields of oils. Moreover, the use of noble metal catalysts are expensive and their recycle challenging. In that context, optimizing lignin depolymerization in non-catalytic conditions using transfer hydrogenation type reactions is a desirable approach. A recent study showed promising results for the lignin conversion to bio-oil using FA in non-catalytic aqueous media. The authors achieved up to 75% oil yield for the softwood Kraft lignin conversion at 390 °C and 4 h reaction. The authors highlighted the slight increase of oil yield in ethanol-based conditions and attributed this to the alkylation of the lignin fragments.20
In other work, non-catalytic transfer hydrogenation using FA in alcohol media was applied to a series of lignin model compounds in order to understand the degradation or depolymerization mechanisms. At temperatures around 350 °C, the authors concluded that the mechanism propagates through the homolytic cleavage of the ether bonds. Moreover, the authors made the assumption that the molecular hydrogen, produced from the FA decomposition, suppressed recondensation of the lignin fragment.21 A recent study on hardwood lignin depolymerization in subcritical water under different gases (N2, CO, H2 and CO2) reported similar lignin conversion regardless of the gases used. However, the authors reported that carbon monoxide generated the best environment for the production of low molecular weight products.22 Other studies reported the effect of carbon monoxide and water in the depolymerization of lignin. In the presence of sodium carbonate, up to 90% of the lignin products were benzene soluble after reaction at 380 °C and 1500 psi of carbon monoxide (cold pressure). The authors also suggested that the carbon monoxide was able to cleave β-ether linkages of the lignin.23
Under subcritical water conditions, decarboxylation of FA was observed and carbon monoxide production from the lignin decomposition has been suggested.12 However, at the same temperature other studies report that the FA decomposes via two pathways.21 According to previous work, the decarbonylation and decarboxylation can be tuned depending on the temperature and acidity of the media. Under acidic conditions, decarbonylation will be preferred while basic conditions favour decarboxylation.24 In other work, the decomposition pathway of the FA suggested that the isomer stability was the key to the FA decomposition route. In the presence of water, the cis-configuration gave the higher stability which suggested decarboxylation as the preferential pathway.25 In an alcohol medium, FA was rapidly esterified due to the favorable equilibrium for alkylformate.26 In previous work, an alcoholic media has been generally used. However, the quick esterification of the FA in the presence of the alcohol should have an impact on the activity of the formate as an H transfer donor reagent. The presence of water also had an impact on the reactivity of the FA. In that context, alkylformate could be substituted for FA in the water media.
Transfer hydrogenation of lignin in non-catalytic systems is likely to be a more attractive approach from an economic and process intensification perspective; a full techno-economic analysis would be required to assess such benefits and was not the focus of this study. However, there is a lack of understanding of the lignin transfer hydrogenation mechanisms, making process optimization challenging. In most of the previous studies, temperatures above 350 °C and reaction times as long as 15 h were required to produce high yields of low molecular weight phenolic compounds. The lignin loading was also kept below 10% and the mass ratio between FA and lignin was more than 2.27,28
In this study, non-catalytic transfer hydrogenation of sugar-cane bagasse derived lignin was investigated. The study was designed to understand the key parameters permitting the minimization of lignin condensation reactions that produce char and the concomitant improvement in the production of deoxygenated lignin oils. The equilibrium system of FA, methyl formate (MF) and carbon monoxide was investigated. First, aqueous and non-aqueous media were investigated via a parametric study of water or methanol as solvent, and FA or MF as reagent. The equilibrium was further investigated by evaluating the contribution of the system decomposition products, CO and H2. A time-course study of the lignin depolymerization was then performed to observe the evolution of the product quantities and distributions. In parallel, the gas composition was measured as a function of the experimental conditions and reaction time in order to identify key conditions for efficient depolymerization of the lignin and minimization of char. Finally, deuterated FA was used to confirm the role of the hydride proton of the formate on the lignin deoxygenation process. From these studies, key mechanisms and reactions in the non-catalytic transfer hydrogenation of lignin were determined.
Results and discussion
Preparation of the bagasse lignin
The bagasse lignin was prepared from the saccharification residue of dilute acid pretreated sugarcane bagasse. The alkaline extraction permitted 73 wt% of the lignin initially present in the residue to be isolated. After alkaline extraction followed with acid precipitation, no sugars were detected in the isolated lignin which were composed of 88 wt% acid insoluble lignin (Klason Lignin) and 0.9 wt% ash. As illustrated in Table 1, significant amounts of nitrogen were observed which can be suggested to be from proteins bound to the lignin after precipitation. The molecular weight profile of the lignin showed a high polydispersity of 4.4 due to the presence of monomers p-coumaric acid and ferulic acid estimated to be 9.1 and 7.9 per 100 C9 units of lignin. The presence of p-coumaric acid and ferulic acid in grass lignin was expected.29 As illustrated in Table 1, the bagasse lignin is a syringyl rich lignin with 57% of syringyl (S) units, 34% of guaiacyl (G) and 8% of hydroxyphenyl (H) units. However, the p-coumaric acid and ferulic acid were not included in the lignin unit ratio as they are not considered to be part of the backbone of lignin; ferulic acid acts as bridge between lignin and hemicellulose components; coumaric acid is present as a pendent ester group on the lignin. Overestimation of both units in the lignin using 2D NMR has been reported. The abundance of alkyl aryl ether linkage (β-O-4) is 27% suggesting that the uncondensed structure was not significantly affected by the alkaline extraction. It is believed that the preservation of the uncondensed structure of the lignin is imperative to achieving good conversion into low molecular weight products.| Elemental analysis | GPC analysis | |||||
|---|---|---|---|---|---|---|
| C | H | N | O | M n | M w | M w/Mn |
| 59.2 | 5.8 | 2.6 | 32.4 | 737 | 3214 | 4.4 |
| NMR analysis | |||||||
|---|---|---|---|---|---|---|---|
| %S | %G | %H | %pCA | %FA | % β-O-4 | %β-5 | %β–β |
| 57.4 | 34.2 | 8.4 | 9.1 | 7.9 | 27.4 | 1.0 | 1.8 |
Parametric study of lignin transfer hydrogenation
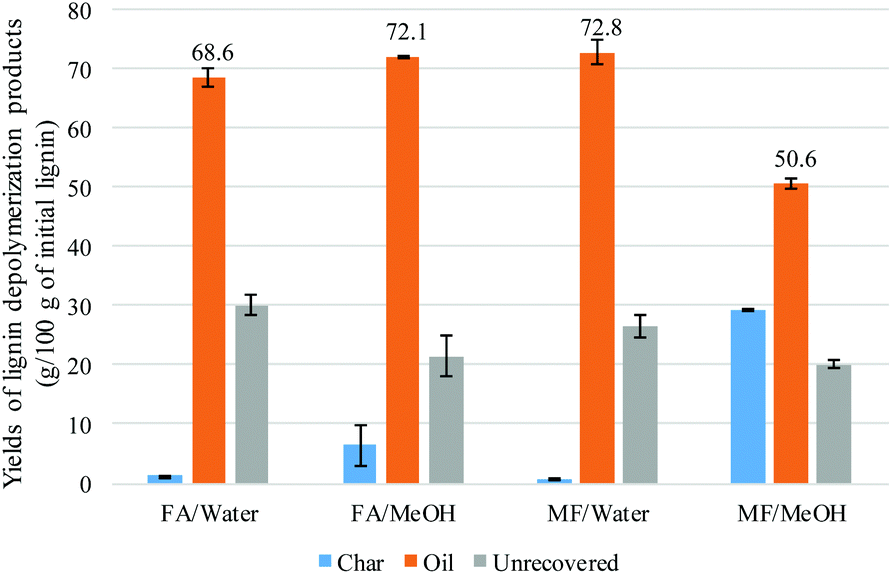 | ||
| Fig. 1 % yields of the lignin depolymerization products (g per 100 g of the initial lignin) as function of the experimental conditions; values are the average of duplicate experiments. | ||
| Oil g per 100 g of oil | Char g per 100 g of char | Oil + char (g per 100 g of bagasse lignin) | ||||||||||
|---|---|---|---|---|---|---|---|---|---|---|---|---|
| C | H | N | O | C | H | N | O | C | H | N | O | |
| Bagasse lig. | 59.2 (0.1) | 5.8 | 2.6 | 32.4 | ||||||||
| FA/water | 71.2 | 8.0 | 2.7 | 18.2 | 70.9 | 6.1 | 2.3 | 20.7 | 49.7 (0.8) | 5.5 | 1.9 | 12.7 |
| FA/MeOH | 74.0 | 8.0 | 1.6 | 16.5 | 79.9 | 5.6 | 1.8 | 12.7 | 58.4 (0.8) | 6.1 | 1.3 | 12.7 |
| MF/water | 70.1 | 8.2 | 1.8 | 20.0 | 72.7 | 6.3 | 1.7 | 19.3 | 51.4 (0.5) | 6.0 | 1.3 | 14.7 |
| MF/MeOH | 73.1 | 7.8 | 2.1 | 17.0 | 81.6 | 5.6 | 2.4 | 10.4 | 60.9 (0.2) | 5.6 | 1.8 | 11.6 |
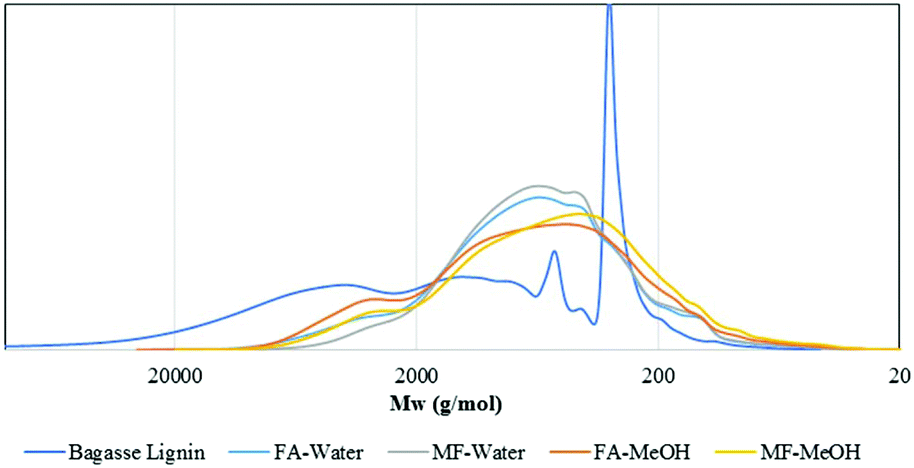 | ||
| Fig. 2 Size exclusion chromatograms of the initial bagasse lignin and oil fractions after lignin depolymerization as a function of the experimental conditions. | ||
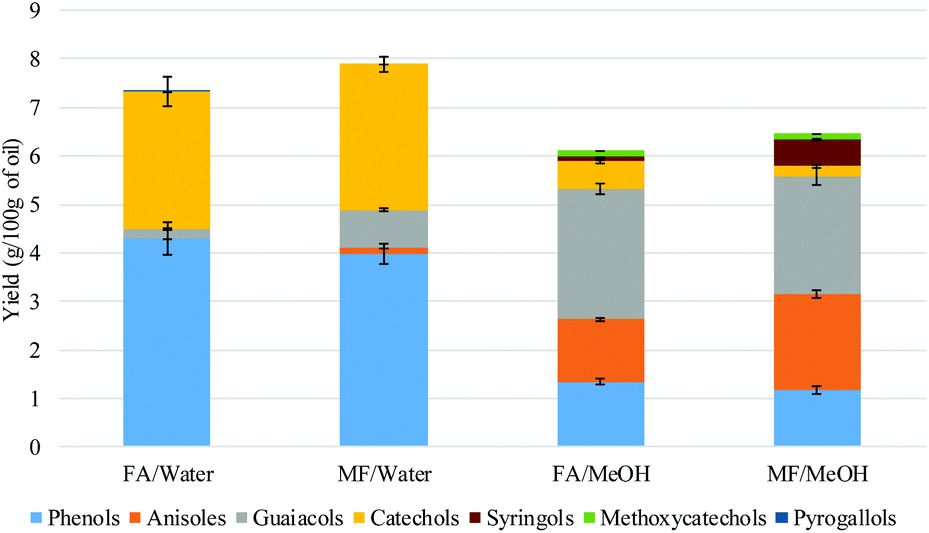 | ||
| Fig. 3 Quantitative GC-MS analysis of the monomeric products (g per 100 g of oil). | ||
| FA-water | MF-water | FA-MeOH | MF-MeOH | |||||
|---|---|---|---|---|---|---|---|---|
| g per 100 g of oil | g per 100 g of lignin | g per 100 g of oil | g per 100 g of lignin | g per 100 g of oil | g per 100 g of lignin | g per 100 g of oil | g per 100 g of lignin | |
| a g per 100 g of oil. b g per 100 g of the Klason lignin content of the bagasse lignin. c Specific isomer unidentified. | ||||||||
| Anisole | 0 | 0 | 0 | 0 | 0 | 0 | 0.10 | 0.06 |
| 2-Methylanisole | 0 | 0 | 0 | 0 | 0 | 0 | 0.06 | 0.03 |
| 4-Methylanisole | 0 | 0 | 0 | 0 | 0.13 | 0.10 | 0.28 | 0.16 |
| Phenol | 1.70a | 1.34b | 1.44 | 1.19 | 0.3 | 0.25 | 0.26 | 0.15 |
| 4-Ethyanisole | 0 | 0 | 0 | 0 | 0.93 | 0.76 | 1.42 | 0.82 |
| 2-Cresol | 0.07 | 0.05 | 0.08 | 0.06 | 0.12 | 0.09 | 0.14 | 0.08 |
| 1,2-Dimethoxybenzene | 0 | 0 | 0 | 0 | 0.23 | 0.19 | 0.35 | 0.2 |
| 4-Cresol | 0.4 | 0.31 | 0.36 | 0.3 | 0.15 | 0.12 | 0.13 | 0.07 |
| Guaiacol | 0.08 | 0.06 | 0.3 | 0.25 | 0.64 | 0.52 | 0.64 | 0.37 |
| 4-Ethylphenol | 2.03 | 1.59 | 2.05 | 1.7 | 0.78 | 0.64 | 0.66 | 0.38 |
| 4-Methylguaiacol | 0.02 | 0.01 | 0.17 | 0.14 | 0.99 | 0.81 | 0.91 | 0.53 |
| Cyclohexane-1,2-diol | 0.13 | 0.1 | 0.24 | 0.2 | 0 | 0 | 0 | 0 |
| 1,2,3-Trimethoxytoluene | 0 | 0 | 0 | 0 | 0 | 0 | 0.2 | 0.11 |
| catechol | 1.19 | 0.93 | 1.02 | 0.85 | 0.15 | 0.12 | 0.16 | 0.09 |
| 4-Propylphenol | 0.1 | 0.08 | 0.07 | 0.06 | 0 | 0 | 0 | 0 |
| 4-Methylcatechol | 0.42 | 0.33 | 0.45 | 0.38 | 0.06 | 0.05 | 0.03 | 0.02 |
| 3-Methylcatechol | 0.14 | 0.11 | 0.16 | 0.13 | 0.06 | 0.05 | 0.02 | 0.01 |
| 4-Ethylguaiacol | 0.01 | 0.01 | 0.19 | 0.16 | 0.76 | 0.62 | 0.71 | 0.41 |
| Syringol | 0 | 0 | 0 | 0 | 0.12 | 0.1 | 0.59 | 0.34 |
| 4-Ethylcatechol | 0.7 | 0.55 | 0.92 | 0.76 | 0.16 | 0.13 | 0 | 0 |
| Methyl-ethylguaiacolc | 0.1 | 0.08 | 0.12 | 0.1 | 0.07 | 0.06 | 0 | 0 |
| 4-Propylguaiacol | 0 | 0 | 0 | 0 | 0.23 | 0.19 | 0.16 | 0.09 |
| 3-Methoxycatechol | 0 | 0 | 0 | 0 | 0.05 | 0.04 | 0.07 | 0.04 |
| 4-Methylsyringol | 0 | 0 | 0 | 0 | 0.04 | 0.03 | 0.17 | 0.1 |
| Ethyl-methylcatecholc | 0.1 | 0.08 | 0.12 | 0.1 | 0.07 | 0.06 | 0 | 0 |
| 4-Propylcatechol | 0.27 | 0.21 | 0.35 | 0.29 | 0.06 | 0.05 | 0 | 0 |
| pyrogallol | 0.01 | 0.01 | 0 | 0 | 0 | 0 | 0 | 0 |
| 5-Methyl-3-methoxycatechol | 0 | 0 | 0 | 0 | 0.08 | 0.06 | 0.06 | 0.03 |
| 4-Ethylsyringol | 0 | 0 | 0 | 0 | 0.05 | 0.04 | 0.08 | 0.05 |
| 2-Phenol-ethanol | 0.21 | 0.17 | 0.24 | 0.2 | 0 | 0 | 0 | 0 |
| 5-Ethyl-3-methoxycatechol | 0 | 0 | 0 | 0 | 0.08 | 0.07 | 0.08 | 0.05 |
| 4-Propylsyringol | 0 | 0 | 0 | 0 | 0.09 | 0.07 | 0.12 | 0.07 |
| 5-Propyl-3-methoxycatechol | 0 | 0 | 0 | 0 | 0 | 0 | 0 | 0 |
| Sum | 7.66 | 6.01 | 8.28 | 6.87 | 6.40 | 5.22 | 7.40 | 4.27 |
The distribution of the different products was highly dependent on the nature of the solvent. Under aqueous conditions, phenols and catechols were the main products. The distribution was more diverse when methanol was used with a significant presence of anisoles, suggesting that the phenolic hydroxyl groups were methylated. On the other hand, guaiacol was present in a higher concentration when methanol was used, compared to the aqueous system. This can be explained by the hydrolysis of the methoxy group to produce catechols in the presence of water. The methanol medium favoured the methylation of the phenolic hydroxyl, while the aqueous medium favoured the demethylation of the methoxy group. Methane was not detected in the FA/water system (Fig. 7). It is suggested that the methoxy group of the lignin undergoes hydrolysis to produce catechol and methanol rather than undergoing reductive cleavage to generate methane. This could not be confirmed in this study as methanol is lost during the product recovery step and would be accounted for in the unrecovered fraction. Etherification under methanol conditions or ether hydrolysis in the aqueous system explain the difference in carbon content derived from the sum of char + oil determined by elemental analysis (Table 2) and also the lower amount of unrecovered fraction in the case of the methanol system (Fig. 1). Previous studies also highlighted the alkylation of the aromatic ring of the lignin when the reaction was conducted in alcoholic media.20,21 In the present study, no significant alkylation of the aromatic ring was observed, although some alkylation did occur. This could be explained by the lower reaction temperature used in the present study.
Onwudili reported the production of up to 15% of alkylated benzene and up to 10% of alkylphenols when the lignin was two-stage depolymerized at 265 °C for 1 h followed by 350 °C for 5 h. When the reaction was conducted at 265 °C for 5 h and 350 °C for 1 h, phenol was the main product accounting for up to 18% of the lignin feed.19 Elsewhere it has been reported that catechol was produced when the reaction was conducted at 265 °C for 6 h.12 In the present study, no alkylated benzene products were detected under our reaction conditions. The deoxygenation of the aromatic ring probably requires a higher temperature than used in the present study (300 °C).
Time course study of the lignin transfer hydrogenation
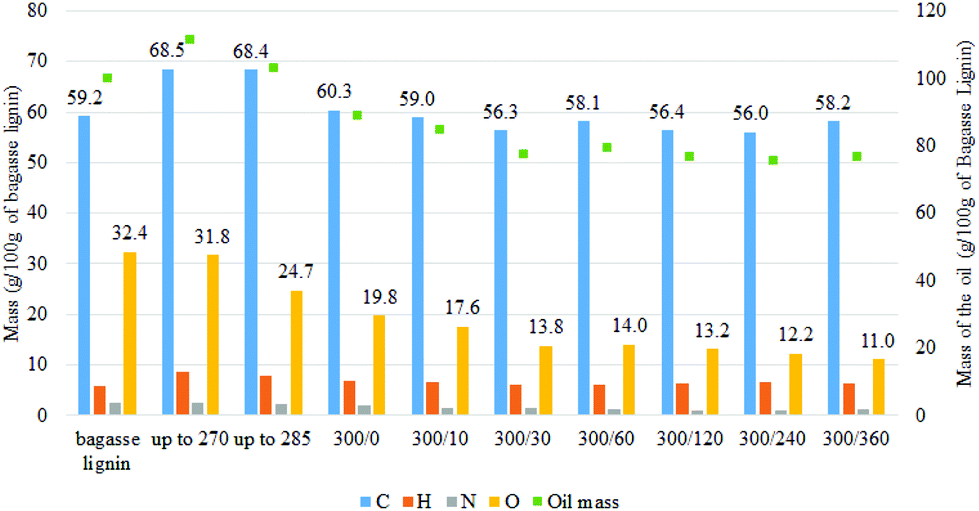 | ||
| Fig. 4 Evolution of the mass of each type of atom in the oil produced at different reaction time based on 100 g of starting bagasse lignin [300/0: temperature (°C)/time (min)]. | ||
As illustrated in Fig. 5, the depolymerization of the bagasse lignin already occurred before the reaction temperature reached 270 °C. The NMR analysis (Fig. S.1†) of oil produced once the temperature reached 270 °C showed that the alkyl–aryl ether linkages had already disappeared at this stage of the reaction. Cleavage of the alkyl–aryl ether linkage occurred during the temperature ramp. However, the region of the aromatic proton could still be distinguished between the guaiacyl and syringyl units. On the other hand, the correlation peak related to the coumarate and ferulate structure disappeared while a correlation peak appeared next to the H2,6 signal of the hydroxyphenyl lignin unit. This peak could be attributed to the production of alkylphenols such as ethylphenol.
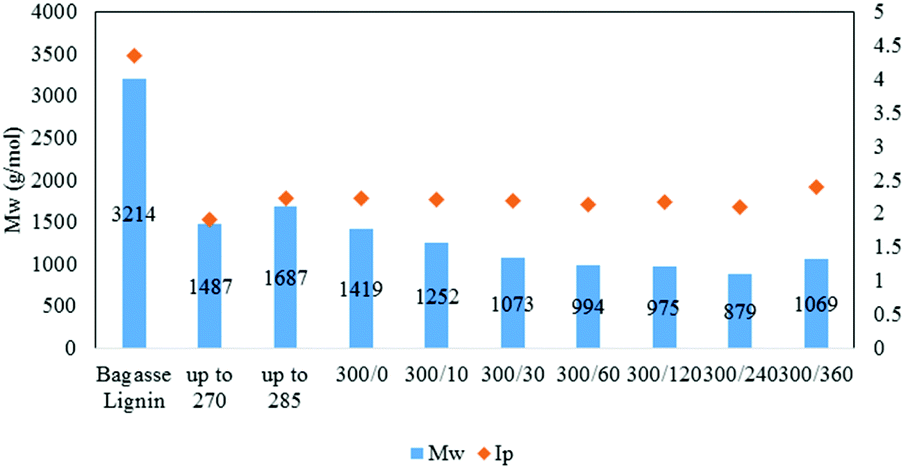 | ||
| Fig. 5 Weight-average molecular weight and index of polydispersity of the lignin oil as function of the reaction time [300/0: temperature (°C)/time (min)]. | ||
As illustrated in Fig. 5, the Mw of the oil then slowly decreased to 880 g mol−1 after 4 h reaction before increasing to 1070 g mol−1 at 6 h. The small increase between 4 and 6 h may be attributed to condensation reactions.
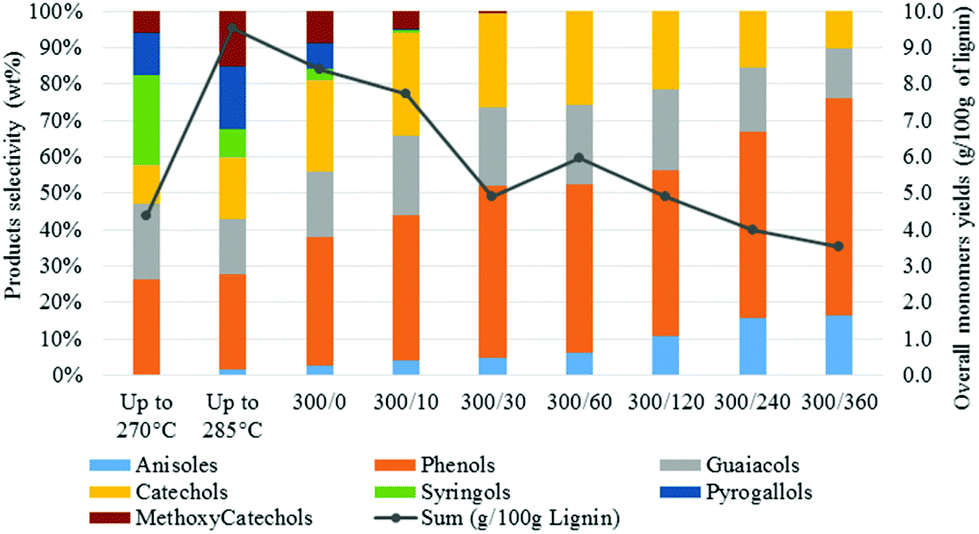 | ||
| Fig. 6 Monomers yields and selectivity as function of the reaction time [300/0: temperature (°C)/time (min)]. | ||
A close analysis of the product distribution highlighted that the H-type units were more stable that the G-type and S-type units. As a consequence, higher monomers yields should be expected from H-rich lignin. On the other hand, the S-rich lignin (usually dominant in grasses and hardwood) did not seem to be the most suitable lignin structure for transfer hydrogenation reactions in aqueous media.
Gas compositions after reaction
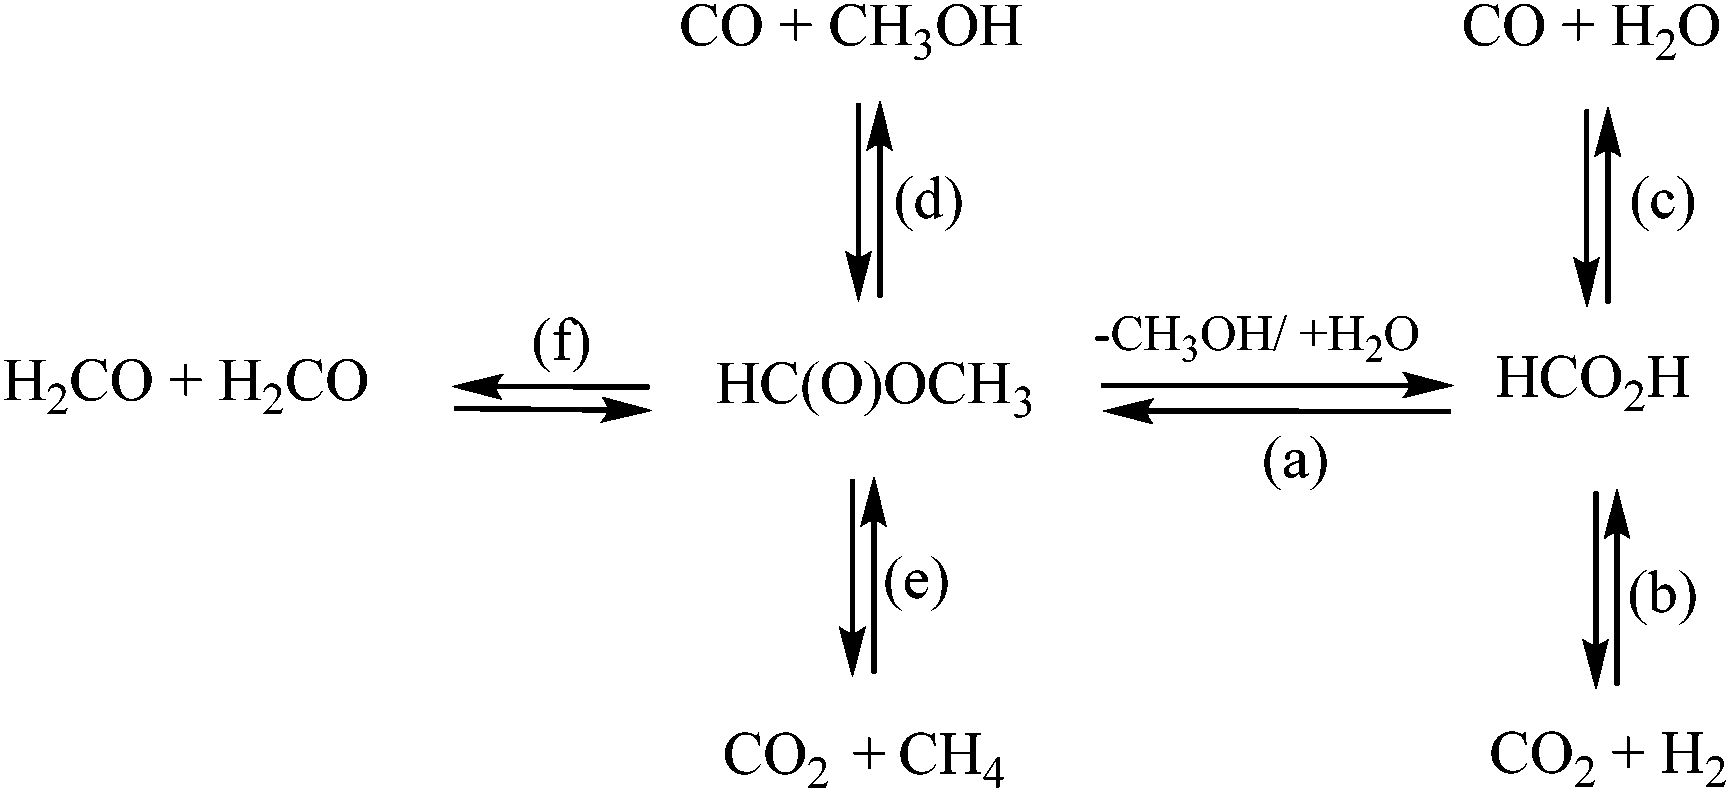 | ||
| Scheme 1 Reaction pathways of formic acid and methyl formate equilibrium and decomposition [(a) equilibrium between formic acid and methyl formate; (b, e) decarboxylation or (c, d) decarbonylation, (f) formaldehyde decomposition pathways]. | ||
Fig. 7 shows the gas composition after decomposition of FA/MF without (A) or with (B) lignin. For comparison, the same number of moles of MF or FA was used for both sets of experiments (A & B) and the gas concentrations were reported as a function of the mass of lignin. As illustrated in Fig. 7A, all the FA/MF were decomposed in the aqueous system after 4 h reaction in the absence of lignin. On the other hand, the sum of CO + CO2 showed that less than 50% of the FA/MF was decomposed when methanol was used. This is explained by the higher stability of methyl formate towards decomposition. Indeed, the activation energy for the decarbonylation of the MF was previously estimated to be 74.8 kcal mol−1 while the FA carboxylation activation energy can be as low as 45.3 kcal mol−1.25,32 As illustrated in Scheme 1, the hydrolysis of the MF in water generated the FA which then decomposed via decarboxylation or decarbonylation pathways to produce CO2 an H2 or CO, respectively.33 The gas composition was similar when excess water was used (FA/W or MF/W). On the other hand, the gas composition after decomposition of the FA (FA/MeOH) or methyl formate (MF/MeOH) was different. For the FA/MeOH system, the molar ratio CO2/CO was 4.5 whilst in the MF/MeOH case, the ratio was 0.22. It is also interesting to note that the ratio of H/CO2 was 1.6 in methanol whilst it was close to 1 under aqueous conditions. The higher production of hydrogen could be explained by the methanol reforming reaction. As illustrated in Fig. 7B, the presence of lignin significantly modified the gas composition and catalysed the decomposition of FA/MF in methanol. However, the catalytic effect of lignin was unclear and further analysis is required to understand if, for example, metal impurities (if present) or lignin itself are the reason for this effect. The gas composition in the presence of lignin was also highly affected by the solvent used in the depolymerization experiments, rather than the transfer hydrogenation agent. In the water system, CO2 was the most abundant gas with 18 mmol g−1 of lignin. The greatest CO yield was observed under both methanol systems (FA/MeOH and MF/MeOH), with 15.6 mmol and 17.2 mmol g−1 of bagasse lignin respectively. The decarboxylation of FA appears to be the main decomposition pathways in aqueous media, and decarbonylation of FA and MF under non-aqueous media which is in agreement with a previous study.25 In aqueous media, the fast hydrolysis of the MF to FA will significantly exacerbate the MF decomposition.33
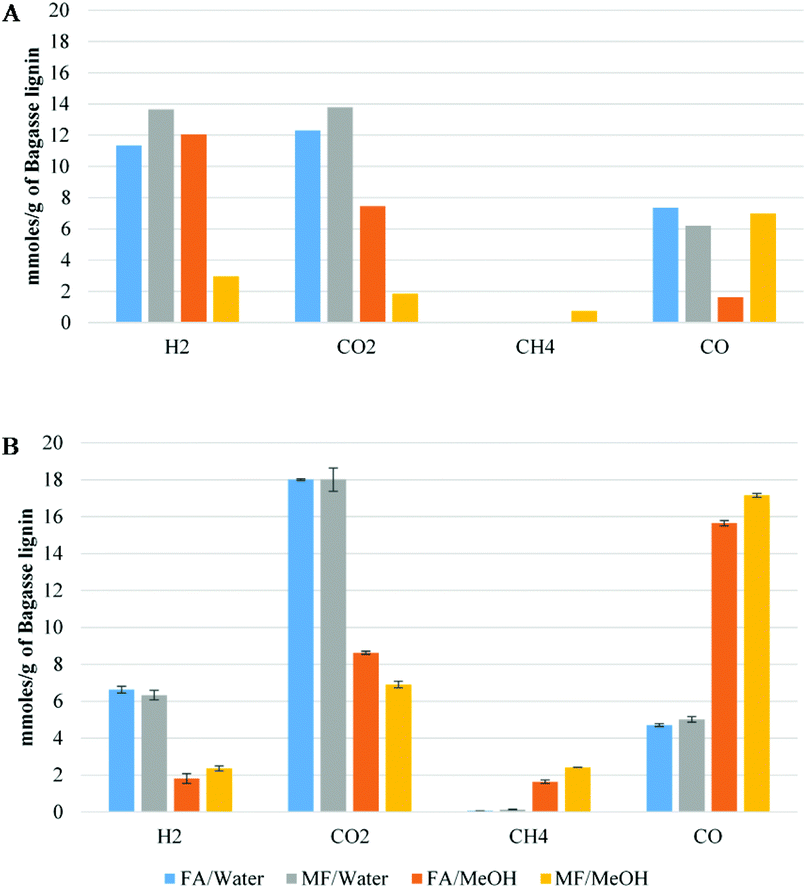 | ||
| Fig. 7 Gas composition of formic acid/methyl formate decomposition without (A) or with (B) the presence of bagasse lignin (mmol g−1 of bagasse lignin). | ||
Methane was only produced in significant quantities in the non-aqueous medium and is likely to come from hydrogenation of methanol and/or decarboxylation of MF (Fig. 4A). Under aqueous reaction conditions, the low amount of methane suggests that the demethylation of the methoxy group proceeds via a hydrolysis mechanism instead of hydrogenolysis. The number of moles of MF or FA used for the experiment were 20 mmol g−1 of lignin. The sum of CO2 + CO produced in all four experiments ranged from 22.7 mmol to 24.3 mol for FA/water and FA/MeOH conditions respectively. These values are slightly higher than the total amount of carbon oxides generated by the decomposition of the FA and can be partially explained by the decarboxylation of the p-coumaric acid and ferulic acid of the lignin. According to the NMR result, decarboxylation of both cinnamic acids should generate less than 1 mmol of CO2 per gram of lignin. However, this could be overstated due to the overestimation of the p-coumaric acid and ferulic acid using analysis via NMR. On the other hand (Table 4), the blank experiment, where bagasse lignin was only reacted in the presence of water, at 35 bar-g nitrogen, produced 3 mmol of CO2 per g of lignin which is in agreement with the overproduction of CO2. Compared to the water system, the total carbon oxides was also slightly higher in the methanol system and could be explained by the methanol reforming reaction. It is well known that formaldehyde is produced during acid-catalyzed hydrolysis of lignin. In addition to being involved in lignin condensation, the formaldehyde can disproportionate to give methanol and FA (Scheme 1) or cross-disproportionate with FA to give CO2 and methanol.34 As a consequence, the degradation pathway of the formaldehyde could also account for the over-production of CO2.
| H2 | CO2 | CH4 | CO | CO + CO2 | CO2–H2 | |
|---|---|---|---|---|---|---|
| Up to 270 °C | 1.9 | 6.3 | 0.0 | 8.7 | 15.0 | 4.5 |
| Up to 285 °C | 3.5 | 9.2 | 0.0 | 10.7 | 19.9 | 5.7 |
| 300/0 | 3.1 | 9.3 | 0.1 | 11.1 | 20.4 | 6.2 |
| 300/10 | 4.5 | 10.9 | 0.1 | 10.1 | 21.0 | 6.4 |
| 300/30 | 4.0 | 10.6 | 0.2 | 10.1 | 20.7 | 6.6 |
| 300/60 | 3.8 | 11.3 | 0.3 | 9.6 | 20.9 | 7.5 |
| 300/120 | 4.1 | 12.8 | 0.4 | 8.4 | 21.2 | 8.7 |
| 300/240 | 4.5 | 14.1 | 0.8 | 8.0 | 22.1 | 9.7 |
| 300/360 | 4.9 | 14.7 | 1.1 | 7.0 | 21.7 | 9.8 |
In the system without lignin (Fig. 7A), the H2/CO2 ratio was in all cases equal to or greater than one. However, as illustrated in Fig. 7B, the difference of moles between hydrogen and carbon dioxide can be explained by the direct or indirect involvement of hydrogen in the deoxygenation of lignin. As illustrated in Fig. 7B, taking into account the CO2 coming from the lignin (3 mmol g−1, Table 5), around 8.5 mmol of hydrogen per gram of lignin were consumed in the water system while only 3.8 and 1.5 mmol were consumed when non-aqueous conditions were applied. The higher consumption of hydrogen could be correlated to less char formation due to fewer lignin condensation reactions.
| Entry | Conditionsa | Gas composition (mmol g−1 of lignin) | Yields (g per 100 g of lignin) | ||||||
|---|---|---|---|---|---|---|---|---|---|
| H2 | CO2b | CH4 | CO | CO2–H2 | Char | Oil | Unrecov. | ||
| a See to Table 1 for experimental conditions. b CO2 value in entries 3 to 7 are corrected with the amount of CO2 generated from the lignin (entry 1). | |||||||||
| 1 | N2 | 0.0 | 3.0 | 0.1 | 0.1 | 3.0 | 34 | 37 | 33 |
| 2 | CO-blank | 0.7 | 0.6 | 0.0 | 27.8 | −0.1 | n.a. | n.a. | n.a. |
| 3 | CO-10 bar | 1.2 | 4.8 | 0.1 | 4.1 | 3.6 | 18 | 49 | 33 |
| 4 | CO-20 bar | 2.4 | 6.9 | 0.1 | 9.4 | 4.5 | 11 | 57 | 33 |
| 5 | CO-35 bar | 4.4 | 10.0 | 0.1 | 18.2 | 5.6 | 6 | 63 | 31 |
| 6 | H2/CO | 14.5 | 0.5 | 0.0 | 8.8 | n.a. | 31 | 42 | 28 |
| 7 | H2 | 21.0 | 0.1 | 0.1 | 0.1 | n.a. | 28 | 44 | 28 |
As illustrated in Fig. 4, methane was a significant product when methanol conditions were used. In the water system, methane was produced at a constant rate of 0.017 mmol min−1. This could come from the methanol generated by the demethylation of guaiacol and syringol. Methane is also likely to come from direct hydrogenation of methanol and/or from the carbonylation of methanol with CO followed by decarboxylation of MF.
The time-course study of the gas composition showed that carbon monoxide was consumed while CO2 was generated. As the FA was decomposed at an early stage of the reaction, the presence of carbon monoxide and hydrogen had to play a critical role in the prevention of lignin recondensation. This aspect of the transfer hydrogenation using FA is often ommitted and will be discussed in the next section.
In order to check if the molecular hydrogen could be directly consumed during the experiment, lignin was reacted in the presence of a gas mixture composed of 20 bar-g (13.5 mmol g−1 of lignin) H2 and 10 bar-g (8.6 mmol g−1 lignin) CO. As illustrated in Table 5 (entry 6), molecular H2 was slightly produced, not consumed. This suggests that the hydridic proton from the formate, produced from CO and water, directly reacted with the lignin. This hypothesis has already been reported in previous work on hydrothermal liquefaction of a low-rank coal and biomass in the presence of carbon monoxide.36,37 On the other hand, compared to entry 3 where half of the CO was consumed, barely any CO was consumed when the nitrogen was substituted with hydrogen. The presence of hydrogen appeared to inhibit the oxidation of CO to CO2. The inhibition effect of the hydrogen could be explained by an equilibrium effect between hydrogen and carbon monoxide within the water–gas-shift reaction. The inhibition of the CO oxidation increased the char formation. As illustrated in Table 5, the char formation increased from 18% (entry 3) to 31% (entry 6) when nitrogen was substituted with hydrogen. In the pure hydrogen system (entry 7), the char formation was also much higher than in the carbon monoxide system (entry 5). This observation clearly shows that the molecular hydrogen is not active in the studied conditions and did not prevent lignin condensation reations.
As illustrated in Table 6, the oxygen content of the oil generated in the blank (entry 1) and under pure hydrogen (entry 5) were similar to the initial bagasse lignin (Table 1). No significant deoxygenation of the lignin oil was observed when the lignin was reacted in the presence of 35 bar-g nitrogen or 30 bar-g of hydrogen. On the other hand, the reduction of the oxygen content was significant in the char and was due to the carbonization of the lignin. The oils produced under CO conditions showed that their oxygen content decreases from 23.2 wt% to 20.2 wt% as the CO partial pressure increased from 10 to 35 bar-g. As illustrated in Fig. 8, there is a linear correlation between the lignin oil yields and the oxygen content of the oils. More deoxygenation of the lignin generated higher yield of oil. The deoxygenation of the lignin is a critical step in order to prevent condensation reactions leading to the formation of char.
| # | Oil (g per 100 g of oil)/[g per 100 g of lignin] | Char (g per 100 g of char)/[g per 100 g of lignin] | |||||||
|---|---|---|---|---|---|---|---|---|---|
| C | H | N | O | C | H | N | O | ||
| a See to Table 1 for experimental conditions; values in g per 100 g of oil and [g per 100 g of lignin] were shown. | |||||||||
| 1 | N2-35 bara | 61.0 [22.6] | 6.7 [2.5] | 3.3 [1.2] | 29.0 [10.7] | 77.0 [25.8] | 5.2 [1.7] | 3.0 [1.0] | 14.8 [5.0] |
| 2 | CO-10 bar | 66.5 [32.3] | 7.3 [3.5] | 2.9 [1.4] | 23.2 [11.3] | 79.1 [14.5] | 5.8 [1.1] | 3.0 [0.5] | 12.1 [2.2] |
| 3 | CO-20 bar | 68.6 [38.8] | 7.4 [4.2] | 3.1 [1.8] | 20.9 [11.8] | 79.3 [8.4] | 5.8 [0.6] | 3.0 [0.3] | 11.9 [1.3] |
| 4 | CO-35 bar | 69.3 [43.7] | 7.4 [4.7] | 3.1 [2.0] | 20.2 [12.7] | 79.3 [4.5] | 6.6 [0.4] | 2.8 [0.2] | 11.2 [0.6] |
| 5 | H2-30 bar | 62.6 [27.4] | 6.6 [2.9] | 3.1 [1.4] | 28.3 [12.4] | 74.8 [21.1] | 5.3 [1.5] | 2.7 [0.8] | 17.3 [4.9] |
| 6 | FA/W | 71.2 [49.1] | 8.0 [5.5] | 2.7 [1.9] | 18.2 [12.6] | 70.9 [0.9] | 6.1 [0.1] | 2.3 [0.1] | 20.7 [0.2] |
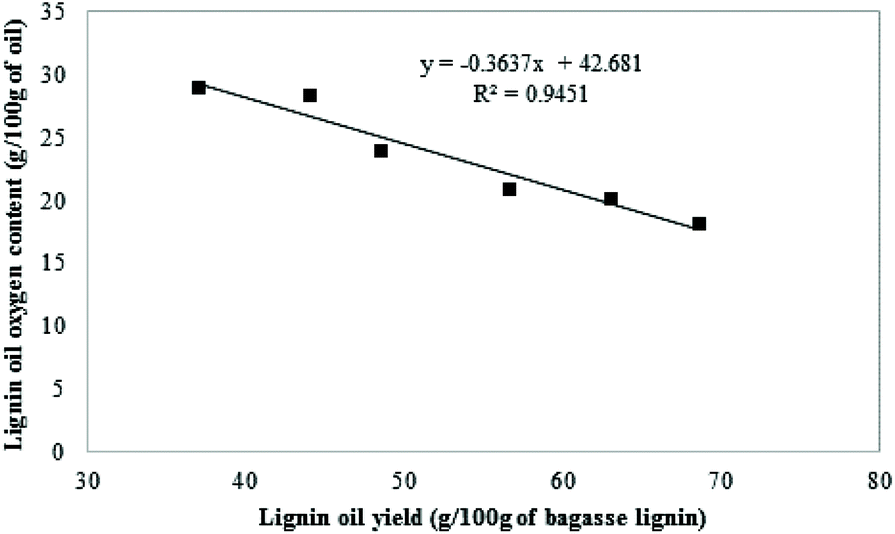 | ||
| Fig. 8 Correlation between the oxygen content and the yield of the oil. | ||
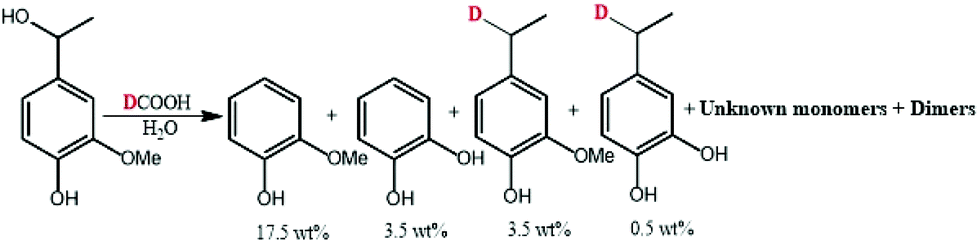 | ||
| Scheme 2 Transfer hydrogenation of alpha-methyl vanillyl alcohol with formic acid-d [300 °C, 10 min]. | ||
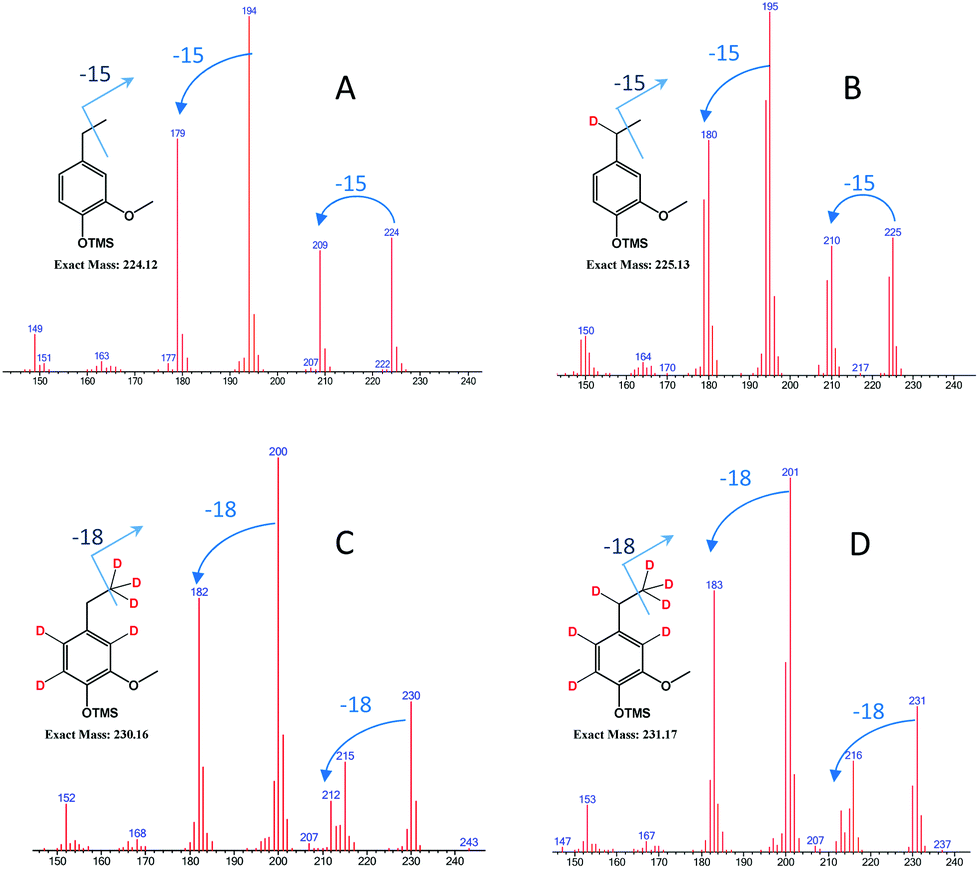 | ||
| Fig. 9 GCMS spectrum of deuterated ethylguaiacols obtained from different conditions [experimental conditions: (A) FA/H2O; (B) d-FA/H2O; (C) FA/D2O; (D) d-FA/D2O]. | ||
As illustrated in Fig. 9, the mass spectrum of ethylguaiacol suggests the incorporation of one deuterium to the benzylic position when the α-methylvanillyl alcohol was reacted with d-FA. In the presence of D2O (Fig. 9C & D), the molecular mass of the ethylguaiacol increased to 230 g mol−1 and 231 g mol−1 without and with the presence of d-FA, respectively. As reported in a previous study, the incorporation of deuterium on the β-carbon of the alkyl chain, and on the aromatic rings, was attributed to the H/D exchange of D2O in subcritical conditions.38 The H/D exchange at the β-carbon position of the side chain is thought to proceed via a vinylguaiacol intermediate as shown in Fig. S.2.† The H/D exchange of the three protons on the β-carbon was confirmed by the loss of m/z 18 from the ethylguaiacol fragmentation (Fig. 9). However, the low electron density of the benzylic position could explain the absence of H/D exchange at this position. When comparing the cracking pattern of the product obtained from the reaction with d-FA and H2O (B) to the pattern from d-FA and D2O (D), the loss of 15 m/z (Fig. 9B) instead of 18 m/z (Fig. 9D) confirmed the absence of deuterium incorporation at the beta carbon position of the alkyl chain under d-FA H2O conditions (B). Ergo, in case (B) the deuterium has to be incorporated at the alpha position. Therefore, the incorporation of deuterium on the benzylic position can only be attributed to the transfer hydrogenation of the deuterated formic acid (DCOOH). Under these conditions, the mass spectrum also showed the presence of ethylguaiacol (m/z = 224) without deuterium incorporation (Fig. 9B). The reduction of the α-methylvanillyl alcohol to ethylguaiacol does not necessarily require the presence of FA suggesting that other hydride sources can be involved in the reductive reaction. Indeed, in the blank system (i.e. no FA), the production of ethylguaiacol was observed and could be explained by the transfer hydrogenation of the α-methylvanillyl alcohol in order to generate acetoguaiacol and ethylguaiacol. Another reason for the production of ethylguaiacol under blank conditions could be due to the involvement of acetaldehyde. The production of acetaldehyde could be attributed to the retro aldol reaction leading to the generation of guaiacol, which has been observed as the main product here. Even if the role of acetaldehyde in the reduction has not been clearly identified, previous authors reported that the disproportionation of acetaldehyde can generate carbon monoxide.39 The carbon monoxide could then react with water to produce an active reducing reagent. Acetaldehyde could also be a precursor to a hydride reagent and indirectly reduce the α-methylvanillic alcohol to ethylguaiacol.
The benzylic position of the lignin is well-known for being one of the main lignin positions where condensation can occur. The reduction of the benzylic hydroxyl via transfer hydrogenation will limit condensation reactions. Further evidence of the importance of the benzylic position and oxygen in condensation reactions comes from research on the production of synthetic pitches from coal tar derived anthracene oil.31,40,41 In that work anthracene oil was air blown at 280–300 C in the presence of an iron chloride catalyst. It was found that the incorporation of oxygen groups into aromatic side chains of the anthracene oil molecules was important for improving the yield of higher mass compounds (500 to >3000 amu) compared to nitrogen blown conditions. It was determined that oxygen plays an important role in enhancing condensation reactions between small polyaromatic hydrocarbons. Lignin condensation reactions could be limited in the presence of FA via the reduction of benzylic hydroxyl groups via transfer hydrogenation.
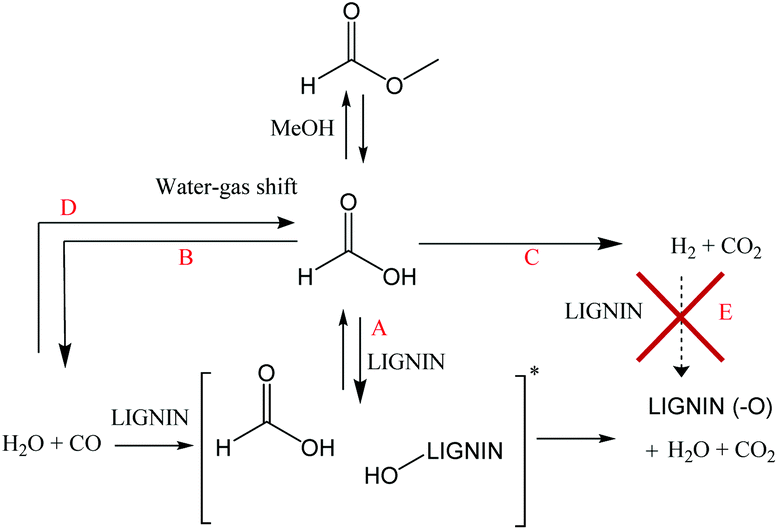 | ||
| Fig. 10 Posited mechanism for the deoxygenation of lignin using formate or CO [*hypothetical interaction between CO, water and lignin]. | ||
It is clear that the presence of formate or CO alone helped to limit char formation. Even if the CO conditions minimized the char formation, better results were achieved when using formate/water. In the presence of formate, the higher deoxygenation of the oil at early stages of the reaction may be the key to the minimization of the condensation reactions which lead to char formation. In the present study, FA was shown to be quickly consumed during early stages of the reaction. Nearly all the FA/MF was reacted or decomposed before the reaction temperature reached 300 °C. At high lignin loading, a significant partial pressure of carbon monoxide (relative to 21 bar-g of cold pressure) was generated from MF/FA decomposition once the reaction temperature reached 300 °C. This high CO partial pressure combined with an aqueous media limited condensation reactions between lignin fragments (Table 5, entries 3–5). Also, even if the partial pressure of CO (cold pressure) was reduced to 14 bar-g after 6 h of reaction, it was still high enough to prevent significant carbonization of the lignin (less than 2% char). However, in the non-aqueous system, the presence of carbon monoxide was not useful due to the absence of water and did not prevent the formation of char as illustrated by the MF/MeOH results. The possibility of using carbon monoxide in an aqueous media as a transfer hydrogenation reagent is a promising way to reduce the FA loading and to improve the environmental credentials (by using water instead of an organic solvent) and the economics of the process. On the other hand, conversion of carbon monoxide to active formate (FA) is slow which is less desirable. As previously reported, activation of the carbon monoxide with a promoter like sodium formate or sodium carbonate led to a better oil yield and less char formation.23,36 However, the addition of promoter will also increase the water–gas-shift type reaction and generate unreactive hydrogen.
It is interesting to note that the conversion of the FA to hydrogen, under the conditions outlined above, could be classified as a parasitic reaction. In other words, carbon monoxide which is usually poisonous for metal catalysts appears to be the main contributor to the depolymerization of lignin and limits char formation under non-catalytic conditions.
Experimental
Materials
All chemicals were reagent grade and purchased from Sigma-Aldrich (St Louis, MO), unless otherwise noted. Bagasse lignin cake was obtained from the saccharification residue of the diluted acid pretreated sugarcane bagasse. On a dry basis, the lignin cake is composed of 35.7 wt% of Klason lignin, 39.5 wt% of glucan, 4.9 wt% of xylan and 1.6 wt% of ash. Hydrogen (UHP300), nitrogen (UHP300) were supplied from Airgas (Ragnor, PA) and carbon monoxide (99.5%) from Praxair (Danbury, CT). Dimethylsulfoxide-d6 was purchased from Cambridge Isotope Lab (Tewksbury, MA).Alkaline extraction of the saccharification residue
Due to the low lignin purity of the sugarcane bagasse saccharification residue, alkaline extraction of the lignin was performed. Wet lignin cake (187.5 g at 40% dry matter, 75 g of dry lignin cake) was mixed with 562.5 mL of DI water and 75 mL of 5 N NaOH in 2 L autoclave glass bottle. The bottles were loosely tightened, and the alkaline mixture was autoclaved at 121 °C (15 psi) for 1 h. After reaction, the mixture was cooled down to room temperature (RT) and centrifuged. The residue was washed 3 times with 250 mL of DI water. The alkaline liquors were combined together and cooled to 7 °C. Then, the liquor (pH = 12) was acidified with 6 N HCl up to pH 2–3 to precipitate the lignin. The acidic slurry was centrifuged, and the precipitate was washed three times with 250 ml of DI water. Finally, the purified/alkaline extracted bagasse lignin was dried at 45 °C under vacuum for 3 days and gently crushed using a mortar and pestle.Bagasse lignin depolymerization

| Reference | Lignin (g) | FA or MF (g) | Water or MeOH (g) | N2 (bar-g) | Temperature (°C) | Time (min) | Working pressure (bar-g) |
|---|---|---|---|---|---|---|---|
| Reagents/solvent conditions | |||||||
| MF/water | 4.00 | 4.80 | 11.20 | 10 | 300 | 240 | 140.1 |
| MF/MeOH | 4.00 | 4.80 | 11.20 | 10 | 300 | 240 | 165.0 |
| FA/water | 4.00 | 3.68 | 12.32 | 10 | 300 | 240 | 137.3 |
| FA/MeOH | 4.00 | 3.68 | 12.32 | 10 | 300 | 240 | 160.5 |
| Reaction time conditions | |||||||
| MF/water-1 | 6.00 | 7.21 | 4.32 | 10 | 270 | n.a. | 108.7 |
| MF/water-2 | 6.00 | 7.21 | 4.32 | 10 | 285 | n.a. | 143.6 |
| MF/water-3 | 6.00 | 7.21 | 4.32 | 10 | 300 | 0 | 157.2 |
| MF/water-4 | 6.00 | 7.21 | 4.32 | 10 | 300 | 10 | 164.8 |
| MF/water-5 | 6.00 | 7.21 | 4.32 | 10 | 300 | 30 | 166.1 |
| MF/water-6 | 6.00 | 7.21 | 4.32 | 10 | 300 | 60 | 163.5 |
| MF/water-7 | 6.00 | 7.21 | 4.32 | 10 | 300 | 120 | 165.1 |
| MF/water-8 | 6.00 | 7.21 | 4.32 | 10 | 300 | 240 | 166.1 |
| MF/water-9 | 6.00 | 7.21 | 4.32 | 10 | 300 | 360 | 166.3 |
| Reference | Lignin (g) | CO (g)/CO (bar-g) | Water (g) | N2 or H2 (bar-g) | Temperature (°C) | Time (min) | Working pressure (bar-g) |
|---|---|---|---|---|---|---|---|
| Gas conditions | |||||||
| CO-blank | 0 | 3.17/35 | 15 | 0 | 300 | 240 | 121.3 |
| CO-10 bar | 4.00 | 0.92/10 | 12.00 | 25 | 300 | 240 | 135.9 |
| CO-20 bar | 4.00 | 1.83/20 | 12.00 | 15 | 300 | 240 | 134.3 |
| CO-35 bar | 4.00 | 3.17/35 | 12.00 | 0 | 300 | 240 | 136.5 |
| CO/H2 | 4.00 | 0.92/10 | 12.00 | 20 (H2) | 300 | 240 | 95.0 |
| N2 | 4.00 | 0 | 15.00 | 35 | 300 | 240 | 128.9 |
| H2 | 4.00 | 0 | 15.00 | 30 | 300 | 240 | 99.1 |
For collection of the oil, 40 ml of THF was added into the reactor to solubilize the oily fraction. The mixture was centrifuged and the residue (char) was washed twice with THF/MeOH (2/1: v/v). The oily product was recovered after solvent removal using a rotavapor (50 mbar at 35 °C) and the remaining water was co-evaporated with ethanol. The work-up procedure may involve the loss of some volatile lignin-derived products (e.g. anisole). The bulk of the “unrecovered fraction” is due to water, methanol, permanent gases and other volatile species that are lost during recovery of the oil.
The char was dried at 45 °C overnight and kept at room temperature. The oily fraction was dried in a desiccator under vacuum and stored at −20 °C.
![[thin space (1/6-em)]](https://www.rsc.org/images/entities/char_2009.gif) 150 g mol−1. It should be noted that although GPC gives a good approximation of molecular weight for comparative purposes it does not provide absolute mass values for lignin type molecules. This is because the hydrodynamic radius and molecular structures of polystyrene and lignin molecules are likely to be quite different for molecules of similar mass.48
150 g mol−1. It should be noted that although GPC gives a good approximation of molecular weight for comparative purposes it does not provide absolute mass values for lignin type molecules. This is because the hydrodynamic radius and molecular structures of polystyrene and lignin molecules are likely to be quite different for molecules of similar mass.48
Conclusion
The equilibrium system of formic acid, methyl formate and carbon monoxide in the presence of water has been evaluated, and the mechanism for the depolymerization/deoxygenation of lignin in the presence of formic acid or methyl formate at 300 °C has been elucidated. Formic acid is quickly decomposed to carbon dioxide or carbon monoxide, whilst the ratio between these two gases depends on the nature of the solvent. It was determined that hydrogenation of lignin using formic acid does not proceed via initial molecular hydrogen production, but rather via direct reaction of formic acid with lignin. This is also corroborated by the low ratio of molecular hydrogen and carbon dioxide observed.Formic acid and carbon monoxide both contribute to lignin deoxygenation. In the absence of formic acid or carbon monoxide i.e. pyrolysis conditions in nitrogen, lignin oil contains high oxygen content and is more prone to carbonization. Deoxygenation of the lignin seems to be the critical step for limiting char formation.
With respect to oil and char formation, aqueous reaction conditions reduce the amount of char formation and lead to nearly complete demethylation of the lignin methoxy groups, thereby leading to catechol type molecules in the oil. The limited amount of char formation in the presence of water was attributed to the ability of carbon monoxide to activate the water molecule proton via the formation of formate. In the presence of lignin, carbon monoxide is converted to formate via a water–gas-shift type reaction. The formate prevents condensation of the lignin fragments thereby limiting char formation and producing more lignin products in the low molecular weight range.
Regarding depolymerization efficiencies, carbon monoxide has a lower efficiency than formic acid, arising from its role as a precursor to the active reducing reagent rather than carbon monoxide being the active reducing reagent itself. Using formic acid was more efficient due to a higher hydride concentration than in the carbon monoxide/water system. It is suggested that a combined process using formic acid and carbon monoxide would reduce the formic acid loading and provide a means for improving process economics.
Conflicts of interest
There are no conflicts to declare.Acknowledgements
This work was part of the DOE Joint BioEnergy Institute (http://www.jbei.org) supported by the U.S. Department of Energy, Office of Science, Office of Biological and Environmental Research, through contract DE-AC02-05CH11231 between Lawrence Berkeley National Laboratory and the U.S. Department of Energy. The United States Government retains and the publisher, by accepting the article for publication, acknowledges that the United States Government retains a non-exclusive, paid-up, irrevocable, world-wide license to publish or reproduce the published form of this manuscript, or allow others to do so, for United States Government purposes. Total S.A. is kindly thanked for resources and support provided via the cooperative research and development agreement between LBNL and Total S.A. The authors thank Elena Kreimer for expert technical assistance.References
- V. Balan, D. Chiaramonti and S. Kumar, Biofuels, Bioprod. Biorefin., 2013, 7, 732–759 CrossRef.
- R. Rinaldi, R. Jastrzebski, M. T. Clough, J. Ralph, M. Kennema, P. C. A. Bruijnincx and B. M. Weckhuysen, Angew. Chem., Int. Ed., 2016, 55, 8164–8215 CrossRef PubMed.
- J. E. Holladay, J. J. Bozell, J. F. White and D. Johnson, Top Value-Added Chemicals from Biomass-Volume II-Results of Screening for Potential Candidates from Biorefinery Lignin, Pacific Northwest National Laboratory (PNNL), Richland, WA (US), 2007 Search PubMed.
- J. Zakzeski, P. C. A. Bruijnincx, A. L. Jongerius and B. M. Weckhuysen, Chem. Rev., 2011, 110, 3552–3599 CrossRef PubMed.
- H. Zhang, R. Xiao, B. Jin, D. Shen, R. Chen and G. Xiao, Bioresour. Technol., 2013, 137, 82–87 CrossRef PubMed.
- T. Wang, S. Qiu, Y. Weng, L. Chen, Q. Liu, J. Long, J. Tan, Q. Zhang, Q. Zhang and L. Ma, Appl. Energy, 2015, 160, 329–335 CrossRef.
- W.-C. Wang and L. Tao, Renewable Sustainable Energy Rev., 2016, 53, 801–822 CrossRef.
- D. Verma, B. S. Rana, R. Kumar, M. G. Sibi and A. K. Sinha, Appl. Catal., A, 2015, 490, 108–116 CrossRef.
- S. Van Wesenbeeck, C. Higashi, M. Legarra, L. Wang and M. J. Antal, Energy Fuels, 2016, 30, 480–491 CrossRef.
- M. J. Antal Jr. and M. Gronli, Ind. Eng. Chem. Res., 2003, 42, 1619–1640 CrossRef.
- S. Williams, C. Higashi, P. Phothisantikul, S. Van Wesenbeeck and M. J. Antal, J. Anal. Appl. Pyrolysis, 2015, 113, 225–230 CrossRef.
- J. A. Onwudili and P. T. Williams, Green Chem., 2014, 16, 4740–4748 RSC.
- F. P. Bouxin, A. McVeigh, F. Tran, N. J. Westwood, M. C. Jarvis and S. D. Jackson, Green Chem., 2015, 17, 1235–1242 RSC.
- A. L. Jongerius, P. C. A. Bruijnincx and B. M. Weckhuysen, Green Chem., 2013, 15, 3049–3056 RSC.
- A. McVeigh, F. P. Bouxin, M. C. Jarvis and S. D. Jackson, Catal. Sci. Technol., 2016, 6, 4142–4150 RSC.
- M. Oregui Bengoechea, A. Hertzberg, N. Miletić, P. L. Arias and T. Barth, J. Anal. Appl. Pyrolysis, 2015, 113, 713–722 CrossRef.
- A. Kloekhorst, Y. Shen, Y. Yie, M. Fang and H. J. Heeres, Biomass Bioenergy, 2015, 80, 147–161 CrossRef.
- U. Schuchardt, J. A. R. Rodrigues, A. Cotrim and J. L. M. Costa, Bioresour. Technol., 1993, 44, 123–129 CrossRef.
- J. A. Onwudili, Bioresour. Technol., 2015, 187, 60–69 CrossRef PubMed.
- C. Løhre, T. Barth and M. Kleinert, J. Anal. Appl. Pyrolysis, 2016, 119, 208–216 CrossRef.
- B. Holmelid, M. Kleinert and T. Barth, J. Anal. Appl. Pyrolysis, 2012, 98, 37–44 CrossRef.
- M. A. Hill Bembenic and C. E. Burgess Clifford, Energy Fuels, 2012, 26, 4540–4549 CrossRef.
- H. R. Appell, I. Wender and R. D. Miller, ACS Div. Fuel, 1969, 13, 39–44 Search PubMed.
- Y. Yasaka, K. Yoshida, C. Wakai, N. Matubayasi and M. Nakahara, J. Phys. Chem. A, 2006, 110, 11082–11090 CrossRef PubMed.
- N. Akiya and P. E. Savage, AIChE J., 1998, 44, 405–415 CrossRef.
- O. Jogunola, T. Salmi, J. Warna, J.-P. Mikkola and E. Tirronen, Ind. Eng. Chem. Res., 2011, 50, 267–276 CrossRef.
- M. Kleinert and T. Barth, Energy Fuels, 2008, 22, 1371–1379 CrossRef.
- M. Kleinert, J. R. Gasson and T. Barth, J. Anal. Appl. Pyrolysis, 2009, 85, 108–117 CrossRef.
- J. Ralph, G. Brunow and W. Boerjan, in Handbook of Plant Science, John Wiley & Sons Ltd, 2007, vol. 2, pp. 1123–1132 Search PubMed.
- A. George, T. J. Morgan and R. Kandiyoti, Energy Fuels, 2014, 28, 6918–6927 CrossRef.
- T. J. Morgan and R. Kandiyoti, Chem. Rev., 2014, 114, 1547–1607 CrossRef PubMed.
- J. S. Francisco, J. Am. Chem. Soc., 2003, 125, 10475 CrossRef PubMed.
- T. Moriyoshi, K. Sam and Y. Uosaki, High Pressure Res., 2001, 20, 491–505 CrossRef.
- G. Akgul and A. Kruse, J. Supercrit. Fluids, 2013, 73, 43–50 CrossRef.
- F. Bustamante, R. M. Enick, R. P. Killmeyer, B. H. Howard, K. S. Rothenberger, A. V. Cugini, B. D. Morreale and M. V. Ciocco, AIChE J., 2005, 51, 1440–1454 CrossRef.
- M. Siskin, G. E. Phillips and S. R. Kelemen, US8500829B2, 2013.
- I. T. Horvath and M. Siskin, Energy Fuels, 1991, 5, 932–933 CrossRef.
- M. Kubo, T. Takizawa, C. Wakai, N. Matubayasi and M. Nakahara, J. Chem. Phys., 2004, 121, 960–969 CrossRef PubMed.
- Y. Nagai, S. Morooka, N. Matubayasi and M. Nakahara, J. Phys. Chem. A, 2004, 108, 11635–11643 CrossRef.
- P. Álvarez, M. Granda, J. Sutil, R. Menendez, J. J. Fernández, J. A. Viña, T. J. Morgan, M. Millan, A. A. Herod and R. Kandiyoti, Energy Fuels, 2008, 22, 4077–4086 CrossRef.
- J. Bermejo, A. L. Fernández, M. Granda, F. Rubiera, I. Suelves and R. Menéndez, Fuel, 2001, 80, 1229–1238 CrossRef.
- M. Siskin and A. R. Katritzky, Chem. Rev., 2001, 101, 825–836 CrossRef PubMed.
- J. S. Francisco, J. Chem. Phys., 1992, 96, 1167–1175 CrossRef.
- H. Kim, J. Ralph and T. Akiyama, Bioenergy Res., 2008, 1, 56–66 CrossRef.
- N. Sathitsuksanoh, K. M. Holtman, D. J. Yelle, T. Morgan, V. Stavila, J. Pelton, H. Blanch, B. A. Simmons and A. George, Green Chem., 2014, 16, 1236–1247 RSC.
- H. E. Gottlieb, V. Kotlyar and A. Nudelman, J. Org. Chem., 1997, 62, 7512–7515 CrossRef PubMed.
- J. Rencoret, A. Gutierrez, L. Nieto, J. Jimenez-Barbero, C. B. Faulds, H. Kim, J. Ralph, A. T. Martinez and J. C. del Rio, Plant Physiol., 2011, 155, 667–682 CrossRef PubMed.
- R. Kandiyoti, A. Herod, K. Bartle and T. Morgan, in Solid Fuels and Heavy Hydrocarbon Liquids, Elsevier, 2nd edn, 2017, pp. 343–436, DOI:10.1016/B978-0-08-100784-6.00008-4.
Footnote |
| † Electronic supplementary information (ESI) available. See DOI: 10.1039/c7gc03239k |
| This journal is © The Royal Society of Chemistry 2018 |