Template-free synthesis of interconnected carbon nanosheets via cross-linking coupled with annealing for high-efficiency triiodide reduction†
Mingyu
Li
a,
Chang
Yu
*a,
Chao
Hu
b,
Changtai
Zhao
a,
Mengdi
Zhang
a,
Yiwang
Ding
a,
Xiuna
Wang
a and
Jieshan
Qiu
 *a
*a
aState Key Lab of Fine Chemicals, School of Chemical Engineering, Liaoning Key Lab for Energy Materials and Chemical Engineering, Dalian University of Technology, Dalian 116024, China. E-mail: chang.yu@dlut.edu.cn; jqiu@dlut.edu.cn; Tel: +86-411-84986080
bSchool of Chemical Engineering and Technology, Xi'an Jiaotong University, Xi'an, 710049, China
First published on 21st November 2017
Abstract
Counter electrodes (CEs) play critical roles in the reduction and regeneration of triiodide/iodide redox couple in dye-sensitized solar cells (DSSCs). Compared to commercial Pt, cost-efficient CEs with excellent electrocatalytic activity and superior electrochemical stability are highly desired. Herein, we report a facile, template- and active agents-free fabrication strategy for the synthesis of carbon nanosheets (CNSs) via annealing of small molecular precursors. This process was achieved by a combined strategy, including a low-temperature solid-phase cross-linking reaction and a subsequent high temperature annealing. When employed as metal-free CEs for DSSCs, the as-obtained CNSs demonstrated an annealing temperature-dependent electrochemical behavior. Owing to the superior electrical conductivity and electrocatalytic activity, the CNSs obtained by annealing at 1200 °C exhibit the best electrochemical performance with a power conversion efficiency of 8.71%, which is superior to that of Pt CE (7.24%), thus being attractive alternatives to precious metal Pt CEs. This study presents a simple and effective strategy to configure nanostructured carbonaceous materials for high-performance energy storage and conversion.
Introduction
State-of-the-art dye-sensitized solar cells (DSSCs), as a type of the third-generation solar cells, have been explored over the past two decades due to their huge advantages in terms of high power conversion efficiency (PCE) and low cost.1–4 As for a typical DSSCs device, counter electrode (CE) is one of the crucial components for transferring electrons from external circuit to triiodide (I3−) and catalyzing I3− reduction. Nevertheless, the large-scale utilization of the traditional Pt CE restricts the practical application for DSSCs due to their high cost and limited abundance together with their poor stability under electrochemical conditions.5–8 Thus, the exploration of highly effective and electrochemically stable Pt-free CE material is of great significance to realize the large-scale application of economically viable DSSCs.9,10Suitable alternatives such as carbonaceous materials, conductive polymers and transition metal compounds, have been used as CEs in DSSCs.11 Among these candidates, the conventional carbonaceous materials as metal-free CEs have shown a unique superiority owing to their high surface area, high electrical conductivity and low cost in terms of green chemistry and sustainability.12–14 The template-assisted synthetic strategy is an efficient method to fabricate such carbonaceous nanomaterials with a controlled morphology and nonaggregated structure. Moreover, KOH activation is a general and acceptable method to increase the defects in carbonaceous nanomaterials. However, the addition and removal of the template and the used alkali are time-consuming, environmentally unfriendly and expensive.15,16 As such, it is challenging and imperative to explore a novel, template- and active agents-free approach for the synthesis of highly electrochemically active carbonaceous material as CEs in DSSCs.
Herein, for the first time, we report a facile, green and template-free strategy for the synthesis of interconnected carbon nanosheets (CNSs) via low-temperature cross-linking coupled with high temperature annealing of urea and sodium citrate. In particular, the abundant defects and active sites are also generated within the carbon matrix by in situ activation of the gases produced by the intermediate decomposition. When applied as CEs for DSSCs, the as-prepared porous CNSs exhibit an annealing temperature-dependent electrochemical behavior. The sample obtained by annealing at 1200 °C delivers a high PCE of 8.71% as CEs, which is attributed to the superior electrical conductivity and electrocatalytic activity of the nanosheets, outperforming the Pt CE (7.24%).
Experimental
Preparation of CNSs
Initially, 7.2 g of urea and 5.16 g of sodium citrate were mixed and grounded to a uniform powder, and then kept at 180 °C for 2 h in a drying oven. The resultant mixture was annealed at different temperatures with a temperature ramp of 5 °C min−1 for 2 h in a flowing Ar atmosphere. The obtained products were then treated with 1 M hydrochloric acid, washed with deionized water and dried at 80 °C overnight in a vacuum drying oven. Thus, a series of CNS samples were obtained and denoted as CNS-T, where T represents the annealing temperature.Fabrication of various CEs
The as-prepared samples (CNS-1000, CNS-1200 and CNS-1400) and carboxyethyl cellulose solution were mixed together to form a slurry through a grinding process. Then, the slurry was transferred onto a fluorine-doped tin oxide (FTO) glass through a doctor-blade method, followed by calcination with a temperature ramp of 5 °C min−1 at 500 °C for 30 min in a flowing N2 atmosphere and consequently yielding the CEs.Assembly of DSSCs
The dye-coated TiO2 photoanode was prepared by immersing TiO2 films into N719 dye with a concentration of 5 × 10⁻⁴ M (Solaronix SA, Switzerland) in anhydrous ethanol solution overnight. The dye-loaded TiO2 photoanode and the CEs were assembled through a hot-pressing process using a Surlyn film as a separator. Then, the OPV-AN-I type electrolyte was injected into the DSSCs through the pre-designed hole on the FTO glass.Characterization
Field-emission scanning electron microscopy (FESEM) and transmission electron microscopy (TEM) images were recorded on FEI NOVA NanoSEM 450 and Philips Tecnai G220, respectively. X-ray diffraction (XRD) patterns were examined on an X-ray diffractometer (Cu Kα, λ = 1.5406 Å). Raman measurements were conducted on a Thermo Fisher Scientific DXR Raman Microscope at 532 nm excitation. The Fourier transform infrared (FTIR) spectra were scanned on a Bruker EQUINOX 55. The thermogravimetric analysis (TGA) was performed on TG instrument (NETZSCH STA449F3) in a nitrogen flow with a temperature ramp of 10 °C min−1 to 800 °C.Electrochemical testing
Cyclic voltammetry (CV) measurements were performed in a three-electrode system at a scan rate of 50 mV s−1 using an acetonitrile solution containing 1 mM I2, 10 mM LiI and 0.1 M LiClO4 as the electrolyte, the as-prepared CE as the working electrode, a Pt wire as the counter electrode and an Ag/Ag+ electrode as the reference electrode. The electrochemical impedance spectroscopy (EIS) and Tafel polarization were also measured, and the dummy cells were assembled by two symmetrical CEs injected with the OPV-AN-I type electrolyte. The EIS spectra and Tafel curves were recorded by Multichannel Potentiostats (VSP, Bio-Logic, France). The photocurrent density–voltage (J–V) curves were characterized by a Keithley 2400 source meter under 100 mW cm−2 and AM 1.5 G.Results and discussion
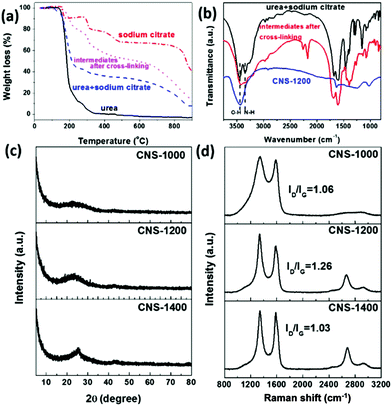
The interconnected porous CNSs were prepared by a combined procedure. In brief, urea and sodium citrate were first cross-linked at 180 °C, and then annealed at different temperatures in a flowing Ar atmosphere. After the removal of the inorganic intermediate products by acid washing, the CNSs were obtained. To obtain an insight into the possible mechanism involved in the process, the thermal decomposition behaviors for small molecular precursors and intermediates after cross-linking were analysed by TGA. It is clearly observed that compared with the urea and sodium citrate mixture, the weight loss for precursors after cross-linking decreases (Fig. 1a), indicating that the introduction of urea can help to enhance the thermal stability of the precursors and cross-linking process could occur. This can also further promote the formation of the active defects within carbon matrix due to the NH3 etching effect.17 With this information, it could be inferred that urea as an active molecule was first decomposed to generate the NH3 species, further promoting the decomposition of sodium citrate and the interaction of both parts in the cross-linking reaction to some degree. In addition, TGA curves of urea and sodium citrate were also recorded and are shown in Fig. 1a. In the case of urea, the weight loss reaches 100% when the temperature is higher than 400 °C. In case of sodium citrate, multi-steps can be observed, of which the first weight loss at ca. 155 °C is caused by the removal of crystal water. Subsequently, the second visible weight loss at ca. 230–260 °C represents the decomposition of sodium citrate. Then, the third weight loss region in the range of 380–500 °C is attributed to the conversion of the generated small molecules to carbonaceous species. Finally, the last visible weight loss is ascribed to partial decomposition of the inorganic intermediate products, such as Na2CO3 and NaHCO3.18Moreover, the weight loss is accompanied by the removal of the functional groups, which was confirmed by FTIR spectra (Fig. 1b). It can be noted that after cross-linking, the peak at ca. 3340 cm−1, corresponding to the stretching vibration of N–H, partially disappears compared with the raw mixture. The disappearance of the peak is related to the partial decomposition of urea, which could further promote the interaction of urea and the sodium citrate in the cross-linking reaction. Moreover, the two new peaks at ca. 2300 cm−1 and 2100 cm−1 are assigned to the vibration of C![[triple bond, length as m-dash]](https://www.rsc.org/images/entities/char_e002.gif) N and C
N and C![[triple bond, length as m-dash]](https://www.rsc.org/images/entities/char_e002.gif) C, respectively. These combined results present the interaction between urea and sodium citrate derived from the cross-linking. After annealing, the peaks assigned to N–H, C
C, respectively. These combined results present the interaction between urea and sodium citrate derived from the cross-linking. After annealing, the peaks assigned to N–H, C![[triple bond, length as m-dash]](https://www.rsc.org/images/entities/char_e002.gif) N, C
N, C![[triple bond, length as m-dash]](https://www.rsc.org/images/entities/char_e002.gif) C and other functional groups below ca. 1500 cm−1 almost disappear. These results are in agreement with those of elemental analysis (Table S1†). Specifically, the carbon content increases from 83.75 wt% to 94.55 wt% when the annealing temperature varies from 1000 °C to 1400 °C. In addition, the XRD patterns shown in Fig. S1† further demonstrate the formation of inorganic intermediate products, such as Na2CO3 and NaHCO3 during the annealing process. When the annealing temperature reaches 1200 °C, characteristic peaks of the intermediate products disappear, indicating the complete decomposition of intermediates. The as-obtained CNSs also exhibit an annealing temperature-dependent crystallinity behavior with the enhancement of the graphite (002) peak (Fig. 1c).
C and other functional groups below ca. 1500 cm−1 almost disappear. These results are in agreement with those of elemental analysis (Table S1†). Specifically, the carbon content increases from 83.75 wt% to 94.55 wt% when the annealing temperature varies from 1000 °C to 1400 °C. In addition, the XRD patterns shown in Fig. S1† further demonstrate the formation of inorganic intermediate products, such as Na2CO3 and NaHCO3 during the annealing process. When the annealing temperature reaches 1200 °C, characteristic peaks of the intermediate products disappear, indicating the complete decomposition of intermediates. The as-obtained CNSs also exhibit an annealing temperature-dependent crystallinity behavior with the enhancement of the graphite (002) peak (Fig. 1c).
The surface defect states of the CNSs were further characterized by Raman spectroscopy, of which the measured results are shown in Fig. 1d. After the annealing process, two peaks at ca. 1360 cm−1 (D band) and 1580 cm−1 (G band) are produced. When the annealing temperature reaches 1200 °C, a peak corresponding to 2D band further appears, indicative of the graphene-like structure. The ID/IG values of CNS-1000 and CNS-1400 are clearly lower than that of CNS-1200 (1.26), indicative of the increased defects in CNS-1200.
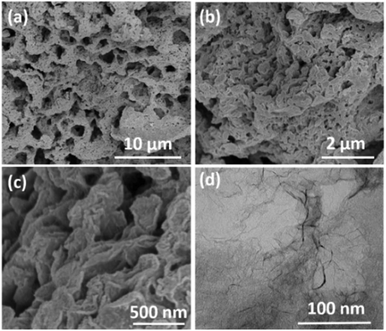
The typical FESEM images of the as-prepared CNS-1200 are shown in Fig. 2a–c, indicative of an interconnected and hierarchical microstructure configured by numerous large-area carbon nanosheets without aggregation. The unique porous sheet-shaped structure was further confirmed by the TEM image shown in Fig. 2d. The corresponding energy dispersive X-ray spectra (Fig. S2†) demonstrate the uniform distribution of C, N and O elements. The microstructure and morphology changes of the CNSs were also explored with annealing temperature ranging from 1000 °C to 1400 °C (Fig. 2 and Fig. S3†). With an increase of the annealing temperature, the smooth surface gradually becomes rough, which could be attributed to the partial decomposition of sodium citrate and the formation of inorganic intermediates. In particular, the slightly small-sized nanosheets are present due to the activation and etching function of the gases produced by the complete decomposition of intermediates at 1200 °C. When the annealing temperature reaches 1400 °C, the sheet structure is collapsed and destroyed to some degree due to the enhanced harsh conditions, indicating the morphological destruction derived from high temperature annealing. The morphology differences are also in accordance with the results of XRD patterns and Raman mentioned above.
 | ||
| Fig. 2 (a–c) FESEM images of the as-prepared CNS-1200 with different magnifications. (d) TEM image of the as-prepared CNS-1200. | ||
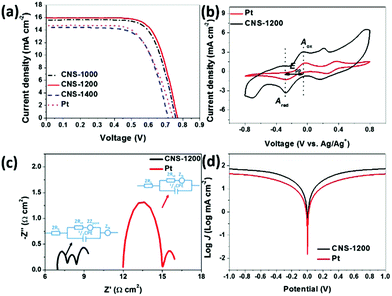
The photovoltaic performance of as-prepared samples was measured as CEs for DSSCs. As illustrated in Table 1 and Fig. 3a, the short-circuit photocurrent density (Jsc) and open-circuit voltage (Voc) of CNS-1200 are 15.94 mA cm−2 and 0.77 V, respectively, which are clearly superior to those of the Pt reference as well as the CNS-1000 and CNS-1400 samples. This indicates that the as-prepared CNS-1200 has the highest electrocatalytic performance towards the I3− reduction. As a result, the CNS-1200 exhibits the highest PCE of 8.71% than that of CNS-1000 (8.38%) and CNS-1400 (6.98%), which is comparable to that of other reported CEs in the literature (Table S2†). The superior electrochemical activity is also verified by CV curves (Fig. 3b and Fig. S4†). It is noted that a couple of oxidation and reduction peaks (Aox/Ared and Box/Bred) could be clearly observed in all the samples, corresponding to oxidation and reduction of I3−/I− and I2/I3−, respectively.19,20 The CNS-1200 has a smaller Epp value (0.22 V) and higher Ared peak current density (−3.37 mA cm−2) than those of commercial Pt (0.25 V, −1.34 mA cm−2), CNS-1000 (0.23 V, −2.99 mA cm−2) and CNS-1400 (0.23 V, −2.58 mA cm−2), suggesting that the CNS-1200 features more electrocatalytic active sites towards I3− reduction.
| Samples | V oc (V) | J sc (mA cm−2) | FF (%) | PCE (%) |
|---|---|---|---|---|
| CNS-1000 | 0.76 ± 0.01 | 15.40 ± 0.26 | 71.27 ± 0.39 | 8.38 ± 0.02 |
| CNS-1200 | 0.77 ± 0.01 | 15.94 ± 0.18 | 71.03 ± 0.19 | 8.71 ± 0.11 |
| CNS-1400 | 0.72 ± 0.01 | 14.43 ± 0.16 | 67.74 ± 0.14 | 6.98 ± 0.06 |
| Pt | 0.75 ± 0.01 | 15.51 ± 0.03 | 70.98 ± 5.71 | 7.24 ± 0.06 |
The EIS measurements were performed to reflect the electrochemical characteristics and the results are summarized in Fig. 3c and Table S3.† Three semicircles are present in the Nyquist plot of CNS-1200, which match with the Nernst diffusion resistance in pores (Zpore), charge-transfer resistance (Rct) at the electrode/electrolyte interface and Nernst diffusion impedance (ZN) derived from mass transport limitation in the electrolyte.14 Moreover, the high-frequency intercept on real axis determines the serial resistance (Rs). In contrast, Zpore is absent in commercial Pt.21,22 It should be noted that the Rct (0.35 Ω cm2) and Rs (3.48 Ω cm2) of CNS-1200 are both smaller than those of Pt CEs (Rct = 1.52 Ω cm2, Rs = 6.00 Ω cm2), revealing the superior electrocatalytic activity of CNS-1200.23–25 Furthermore, a large exchange current density (J0) and slope for the cathodic or anodic branch in polarization zone of the Tafel polarization curves are delivered for the as-prepared CNS-1200 (Fig. 3d). High J0 corresponds to low Rct, which is consistent with the EIS results mentioned above.26–29 In conclusion, the as-prepared CNS-1200 achieves a small Epp value, high Ared peak current density, low resistance value and better electrochemical activity, indicating that the CNS-1200 possesses great potential for Pt replacement.
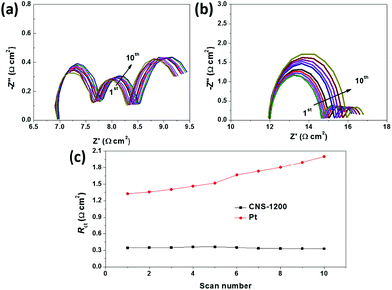
The electrochemical stability of the CEs is another important issue for practical implementation of DSSCs, and it is primarily dependent on Rct in principle. In this case, freshly assembled identical dummy cells were subjected to repeated EIS measurements, of which the results are shown in Fig. 4. It could be observed in Fig. 4a and c that Rs, Rct and ZN values for CNS-1200 dummy cells undergo negligible changes after 10 cycles, indicative of a relatively high electrochemical stability. In contrast, the Rct of Pt CEs increases dramatically with the increase in cycling number, indicative of their low electrochemical stability (Fig. 4b and c).30 As a result, the CNS-1200 CEs with a prominently enhanced I3− reduction activity and the outstanding electrochemical stability show great potential for replacing noble metal Pt as a CE material for commercial application of DSSCs.
 | ||
| Fig. 4 Electrochemical stability of identical dummy cells with (a) CNS-1200 and (b) Pt CEs in acetonitrile solution of I3−/I−. (c) Rct changes versus the EIS scan numbers for CNS-1200 and Pt CEs. | ||
Conclusions
In conclusion, the CNSs were synthesized using small molecules as precursors via a bottom-up template-free strategy. Benefiting from the superior electrical conductivity and electrocatalytic activity, the two dimensional CNS-1200 as metal-free CEs exhibits the best electrochemical performance with a high power conversion efficiency of 8.71%. The present study provides a green approach for synthesis of carbonaceous materials from small molecular precursors. In addition, it is also capable of meeting the requirements for the practical application of sustainable and environmentally friendly DSSCs to some degree.Conflicts of interest
There are no conflicts of interest to declare.Acknowledgements
This work was partly supported by the National Natural Science Foundation of China (No. 21522601, U1508201), and the National Key Research Development Program of China (2016YFD0200502).Notes and references
- M. Grätzel, Nature, 2001, 414, 338–344 CrossRef PubMed.
- B. Oregan and M. Grätzel, Nature, 1991, 353, 737–740 CrossRef CAS.
- L. Kavan, J. H. Yum and M. Grätzel, ACS Nano, 2011, 5, 165–172 CrossRef CAS PubMed.
- M. X. Wu, X. Lin, Y. D. Wang, L. Wang, W. Guo, D. D. Qu, X. J. Peng, A. Hagfeldt, M. Grätzel and T. L. Ma, J. Am. Chem. Soc., 2012, 134, 3419–3428 CrossRef CAS PubMed.
- J. Wan, G. Fang, H. Yin, X. Liu, D. Liu, M. Zhao, W. Ke, H. Tao and Z. Tang, Adv. Mater., 2014, 26, 8101–8106 CrossRef CAS PubMed.
- C. Yu, X. Meng, X. Song, S. Liang, Q. Dong, G. Wang, C. Hao, X. Yang, T. Ma, P. M. Ajayan and J. Qiu, Carbon, 2016, 100, 474–483 CrossRef CAS.
- C. Yu, H. Fang, Z. Liu, H. Hu, X. Meng and J. Qiu, Nano Energy, 2016, 25, 184–192 CrossRef.
- X. Meng, C. Yu, B. Lu, J. Yang and J. Qiu, Nano Energy, 2016, 22, 59–69 CrossRef CAS.
- X. Chen, Q. Tang, B. He, L. Lin and L. Yu, Angew. Chem., Int. Ed., 2014, 126, 10975–10979 CrossRef.
- Y. Duan, Q. Tang, J. Liu, B. He and L. Yu, Angew. Chem., Int. Ed., 2014, 53, 14569–14574 CrossRef CAS PubMed.
- S. Yun, A. Hagfeldt and T. Ma, Adv. Mater., 2014, 26, 6210–6237 CrossRef CAS PubMed.
- L. J. Brennan, M. T. Byrne, M. Bari and Y. K. Gun'ko, Adv. Energy Mater., 2011, 1, 472–485 CrossRef CAS.
- L. Wang, Y. Shi, X. Bai, Y. Xing, H. Zhang, L. Wang, W. Guo, N. Wang, T. Ma and M. Grätzel, Energy Environ. Sci., 2014, 7, 343–346 CAS.
- C.-L. Wang, J.-Y. Liao, S.-H. Chung and A. Manthiram, Adv. Energy Mater., 2015, 5, 1401524 CrossRef.
- Z. Fan, Y. Liu, J. Yan, G. Ning, Q. Wang, T. Wei, L. Zhi and F. Wei, Adv. Energy Mater., 2012, 2, 419–424 CrossRef CAS.
- X. Fan, C. Yu, J. Yang, Z. Ling, C. Hu, M. Zhang and J. Qiu, Adv. Energy Mater., 2015, 5, 1401761 CrossRef.
- M. Hu, L. Yang, K. Zhou, C. Zhou, Z.-H. Huang, F. Kang and R. Lv, Carbon, 2017, 122, 680–686 CrossRef CAS.
- W. Yang, W. Yang, F. Ding, L. Sang, Z. Ma and G. Shao, Carbon, 2017, 111, 419–427 CrossRef CAS.
- F. Gong, H. Wang, X. Xu, G. Zhou and Z.-S. Wang, J. Am. Chem. Soc., 2012, 134, 10953–10958 CrossRef CAS PubMed.
- X. Zheng, J. Deng, N. Wang, D. Deng, W.-H. Zhang, X. Bao and C. Li, Angew. Chem., Int. Ed., 2014, 53, 7023–7027 CrossRef CAS PubMed.
- L. Kavan, J.-H. Yum, M. K. Nazeeruddin and M. Grätzel, ACS Nano, 2011, 5, 9171–9178 CrossRef CAS PubMed.
- L. Kavan, J.-H. Yum and M. Grätzel, Nano Lett., 2011, 11, 5501–5506 CrossRef CAS PubMed.
- D. J. Kim, J. K. Koh, C. S. Lee and J. H. Kim, Adv. Energy Mater., 2014, 4, 1400414 CrossRef.
- H. Tian, X. Jiang, Z. Yu, L. Kloo, A. Hagfeldt and L. Sun, Angew. Chem., Int. Ed., 2010, 49, 7328–7331 CrossRef CAS PubMed.
- M. Wang, A. M. Anghel, B. Marsan, N.-L. C. Ha, N. Pootrakulchote, S. M. Zakeeruddin and M. Grätzel, J. Am. Chem. Soc., 2009, 131, 15976–15977 CrossRef CAS PubMed.
- W. Sun, T. Peng, Y. Liu, N. Huang, S. Guo and X. Zhao, Carbon, 2014, 77, 18–24 CrossRef CAS.
- S. M. Zakeeruddin and M. Grätzel, Adv. Funct. Mater., 2009, 19, 2187–2202 CrossRef CAS.
- S. Das, P. Sudhagar, V. Verma, D. Song, E. Ito, S. Y. Lee, Y. S. Kang and W. Choi, Adv. Funct. Mater., 2011, 21, 3729–3736 CrossRef CAS.
- H. C. Sun, D. Qin, S. Q. Huang, X. Z. Guo, D. M. Li, Y. H. Luo and Q. B. Meng, Energy Environ. Sci., 2011, 4, 2630–2637 CAS.
- X. Meng, C. Yu, X. Song, Y. Liu, S. Liang, Z. Liu, C. Hao and J. Qiu, Adv. Energy Mater., 2015, 5, 1500180 CrossRef.
Footnote |
| † Electronic supplementary information (ESI) available: FESEM images, EDS mapping, XRD patterns, elemental analysis and electrochemical performance. See DOI: 10.1039/c7gc02701j |
| This journal is © The Royal Society of Chemistry 2018 |


