 Open Access Article
Deoxycholic acid disrupts the intestinal mucosal barrier and promotes intestinal tumorigenesis
Li
Liu†
a,
Wenxiao
Dong†
 a,
Sinan
Wang
a,
Yujie
Zhang
b,
Tianyu
Liu
a,
Runxiang
Xie
a,
Bangmao
Wang
a and
Hailong
Cao
a,
Sinan
Wang
a,
Yujie
Zhang
b,
Tianyu
Liu
a,
Runxiang
Xie
a,
Bangmao
Wang
a and
Hailong
Cao
 *a
*a
aDepartment of Gastroenterology and Hepatology, General Hospital, Tianjin Medical University, 300052, Tianjin, China. E-mail: caohailong@tmu.edu.cn
bDepartment of Pathology, General Hospital, Tianjin Medical University, 300052, Tianjin, China
First published on 19th October 2018
Abstract
High-fat diet, which leads to an increased level of deoxycholic acid (DCA) in the intestine, is a major environmental factor in the development of colorectal cancer (CRC). However, evidence relating to bile acids and intestinal tumorigenesis remains unclear. In this study, we investigated the effects of DCA on the intestinal mucosal barrier and its impact on the development of CRC. Here we showed that DCA disrupted cell monolayer integrity and increased proinflammatory cytokine production in intestinal cancer and precancerous cell lines (Caco-2 and IMCE). Apcmin/+ mice receiving DCA increased the number and size of intestinal adenomas and promoted the adenoma–adenocarcinoma sequence. Importantly, DCA induced the activation of the NLRP3 inflammasome, increased the production of inflammatory cytokines, and led to intestinal low grade inflammation. A reduction of tight junction protein zonula occludens 1 (ZO-1) and the number of intestinal cells including goblet cells and Paneth cells was also observed after DCA treatment. Moreover, DCA significantly reduced the level of secretory immunoglobulin A (sIgA), and promoted the polarization of M2 macrophages in the intestine of Apcmin/+ mice. In conclusion, these data suggested that DCA induced intestinal low grade inflammation and disrupted the mucosal physical and functional barriers, aggravating intestinal tumorigenesis.
1. Introduction
Colorectal cancer (CRC) is the third most common cancer and the fourth leading cause of cancer death in the world.1,2 Most CRC cases develop in the presence of gene mutation and environmental factors.3,4 The risk factors of CRC include increasing age, male sex, smoking, excessive alcohol, diabetes mellitus and high-fat diet.5,6 Epidemiological studies have confirmed that a high-fat diet increases the output and faecal concentration of bile acids, especially the level of deoxycholic acid (DCA).7,8 Increased DCA in the intestine causes DNA damage through oxidative stress in intestinal epithelial cells and activates the epidermal growth factor receptor (EGFR) or Wnt pathways to promote CRC.9–11 These results indicate that DCA is an important oncogene and pro-tumor factor, but the mechanism is still unclarified.As an important defense system of the host, the intestinal mucosal barrier includes physical and functional barriers.12 The intestinal epithelial connection is composed of tight junctions (TJ), adherens junctions and desmosomes.13,14 Zonula occludens proteins play a key role in tight junction assembly by linking the cell cytoskeleton to TJ.15 Intestinal epithelial cells are involved in intestinal barrier function mainly by conventional enterocytes, goblet cells, Paneth cells and endocrine cells. Goblet cells secrete mucin and Paneth cells secrete antimicrobial products to prevent bacteria from adhering to the gut epithelium.16,17 The integrity of the intestinal mucosal barrier prevents antigens from entering into the body and maintains the homeostasis of the gut microenvironment.18,19 Various factors such as high-fat diet, stress and infection can impair the intestinal barrier including intestinal epithelial damage, mucus layer changes and dysbiosis, resulting in a variety of intestinal diseases.20,21 Lately it has been reported that barrier defects drive the occurrence and progression of colorectal tumors.22,23 Thus we proposed the hypothesis that a high-fat diet causes an increase in DCA, which might result in intestinal mucosal barrier damage, and leads to the development of cancer.
Apc min/+ mice carry a mutation of the adenomatous polyposis coli (Apc) gene, and can spontaneously develop multiple intestinal tumors,24 which has been used as an ideal animal model of human intestinal cancer. Our previous studies have already shown that DCA accelerated the progression of the intestinal adenoma–adenocarcinoma sequence under the hereditary background of Apc mutation.11,25 Here we further provided more evidence that DCA disrupted the intestinal mucosal barrier and increased intestinal permeability during tumorigenesis. Taken together, our findings demonstrated that DCA can promote the progression of intestinal tumors by affecting the intestinal mucosal barrier, indicating that improving the intestinal barrier function may provide a potential prevention and treatment strategy for the therapy of CRC.
2. Materials and methods
2.1. Cell cultures and treatment
The Caco-2 cell line is a human cloned colon adenocarcinoma cell line that is structurally and functionally similar to differentiated intestine epithelial cells. These cells can fuse and differentiate into intestinal epithelial cells and form a continuous monolayer. Caco-2 cells were cultured in DMEM medium supplemented with 10% fetal calf serum (FBS), 100 U ml−1 penicillin, and 100 μg ml−1 streptomycin at 37 °C in a 5% CO2 incubator. For the experiments, Caco-2 cells were seeded in 12-well plates at 8 × 10⁴ cells per well. The electrical resistance of the monolayers was measured using a Millicell-Electrical Resistance System (Millipore Corporation, Billerica, MA, USA). The monolayers were maintained for 14–21 days until the transepithelial electrical resistance (TEER) reached a stable level.26 Then the Caco-2 cells were treated with different concentrations (50 μM, 100 μM, 200 μM and 300 μM) of DCA for different times to record the change of TEER. Immorto-Min colonic epithelial (IMCE) cells carry both the mutant Apcmin gene and a temperature-sensitive mutant of the SV40 large T gene is a precancerous intestinal cell line.27 IMCE cells were grown in RPMI 1640 medium containing 10% FBS, 100 U ml−1 penicillin, 100 μg ml−1 streptomycin, 10 U ml−1 interferon (IFN)-γ and insulin–transferin–sodium selenite media supplement (ITS) at a temperature of 33 °C and under 5% CO2. After the treatment of DCA, cell lysates of Caco-2 and IMCE cells were collected for RNA extraction to detect proinflammatory cytokines.2.2. Mice feeding and treatment
4-Week-old female Apcmin/+ mice were obtained from Jackson Laboratory and housed under specific pathogen free (SPF) conditions. All animals were acclimatized 4 days before the experiments. The animals were randomly divided into 2 groups (n = 10): control group (received sterile water) and DCA group (0.2% DCA in sterile water) as previously described.8,11 The mice were fed an AIN93 M rodent diet and had free access to water. After 12 weeks, the mice were sacrificed by CO2 asphyxiation and the intestinal tissue was obtained. All experimental procedures were approved by the Institutional Animal Care and Use Committee of Tianjin Medical University, Tianjin, P. R. China (No. TMUaMEC2016011, 16 August 2016).2.3. Measurement of intestinal permeability
At the end of 12 weeks, the mice were fasted overnight and fluorescein isothiocyanate–dextran (FITC-D) (MW 4 kDa, Sigma Aldrich, St Louis, MO) was orally administered at a concentration of 2 mg per 10 g body weight 4 hours before killing. Blood was taken from the inner canthus and centrifuged (7 min, 3000g, 4 °C) to collect the serum. The fluorescence of FITC-D in the serum was measured at an excitation and emission wavelength of 485 nm and 535 nm respectively. The concentration of FITC-D in the serum was calculated on the basis of the standard curve.2.4. Real-time PCR analyses
RNA was extracted from the intestinal tissue of the mice or cell lysates of colorectal tumor cells by using the RNeasy Mini Kit (Qiagen, Carlsbad, CA). Then RNA was converted into cDNA using a TIANGEN reverse transcription system (TIANGEN, Beijing, China). Real-time PCR was performed using SYBR Green PCR Master Mix (Applied Biosystems). The mRNA level was determined using a StepOne real-time PCR system (Applied Biosystems) according to the manufacturer's instructions and calculated by the ΔΔCt method. Each sample was analyzed in duplicate and normalized to GAPDH. The primer sequences for the target genes are shown in Table 1.| Primers | Sequence (5′ to 3′) | |
|---|---|---|
| 1 | GAPDH-F | TGTGTCCGTCGTGGATCTGA |
| 2 | GAPDH-R | CCTGCTTCACCACCTTCTTGA |
| 3 | IL-1β-F | GTGGCTGTGGAGAAGCTGTG |
| 4 | IL-1β-R | GAAGGTCCACGGGAAAGACAC |
| 5 | IL-6-F | CCAGTTGCCTTCTTGGGACT |
| 6 | IL-6-R | GGTCTGTTGGGAGTGGTATCC |
| 7 | TNF-α-F | ACTCCAGGCGGTGCCTATG |
| 8 | TNF-α-R | GAGCGTGGTGGCCCCT |
| 9 | NLRP3-F | CTCCAACCATTCTCTGACCAG |
| 10 | NLRP3-R | ACAGATTGAAGTAAGGCCGG |
| 11 | ZO-1-F | GGGCCATCTCAACTCCTGTA |
| 12 | ZO-1-R | AGAAGGGCTGACGGGTAAAT |
| 13 | MUC2-F | TCGCCCAAGTCGACACTCA |
| 14 | MUC2-R | GCAAATAGCCATAGTACAGTTACACAGC |
| 15 | Defensin-F | TCGTTCTGCTGGCCTTCC |
| 16 | Defensin-R | CCTGGCTGTTCCTCAGTTTTAGTC |
| 17 | Cryptdin-F | CAGCCGGAGAAGAGGACCAG |
| 18 | Cryptdin-R | TAGCATACCAGATCTCTCAACGATTC |
| 19 | F4/80-F | CTTTGGCTATGGGCTTCCAGTC |
| 20 | F4/80-R | GCAAGGAGGACAGAGTTTATCGTG |
| 21 | MR-F | GGTGCTACTCCGAACAACAG |
| 22 | MR-R | ACCGTGGCTGAAAGTTCCT |
| 23 | Arg-1-F | TGGCTTGCGAGACGTAGAC |
| 24 | Arg-1-R | GCTCAGGTGAATCGGCCTTTT |
| 25 | CCL17-F | AGTGCTGCCTGGATTACTTCAAAG |
| 26 | CCL17-R | CTGGACAGTCAGAAACACGATGG |
2.5. Histopathology and immunohistochemistry
The small intestine was divided into the proximal, middle and distal segments. The intestinal tract was flushed with ice neutral buffered PBS, and then the number and size of the tumors were recorded after longitudinal dissection. Polyps with diameters less than 1 mm, 1–2 mm or greater than 2 mm were respectively considered as small diameter polyps, medium diameter polyps and large diameter polyps. Distal small intestine and colon were fixed in 10% formalin for 24 h and embedded in paraffin wax. Then 5 mm sections were stained with hematoxylin and eosin for histopathological analysis. The pathology results were evaluated by the same pathologist (Y.-J.Z.) who was blinded to group allocation. Low grade dysplasia (LGD) refers to the degree of abnormality involving the lower part of the epithelium, while high grade dysplasia (HGD) involves more than 1/3–2/3 of the lower epithelium. Intramucosal carcinomas refer to tumors in situ without breaking through the muscularis mucosae. The tissue sections were incubated with primary antibodies, MUC2 (Santa Cruz Biotechnology, CA, USA), rabbit monoclonal anti-Ki-67, F4/80 or lysozyme (Abcam, MA, USA). The biotinylated anti-rabbit secondary antibody was applied followed by horseradish peroxidase (HRP)–streptavidin solution. Finally, the sections were counterstained with hematoxylin. Ki-67 is expressed in the nucleus. MUC2, lysozyme and F4/80 are located in the cytoplasm. Five areas were randomly selected from each slide and the number of positive cells was recorded. The data were quantified by calculating the average percentages of positive cells in each mouse as the positive rate of cells.2.6. Immunofluorescence
Immunofluorescence was performed on paraffin embedded intestinal tissue sections. The sections were incubated in a humidified chamber with the appropriate primary antibody zonula occludens 1 (ZO-1), IgA, F4/80 or MR (Abcam, MA, USA) for 12 h at 4 °C. After being washed in PBS three times for five minutes, the sections were then incubated with the fluorescent-tagged secondary antibody for 1 h at room temperature. The sections were last stained with DAPI. Ultimately, the sections were observed under a fluorescence microscope after drying slightly. The statistical analysis for the immunofluorescence of ZO-1 was performed by ImageJ (Bethesda, USA).28,29 Briefly, the image was opened with the ImageJ software. It was reversed to gray scale and the optical density was calibrated. Then we picked a region of interest and measured the area and integrated density. The mean intensity was represented by the ratio of the integrated density to the area (fluorescence intensity% = integrated density/area). At least five areas were selected from each image and the mean fluorescence intensity values were recorded.2.7. TUNEL assay
The TUNEL assay was performed using a commercially available kit (Roche Applied Science, Mannheim, Germany) according to the manufacturer's instructions. Each mouse was randomly selected with no less than three tumors. Five sites were randomly selected from each tumor and the percentage of positively stained cells was calculated to determine apoptotic cells.2.8. Statistical analysis
The data were presented as mean ± SEM. Statistical analysis between two groups was performed using the Student's t test. All statistics were performed using SPSS 22.0 (SPSS Inc. Chicago, IL) and GraphPad Prism 5.0 (GraphPad Software, San Diego, CA, USA). Differences were considered statistically significant at p < 0.05.3. Results
3.1 DCA disrupted cell integrity and caused an inflammatory response in intestinal tumor cells
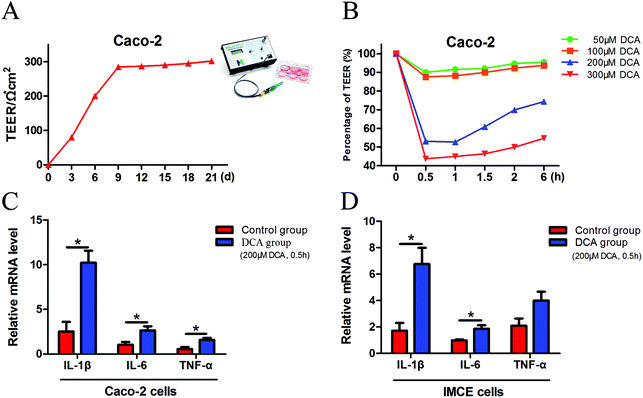
Caco-2 cells can be considered as normal intestinal epithelium, and TEER values can be utilized to determine their integrity. It is generally considered that a TEER value greater than 200 Ω × cm2 means a dense and intact cell monolayer. The TEER value of the Caco-2 cells increased rapidly at 1 week after cell inoculation and began to increase slowly on day 9, and ultimately remained at about 300 × Ω cm2 until day 21 (Fig. 1A). The dense monolayers of the Caco-2 cells were then treated with different concentrations (50 μM, 100 μM, 200 μM and 300 μM) of DCA, and the changes of the TEER values were measured at different times. Treatment with 200 μM DCA for 30 min significantly disrupted Caco-2 cell monolayer integrity which was then gradually recovered (Fig. 1B). Thus we chose this condition for the next experiments. After treating Caco-2 and IMCE cells with 200 μM DCA for 30 min, the mRNA levels of proinflammatory cytokines including interleukin-1β (IL-1β), interleukin-6 (IL-6) and tumor necrosis factor-α (TNF-α) were significantly increased (Fig. 1C and D). These results suggested that DCA disrupted cell integrity and up-regulated the production of proinflammatory cytokines.3.2 DCA increased the multiplicity of intestinal tumors and promoted tumorigenesis in mice
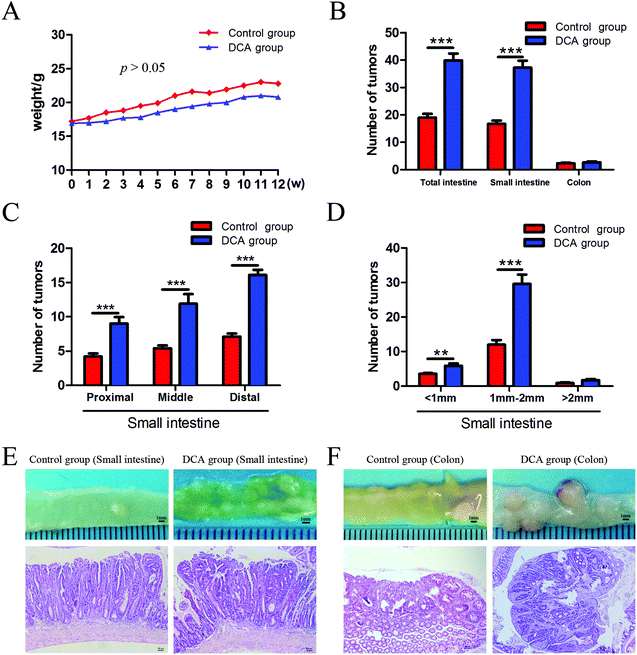
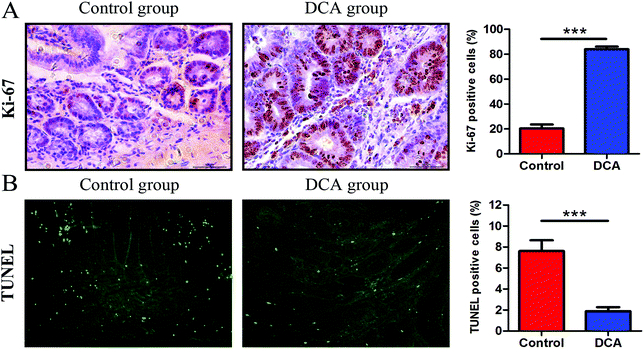
The mice in the two groups grew well, and there was no difference in the general status. After 12 weeks of administration, mild hematochezia was observed in the DCA group. No significant bloody stools and death occurred in both groups. Given no difference in food intake, the body weight in both groups showed a slowly increasing trend but no difference (p > 0.05, Fig. 2A). The DCA group developed more intestinal tumors than the control group and had a higher number of tumors in the small intestine (36.10 ± 2.80 vs. 16.70 ± 1.24, p < 0.001, Fig. 2B). Moreover, the number of small and medium diameter tumors in the small intestine and tumors in each segment of the small intestine were also increased in the DCA group (Fig. 2C and D).In the DCA group, intestinal tumors slightly protruded from the intestinal mucosa and ulceration was seen in the intestinal lumen. HE staining showed that intramucosal carcinomas were present in the distal small intestine, and there was HGD in the colon. A total of 70% (7/10) of the mice in the DCA group were found to have HGD or intramucosal carcinomas. Meanwhile, the pathological types of intestinal tumors in the control group were tubular or villi–tubular adenoma. Compared with the DCA group, only 30% (3/10) of the mice in the control group had LGD, and no HGD or intramucosal carcinoma was found (Fig. 2E and F). The proliferation and apoptosis of intestinal tumor cells in the two groups of mice are shown in Fig. 3. The percentage of Ki-67 positive cells in the DCA group was higher than that in the control group (83.94 ± 2.13 vs. 20.34 ± 3.27, p < 0.001, Fig. 3A). The TUNEL assay showed that DCA decreased the apoptosis of intestinal tumor cells (1.88 ± 0.39 vs. 7.61 ± 1.03, p < 0.001, Fig. 3B). Together, these results indicated that DCA administration promoted cell proliferation, inhibited apoptosis and facilitated intestinal tumorigenesis in mice.
3.3 DCA increased intestinal permeability and induced low grade inflammation in mice
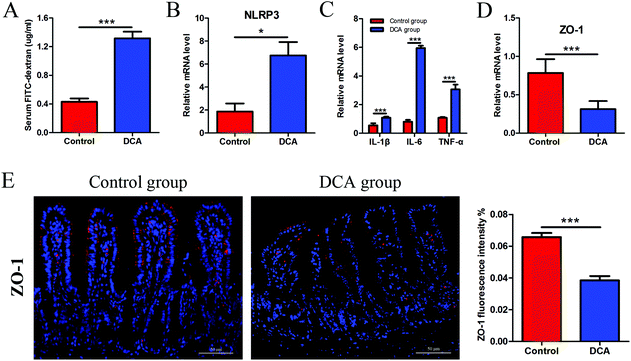
The intestinal permeability of mice was determined by serum FITC-D concentration. The mice administered with DCA presented a higher concentration of FITC-D (1.17 ± 0.12) μg ml−1 than the mice receiving water (0.51 ± 0.07) μg ml−1 (p < 0.001, Fig. 4A). No obvious inflammation was observed under the microscope in both groups. However, DCA increased the mRNA expression of the NOD-like receptor family, pyrin domain containing 3 (NLRP3) in the intestine, which assembles into an inflammasome in response to invading pathogens and other danger signals (Fig. 4B). Moreover, the levels of proinflammatory cytokines including IL-1β, IL-6 and TNF-α were significantly higher in the DCA group than in the control group (Fig. 4C). Real-time PCR showed the downregulation of ZO-1 after DCA treatment (p < 0.001, Fig. 4D). Immunofluorescence further demonstrated that the expression of ZO-1 decreased in the DCA group and the distribution was discontinuous (Fig. 4E). It indicated that prolonged overexposure of DCA increased intestinal permeability and caused chronic intestinal low grade inflammation in Apcmin/+ mice.3.4 DCA reduced the number of intestinal goblet cells and Paneth cells and their products
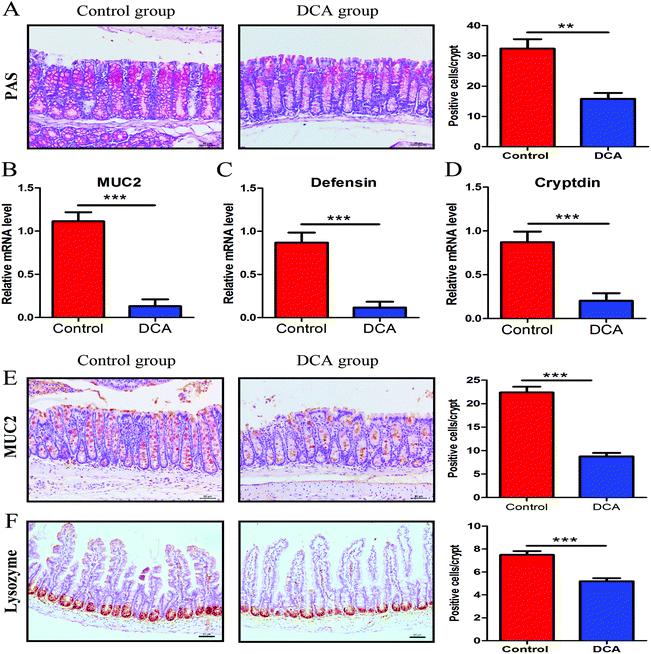
PAS staining and lysozyme immunohistochemical staining were used to determine the number of goblet cells and Paneth cells. PAS stained sections of the colonic tissue presented a lower average number of positive cells in the DCA group than in the control group (20.88 ± 0.79 vs. 35.44 ± 1.68, p < 0.01, Fig. 5A). The results of lysozyme immunohistochemical staining also showed that the number of positive cells was significantly decreased in the small intestine after DCA treatment (5.19 ± 0.26 vs. 7.49 ± 0.33, p < 0.001, Fig. 5F). These data indicated that DCA destroyed the intestinal epithelial barrier.Next we examined the level of MUC2 and antimicrobial substances secreted by goblet cells and Paneth cells. The mRNA expression of MUC2 was reduced in the colon of the DCA group (0.15 ± 0.04 vs. 0.91 ± 0.05, p < 0.001, Fig. 5B). Correspondingly, immunohistochemical staining also showed that the number of positive cells of MUC2 in the colon was significantly decreased when comparing the DCA group with the control group (13.10 ± 1.16 vs. 28.50 ± 0.96, p < 0.001, Fig. 5E). Meanwhile, the mRNA expressions of defensin and cryptdin secreted by Paneth cells were decreased in the small intestine of the DCA group (Fig. 5C and D).
3.5 DCA induced immune dysfunction in the intestinal barrier
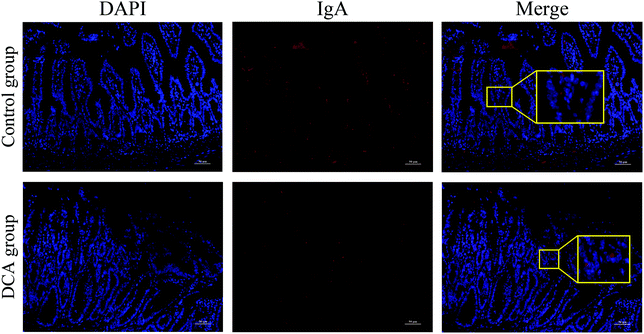
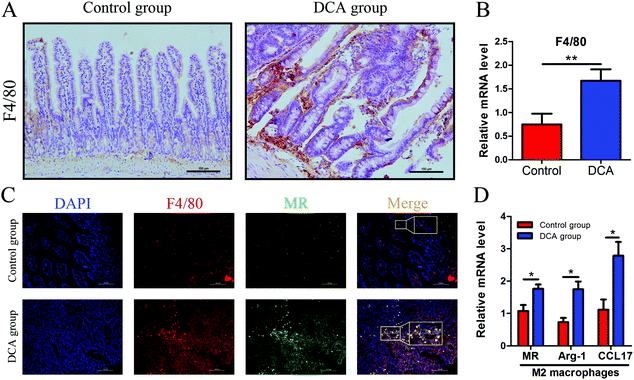
Intestinal secretory immunoglobulin A (sIgA) plays a key role in the intestinal immune system. As showed in Fig. 6, immunofluorescence showed that the expression of small intestinal sIgA was significantly reduced in the DCA group. The decrease in sIgA decreases the intestinal immune function and weakens the mucosal resistance to pathogenic invasion. In addition, DCA increased the mRNA level of the macrophage biomarker F4/80 in the small intestine. Immunofluorescence confirmed the higher expression of F4/80 in the DCA group, indicating that DCA promoted the recruitment of macrophages in the intestine (Fig. 7A and B). Mannose receptor (MR) as a surface molecule of M2 macrophages was found to accumulate in the small intestine of the DCA group than in the control group (Fig. 7C). Moreover, the mRNA expression of M2 macrophage surface molecules including MR, Arg-1 and CCL17 were also up-regulated in the DCA group (Fig. 7D). These data showed that DCA promoted the polarization of M2 macrophages in mice intestine.4. Discussion
The increased intestinal level of DCA after a high-fat diet is associated with the onset of many intestinal diseases including colorectal cancer.30–32 However, the mechanism still remains to be elucidated. In the present study, we investigated the effects of DCA on the intestinal mucosal barrier and its role in the development of CRC. We found that DCA treatment can disrupt Caco-2 cell integrity and promote the release of proinflammatory cytokines in intestinal tumor cells. Then we used mice to mimic human intestinal cancer and studied the effect of DCA on the intestinal barrier. Our results demonstrated that DCA administration induced chronic intestinal low grade inflammation, altered the intestinal mucosal barrier, increased intestinal mucosal permeability and promoted tumorigenesis in Apcmin/+ mice. Together, we provide a new insight that the intestinal barrier plays a crucial role in DCA induced intestinal tumorigenesis.In our study, we chose 0.2% of DCA based on the previous reports and our previous study.8,25,33 Bernstein et al. fed wild-type male B6.129PF2/J mice with a 0.2% DCA supplemented diet for 8 or 10 months, and found that respectively 100% and 83% of the mice developed tumors, and 50% and 67% of the mice developed cancers. On day 90, the level of DCA measured in feces was 0.3 mg per g dry weight in the control group and 4.6 mg per g dry weight in the 0.2% DCA diet group.8 Several studies have shown that a high-fat diet can increase the DCA level by approximately 2 times than a non-intervention diet.34,35 Since the level of DCA in human feces typically varies from 2.3 mg per g to 4.1 mg per g dry weight,36 the DCA level in the 0.2% DCA diet group was nearly twice that of humans. So the same concentration of DCA was chosen to mimic the high-fat diet effect on intestinal tumorigenesis.
We discovered that DCA increased the mRNA expression of NLRP3 and induced chronic intestinal low grade inflammation. Normally, the NLRP3 inflammasome guards the host from the assault of microbial pathogens and endogenous danger signals. However, abnormal activation of the NLRP3 inflammasome can lead to a variety of diseases.37,38 Recent studies have shown that cholesterol,39 titanium dioxide40 and DCA41 participate in the progression of intestinal diseases by activating the NLRP3 inflammasome. Zhao et al.41 estimated that DCA triggered NLRP3 inflammasome activation and aggravated dextran sulfate sodium induced colitis in mice. In summary, we indicated that DCA activation of the NLRP3 inflammasome to induce intestinal low grade inflammation during intestinal tumorigenesis in Apcmin/+ mice.
Normally, the intestinal barrier allows the absorption of nutrients and prevents the invasion of pathogens; any change in the composition of the intestinal barrier can alter intestinal permeability. Intestinal barrier destruction is widespread in intestinal diseases such as inflammatory bowel disease (IBD), irritable bowel syndrome (IBS) and celiac disease.42 Increased intestinal permeability leads to exposure of intraluminal antigens to the intestinal mucosa, activates the immune system and increases the infiltration of inflammatory cells.43 The intestinal barrier is a dynamic system, but the self-regulatory capacity of the intestine can be lost under certain pathological conditions, which then leads to increased intestinal permeability and chronic intestinal inflammation. Many drugs used for treating gastrointestinal disorders such as steroids, 5-aminosalicylic acid (5-ASA), anti-TNF drugs and probiotics also have the ability to regulate intestinal permeability and improve the disease condition.44,45 Lifestyle and dietary factors (such as westernized diets) can increase intestinal permeability.46 Our in vitro studies have shown that DCA increased cell permeability and promoted the production of proinflammatory cytokines. Moreover, we confirmed in animal experiments that DCA can disrupt the intestinal barrier structure and increase intestinal permeability. We also found that DCA induced inflammatory responses, regulated immune responses, and facilitated the development of intestinal tumors.
Our previous study has already confirmed that DCA induced intestinal microbiota dysbiosis. DCA altered the diversity of bacteria, increased the level of opportunistic pathogens and reduced beneficial bacteria.25 In general, there is a balance between the gut microbiota and the intestinal barrier.47 Petersson et al.48 showed that the mucus layer of germ-free mice was thin, but it returns to normal levels after exposure to bacterial products. However, this balance will be broken in the presence of disease. A previous study has shown that bacteria penetrate the mucus layer and reach the epithelium in colitis animal models and ulcerative colitis patients.49 In Muc2−/− mice, bacteria directly contacted epithelial cells and were even detected in crypts and epithelial cells.50 Muc2−/− mice developed colitis or CRC in a shorter time than wild-type mice under the same conditions.51,52 Furthermore, Salzman et al.53 estimated that Paneth cell α-defensins can shape the composition of the intestinal microflora, and its deficiency led to gut dysbiosis. Consistent with this, we believe that the destruction of the intestinal barrier after DCA treatment promoted the imbalance of microbiota and aggravated intestinal tumorigenesis.
5. Conclusions
High-fat diets are closely related to intestinal diseases including CRC, and the intake of a high-fat diet increases the content of DCA in the intestine. Our results illustrated that DCA promoted intestinal tumorigenesis partly through damaging the intestinal mucosa physical barrier and functional barrier. Hence, exploring the effect of DCA on the intestinal mucosal barrier will provide valuable information for the prevention and treatment of human high-fat diet associated CRC. The explicit mechanisms of damaging the intestinal mucosal barrier by DCA need further study.Abbreviations
| DCA | Deoxycholic acid |
| CRC | Colorectal cancer |
| ZO-1 | Zonula occludens 1 |
| sIgA | Secretory immunoglobulin A |
| EGFR | Epidermal growth factor receptor |
| TJ | Tight junctions |
| Apc | Adenomatous polyposis coli |
| TEER | Transepithelial electrical resistance |
| IMCE | Immorto-Min colonic epithelium |
| IL-1β | Interleukin-1β |
| IL-6 | Interleukin-6 |
| TNF-α | Tumor necrosis factor-α |
| HGD | High grade dysplasia |
| LGD | Low grade dysplasia |
| FITC-D | Fluorescein isothiocyanate–dextran |
| NLRP3 | NOD-like receptor family, pyrin domain containing 3 |
| MR | Mannose receptor |
| IBD | Inflammatory bowel disease |
| IBS | Irritable bowel syndrome |
| 5-ASA | 5-Aminosalicylic acid |
Conflicts of interest
There are no conflicts to declare.Acknowledgements
This study was supported by grants (81570478 and 81741075) from the National Natural Science Foundation of China and a grant (17JCYBJC24900) from the Tianjin Research Program of Application Foundation and Advanced Technology of China.References
- W. Chen, R. Zheng, P. D. Baade, S. Zhang, H. Zeng, F. Bray, A. Jemal, X. Q. Yu and J. He, Ca-Cancer J. Clin., 2016, 66, 115–132 CrossRef PubMed.
- M. M. Center, A. Jemal and E. Ward, Cancer Epidemiol. Biomarkers Prev., 2009, 18, 1688–1694 CrossRef PubMed.
- J. Chen, E. Pitmon and K. Wang, Semin. Immunol., 2017, 32, 43–53 CrossRef CAS PubMed.
- W. B. Strum, N. Engl. J. Med., 2016, 374, 1065–1075 CrossRef CAS PubMed.
- J. S. Moore and T. H. Aulet, Surg. Clin. North Am., 2017, 97, 487–502 CrossRef PubMed.
- X. He, K. Wu, S. Ogino, E. L. Giovannucci, A. T. Chan and M. Song, Gastroenterology, 2018, 155, 355–373 CrossRef PubMed.
- N. D. Nigro, R. L. Campbell, D. V. Singh and Y. N. Lin, J. Natl. Cancer Inst., 1976, 57, 883–888 CrossRef CAS PubMed.
- C. Bernstein, H. Holubec, A. K. Bhattacharyya, H. Nguyen, C. M. Payne, B. Zaitlin and H. Bernstein, Arch. Toxicol., 2011, 85, 863–871 CrossRef CAS PubMed.
- S. Ocvirk and S. J. O'Keefe, Curr. Nutr. Rep., 2017, 6, 315–322 CrossRef CAS PubMed.
- S. M. Centuori and J. D. Martinez, Dig. Dis. Sci., 2014, 59, 2367–2380 CrossRef CAS PubMed.
- H. Cao, S. Luo, M. Xu, Y. Zhang, S. Song, S. Wang, X. Kong, N. He, X. Cao, F. Yan and B. Wang, Fam. Cancer, 2014, 13, 563–571 CrossRef CAS PubMed.
- F. Scaldaferri, M. Pizzoferrato, V. Gerardi, L. Lopetuso and A. Gasbarrini, J. Clin. Gastroenterol., 2012, 46(Suppl), S12–S17 CrossRef CAS PubMed.
- N. D. Rios-Arce, F. L. Collins, J. D. Schepper, M. D. Steury, S. Raehtz, H. Mallin, D. T. Schoenherr, N. Parameswaran and L. R. McCabe, Adv. Exp. Med. Biol., 2017, 1033, 151–183 CrossRef PubMed.
- J. R. Turner, Nat. Rev. Immunol., 2009, 9, 799–809 CrossRef CAS PubMed.
- K. Umeda, J. Ikenouchi, S. Katahira-Tayama, K. Furuse, H. Sasaki, M. Nakayama, T. Matsui, S. Tsukita, M. Furuse and S. Tsukita, Cell, 2006, 126, 741–754 CrossRef CAS PubMed.
- A. M. Patterson and W. AJM, Front. Immunol., 2017, 8, 841 CrossRef PubMed.
- M. K. Holly and J. G. Smith, Viruses, 2018, 10, 225 CrossRef PubMed.
- S. C. Bischoff, G. Barbara, W. Buurman, T. Ockhuizen, J. D. Schulzke, M. Serino, H. Tilg, A. Watson and J. M. Wells, BMC Gastroenterol., 2014, 14, 189 CrossRef PubMed.
- J. Y. Lee, V. C. Wasinger, Y. Y. Yau, E. Chuang, V. Yajnik and R. W. Leong, Proteomes, 2018, 6, 17 CrossRef PubMed.
- M. Vancamelbeke and S. Vermeire, Expert Rev. Gastroenterol. Hepatol., 2017, 11, 821–834 CrossRef CAS PubMed.
- A. C. Luissint, C. A. Parkos and A. Nusrat, Gastroenterology, 2016, 151, 616–632 CrossRef CAS PubMed.
- S. I. Grivennikov, K. Wang, D. Mucida, C. A. Stewart, B. Schnabl, D. Jauch, K. Taniguchi, G. Y. Yu, C. H. Osterreicher, K. E. Hung, C. Datz, Y. Feng, E. R. Fearon, M. Oukka, L. Tessarollo, V. Coppola, F. Yarovinsky, H. Cheroutre, L. Eckmann, G. Trinchieri and M. Karin, Nature, 2012, 491, 254–258 CrossRef CAS PubMed.
- M. A. Odenwald and J. R. Turner, Nat. Rev. Gastroenterol. Hepatol., 2017, 14, 9–21 CrossRef CAS PubMed.
- A. R. Moser, H. C. Pitot and W. F. Dove, Science, 1990, 247, 322–324 CrossRef CAS PubMed.
- H. Cao, M. Xu, W. Dong, B. Deng, S. Wang, Y. Zhang, S. Wang, S. Luo, W. Wang, Y. Qi, J. Gao, X. Cao, F. Yan and B. Wang, Int. J. Cancer, 2017, 140, 2545–2556 CrossRef CAS PubMed.
- S. J. Wu, T. M. Don, C. W. Lin and F. L. Mi, Mar. Drugs, 2014, 12, 5677–5697 CrossRef CAS PubMed.
- L. Wang, L. Liu, Y. Shi, H. Cao, R. Chaturvedi, M. W. Calcutt, T. Hu, X. Ren, K. T. Wilson, D. B. Polk and F. Yan, PLoS One, 2012, 7, e36418 CrossRef CAS PubMed.
- Z. Zhou, L. Zhang, M. Ding, Z. Luo, S. Yuan, M. B. Bansal, G. Gilkeson, R. Lang and W. Jiang, Clin. Immunol., 2017, 183, 174–180 CrossRef CAS PubMed.
- N. A. Renner, R. K. Redmann, T. Moroney-Rasmussen, H. A. Sansing, P. P. Aye, P. J. Didier, A. A. Lackner and A. G. Maclean, Neuropathol. Appl. Neurobiol., 2012, 38, 162–174 CrossRef CAS PubMed.
- C. Flynn, D. C. Montrose, D. L. Swank, M. Nakanishi, J. N. Ilsley and D. W. Rosenberg, Mol. Carcinog., 2007, 46, 60–70 CrossRef CAS PubMed.
- Y. Kong, P. S. Bai, H. Sun, K. J. Nan, N. Z. Chen and X. G. Qi, Int. J. Biochem. Cell Biol., 2012, 44, 2321–2332 CrossRef CAS PubMed.
- D. O. Prichard, A. M. Byrne, J. O. Murphy, J. V. Reynolds, J. O'Sullivan, R. Feighery, B. Doyle, O. S. Eldin, S. P. Finn, A. Maguire, D. Duff, D. P. Kelleher and A. Long, J. Cell. Mol. Med., 2017, 21, 3612–3625 CrossRef CAS PubMed.
- C. M. Payne, H. Holubec, A. K. Bhattacharyya, C. Bernstein and H. Bernstein, Inflammatory Bowel Dis., 2010, 16, 729–730 CrossRef PubMed.
- B. S. Reddy, D. Hanson, S. Mangat, L. Mathews, M. Sbaschnig, C. Sharma and B. Simi, J. Nutr., 1980, 110, 1880–1887 CrossRef CAS PubMed.
- J. Stadler, H. S. Stern, K. S. Yeung, V. McGuire, R. Furrer, N. Marcon and W. R. Bruce, Gut, 1988, 29, 1326–1331 CrossRef CAS PubMed.
- S. Reddy, T. A. Sanders, R. W. Owen and M. H. Thompson, Br. J. Nutr., 1998, 79, 495–500 CrossRef CAS PubMed.
- E. I. Elliott and F. S. Sutterwala, Immunol. Rev., 2015, 265, 35–52 CrossRef CAS PubMed.
- C. Bauer, P. Duewell, C. Mayer, H. A. Lehr, K. A. Fitzgerald, M. Dauer, J. Tschopp, S. Endres, E. Latz and M. Schnurr, Gut, 2010, 59, 1192–1199 CrossRef CAS PubMed.
- Q. Du, Q. Wang, H. Fan, J. Wang, X. Liu, H. Wang, Y. Wang and R. Hu, Biochem. Pharmacol., 2016, 105, 42–54 CrossRef CAS PubMed.
- P. A. Ruiz, B. Moron, H. M. Becker, S. Lang, K. Atrott, M. R. Spalinger, M. Scharl, K. A. Wojtal, A. Fischbeck-Terhalle, I. Frey-Wagner, M. Hausmann, T. Kraemer and G. Rogler, Gut, 2017, 66, 1216–1224 CrossRef CAS PubMed.
- S. Zhao, Z. Gong, J. Zhou, C. Tian, Y. Gao, C. Xu, Y. Chen, W. Cai and J. Wu, Front. Immunol., 2016, 7, 536 Search PubMed.
- R. M. Catalioto, C. A. Maggi and S. Giuliani, Curr. Med. Chem., 2011, 18, 398–426 CrossRef CAS PubMed.
- Y. Guo, L. Luan, N. K. Patil and E. R. Sherwood, Cytokine Growth Factor Rev., 2017, 38, 10–21 CrossRef CAS PubMed.
- F. Scaldaferri, M. Pizzoferrato, V. Gerardi, L. Lopetuso and A. Gasbarrini, J. Clin. Gastroenterol., 2012, 46(Suppl), S12–S17 CrossRef CAS PubMed.
- Y. Yue, S. Wu, Z. Li, J. Li, X. Li, J. Xiang and H. Ding, Food Funct., 2015, 6, 2568–2577 RSC.
- S. Pendyala, J. M. Walker and P. R. Holt, Gastroenterology, 2012, 142, 1100–1101 CrossRef CAS PubMed.
- R. Okumura and K. Takeda, Inflammation Regener, 2018, 38, 5 CrossRef PubMed.
- J. Petersson, O. Schreiber, G. C. Hansson, S. J. Gendler, A. Velcich, J. O. Lundberg, S. Roos, L. Holm and M. Phillipson, Am. J. Physiol.: Gastrointest. Liver Physiol., 2011, 300, G327–G333 CrossRef CAS PubMed.
- M. E. Johansson, J. K. Gustafsson, J. Holmen-Larsson, K. S. Jabbar, L. Xia, H. Xu, F. K. Ghishan, F. A. Carvalho, A. T. Gewirtz, H. Sjovall and G. C. Hansson, Gut, 2014, 63, 281–291 CrossRef CAS PubMed.
- M. E. Johansson, M. Phillipson, J. Petersson, A. Velcich, L. Holm and G. C. Hansson, Proc. Natl. Acad. Sci. U. S. A., 2008, 105, 15064–15069 CrossRef CAS PubMed.
- M. Van der Sluis, B. A. De Koning, A. C. De Bruijn, A. Velcich, J. P. Meijerink, J. B. Van Goudoever, H. A. Buller, J. Dekker, I. Van Seuningen, I. B. Renes and A. W. Einerhand, Gastroenterology, 2006, 131, 117–129 CrossRef CAS PubMed.
- A. Velcich, W. Yang, J. Heyer, A. Fragale, C. Nicholas, S. Viani, R. Kucherlapati, M. Lipkin, K. Yang and L. Augenlicht, Science, 2002, 295, 1726–1729 CrossRef CAS PubMed.
- N. H. Salzman, K. Hung, D. Haribhai, H. Chu, J. Karlsson-Sjoberg, E. Amir, P. Teggatz, M. Barman, M. Hayward, D. Eastwood, M. Stoel, Y. Zhou, E. Sodergren, G. M. Weinstock, C. L. Bevins, C. B. Williams and N. A. Bos, Nat. Immunol., 2010, 11, 76–83 CrossRef CAS PubMed.
Footnote |
| † These authors contributed equally to this work. |
| This journal is © The Royal Society of Chemistry 2018 |

