 Open Access Article
Proton transfer in guanine–cytosine base pair analogues studied by NMR spectroscopy and PIMD simulations†
Radek
Pohl
 a,
Ondřej
Socha
a,
Petr
Slavíček
a,
Ondřej
Socha
a,
Petr
Slavíček
 b,
Michal
Šála
a,
Paul
Hodgkinson
 c and
Martin
Dračínský
 *a
*a
aInstitute of Organic Chemistry and Biochemistry, Flemingovo nám. 2, 16610, Prague, Czech Republic. E-mail: dracinsky@uochb.cas.cz
bUniversity of Chemistry and Technology Prague, Department of Physical Chemistry, Technická 5, 16628 Prague, Czech Republic
cDepartment of Chemistry, Durham University, South Road, DH1 3LE, Durham, UK
First published on 2nd May 2018
Abstract
It has been hypothesised that proton tunnelling between paired nucleobases significantly enhances the formation of rare tautomeric forms and hence leads to errors in DNA replication. Here, we study nuclear quantum effects (NQEs) using deuterium isotope-induced changes of nitrogen NMR chemical shifts in a model base pair consisting of two tautomers of isocytosine, which form hydrogen-bonded dimers in the same way as the guanine–cytosine base pair. Isotope effects in NMR are consequences of NQEs, because ro-vibrational averaging of different isotopologues gives rise to different magnetic shielding of the nuclei. The experimental deuterium-induced chemical shift changes are compared with those calculated by a combination of path integral molecular dynamics (PIMD) simulations with DFT calculations of nuclear shielding. These calculations can directly link the observable isotope-induced shifts with NQEs. A comparison of the deuterium-induced changes of 15N chemical shifts with those predicted by PIMD simulations shows that inter-base proton transfer reactions do not take place in this system. We demonstrate, however, that NMR isotope shifts provide a unique possibility to study NQEs and to evaluate the accuracy of the computational methods used for modelling quantum effects in molecules. Calculations based on the PBE functional from the general-gradient-approximation family provided significantly worse predictions of deuterium isotope shifts than those with the hybrid B3LYP functional.
Introduction
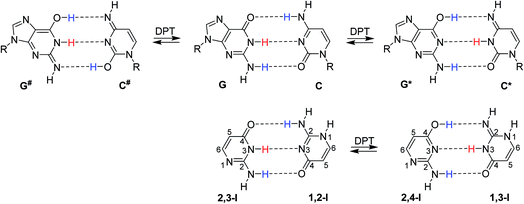
In their seminal work, Watson and Crick stressed the importance of tautomerism of nucleic acid (NA) bases for DNA structure. Other than their canonical tautomers cannot form hydrogen bond complexes with their natural counterparts.1 Soon after the structural determination of DNA, it was hypothesised that rare tautomer formation may result in point mutations during DNA replication.2 A plausible mechanism for the rare tautomer formation is based on proton transfers within the hydrogen-bonded base pair; single-proton transfer (SPT) leads to zwitterionic structures, while double-proton transfer (DPT) leads to hydrogen-bonded pairs of two rare tautomers.Several computational studies have suggested that, at least for the guanine–cytosine (G–C) base pair, DPT would lead to structures stable enough to induce DNA damage by base-pair mismatches.3–8 The G*–C* base pair, resulting after the transfer of guanine H1 to cytosine and back transfer of cytosine H4 to guanine (Fig. 1), was found as a stable product of DPT in these studies. On the other hand, the G#–C# pair, resulting after double amino proton transfer, was calculated to be unstable.3,6,7 Despite considerable experimental effort,9–13 no conclusive confirmation or rejection of DPT in DNA base pairs could be made so far.
While the concept of hydrogen bonding is widely accepted and exploited in chemistry, the small mass of the hydrogen atom means that hydrogen bonds are intrinsically quantum mechanical and that zero-point energy and tunnelling can be of critical importance.14,15 It has been suggested that nuclear quantum effects (NQEs) can change the relative stability of tautomeric forms of base pairs.16 It has also been hypothesised that proton tunnelling within the hydrogen-bonded base pair could significantly enhance the formation of rare tautomers.17 The importance of NQEs for DPT in the 7-azaindole dimer has been revealed by isotopic substitutions; an increase of the DPT product lifetime by one order of magnitude was found upon deuteration.18
The quantum dynamics of A–T and G–C base pairs have been studied by Villani,6,19–21 and an effective quantal potential including mass-dependent quantum effects has been constructed by Shigeta et al.22 The influence of quantum tunnelling on DPT in the A–T base pair has recently been studied by solving the time-dependent master equation for the density matrix, and it was found that tunnelling is unlikely to be a significant mechanism for DPT in A–T pairs.23 In contrast, quantum fluctuations have been found to be crucial, for example, in hydrogen bond interactions in excited states of DNA base pairs,18,24,25 in hydrogen-bonded polypeptide strands,26 and in enzyme reactions.27–31
A convenient way to incorporate NQEs into quantum chemical calculations is through path integral molecular dynamics (PIMD). PIMD simulations use an isomorphism between quantum particles and extended sets of classical particles. Each quantum particle is represented by a set of “beads” connected with harmonic springs; the force constant of the oscillator depends on the nuclear mass and temperature. Light nuclei and low temperatures lead to more delocalised nuclei. Car–Parrinello-based PIMD has been employed to investigate the role of NQEs in the DPT between isolated simplified mimics of DNA base pairs.16 Accounting for NQEs led to a near complete suppression of the reverse barrier from the rare to the canonical tautomers. It has also been predicted from PIMD simulations that NQEs increase the interaction strength of G–C and A–T base pairs by ca. 0.5 kcal mol−1 at room temperature.32 The average N–H bond lengths have been found to be longer in path integral Monte Carlo (PIMC) simulations of the isolated G–C base pair using semiempirical electronic structure methods than in classical simulations.33,34
Here, we study the NQEs by examining deuterium isotope induced changes of nitrogen chemical shifts in model 15N-labelled base pairs. Isotope effects are a consequence of NQEs, because ro-vibrational averaging of different isotopologues gives rise to different magnetic shielding of the nuclei by the electrons. It has been shown recently that deuterium-induced chemical shift changes can be predicted with excellent agreement with the experiment by combining path integral molecular dynamics simulations with density functional theory (DFT) calculations of nuclear shielding.35,36 These calculations thus can directly link the observable isotope-induced shifts with NQEs.
Isocytosine is a structural analogue of cytosine and provides a unique opportunity to study hydrogen bonding interactions, because the two stable tautomers of isocytosine (1,2-I and 2,3-I, Fig. 1) can form hydrogen-bonded dimers in the same way as the guanine and cytosine canonical base pair. The hydrogen-bonded dimer is found in the crystal structure of isocytosine,37,38 and both stable tautomers are also found in solution.39,40
Results
Solution NMR
NMR spectra of isocytosine in solution at room temperature exhibit broad signals due to fast interconversion between 1,2-I and 2,3-I tautomers (Fig. 2). Experiments at lower temperatures are necessary to slow down the exchange. We tested several solvents and solvent mixtures for their application in low temperature NMR measurements of isocytosine (Fig. S1 in the ESI†), and deuterated dimethyl formamide (DMF-d7) was found to be suitable for experiments down to −70 °C. Mixing dimethylether (DME) with DMF-d7 in a 1![[thin space (1/6-em)]](https://www.rsc.org/images/entities/char_2009.gif) :
:![[thin space (1/6-em)]](https://www.rsc.org/images/entities/char_2009.gif) 1 (w/w) ratio decreased the freezing point of the mixture to about −130 °C and allowed us to acquire well-resolved NMR signals down to −120 °C.
1 (w/w) ratio decreased the freezing point of the mixture to about −130 °C and allowed us to acquire well-resolved NMR signals down to −120 °C.
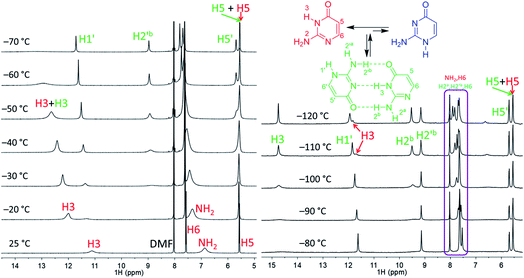 | ||
| Fig. 2 Part of the 1H NMR spectra of isocytosine measured in DMF-d7 (left) and in DME/DMF-d7 (right) at variable temperatures. Expansion of the violet box is shown in the ESI (Fig. S4†). Chemical shifts are tabulated in Table S1.† | ||
Low temperature 1H NMR spectra of isocytosine in DMF-d7 are shown in Fig. 2. Two isocytosine tautomers are observable already at about −30 °C. The signal assignment is based on H,H-COSY and H,C-HMBC experiments (Fig. S2 in the ESI†). For example, a three-bond coupling between H1′ and H6′ confirmed the identity of the minor tautomer 1,2-I. Quantification of the two isocytosine tautomers by integration of H5 and H5′ signals revealed measurable changes in the tautomer ratio, from 4![[thin space (1/6-em)]](https://www.rsc.org/images/entities/char_2009.gif) :
:![[thin space (1/6-em)]](https://www.rsc.org/images/entities/char_2009.gif) 3 at −80 °C to almost 1
3 at −80 °C to almost 1![[thin space (1/6-em)]](https://www.rsc.org/images/entities/char_2009.gif) :
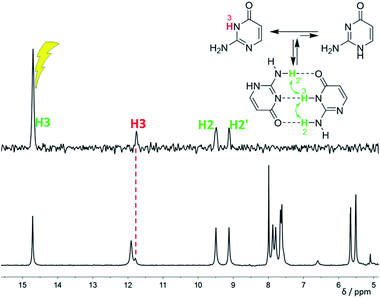
:![[thin space (1/6-em)]](https://www.rsc.org/images/entities/char_2009.gif) 1 at −120 °C. This is caused by the stabilisation of the minor tautomer by the formation of a dimer with the major tautomer, similarly to in the solid isocytosine.40 Intermolecular hydrogen bonding interactions can be inferred from the deshielding of H3 (signal at 14.7 ppm) and one of the two NH2 hydrogens in both tautomers (H2b and H2′b at 9.5 and 9.2 ppm, respectively). A nuclear Overhauser effect (NOE) experiment measured at −120 °C further confirmed the existence of the isocytosine dimer (Fig. 3); irradiation of the H3 signal revealed spatial proximity of this hydrogen to both the H2b and H2′b hydrogen atoms involved in the hydrogen bonding interactions. Low-temperature 15N NMR spectra of 15N-labelled isocytosine are shown in the ESI (Fig. S3†). The nitrogen signals of the isocytosine monomer (2,3-I) and dimer are well resolved at −130 °C. While signals of the free major tautomer 2,3-I are clearly visible in the low-temperature spectra (Fig. 2, S3†), no signals of the free minor tautomer are observed.
1 at −120 °C. This is caused by the stabilisation of the minor tautomer by the formation of a dimer with the major tautomer, similarly to in the solid isocytosine.40 Intermolecular hydrogen bonding interactions can be inferred from the deshielding of H3 (signal at 14.7 ppm) and one of the two NH2 hydrogens in both tautomers (H2b and H2′b at 9.5 and 9.2 ppm, respectively). A nuclear Overhauser effect (NOE) experiment measured at −120 °C further confirmed the existence of the isocytosine dimer (Fig. 3); irradiation of the H3 signal revealed spatial proximity of this hydrogen to both the H2b and H2′b hydrogen atoms involved in the hydrogen bonding interactions. Low-temperature 15N NMR spectra of 15N-labelled isocytosine are shown in the ESI (Fig. S3†). The nitrogen signals of the isocytosine monomer (2,3-I) and dimer are well resolved at −130 °C. While signals of the free major tautomer 2,3-I are clearly visible in the low-temperature spectra (Fig. 2, S3†), no signals of the free minor tautomer are observed.
To determine the deuterium-induced changes of nitrogen chemical shifts in the isocytosine dimer, a few drops of CD3OD were added to a 15N-labeled isocytosine sample in DME/DMF-d7 solvent mixture in order to partially deuterate isocytosine exchangable protons. The signals of 1H and 2H-isocytosine (in a ca. 1![[thin space (1/6-em)]](https://www.rsc.org/images/entities/char_2009.gif) :
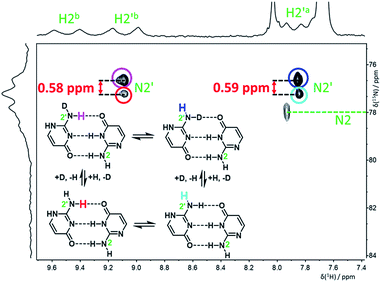
:![[thin space (1/6-em)]](https://www.rsc.org/images/entities/char_2009.gif) 1 ratio) were clearly observable in the 15N spectrum measured at −120 °C (Fig. S5†). An H,N-HSQC experiment was used to assign partially overlapped nitrogen resonances of the amino groups N2 and N2′ (Fig. 4). The signals of N2 are still too broad at this temperature to accurately extract the deuterium isotope shifts, but the chemical shift change caused by both isotope exchanges (H2′a and H2′b) at N2′ could be determined separately (Table 1).
1 ratio) were clearly observable in the 15N spectrum measured at −120 °C (Fig. S5†). An H,N-HSQC experiment was used to assign partially overlapped nitrogen resonances of the amino groups N2 and N2′ (Fig. 4). The signals of N2 are still too broad at this temperature to accurately extract the deuterium isotope shifts, but the chemical shift change caused by both isotope exchanges (H2′a and H2′b) at N2′ could be determined separately (Table 1).
Solid isocytosine – NMR
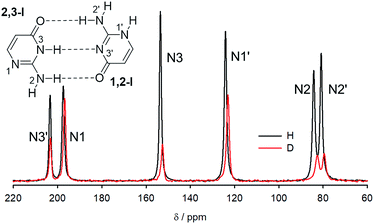
15N NMR spectra of crystalline 15N-labelled isocytosine and isocytosine deuterated at all labile positions are shown in Fig. 5, and the experimental differences between the nitrogen chemical shifts of the H/D forms of isocytosine are summarised in Table 2. The chemical shifts are always lower in the deuterated form.| N2 | N2′ | N3 | N1′ | N1 | N3′ | |
|---|---|---|---|---|---|---|
| Type | NH2 | NH2 | NH | NH | N | N |
| a Calculated by convoluting all N–H/N–D distance probability distributions obtained from PIMD simulations with N–H distance dependence of the nitrogen shielding. b Calculated from the PIMD differences of average NX–H/NX–D distances involving the nitrogen NX atom. | ||||||
| Δδexp | 1.64 | 1.38 | 0.95 | 1.13 | 0.65 | 0.16 |
| Δδcalca | 1.91 | 1.49 | 0.90 | 1.20 | −0.03 | −0.47 |
| Δδcalcb | 1.68 | 1.31 | 0.86 | 1.19 | ||
Calculations
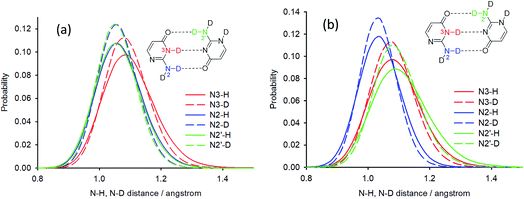
Deuterium isotope shifts of nitrogen nuclei in infinite crystals of isocytosine were modelled by a combination of PIMD simulations and shielding calculations using the CASTEP program,41 which is a DFT-based code that uses planewaves as basis sets to model the periodically repeating images of crystal unit cells. A method for the accurate prediction of the deuterium isotope shifts has recently been developed and has been shown to provide excellent agreement with experiments for molecular solids and isolated systems with intramolecular hydrogen bonds.35,36,42 The method is based on the convolution of the probability distributions of selected bond distances obtained from PIMD simulations with the shielding dependence of a particular nucleus on the bond distance. We use this “functional” approach here instead of direct NMR calculations for geometry snapshots from the simulation trajectories, because it significantly reduces the computation time and avoids the slow convergence of the calculated NMR data with the number of snapshots.43The geometry of crystalline isocytosine was optimised prior to the PIMD simulation. The optimised positions of non-H atoms were almost identical to those found in the X-ray structure (see Fig. S6 in the ESI†). Selected probability distributions of N–H and N–D distances obtained from the PIMD simulations are shown in Fig. 6a. The N–D distance distributions are slightly narrower and slightly shifted to smaller distances. The differences between the N–H and N–D distance distributions led to the observation of isotope-induced shifts. No intermolecular proton transfer was observed during the PIMD simulation; all hydrogen atoms were always closer to the hydrogen bond donor than to the hydrogen bond acceptor.
The contribution of all N–H/N–D distance distributions to all nitrogen shieldings was calculated, and the sum of these contributions provided the deuterium isotopic shifts of the protonated/deuterated nitrogen atoms (N2, N3, N1′ and N2′) in very good agreement with the experiment (Table 2). A worse agreement was observed for the tertiary nitrogen atoms N1 and N3′. These atoms are not directly attached to a hydrogen atom, but they are involved in intermolecular hydrogen bonds (intra-dimer N3′⋯H3 and inter-dimer N1⋯H2a), and the closest hydrogen atoms are ca. 2 Å apart. However, the changes in the distant N–H distances upon deuteration are probably not the most important geometry coordinates causing differences in the shielding of tertiary nitrogens; valence and torsion angle differences probably significantly contribute to the isotope shifts. On the other hand, the most important contribution to the isotope shifts of nitrogen atoms bearing a hydrogen atom is always the change of the N–H distance. When only the differences in the average NX–H distances upon deuteration obtained from the PIMD simulations are used for the isotope shift calculation of nitrogen NX, the agreement is also excellent for all nitrogens bearing a hydrogen atom (Table 2). This probably reflects the almost linear N–H distance dependence of the investigated nitrogen shieldings (see Fig. S7 in the ESI†).
Encouraged by the very good agreement of the calculated deuterium isotope shifts for solid isocytosine, we used the CASTEP program with the PBE functional for the isolated isocytosine dimer as well, although we noticed significant differences between the isocytosine dimer structures optimised with the PBE functional and those optimised with the hybrid B3LYP functional (see the ESI†). The B3LYP-optimised structure was much closer to that optimised at the MP2 level. It has already been found previously that hybrid functionals perform better than GGA functionals when compared to MP2 results (hydrogen bond lengths and interaction energies).16,44 Other calculations have stressed the importance of the base-pair environment (surrounding water molecules and stacked base pairs) for DPT.45
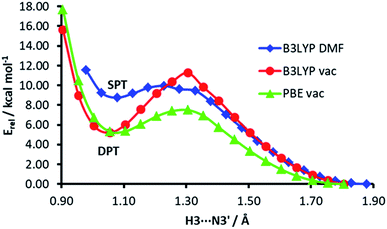
The energy profiles of H3⋯N3′ distance scans at different computational levels are depicted in Fig. 7. The H3⋯N3′ distance was systematically varied and the geometry of the rest of the dimer was allowed to relax. When the computations are performed in vacuum, both functionals, PBE and B3LYP, show a clear energy minimum corresponding to double proton transfer (H3 to N3′ and H2′b to O4). The energy barrier is ca. 4 kcal mol−1 higher in the B3LYP calculations. On the other hand, in the calculations with the B3LYP functional and implicit solvent simulation, only a single proton transfer (H3 to N3′) is observed, but the minimum of this structure is very shallow (the energy barrier for back isomerisation is lower than 0.5 kcal mol−1).
Calculations with hybrid functionals are computationally very demanding for plane-wave sets. Note also that previous PIMD simulations of nucleic acid base pairs were performed with the GGA functionals only (BLYP or optB88-vdW).16,32 The most significant difference in the N–H bond distance probabilities between the PIMD simulations of solid isocytosine and those of the dimer is the significantly broader N2′–H2′b probability distribution, which is also shifted to longer distances and is substantially asymmetric with higher probabilities of large distances (Fig. 6b). The largest N2′–H2′b distance found in the simulation (1.63 Å) is substantially longer than the shortest H2′b⋯O4 distance (1.01 Å). This simulation therefore exhibits features of hydrogen transfer between the N2′ donor and the O4 acceptor. However, hydrogen-to-deuterium exchange leads to large changes in the N2′–H2′b probability distribution (Fig. 6b) and a large isotopic shift of N2′ (1.20 ppm), which is more than twice as large as the calculated isotopic shift for the exchange of hydrogen H2′a attached to the same nitrogen N2′ but not involved in the hydrogen bond (Table 1). This calculation is thus in clear disagreement with the experiment, where the exchange of both hydrogen atoms at the nitrogen N2′ caused almost identical changes in the 15N chemical shift.
The PIMD simulations with the PBE functional indicated that this computational method is not capable of correctly accounting for NQEs in the isolated isocytosine dimer. Therefore, we performed new PIMD simulations using the hybrid B3LYP functional. The N2′–H2′b distance probability distribution (Fig. 8) exhibits large dependence on the computational method. The B3LYP functional provides shorter N2′–H2′b distances; simulation in a dielectric continuum mimicking the solvent leads to further shortening of the N2′–H2′b distance, narrowing, and loss of the asymmetric tail at large distances. Calculation of the deuterium-induced isotope shifts of N2′ using the B3LYP/H2O probability distributions provides identical values for the exchange of both hydrogen atoms attached to N2′, and their values (0.7 ppm) are close to those from the experiment (0.6 ppm, Table 1).
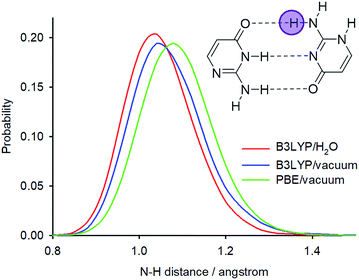 | ||
| Fig. 8 N2′–H2′b distance probability distributions obtained from PIMD simulations at different computational levels. | ||
Conclusions
The formation of the hydrogen-bonded complex of two tautomers of isocytosine in solution was confirmed by low-temperature NMR spectroscopy experiments. Site-selective deuterium isotope-induced changes of nitrogen chemical shifts were determined using partly deuterated 15N-labelled isocytosine dimer in solution and fully deuterated solid isocytosine.The experimental isotope-induced changes of nitrogen chemical shifts were compared with those predicted by a combination of PIMD simulations with DFT calculations of nuclear shielding; N–H or N–D distance probability distributions obtained from PIMD simulations were convoluted with calculated distance dependence of nitrogen shielding values to obtain predictions of nitrogen shieldings that include NQEs.
Significant differences in the accuracy of isotope shift predictions were observed for different theoretical levels of the PIMD simulations. The N–H distance probability distributions of one amino group are much broader in the PBE simulation than in the B3LYP simulation and have an asymmetric tail with non-zero probability of an intermolecular proton transfer from the amino group donor to oxygen acceptor. However, the PBE probability distributions predict deuterium isotope shifts two times larger than those observed experimentally. On the other hand, the PIMD simulations with the hybrid B3LYP functional provide isotope shift predictions in excellent agreement with the experiment and no proton transfer is observed in these simulations.
The low probability of DPT is also supported by the calculated energy profiles of the H3⋯N3′ distance, which show that the energy minimum corresponding to DPT disappears when the hybrid functional and simulated solvent are used in the calculations. A question arises whether the proton transfers observed in previous PIMD simulations of the guanine–cytosine base pair were consequences of the use of imprecise GGA functionals.
In summary, comparing the deuterium-induced changes of 15N chemical shifts with those predicted by PIMD simulations shows that inter-base proton transfer reactions do not take place in the isocytosine dimer. It is demonstrated, however, that NMR isotope shifts provide a unique possibility to study NQEs and to evaluate the accuracy of computational methods used for modelling quantum effects in molecules.
Methods
15N-labelled isocytosine was prepared according to a previously published procedure.39 Guanidine hydrochloride (105 mg, 1.07 mmol) was slowly added in three portions to a stirred solution of 20% fuming sulphuric acid (0.57 mL) at 0 °C. Then, malic acid (119 mg, 0.89 mmol) was added and the flask was immersed in an oil bath (100 °C). The reaction mixture was heated for 1.5 h (after 45 minutes, evolution of carbon monoxide stopped). The reaction mixture was cooled and poured onto ice, and the pH of the resulting solution was adjusted to ∼9 with a solution of NaOH (1 M). The product was isolated on a DOWEX50 (H+) column (washing with water, elution with aq. ammonia (5%)). Fractions containing the product were evaporated and re-chromatographed on a silica gel column (mobile phase: ethyl acetate![[thin space (1/6-em)]](https://www.rsc.org/images/entities/char_2009.gif) :
:![[thin space (1/6-em)]](https://www.rsc.org/images/entities/char_2009.gif) acetone
acetone![[thin space (1/6-em)]](https://www.rsc.org/images/entities/char_2009.gif) :
:![[thin space (1/6-em)]](https://www.rsc.org/images/entities/char_2009.gif) ethanol
ethanol![[thin space (1/6-em)]](https://www.rsc.org/images/entities/char_2009.gif) :
:![[thin space (1/6-em)]](https://www.rsc.org/images/entities/char_2009.gif) water, 17
water, 17![[thin space (1/6-em)]](https://www.rsc.org/images/entities/char_2009.gif) :
:![[thin space (1/6-em)]](https://www.rsc.org/images/entities/char_2009.gif) 3
3![[thin space (1/6-em)]](https://www.rsc.org/images/entities/char_2009.gif) :
:![[thin space (1/6-em)]](https://www.rsc.org/images/entities/char_2009.gif) 3
3![[thin space (1/6-em)]](https://www.rsc.org/images/entities/char_2009.gif) :
:![[thin space (1/6-em)]](https://www.rsc.org/images/entities/char_2009.gif) 2) to afford 41 mg (38%) of 15N3-isocytosine as a crystalline solid. Crystalline deuterated 15N3-isocytosine was then obtained after co-evaporation of the material with D2O followed by EtOD.
2) to afford 41 mg (38%) of 15N3-isocytosine as a crystalline solid. Crystalline deuterated 15N3-isocytosine was then obtained after co-evaporation of the material with D2O followed by EtOD.
1H, 13C and 15N NMR spectra were recorded on a 500 MHz NMR spectrometer (1H at 500 MHz, 13C at 125.7 MHz and 15N at 50.7 MHz) in DMF-d7 (referenced to the solvent signals δ = 2.75 (1H), 104.9 (15N) and 163.15 ppm (13C), respectively) or in a DMF-d7–DME (1![[thin space (1/6-em)]](https://www.rsc.org/images/entities/char_2009.gif) :
:![[thin space (1/6-em)]](https://www.rsc.org/images/entities/char_2009.gif) 1 w/w) solvent mixture. Complete signal assignment is based on the heteronuclear correlation experiments, HSQC and HMBC. The 15N chemical shifts were determined using a 1D experiment with direct detection of nitrogens and gated decoupling of the hydrogen nuclei. High-resolution 15N solid state NMR spectra were obtained using the same spectrometer. Samples were packed into 3.2 mm magic angle spinning (MAS) rotors and measurements were taken at a MAS rate of 12 kHz using cross polarization (CP) with 4 ms contact time, 5 s recycle delay and 40 ms acquisition time. The 15N spectra were referenced by setting the nitrogen signal from a replacement sample of α-glycine to 34.1 ppm.
1 w/w) solvent mixture. Complete signal assignment is based on the heteronuclear correlation experiments, HSQC and HMBC. The 15N chemical shifts were determined using a 1D experiment with direct detection of nitrogens and gated decoupling of the hydrogen nuclei. High-resolution 15N solid state NMR spectra were obtained using the same spectrometer. Samples were packed into 3.2 mm magic angle spinning (MAS) rotors and measurements were taken at a MAS rate of 12 kHz using cross polarization (CP) with 4 ms contact time, 5 s recycle delay and 40 ms acquisition time. The 15N spectra were referenced by setting the nitrogen signal from a replacement sample of α-glycine to 34.1 ppm.
The studied structures were subjected to geometry optimization at the DFT level using the B3LYP functional,46,47 a standard 6-31+G* basis set, and the polarizable continuum model (PCM) used for implicit DMF or water solvation.48,49 Empirical dispersion correction according to Grimme was used in some calculations.50 NMR shielding values were calculated for the optimised structures. The Gaussian09 program package51 was used throughout this study, except for when CASTEP was used. The vibrational frequencies and free energies were calculated for all of the optimized structures, and the stationary point character (a minimum or first-order saddle point) was thus confirmed.
The dependence of nitrogen shieldings on the N–H bond distances was calculated by manually adjusting the bond distance d in the range d − 0.1 Å, d Å, d + 0.1 Å, d + 0.2 Å. The calculated distance dependence of the shielding values was fitted to a quadratic function.
Path integral molecular dynamics (PIMD) simulations of solid isocytosine were run in the CASTEP program,41 which is a DFT-based code, using an NVT ensemble maintained at a constant temperature of 300 K using a Langevin thermostat, a 0.5 fs integration time step, a simulation length of 9 ps, ultrasoft pseudopotentials,52 a planewave cutoff energy of 300 eV, and with integrals taken over the Brillouin zone using a Monkhorst–Pack53 grid of a minimum k-point sampling of 0.1 Å−1. Electron-correlation effects were modelled using the generalized gradient approximation of Perdew, Burke and Ernzerhof.54 The atomic positions were optimized at the same computational level prior to the PIMD runs. The path integral was used on top of the DFT-MD simulations, with a Trotter decomposition of all nuclei into P = 16 beads. For the evaluation of deuterium isotope effects, new PIMD simulations were performed with the mass of all exchangeable protons (all N–H protons) adjusted to the mass of deuterium. Probability distributions of the N–H bond distances were plotted with a 0.02 Å step. The PIMD distance probabilities were determined independently for all 16 replicas and then averaged.
The isocytosine dimer was modelled in CASTEP using the same parameters as for the crystalline compound, with the isolated dimer placed in a cubic periodic box of 15 × 15 × 15 Å3.
The PIMD simulations for the isocytosine dimer were also done on the B3LYP/6-31+G* potential energy surface. Grimme’s D3 correction was used in all of the calculations.50 The simulations were performed either in vacuum or in a dielectric continuum representing a liquid environment. The integral equation variant of the polarizable continuum method was used here.55 The combination of the PCM approach with MD simulations is not straightforward as only a fraction of the environmental response is immediate.56 As we are interested here only in distributions under thermal equilibrium, this combination is justified.
The B3LYP calculations are computationally relatively expensive and it is therefore highly desirable to reduce the number of beads needed for a converged nuclear density. Recently, different methods have been suggested to decrease the computational cost of the PIMD simulations without compromising the quality of the calculations.57–59 Here, we employ the PI + GLE method which is based on the generalized Langevin equation (GLE) thermostat combined with PIMD.59 With this choice, it is enough to use only 4 beads to get converged nuclear densities in a sufficient quality for electronic spectroscopy.60,61 The parameters for the GLE thermostat were obtained from ref. 62. The temperature of the simulations was set to 290 K. The time step was set 0.72 fs and the total simulation time was 72 ps. All MD simulations were performed using our in-house ABIN63 code interfaced with the Gaussian09 electronic structure code.51
Conflicts of interest
There are no conflicts of interest to declare.Acknowledgements
The work was supported by the Czech Science Foundation (grant no. 18-11851S).References
- J. D. Watson and F. H. C. Crick, Nature, 1953, 171, 737–738 CrossRef PubMed.
- J. D. Watson and F. H. C. Crick, Nature, 1953, 171, 964–967 CrossRef PubMed.
- J. Florián and J. Leszczyński, J. Am. Chem. Soc., 1996, 118, 3010–3017 CrossRef.
- L. Gorb, Y. Podolyan, P. Dziekonski, W. A. Sokalski and J. Leszczynski, J. Am. Chem. Soc., 2004, 126, 10119–10129 CrossRef PubMed.
- V. Zoete and M. Meuwly, J. Chem. Phys., 2004, 121, 4377–4388 CrossRef PubMed.
- G. Villani, Chem. Phys., 2006, 324, 438–446 CrossRef.
- J. P. Cerón-Carrasco, A. Requena, J. Zúñiga, C. Michaux, E. A. Perpète and D. Jacquemin, J. Phys. Chem. A, 2009, 113, 10549–10556 CrossRef PubMed.
- S. Y. Xiao, L. Wang, Y. Liu, X. S. Lin and H. J. Liang, J. Chem. Phys., 2012, 137, 195101 CrossRef PubMed.
- J. A. DiVerdi and S. J. Opella, J. Am. Chem. Soc., 1982, 104, 1761–1762 CrossRef.
- J. M. Bakker, I. Compagnon, G. Meijer, G. von Helden, M. Kabeláč, P. Hobza and M. S. de Vries, Phys. Chem. Chem. Phys., 2004, 6, 2810–2815 RSC.
- A. Abo-Riziq, B. Crews, L. Grace and M. S. de Vries, J. Am. Chem. Soc., 2005, 127, 2374–2375 CrossRef PubMed.
- L. Belau, K. R. Wilson, S. R. Leone and M. Ahmed, J. Phys. Chem. A, 2007, 111, 7562–7568 CrossRef PubMed.
- S. Urashima, H. Asami, M. Ohba and H. Saigusa, J. Phys. Chem. A, 2010, 114, 11231–11237 CrossRef PubMed.
- X. Z. Li, B. Walker and A. Michaelides, Proc. Natl. Acad. Sci. U. S. A., 2011, 108, 6369–6373 CrossRef.
- M. Ceriotti, W. Fang, P. G. Kusalik, R. H. McKenzie, A. Michaelides, M. A. Morales and T. E. Markland, Chem. Rev., 2016, 116, 7529–7550 CrossRef PubMed.
- A. Pérez, M. E. Tuckerman, H. P. Hjalmarson and O. A. von Lilienfeld, J. Am. Chem. Soc., 2010, 132, 11510–11515 CrossRef PubMed.
- P. O. Löwdin, Rev. Mod. Phys., 1963, 35, 724–732 CrossRef.
- A. Douhal, S. K. Kim and A. H. Zewail, Nature, 1995, 378, 260–263 CrossRef PubMed.
- G. Villani, Chem. Phys., 2005, 316, 1–8 CrossRef.
- G. Villani, J. Chem. Phys., 2008, 128, 114306 CrossRef PubMed.
- G. Villani, Chem. Phys., 2012, 394, 9–16 CrossRef.
- Y. Shigeta, H. Miyachi, T. Matsui and K. Hirao, Bull. Chem. Soc. Jpn., 2008, 81, 1230–1240 CrossRef.
- A. D. Godbeer, J. S. Al-Khalili and P. D. Stevenson, Phys. Chem. Chem. Phys., 2015, 17, 13034–13044 RSC.
- O. H. Kwon and A. H. Zewail, Proc. Natl. Acad. Sci. U. S. A., 2007, 104, 8703–8708 CrossRef PubMed.
- T. Fiebig, M. Chachisvilis, M. Manger, A. H. Zewail, A. Douhal, I. Garcia-Ochoa and A. D. H. Ayuso, J. Phys. Chem. A, 1999, 103, 7419–7431 CrossRef.
- M. Rossi, W. Fang and A. Michaelides, J. Phys. Chem. Lett., 2015, 6, 4233–4238 CrossRef PubMed.
- J. K. Hwang and A. Warshel, J. Am. Chem. Soc., 1996, 118, 11745–11751 CrossRef.
- S. R. Billeter, S. P. Webb, P. K. Agarwal, T. Iordanov and S. Hammes-Schiffer, J. Am. Chem. Soc., 2001, 123, 11262–11272 CrossRef PubMed.
- J. Z. Pu, J. L. Gao and D. G. Truhlar, Chem. Rev., 2006, 106, 3140–3169 CrossRef PubMed.
- D. T. Major, A. Heroux, A. M. Orville, M. P. Valley, P. F. Fitzpatrick and J. L. Gao, Proc. Natl. Acad. Sci. U. S. A., 2009, 106, 20734–20739 CrossRef PubMed.
- L. Wang, S. D. Fried, S. G. Boxer and T. E. Markland, Proc. Natl. Acad. Sci. U. S. A., 2014, 111, 18454–18459 CrossRef PubMed.
- W. Fang, J. Chen, M. Rossi, Y. X. Feng, X. Z. Li and A. Michaelides, J. Phys. Chem. Lett., 2016, 7, 2125–2131 CrossRef PubMed.
- M. Daido, A. Koizumi, M. Shiga and M. Tachikawa, Theor. Chem. Acc., 2011, 130, 385–391 Search PubMed.
- M. Daido, Y. Kawashima and M. Tachikawa, J. Comput. Chem., 2013, 34, 2403–2411 CrossRef PubMed.
- M. Dračínský and P. Hodgkinson, Chem.–Eur. J., 2014, 20, 2201–2207 CrossRef PubMed.
- M. Dračínský, L. Čechová, P. Hodgkinson, E. Procházková and Z. Janeba, Chem. Commun., 2015, 51, 13986–13989 RSC.
- G. Portalone and M. Colapietro, Acta Crystallogr., Sect. E: Struct. Rep. Online, 2007, 63, O1869–O1871 CrossRef.
- M. Dračínský and P. Hodgkinson, RSC Adv., 2015, 5, 12300–12310 RSC.
- M. Dračínský, P. Jansa, K. Ahonen and M. Buděšínský, Eur. J. Org. Chem., 2011, 1544–1551 CrossRef.
- R. Pohl, O. Socha, M. Šála, D. Rejman and M. Dračínský, Eur. J. Org. Chem., 2018 DOI:10.1002/ejoc.201800506.
- S. J. Clark, M. D. Segall, C. J. Pickard, P. J. Hasnip, M. J. Probert, K. Refson and M. C. Payne, Z. Kristallogr., 2005, 220, 567–570 Search PubMed.
- K. Bártová, L. Čechová, E. Procházková, O. Socha, Z. Janeba and M. Dračínský, J. Org. Chem., 2017, 82, 10350–10359 CrossRef PubMed.
- M. Dračínský, P. Bouř and P. Hodgkinson, J. Chem. Theory Comput., 2016, 12, 968–973 CrossRef PubMed.
- A. Bende, Theor. Chem. Acc., 2010, 125, 253–268 Search PubMed.
- J. P. Cerón-Carrasco, J. Zúñiga, A. Requena, E. A. Perpète, C. Michaux and D. Jacquemin, Phys. Chem. Chem. Phys., 2011, 13, 14584–14589 RSC.
- A. D. Becke, J. Chem. Phys., 1993, 98, 5648–5652 CrossRef.
- C. T. Lee, W. T. Yang and R. G. Parr, Phys. Rev. B: Condens. Matter Mater. Phys., 1988, 37, 785–789 CrossRef.
- V. Barone and M. Cossi, J. Phys. Chem. A, 1998, 102, 1995–2001 CrossRef.
- M. Cossi, N. Rega, G. Scalmani and V. Barone, J. Comput. Chem., 2003, 24, 669–681 CrossRef PubMed.
- S. Grimme, J. Antony, S. Ehrlich and H. Krieg, J. Chem. Phys., 2010, 132, 154104 CrossRef PubMed.
- M. J. Frisch, G. W. Trucks, H. B. Schlegel, G. E. Scuseria, M. A. Robb, J. R. Cheeseman, G. Scalmani, V. Barone, B. Mennucci, G. A. Petersson, H. Nakatsuji, M. Caricato, X. Li, H. P. Hratchian, A. F. Izmaylov, J. Bloino, G. Zheng, J. L. Sonnenberg, M. Hada, M. Ehara, K. Toyota, R. Fukuda, J. Hasegawa, M. Ishida, T. Nakajima, Y. Honda, O. Kitao, H. Nakai, T. Vreven, J. A. Montgomery Jr, J. E. Peralta, F. Ogliaro, M. Bearpark, J. J. Heyd, E. Brothers, K. N. Kudin, V. N. Staroverov, R. Kobayashi, J. Normand, K. Raghavachari, A. Rendell, J. C. Burant, S. S. Iyengar, J. Tomasi, M. Cossi, N. Rega, J. M. Millam, M. Klene, J. E. Knox, J. B. Cross, V. Bakken, C. Adamo, J. Jaramillo, R. Gomperts, R. E. Stratmann, O. Yazyev, A. J. Austin, R. Cammi, C. Pomelli, J. W. Ochterski, R. L. Martin, K. Morokuma, V. G. Zakrzewski, G. A. Voth, P. Salvador, J. J. Dannenberg, S. Dapprich, A. D. Daniels, Ö. Farkas, J. B. Foresman, J. V. Ortiz, J. Cioslowski and D. J. Fox, Gaussian 09 Revision D.01 Search PubMed.
- D. Vanderbilt, Phys. Rev. B: Condens. Matter Mater. Phys., 1990, 41, 7892–7895 CrossRef.
- H. J. Monkhorst and J. D. Pack, Phys. Rev. B: Condens. Matter Mater. Phys., 1976, 13, 5188–5192 CrossRef.
- J. P. Perdew, K. Burke and M. Ernzerhof, Phys. Rev.Lett., 1996, 77, 3865–3868 CrossRef PubMed.
- J. Tomasi, B. Mennucci and R. Cammi, Chem. Rev., 2005, 105, 2999–3093 CrossRef PubMed.
- E. Pluhařová, P. Slavíček and P. Jungwirth, Acc. Chem. Res., 2015, 48, 1209–1217 CrossRef PubMed.
- O. Marsalek and T. E. Markland, J. Chem. Phys., 2016, 144, 054112 CrossRef PubMed.
- C. John, T. Spura, S. Habershon and T. D. Kühne, Phys. Rev. E, 2016, 93, 043305 CrossRef PubMed.
- M. Ceriotti, D. E. Manolopoulos and M. Parrinello, J. Chem. Phys., 2011, 134, 084104 CrossRef PubMed.
- D. Hollas, E. Muchová and P. Slavíček, J. Chem. Theory Comput., 2016, 12, 5009–5017 CrossRef PubMed.
- Š. Sršeň, D. Hollas and P. Slavíček, Phys. Chem. Chem. Phys., 2018, 20, 6421–6430 RSC.
- GLE4MD Project: Automatic input generation, http://gle4md.org.
- D. Hollas, O. Svoboda, M. Ončák and P. Slavíček, ABIN, https://github.com/PHOTOX/ABIN, accessed 20 December 2015.
Footnote |
| † Electronic supplementary information (ESI) available: Additional spectra, figures and tables. See DOI: 10.1039/c8fd00070k |
| This journal is © The Royal Society of Chemistry 2018 |

