 Open Access Article
Creative Commons Attribution 3.0 Unported Licence
What is the best or most relevant global minimum for nanoclusters? Predicting, comparing and recycling cluster structures with WASP@N†‡
Scott M.
Woodley
 *a,
Tomas
Lazauskas
 a,
Malcolm
Illingworth
b,
Adam C.
Carter
 b and
Alexey A.
Sokol
 a
a
aUniversity College London, Department of Chemistry, 20 Gordon Street, London WC1H 0AJ, UK. E-mail: Scott.Woodley@ucl.ac.uk
bEPCC, James Clerk Maxwell Building, Peter Guthrie Tait Road, Edinburgh, EH9 3FD, UK
First published on 1st August 2018
Abstract
To address the question posed in the title, we have created, and now report details of, an open-access database of cluster structures with a web-assisted interface and toolkit as part of the WASP@N project. The database establishes a map of connectivities within each structure, the information about which is coded and kept as individual labels, called hashkeys, for the nanoclusters. These hashkeys are the basis for structure comparison within the database, and for establishing a map of connectivities between similar structures (topologies). The database is successfully used as a key element in a data-mining study of (MX)12 clusters of three binary compounds (LiI, SrO and GaAs) of which the database has no prior knowledge. The structures are assessed on the energy landscapes determined by the corresponding bulk interatomic potentials. Global optimisation, using a Lamarckian genetic algorithm, is used to search for low lying minima on the same energy landscape to confirm that the data-mined structures form a representative sample of the landscapes, with only very few structures missing from the close energy neighbourhood of the respective global minima.
1. Introduction
The application of structure prediction in the field of clusters and nanoparticles has resulted in literally millions of structures being discovered for different compounds, systems with different magnetic ordering, systems containing different dopants, or simply systems of different sizes.1–4 Crucially, each system can be described as an energy landscape and the initial target or targets are the location of the global minimum (GM) or the locations of low energy local minima (LM).5 Today when one wants to study a new compound of interest within certain sets of parameters, including stoichiometry, size, environment, etc., a key question springs to mind: is it worth running new simulations that employ one or several contemporary global structure optimisation algorithms? We argue – not necessarily! Thoughtful exploitation of the available data that can be found in the literature presents a viable alternative that turns out to be the most efficient way to discover new structures, materials, and their physics and chemistry.6–14 Similar considerations, apart from size, can be applied to crystal structures, including molecular, metallic, ionic, covalent, or hybrid organic and inorganic frameworks.15–18Another problem encountered by practically every practitioner of global optimisation for structure prediction is how to ascertain that the newly discovered configuration of a particular compound is not known from competitors’ studies, for example, or exists out there under the guise of a different compound of similar stoichiometry, or is not published but is known as a lower ranked local energy minimum (i.e. data that has a rank that is beyond a chosen set threshold for publication). The use of slightly different energy functions, unintentional effects of tolerances both in energy definition and local optimisation, or possibly an intentional bias to match measurable properties (for example, infrared data) will all muddle the waters further.
The choice of the best – or most suitable for the investigator’s purposes – cost (or fitness) function is uncertain, and could be quite different in different studies even on the same system.
To address these challenges, we have developed a database complemented by a toolkit that includes structure comparison as a key element. Aggregating structures and their properties into one place also enables the sophisticated exploration of structural motifs and particular properties and the discovery of structure–property relationships. Databases are not a new concept in materials modelling,19–29 even in the field of nanoclusters.30,31 Crucially, our searchable database generates a map of connections relating different structures. In this article, we describe both the database and the algorithms that generate these mappings, followed by simple showcase examples.
2. Web-assisted structure prediction at the nanoscale (WASP@N)
In the development of the database, our Hive of knowledge, we aimed to arm the scientific community and general public, from professional researchers to school pupils, with a new intelligent tool to search, discover and disseminate structures and properties of new nanoclusters. To allow access and interaction with the Hive, we built a web interface, which we refer to as the WASP toolkit. The mapping between structures and various properties is an essential element, or feature, of the Hive database, which is generated by algorithms that form part of a separate piece of code that we refer to as the Bee software. The Bee software runs on dedicated computing facilities. The WASP interface links the user, the Hive and the Bee software – see Fig. 1. With open access to the Hive, a number of security measures have been employed in order to protect the integrity of the data and the computing facilities from malicious attacks (to complete the analogy, we refer to unwanted visitors to the Hive as hornets).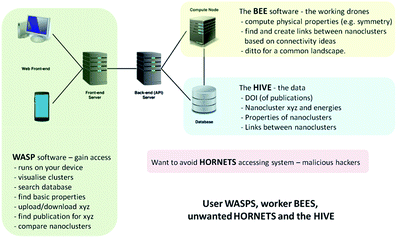 | ||
| Fig. 1 Schematic of the hardware and software solution for web-assisted structure prediction at the nanoscale. | ||
Datasets within the Hive are organised as follows: (a) published atomic structures, the atomic coordinates of which were originally used to generate a figure (e.g. ball and stick models) or were explicitly given in a table as part of a published paper (or electronic supplementary information) that has a DOI; and (b) atomic structures generated using the Bee software. For the former, the atomic structures are labelled using the DOI of the published article they were taken from, and are uploaded as one or more concatenated xyz file(s) using an extended format that contains both the metadata saved on the comment line and the atomic structure, which includes atomic labels: Cartesian coordinates; one additional scalar and one vector record per atom (for example, charges, spin, dipole on atom). Searchable metadata are vital for the use of a database. Values for metadata that can be provided include the definition of energy and software, total charge, energy ranking, total spin, etc. For example, the comment line:
| “Name=drum; Symmetry=D3h; Definition={FHI-aims, PBE0/PBE, tight}; Energy=210Hartree; Size=6; Atoms=12; Charge=0; Spin=0; Dipole=(0,0,0)” |
The essential search and comparison features of WASP enable the user to investigate structural motifs and physical properties. The comparison of clusters can be quite expensive and, therefore, comparison-based pre-searches are performed by the Bee software upon the upload of new datasets, both published and generated. A description of the algorithms employed in these comparisons is provided in the next section. The results of pre-searches are saved as links between (thus establishing) related structures. These links, or new metadata generated by the Bee software, form a map linking different structures in the database. The map can be readily exploited by the user through the WASP interface to ascertain the uniqueness of newly found configurations of clusters of a certain compound and size or to compare clusters of different compounds. Moreover, as we will demonstrate below, this map can also help to reduce the effort needed to explore the energy landscapes of a compound that has yet to be investigated. The computational work and the interaction of the three complementary codes (WASP, Bee, and the Hive) are supported by appropriate hardware solutions – as illustrated in Fig. 1 – and related operating system server software (including task scheduler, etc.). In the near future, we plan to expand the solution shown in Fig. 1 to include the exploitation of third party computing platforms.
3. Methodology
Uniqueness and similarity
Being able to quickly recognise similar structures, or measure their similarity, has always been a challenge in materials modelling.32 Consider comparing the atomic structures of two nanoclusters that are essentially the same but have either small random perturbations (noise) resulting from the applied optimisation tolerances or slight differences because of the different, but similar, density functionals employed. In the comparison procedure, the first task is to correctly align these two configurations: the translation and rotation of each cluster is fixed by positioning the centre of mass at the origin and aligning the principal axes of rotation with the chosen Cartesian axes. Hopefully, upon alignment, a one-to-one match is found for each atom in one configuration with the equivalent atom in the other. If not, then there is a combinatorial problem to solve: which combination of atom pairs minimises the sum of the distances between all pairs (a sum of zero implies a perfect match, with each atom in one configuration positioned exactly on top of the equivalent atom in the other configuration). Minimising this measure of likeness for two dissimilar nanoclusters may also require optimising the relative rotation and translation of the two nanoclusters.The efficiency of stochastic search algorithms – particle swarm, basin hopping, and genetic or evolutionary algorithms – that are employed to locate local minima (LM) on the energy landscape can be improved if there is a computationally cheap method that provides a measure of how similar two structures are. For example, this could be used to check whether a newly found/generated configuration is unique, whether the starting points are sufficiently spread apart for different random walkers on the energy landscape, or whether the candidate structures in the current population are sufficiently diverse for the evolutionary algorithm (otherwise inbreeding results in the population not evolving, or improving, any further). One may also want to distinguish between enantiomorphic clusters – two clusters that are mirror images of each other. One half of such a pair can easily be lost if the comparison of nanoclusters is simply based on their relative energy of formation (since both enantiomorphic clusters have identical energies).
There are several approaches in the literature designed to measure the similarity between structures,33–45 which can be classified in two groups: direct one-to-one comparison or an indirect approach that requires the generation of labels, also known as fingerprints or hashkeys, which are then compared.
One-to-one comparison algorithms are typically based around a cost function that measures the degree of similarity between two structures. As introduced above, the cost function will depend on the successful superimposition of the two structures, i.e. the translation and rotation of one cluster with respect to the other. Where Dirac delta functions are used to describe the position of an atom, the cost function will also depend on the matching of atomic pairs between the structures. This in itself can pose a formidable task (see for example ref. 33, which employs the Hungarian algorithm).34–36 This problem is reduced for compounds or alloys if pairs are restricted between like species. Alternatively, where a Gaussian, or a similar function, is centred on each atom, the cost function is typically based on the degree of overlap of atom-centred Gaussians between the two clusters. For compounds and alloys, the overlap of Gaussians can be determined for each species type; there is no explicit need to match pairs of atoms. Goedecker employed a similar scheme, but based on atomic orbitals (see ref. 37). Both types of cost function can also be employed to find out whether, or how well, a smaller cluster matches a fragment of a larger cluster.
In this article, we only compare pairs of clusters that have the same composition, and use only the species type and atomic coordinates as the input. One of the most straightforward and widely used metrics for the comparison of molecular structures is the root-mean-square deviation (RMSD) of the coordinates of equivalent atoms.38,39 Following a similar idea, the metrics suggested by Ali Sadeghi et al.37 use configurational fingerprints based on eigenvalues of matrices of interatomic distances. The structural fingerprints are then compared by measuring the distances between them, as small fingerprint-based distances correspond to small RMSD distances. The H-FORMS (a hierarchical algorithm for molecular similarity)46 approach estimates a rigid transformation that aligns structures and computes rotation-invariant descriptors, which are then used to match atoms. Similarly, R. Hundt et al. implemented an algorithm in the analysis program KPLOT40 based on the mapping of atomic patterns constructed using three-atom frame matches. An alternative approach to the problem of structure comparison exploits the properties of the nanoclusters,41 such as radial distribution functions, vibrational frequencies42 or principal moments of inertia.
Whichever method is used, when a structure needs to be efficiently compared with vast data for thousands or millions of configurations, the chosen approach needs to be both robust and computationally affordable. The second class of comparison methods – based on comparing unique labels that are generated for every configurationally unique structure – may address this big data challenge.
Within our database, we implemented the approach first adopted in the KLMC software47 to address the challenge of maintaining the diversity of structures during a genetic algorithm search. The approach relies on the NAUTY software package (No AUTomorphisms, Yes?) written by McKay and Piperno,48 which can generate canonical labels for graphs and compute automorphisms between them. NAUTY labels graphs canonically by providing a string consisting of three 8-digit hexadecimal numbers depending on the graph, i.e. a set of vertices and edges, and, in general, every unique graph will have a unique NAUTY string, also known as a hashkey, or fingerprint. By exploiting the feature of uniqueness, we have incorporated NAUTY in the Bee software in the following way: each cluster is converted to a coloured graph by treating the atoms as vertices and the bonds between them as edges. The number of colours of vertices (atoms) is determined by the number of species in the structure. Thus, (MgO)n clusters will have two different colours (species), whereas Tin clusters will have only one. It is important to note that (KF)n clusters will also have two different colours, therefore graphs of (MgO)n and (KF)n clusters of the same size can be compared explicitly. The edges of the clusters’ graphs are generated from the calculated interatomic distances between the atoms (vertices) of a cluster and can be thought of as “bonds” between atoms. The radial cut-off by which the “bonds” are determined depends on the species and is slightly longer than the expected actual bond length. A flowchart of the implemented hashkey generation is given in Fig. 2, where the (MgO)5 GM cluster is used as an example. Here, the (MgO)5 GM cluster (shown as a ball and stick model in Fig. 2a) is transformed into a coloured graph (shown in Fig. 2b). This graph is then processed using the “NAUTY” software package, which in turn generates a unique hashkey for the cluster. An example of a hashkey is shown in Fig. 2d.
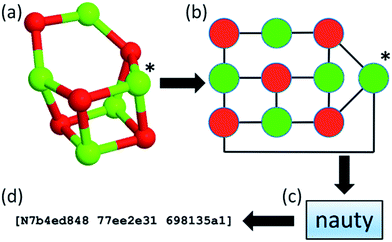 | ||
| Fig. 2 Flowchart of hashkey (fingerprint) generation illustrated using the (MgO)5 global minimum configuration. | ||
Given that the comparison of hashkeys is orders of magnitude faster than comparing atomic structures explicitly, each cluster within the Hive database is labelled with a hashkey. As described above, the hashkeys enable a rapid check of the database for duplicate structures by both the WASP and Bee software and are used in the generation of maps connecting similar structures (the network of links between clusters entered into the database is updated as soon as the atomic coordinates of generated and published LM nanoclusters are uploaded to the Hive) – a feature that is not currently implemented in other structural databases. This feature has proven to be essential when the WASP interface is used to find out whether a newly discovered cluster is already within the Hive. To demonstrate one of the utilities our database provides, we have used the generated hashkeys to identify unique structural motifs for a particular stoichiometry (1![[thin space (1/6-em)]](https://www.rsc.org/images/entities/char_2009.gif) :
:![[thin space (1/6-em)]](https://www.rsc.org/images/entities/char_2009.gif) 1) and size (24 atoms). We then data-mined from this set, rather than a set of LM configurations of one or all compounds in the Hive.
1) and size (24 atoms). We then data-mined from this set, rather than a set of LM configurations of one or all compounds in the Hive.
Data normalisation
Published LM cluster structures, which can be uploaded to the database, are, by definition, dependent upon the theory and accuracy of the level of theory employed in the calculation of energy as a measure of stability. Moreover, the measure of fitness may also be based on the deviation from some geometric, physical or chemical observable(s). When LM on a potential energy landscape are targeted, energy calculations at different levels of theory (quantum mechanical (all-electron or pseudopotential), semi-empirical, Hartree–Fock, DFT, tight-binding, semi-classical, or atomistic simulations) yield values that may scatter across a few orders of magnitude. Even if a similar method is chosen, e.g. DFT with identical basis sets and, possibly, effective core potentials, employing different exchange and correlation density functionals could still lead to substantially different values. The situation is just as problematic if semi-classical simulations are employed, as there are often many different sets of parameterised interatomic potentials for the same material or compound. One trick commonly used across the field of materials chemistry is to switch from total to binding or cohesion energies, which can be expected to behave better, and do in practice.49 The scatter in the calculated binding energy values obtained using different approaches is usually, however, still greater than the energy separating low ranking energy minima on the same energy landscape (definition of energy).In practice, the WASP interface lets users upload their data without any restrictions on how the data were obtained, but encourages the users to provide details of the adopted computational approach as metadata. To support the comparison of individual structures obtained using different energy definitions, we introduced an internal standard attained by a data normalisation routine. In particular, when data are uploaded to the Hive database, they are automatically refined by the Bee software, using the all-electron, full potential electronic structure code FHI-aims50 with the PBEsol functional,51–53 the light basis set (which is variationally equivalent to split valence double-zeta Gaussian plus polarisation basis sets but can obtain energies that are much closer to the basis set limit). Further computational parameters are provided in the ESI.† After normalisation, the newly obtained structure is automatically uploaded to the Hive database with a two-way link between the original and normalised configurations, along with similarity links to the whole dataset in the database.
Hence, the user can search for structures that refine to the same LM on our normalised energy landscape (particularly useful for the investigation of nanoclusters of the same compound) or structures of any compound with the same connectivity (structural motif), as explained in the previous section.
Data mining
Starting from a known set of atomic configurations with the target stoichiometry and total number of atoms, the Data Mining (DM) module of the KLMC software package54 rescales each configuration to obtain an estimate of the expected nearest neighbour interatomic distances for the target compound, and then, using third party software, relaxes the rescaled atomic structures to LM. In the results shown below, we employ GULP55 as the third party software, i.e. a semi-classical level of theory is used for the calculation of energies (and atomic forces). After the rescaling and refinement procedure, KLMC is also employed to analyse the resulting configurations in terms of their energy ranking, uniqueness and geometrical properties.Global optimisation
A Lamarckian genetic algorithm (GA) approach implemented in the KLMC software package47 was also used to locate LM on the energy landscape defined by the same set of interatomic potentials (semi-classical level of theory) as those used in the data-mining investigation. We note that the ability of the KLMC GA47 to locate LM and GM efficiently has been proven for various types of system, and thus it is chosen here as a method for providing reliable data that we can use to assess the results obtained using the data-mining approach. The population of each GA run was set to 200 candidate structures, with the initial random structures generated within a 15 Å × 15 Å × 15 Å cubic simulation box. Default values, as given in ref. 47, were used for the remaining simulation parameters.4. Results
Isomorphic structures, or structural motifs
As an illustration of how the connectivity maps are employed, we consider the case of a GM nanocluster reported in ref. 56 for (MgO)7 that has the symmetry point group C3v; see Fig. 3a. The topological analysis tool finds that this structure has “7Mg3–7O3” topology, i.e. seven Mg and seven O atoms, each with a coordination number of three. When selected using the WASP interface for the Hive, beneath the rotatable ball and stick model of this structure are two lists; one showing the standardised entry for this configuration (as described earlier), and another showing all the “isomorphic structures” found in the Hive based on matching hashkeys (as also described above). A snapshot of the second list is shown in Fig. 4. In our chosen example, the (MgO)7 GM structure currently has eleven isomorphic structures: eleven atomic configurations within the Hive have the same hashkey as our chosen example. The inclusion of a DOI in the entry for a candidate structure in this list indicates that it is a published LM. The remaining five are, therefore, standardised LM (using FHI-aims). As more entries are submitted to the Hive, we would expect many more matches to be found. The six published LM show that this structural motif is also reported54,56,57 to be the GM for (KF)7, (CaO)7, (SrO)7, (BaO)7 and (CdSe)7. There is also another (MgO)7 configuration, which has a different DOI54 to that of the original chosen structure. Given that there are six different compounds with the same structural motif, we would expect six standardised LM. The two published LM entries for (MgO)7, the same compound, relax to the same standardised LM. To find all the nanoclusters within the Hive that relax to the same standardised LM, the user only needs to click on the thumbnail of the standardised nanocluster. In our example, the missing standardised LM results from the standardised configuration for (CdSe)7 relaxing to a different LM. Therefore, it has a different hashkey as it is a different structure (in fact, it has C1 point symmetry).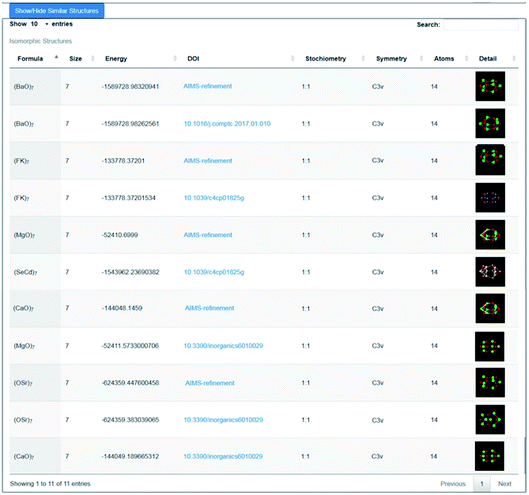 | ||
| Fig. 4 Snapshot of the lower part of the WASP interface showing 11 results (5 generated by the Bee software) returned from the Hive for structures that have the same hashkey as the GM structure for (MgO)7 as reported in ref. 56. | ||
Efficient structure prediction
The Hive contains the LM atomic structures for numerous binary compounds with 1![[thin space (1/6-em)]](https://www.rsc.org/images/entities/char_2009.gif) :
:![[thin space (1/6-em)]](https://www.rsc.org/images/entities/char_2009.gif) 1 stoichiometry and a total charge of 0. We now concentrate on one particular size, clusters composed of 12 cations and 12 anions. To investigate a compound that is missing from the Hive database, one could data-mine structures already in the Hive for a similar compound. The success of this approach would rely on the chosen set of initial configurations; the more extensive this set, the greater the probability of finding the target LM. To maximise this probability one could data-mine all the compounds; however, this would generate many copies of each LM. Using the hashkey, which provides a unique identifier for each structural motif, we were able to reduce this initial set to just over 100 unique structural motifs (which we will refer to as the DM-set). If the database contained entries for alkali halides, (XY)12, and alkaline earth oxides, (ZO)12, for X = Li to Cs, Y = F to I, and Z = Mg to Ba, then potentially there would be a maximum reduction of 96%.
1 stoichiometry and a total charge of 0. We now concentrate on one particular size, clusters composed of 12 cations and 12 anions. To investigate a compound that is missing from the Hive database, one could data-mine structures already in the Hive for a similar compound. The success of this approach would rely on the chosen set of initial configurations; the more extensive this set, the greater the probability of finding the target LM. To maximise this probability one could data-mine all the compounds; however, this would generate many copies of each LM. Using the hashkey, which provides a unique identifier for each structural motif, we were able to reduce this initial set to just over 100 unique structural motifs (which we will refer to as the DM-set). If the database contained entries for alkali halides, (XY)12, and alkaline earth oxides, (ZO)12, for X = Li to Cs, Y = F to I, and Z = Mg to Ba, then potentially there would be a maximum reduction of 96%.
The determination of this reduced set (calculation and comparison of hashkeys) is orders of magnitude faster to perform than the additional structural relaxations (using standard algorithms within an electronic structure code) that would have been necessary if we could not determine equivalent structures. Moreover, data-mining requires the evaluation of far fewer candidate structures than is typically performed in a stochastic approach. It is expected that the number of datasets within the Hive will grow, and that important unique structural motifs may be missed given our search has been performed soon after we have created this database. Stochastic approaches may also miss important LM, and the number of unique motifs is likely to increase much more slowly than the number of entries for clusters of any particular size, charge and stoichiometry.
Using our DM-set of unique LM, we now investigate three different compounds that were not included in the initial dataset taken from the Hive, namely (LiI)12, (SrO)12 and (GaAs)12. As the main focus of this article is the methodology as opposed to the physical and electronic properties of the predicted nanoclusters, we have chosen to present new IP-LM structures, i.e. the atomic configurations and ranks of local minima on the energy landscape are defined using interatomic potentials (IP), the parameters of which are given in Tables 1 and 2. For each compound we also perform a search of low energy IP-LM using an evolutionary algorithm; details of both methods are described in the previous section. We note that the potential parameters for LiI were taken from ref. 58. The small spring constant for the lithium cation caused problems during the global optimisation runs; during the relaxations of new candidate structures (particularly the random structures used in the initial population), the initial electric fields were sometimes strong enough that during structural relaxation the shell was stripped away from the cation. It is known that the polarisability of an ion is dependent upon the electric field, which is much stronger for our clusters than that experienced within the bulk. Thus, in our simulations, we doubled the value of the spring constant for lithium cations, which corresponds to an apparent reduction in their coordination number compared to the bulk.
![[thin space (1/6-em)]](https://www.rsc.org/images/entities/char_2009.gif) exp(−r/ρ) − C/r6, applied between ions X and Y
exp(−r/ρ) − C/r6, applied between ions X and Y
| X–Y | A (eV) | ρ (Å−1) | C (Å6 eV) |
|---|---|---|---|
| Li–Li | 1153.80 | 0.13640 | 0.000 |
| Li–I | 8894.70 | 0.26170 | 0.000 |
| I–I | 5502.50 | 0.30660 | 0.000 |
| Sr–O | 1952.39 | 0.33685 | 19.220 |
| O–O | 22![[thin space (1/6-em)]](https://www.rsc.org/images/entities/char_2009.gif) 764.00 764.00 |
0.14900 | 27.879 |
| Ga–Ga | 470.18 | 0.13490 | 0.000 |
| Ga–As | 1544.69 | 0.42310 | 0.000 |
| As–As | 484.31 | 0.24810 | 0.000 |
| X | Q (e) | Y (e) | k 2 (eV Å−2) | k 4 (eV Å−4) |
|---|---|---|---|---|
| Li | 0.295 | 0.705 | 15.979 | 0 |
| I | 3.087 | −4.087 | 39.950 | 0 |
| Sr | 2.000 | |||
| O | 0.869 | −2.869 | 74.920 | 0 |
| Ga | 3.436 | −0.436 | 2418.361 | 0 |
| As | 0.809 | −3.809 | 7.722 | 300![[thin space (1/6-em)]](https://www.rsc.org/images/entities/char_2009.gif) 000 000 |
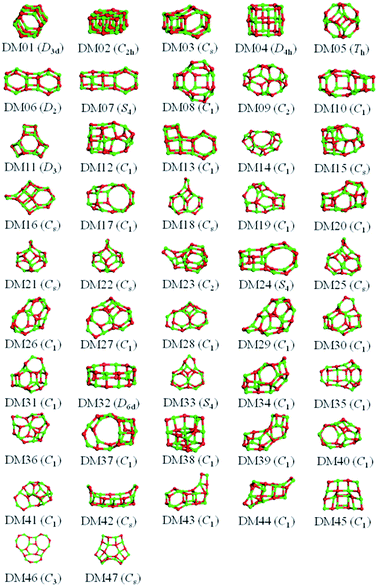
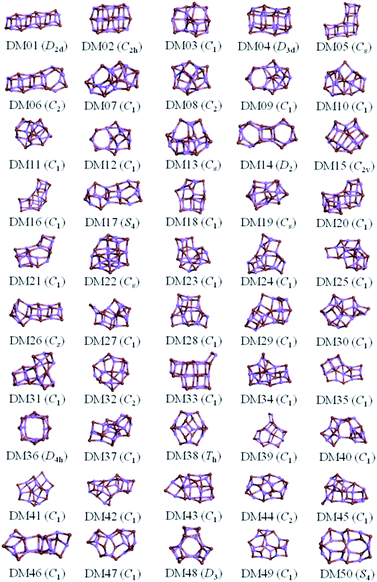
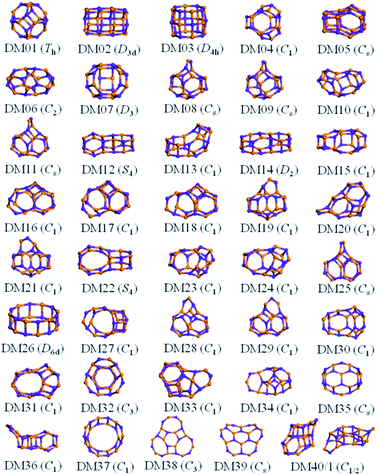
The results from data-mining our DM-set of unique LM are shown in Fig. 5–7. For strontium oxide, lithium iodide and gallium arsenide, 47, 50 and 41 LM structures were generated, respectively, i.e. not all the structural motifs of one compound were locally stable for another. Moreover, a different global minimum was found for each compound. Labelled DM01 in Fig. 5, the D3d barrel was found to be the IP-GM for (SrO)12, whereas for (LiI)12 and (GaAs)12 it was ranked fourth and second, respectively. The 2 × 2 × 6 D2d configuration of alternating atoms, labelled DM01 in Fig. 6, was found to be the IP-GM for (LiI)12. One can imagine that this cuboid configuration could be cut from the NaCl rock salt structure, and thus it is not surprising that this structural motif was not generated for (GaAs)12. The Th sodalite cage, so named as it is a basic building block of the sodalite bulk structure (given the abbreviation SOD by the zeolite community), was found to be the IP-GM for (GaAs)12. This configuration was ranked fifth and thirty-eighth for (SrO)12 and (LiI)12, respectively. Comparing the ball and stick models for different compounds but for the same structural motif, one noticeable difference between the LM for lithium iodide and those of the other two compounds is the sharper (more acute) bond angles that directly result from the greater polarisability of the iodide anion. Essentially, the iodide anions are further out from the cluster’s centre of mass than the lithium cations.
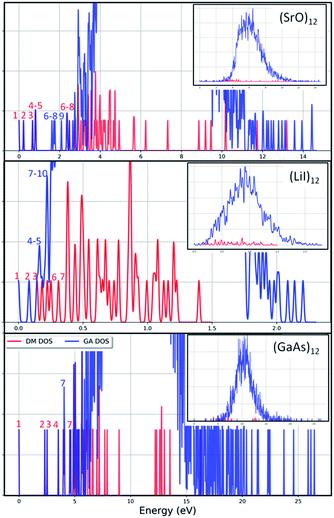
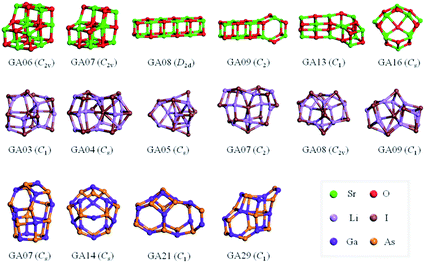
To check the current success of data-mining the Hive for these three compounds, we also conducted global optimisation on each of the three IP-energy landscapes for low lying LM. We present the results as three densities of LM graphs; see Fig. 8. In the panel insert for each compound it is very clear that the data-mined LM present only a sample of all the possible LM. In terms of ranking, fortunately, the missing LM tend to be mid-range rather than at the more stable end (which, typically, is where there is most interest). Looking more closely at the top ranked LM, we identified which IP-LM structures are missing; these are shown in Fig. 9.
For strontium oxide clusters, the first six missing LM were ranked 6, 7, 8, 9, 13 and 16. The first three of these are basic rock-salt cuts that could have been included in our data-mined set if we had included the structures from ref. 54 (we did not as this paper includes data-mined structures for alkaline oxides, one of which is one of the compounds we chose to investigate). The GA08 cuboid configuration was in fact found as the IP-GM for (LiI)12. Generating this LM during the data-mining process was fortuitous given that this structural motif was not included in the DM-set of unique LM. GA09 and GA13 are composed of a n = 6 drum (typically the IP-GM for (XY)6) and 2 × 2 × m cuboids. More interesting is the GA16 configuration, which we have previously seen; it has an unusual distorted planar four-coordinated oxygen anion site.
For lithium iodide clusters, the first six missing LM structures were ranked 3, 4, 5, 7, 8 and 9. Unlike our DM-set, these configurations, which we will refer to as HC, have at least one highly coordinated (greater than 4) anion site and are not one of the possible cuboid cuts from the NaCl rock salt phase. Given the stability of this type of structure, quite a few of the better ranked structures were missed. As already seen, any unstable LM in the DM-set can lead to new structural LM and thus we did not miss all of the HC structures; the enantiomer of GA03 was found (labelled as DM03 in Fig. 6 and ranked equal third).
For gallium arsenide clusters, data-mining the DM-set was much more successful in that only four additional IP-LM structures were found in the top thirty; the first four missing LM structures were ranked 7, 14, 21 and 29. Of these, GA07 is the result of merging IP-GM for n = 6 (a drum) and n = 9 (bubble) across a hexagonal face; GA14 is very similar to the GA16 LM that was missed for (SrO)12; GA21 has the same structural motif as DM18, but with all the anions switched for cations, and vice versa, cf. DM23 and DM24 and also GA06 and GA07 for strontium oxide. We note that the DM and GA runs found different chiral versions of DM23 and DM24.
Finally, we should reiterate that the structures reported above for LiI, SrO and GaAs were obtained on the interatomic potential landscape. These potentials were originally parameterised for bulk compounds, where atoms are typically in higher coordinated environments, and therefore such parameterisations are very limited in scope. For example, arsenide anions are highly polarisable, and more realistic structures should be expected to have more buckled shapes, as seen above in LiI configurations. The latter proved to be easier to optimise due to the relatively low charges on Li and I. Notwithstanding this, the structures obtained here will be uploaded to the Hive and refined using our chosen ab initio approach, which will both give the actual findings more credence for future applications, but will also allow the parameters of the interatomic potentials to be refined. The latter is an important element of machine-learning techniques that have been particularly successful in studies of metallic clusters.59,60
5. Conclusions
We have presented, for the first time, details of our database of published atomic configurations of nanoclusters. We have described the algorithms employed within this database to establish whether two entries are equivalent LM for a particular compound and whether configurations of different compounds are equivalent when judged using connectivity arguments, and have shown how to exploit these data in order to predict structures for three new compounds. The database provides initial model structures that were traditionally obtained from experiments, configurations that can be employed in structure prediction using a data-mining approach, and a way of checking whether a candidate structure is indeed new. Data-mining the set of configurations for (XY)12 structures that have a unique hashkey proved relatively successful in that the top two LM configurations for each of three compounds were found. However, global optimisation techniques are still required for compounds that are chemically distinct enough that their low energy LM structures do not match configurations already in the database, using our connectivity arguments. This will of course change with time, as more data is entered into the database.Lessons learnt in the creation of the Hive and the associated WASP interface as a toolkit will be of direct use for further work on nucleation and crystallisation processes,61 crucially the nucleation and growth of small particles on or in solid supports and liquid environments. The LM atomic configurations in the database are also readily usable as secondary building units (SBU) for constructing crystal structures.6,8,10,62–68 Here, using low energy SBUs that do not resemble cuts from the main phases of the chosen compounds will produce more interesting results.
Conflicts of interest
There are no conflicts to declare.Acknowledgements
The creation of the Hive, WASP interface, and Bee software are all part of the WASP@N five-year project that is supported by EPSRC (grant numbers EP/K038958, K038559). We are grateful for valuable discussions and help from our colleagues who are also part of this project, namely: Jörg Sassmannshausen (University College London, UK), Martijn A. Zwijnenburg (University College London, UK), Roy L. Johnston (University of Birmingham, UK), Stefan T. Bromley (University of Barcelona, Spain), Joseph J. BelBruno (Dartmouth College, USA), Volker Blum (Duke University, USA) and Julian D. Gale (Curtin University, Australia).Notes and references
- M. Chen, et al., Structural and Electronic Property Study of (ZnO)n, n ≤ 168: Transition from Zinc Oxide Molecular Clusters to Ultrasmall Nanoparticles, J. Phys. Chem. C, 2016, 120(36), 20400–20418 CrossRef.
- C. R. A. Catlow, et al., Zinc oxide: a case study in contemporary computational solid state chemistry, J. Comput. Chem., 2008, 29(13), 2234–2249 CrossRef PubMed.
- F. Vines, et al., Size dependent structural and polymorphic transitions in ZnO: from nanocluster to bulk, Nanoscale, 2017, 9(28), 10067–10074 RSC.
- O. Lamiel-Garcia, et al., Predicting size-dependent emergence of crystallinity in nanomaterials: titania nanoclusters versus nanocrystals, Nanoscale, 2017, 9(3), 1049–1058 RSC.
- S. M. Woodley, Nanoclusters and Nanoparticles, in Computational Modeling of Inorganic Nanomaterials, ed. S. T. Bromley and M. A. Zwijnenburg, CRC Press, Taylor and Francis Group, London, 2016, pp. 3–46 Search PubMed.
- J. Carrasco, F. Illas and S. T. Bromley, Ultralow-density nanocage-based metal-oxide polymorphs, Phys. Rev. Lett., 2007, 99(23), 235502 CrossRef PubMed.
- S. T. Bromley, A computational study into the viability of new molecular materials polymorphs based on fully-coordinated inorganic nanoclusters, CrystEngComm, 2007, 9(6), 463–466 RSC.
- S. M. Woodley, et al., Construction of nano- and microporous frameworks from octahedral bubble clusters, Phys. Chem. Chem. Phys., 2009, 11(17), 3176–3185 RSC.
- M. B. Watkins, et al., Bubbles and microporous frameworks of silicon carbide, Phys. Chem. Chem. Phys., 2009, 11(17), 3186–3200 RSC.
- M. Farrow, et al., From stable ZnO and GaN clusters to novel double bubbles and frameworks, Inorganics, 2014, 2(2), 248–263 CrossRef.
- Y. Yong, et al., The Zn12O12 cluster-assembled nanowires as a highly sensitive and selective gas sensor for NO and NO2, Sci. Rep., 2017, 7(1), 17505 CrossRef PubMed.
- Z. Liu, et al., From the ZnO Hollow Cage Clusters to ZnO Nanoporous Phases: A First-Principles Bottom-Up Prediction, J. Phys. Chem. C, 2013, 117(34), 17633–17643 CrossRef.
- B. Wang, X. Wang and J. Zhao, Atomic Structure of the Magic (ZnO)60 Cluster: First-Principles Prediction of a Sodalite Motif for ZnO Nanoclusters, J. Phys. Chem. C, 2010, 114(13), 5741–5744 CrossRef.
- Y. Yong, et al., Theoretical prediction of low-density nanoporous frameworks of zinc sulfide based on ZnnSn (n = 12, 16) nanocaged clusters, RSC Adv., 2014, 4(70), 37333–37341 RSC.
- J. C. Schön and M. Jansen, Determination, prediction, and understanding of structures, using the energy landscapes of chemical systems – Part III, Z. Kristallogr., 2001, 216(7), 361–383 Search PubMed.
- C. Mellot-Draznieks, Role of computer simulations in structure prediction and structure determination: from molecular compounds to hybrid frameworks, J. Mater. Chem., 2007, 17(41), 4348–4358 RSC.
- J. C. Schön and M. Jansen, Determination, prediction, and understanding of structures, using the energy landscapes of chemical systems – Part I, Z. Kristallogr., 2001, 216(6), 307–325 Search PubMed.
- S. M. Woodley and R. Catlow, Crystal structure prediction from first principles, Nat. Mater., 2008, 7(12), 937–946 CrossRef PubMed.
- The NOMAD Laboratory, 2018, http://nomad-repository.eu/.
- ICSD – the Inorganic Crystal Structure Database, 2018, https://www.fiz-karlsruhe.de/en/leistungen/kristallographie/icsd.html.
- Crystallographic and Crystallochemical Database for Minerals and their Structural Analogues, 2018, http://database.iem.ac.ru/mincryst/.
- COD: Crystallography Open Database, 2018, http://www.crystallography.net/cod/.
- Mineralogy Database, 2018, http://webmineral.com/.
- Crystal Lattice-Structures, 2018,https://homepage.univie.ac.at/michael.leitner/lattice/index.html.
- American Mineralogist Crystal Structure Database, 2018, http://rruff.geo.arizona.edu/AMS/amcsd.php.
- CDS National Chemical Database Service, 2018, http://cds.rsc.org/.
- Database of zeolite structures, 2018, http://www.iza-structure.org/databases/.
- The Cambridge Structural Database (CSD), 2018, https://www.ccdc.cam.ac.uk/solutions/csd-system/components/csd/.
- AFLOW: Automatic – Flow for Materials Discovery, 2018, http://aflowlib.org/.
- The Cambridge Energy Landscape Database, 2018, http://www-wales.ch.cam.ac.uk/CCD.html.
- Cn Fullerenes, 2018, http://www.nanotube.msu.edu/fullerene/.
- S. De, et al., Comparing molecules and solids across structural and alchemical space, Phys. Chem. Chem. Phys., 2016, 18(20), 13754–13769 RSC.
- B. Helmich and M. Sierka, Similarity recognition of molecular structures by optimal atomic matching and rotational superposition, J. Comput. Chem., 2012, 33(2), 134–140 CrossRef PubMed.
- H. W. Kuhn, The Hungarian method for the assignment problem, Nav. Res. Logist. Q., 1955, 2(1–2), 83–97 CrossRef.
- H. W. Kuhn, Variants of the Hungarian method for assignment problems, Nav. Res. Logist. Q., 1956, 3(4), 253–258 CrossRef.
- J. Munkres, Algorithms for the Assignment and Transportation Problems, J. Soc. Ind. Appl. Math., 1957, 5(1), 32–38 CrossRef.
- A. Sadeghi, et al., Metrics for measuring distances in configuration spaces, J. Chem. Phys., 2013, 139(18), 184118 CrossRef PubMed.
- A. McLachlan, A mathematical procedure for superimposing atomic coordinates of proteins, Acta Crystallogr., Sect. A: Cryst. Phys., Diffr., Theor. Gen. Crystallogr., 1972, 28(6), 656–657 CrossRef.
- A. Wagner and H.-J. Himmel, aRMSD: A Comprehensive Tool for Structural Analysis, J. Chem. Inf. Model., 2017, 57(3), 428–438 CrossRef PubMed.
- R. Hundt, et al., CCL: an algorithm for the efficient comparison of clusters, J. Appl. Crystallogr., 2013, 46(3), 587–593 CrossRef PubMed.
- S. Alexander, Structure identification methods for atomistic simulations of crystalline materials, Modell. Simul. Mater. Sci. Eng., 2012, 20(4), 045021 CrossRef.
- Y. Dong, et al., Analyzing the properties of clusters: Structural similarity and heat capacity, Comput. Theor. Chem., 2013, 1021, 16–25 CrossRef.
- C. X. Su, et al., Construction of crystal structure prototype database: methods and applications, J. Phys.: Condens. Matter, 2017, 29(16), 165901 CrossRef PubMed.
- B. Schaefer and S. Goedecker, Computationally efficient characterization of potential energy surfaces based on fingerprint distances, J. Chem. Phys., 2016, 145(3), 034101 CrossRef PubMed.
- J. A. Chisholm and S. Motherwell, COMPACK: a program for identifying crystal structure similarity using distances, J. Appl. Crystallogr., 2005, 38, 228–231 CrossRef.
- A. Ramirez-Manzanares, et al., A hierarchical algorithm for molecular similarity (H-FORMS), J. Comput. Chem., 2015, 36(19), 1456–1466 CrossRef PubMed.
- T. Lazauskas, A. A. Sokol and S. M. Woodley, An efficient genetic algorithm for structure prediction at the nanoscale, Nanoscale, 2017, 9(11), 3850–3864 RSC.
- B. D. McKay and A. Piperno, Practical graph isomorphism, II, J. Symbolic Comput., 2014, 60, 94–112 CrossRef.
- C. R. A. Catlow, et al., Modelling nano-clusters and nucleation, Phys. Chem. Chem. Phys., 2010, 12(4), 786–811 RSC.
- V. Blum, et al., Ab initio molecular simulations with numeric atom-centered orbitals, Comput. Phys. Commun., 2009, 180(11), 2175–2196 CrossRef.
- J. P. Perdew, K. Burke and M. Ernzerhof, Generalized Gradient Approximation made simple, Phys. Rev. Lett., 1996, 77(18), 3865 CrossRef PubMed.
- J. P. Perdew, K. Burke and M. Ernzerhof, Generalized Gradient Approximation Made Simple, Phys. Rev. Lett., 1996, 77, 3865 CrossRef PubMed ; Phys. Rev. Lett., 1997. 78(7): p. 1396.
- J. P. Perdew, et al., Restoring the density-gradient expansion for exchange in solids and surfaces, Phys. Rev. Lett., 2008, 100(13), 136406 CrossRef PubMed.
- S. Escher, et al., Synthesis Target Structures for Alkaline Earth Oxide Clusters, Inorganics, 2018, 6(1), 29 CrossRef.
- J. D. Gale and A. L. Rohl, The General Utility Lattice Program (GULP), Mol. Simul., 2003, 29(5), 291–341 CrossRef.
- M. R. Farrow, Y. Chow and S. M. Woodley, Structure prediction of nanoclusters; a direct or a pre-screened search on the DFT energy Landscape?, Phys. Chem. Chem. Phys., 2014, 16(39), 21119–21134 RSC.
- S. G. E. T. Escher, et al., Structure prediction of (BaO)n nanoclusters for n ≤ 24 using an evolutionary algorithm, Comput. Theor. Chem., 2017, 1107, 74–81 CrossRef.
- C. R. A. Catlow, M. J. Norgett and T. A. Ross, Ion transport and interatomic potentials in the alkaline-earth-fluoride crystals, J. Phys. C: Solid State Phys., 1977, 10(10), 1627 CrossRef.
- C. Zeni, et al., Building machine learning force fields for nanoclusters. 2018, https://arxiv.org/abs/1802.01417.
- A. P. Bartók, et al., Machine learning unifies the modeling of materials and molecules, Sci. Adv., 2017, 3(12), e1701816 CrossRef PubMed.
- C. Leitold and C. Dellago, Nucleation and structural growth of cluster crystals, J. Chem. Phys., 2016, 145(7), 074504 CrossRef PubMed.
- C. Mellot-Draznieks, et al., Computational design and prediction of interesting not-yet-synthesized structures of inorganic materials by using building unit concepts, Chem.–Eur. J., 2002, 8(18), 4103–4113 CrossRef.
- Z. Liu, et al., From the ZnO Hollow Cage Clusters to ZnO Nanoporous Phases: A First-Principles Bottom-Up Prediction, J. Phys. Chem. C, 2013, 117(34), 17633–17643 CrossRef.
- Z. F. Liu, X. Q. Wang and H. J. Zhu, New nanomaterials based on In12As12 cages: an ab initio bottom-up study, RSC Adv., 2013, 3(5), 1450–1459 RSC.
- Y. Li, et al., Prediction of open-framework aluminophosphate structures using the automated assembly of secondary building units method with Lowenstein’s constraints, Chem. Mater., 2005, 17(24), 6086–6093 CrossRef.
- C. M. Draznieks, et al., De novo prediction of inorganic structures developed through automated assembly of secondary building units (AASBU method), Angew. Chem., Int. Ed., 2000, 39(13), 2270–2275 CrossRef.
- B. K. Teo and H. Zhang, Clusters of clusters – self-organization and self-similarity in the intermediate stages of cluster growth of au ag supraclusters, Proc. Natl. Acad. Sci. U. S. A., 1991, 88(12), 5067–5071 CrossRef.
- X. F. F. Duan and L. W. Burggraf, The closo-Si12C12 molecule from cluster to crystal: A theoretical prediction, J. Chem. Phys., 2016, 144(11), 114309 CrossRef PubMed.
Footnotes |
| † Electronic supplementary information (ESI) available. See DOI: 10.1039/c8fd00060c |
| ‡ Free access viahttp://hive.chem.ucl.ac.uk. |
| This journal is © The Royal Society of Chemistry 2018 |


