 Open Access Article
Creative Commons Attribution 3.0 Unported Licence
Materials discovery by chemical analogy: role of oxidation states in structure prediction†
Daniel W.
Davies
 a,
Keith T.
Butler
 a,
Olexandr
Isayev
 b and
Aron
Walsh
 *cd
*cd
aCentre for Sustainable Chemical Technologies, Department of Chemistry, University of Bath, Claverton Down, Bath BA2 7AY, UK
bLaboratory of Molecular Modeling, Division of Chemical Biological and Medicinal Chemistry, UNC Eshelman School of Pharmacy, University of North Carolina, Chapel Hill, North Carolina 27599, USA
cDepartment of Materials Science and Engineering, Yonsei University, Seoul 03722, Korea
dDepartment of Materials, Imperial College London, Exhibition Road, London SW7 2AZ, UK. E-mail: a.walsh@imperial.ac.uk
First published on 1st March 2018
Abstract
The likelihood of an element to adopt a specific oxidation state in a solid, given a certain set of neighbours, might often be obvious to a trained chemist. However, encoding this information for use in high-throughput searches presents a significant challenge. We carry out a statistical analysis of the occurrence of oxidation states in 16![[thin space (1/6-em)]](https://www.rsc.org/images/entities/char_2009.gif) 735 ordered, inorganic compounds and show that a large number of cations are only likely to exhibit certain oxidation states in combination with particular anions. We use this data to build a model that ascribes probabilities to the formation of hypothetical compounds, given the proposed oxidation states of their constituent species. The model is then used as part of a high-throughput materials design process, which significantly narrows down the vast compositional search space for new ternary metal halide compounds. Finally, we employ a machine learning analysis of existing compounds to suggest likely structures for a small subset of the candidate compositions. We predict two new compounds, MnZnBr4 and YSnF7, that are thermodynamically stable according to density functional theory, as well as four compounds, MnCdBr4, MnRu2Br8, ScZnF5 and ZnCoBr4, which lie within the window of metastability.
735 ordered, inorganic compounds and show that a large number of cations are only likely to exhibit certain oxidation states in combination with particular anions. We use this data to build a model that ascribes probabilities to the formation of hypothetical compounds, given the proposed oxidation states of their constituent species. The model is then used as part of a high-throughput materials design process, which significantly narrows down the vast compositional search space for new ternary metal halide compounds. Finally, we employ a machine learning analysis of existing compounds to suggest likely structures for a small subset of the candidate compositions. We predict two new compounds, MnZnBr4 and YSnF7, that are thermodynamically stable according to density functional theory, as well as four compounds, MnCdBr4, MnRu2Br8, ScZnF5 and ZnCoBr4, which lie within the window of metastability.
I. Introduction
The idea of ascribing an oxidation state to a metal can be traced back almost 200 years.1 As the phrase suggests, it was used to describe the amount of oxygen bound to an element that was known to form multiple oxides. Since then, oxidation states have helped in the formation of many fundamental chemistry concepts. For example, a plot of the periodicity of accessible oxidation states (Fig. 1) by Irving Langmuir was one of the key pieces of evidence that led to the adoption of the octet rule around 100 years ago.2 The English term itself, “oxidation state” (or equally “oxidation number”), first came into common use in the realm of electrochemistry in the 1930s,3 and in the 1940s it gained widespread use4 to replace the less-than-perfect system of appending -ous and -ic to the lower and higher oxidation states of metals, respectively. Ferrous became Fe(II), ferric became Fe(III), and transition metals with more than two oxidation states could now be unambiguously described. The term has remained an indispensable heuristic tool in almost all sub-disciplines of the physical sciences. It is integral to the way in which chemists think about the interactions of elements within molecules and solids. | ||
| Fig. 1 Plot of accessible oxidation states reproduced from a 100-year-old paper by Irving Langmuir2 on the octet rule. | ||
Linus Pauling first postulated that oxidation states could be determined by approximating bonds as 100% ionic according to the electronegativities of the elements involved.5 This simple approach did not initially gain acceptance as the use of Pauling’s electronegativity scale6 resulted in some unusual assignments. Nevertheless, his approach is reflected in the modern definition given by IUPAC: “An atom’s charge after ionic approximation of its heteronuclear bonds”.7 In practice, knowledge of the chemical formula is sufficient to assign formal oxidation states in many inorganic compounds; however, there are cases where ambiguities exist (e.g. mixed-valence compounds, electrides, polyanions and polycations). As highlighted in a recent essay by Karen, the “atom’s charge”, its “heteronuclear bonds” and the “ionic approximation” are all terms that need clarification, and there are choices to be made about how each is defined.8
The subtlety of assigning oxidation states is still the subject of many lively discussions in both pedagogical and research contexts.9–13 For practical purposes, we emphasise the insight of Jansen and Wedig, who point out that “It is a purely formal concept; nowhere within the definition is it claimed that a particular oxidation state can be associated with a real charge. Nevertheless, the term is certainly useful, since a specific oxidation state can be correlated to real properties”.14 It is this correlation to real properties that is useful in a materials design context. Oxidation states have had a role to play in materials design for many decades. In the 1950s and 1960s, Goodman and Pamplin were able to systematically and exhaustively design superlattices of multicomponent compounds by substitution of the cations in simple binary semiconductors, while ensuring that the octet rule remained satisfied.15,16 This cation substitution (mutation) concept continues to inspire modern computational work on semiconductor design.17,18
Knowledge of accessible oxidation states for each element is advantageous because we can generate many stoichiometric combinations while ensuring that there is overall charge neutrality. For example, the formal oxidation states q of any ternary combination AxByCz must sum to zero:
| xqA + yqB + zqC = 0. | (1) |
We have previously demonstrated that many chemically plausible formulas can be generated in this way.19 For example, if the stoichiometry values (x, y and z in the above equation) are limited to integers ≤8, the search space for ternary combinations exceeds 1 × 10⁸, and for quaternary combinations it is over 2 × 10¹¹. The resulting formulas can be fed into a high-throughput screening workflow that uses machine learning structure prediction models to screen for new functional materials.20
In this study, we first carry out a statistical analysis of the occurrence of oxidation states in 16![[thin space (1/6-em)]](https://www.rsc.org/images/entities/char_2009.gif) 735 stoichiometric, inorganic compounds in order to highlight trends and show that many elements only exhibit certain oxidation states in the presence of particular elements. We then go on to construct a screening model based on this data and apply it to the search space for ternary transition metal halides. The model we propose can be used as a general chemical filter when dealing with large composition search spaces, in order to remove those combinations of elements that are unlikely to form stable compounds. For example, we find that many transition metals are only likely to adopt their highest accessible oxidation states in the presence of sufficiently electronegative anions.
735 stoichiometric, inorganic compounds in order to highlight trends and show that many elements only exhibit certain oxidation states in the presence of particular elements. We then go on to construct a screening model based on this data and apply it to the search space for ternary transition metal halides. The model we propose can be used as a general chemical filter when dealing with large composition search spaces, in order to remove those combinations of elements that are unlikely to form stable compounds. For example, we find that many transition metals are only likely to adopt their highest accessible oxidation states in the presence of sufficiently electronegative anions.
II. Results
A. Data curation
We focus on the variation of oxidation states of metals in the presence of common anions. The anions we include are the first four group VI and VII elements in their most common oxidation states, i.e. O2−, S2−, Se2−, Te2−, F−, Cl−, Br− and I−. These provide a reasonable range of electronegativities (Table 1) and as such we do not include group V anions. This also allows us to avoid the metalloids As and Sb. The compounds included in the dataset originate from the Inorganic Crystal Structure Database (ICSD) and were downloaded from the Materials Project (MP)21 using their API.22 Full details of how the dataset was refined can be found in the Methods section. In broad terms, all the compounds meet the following criteria (total number of compounds remaining in the dataset shown in brackets):| Anion | χ | Occurrence |
|---|---|---|
| F− | 3.98 | 1759 |
| O2− | 3.44 | 10![[thin space (1/6-em)]](https://www.rsc.org/images/entities/char_2009.gif) 546 546 |
| Cl− | 3.16 | 924 |
| Br− | 2.96 | 444 |
| I− | 2.66 | 499 |
| S2− | 2.58 | 1489 |
| Se2− | 2.55 | 759 |
| Te2− | 2.10 | 320 |
(1) Feature in both the ICSD and MP databases (34![[thin space (1/6-em)]](https://www.rsc.org/images/entities/char_2009.gif) 913)
913)
(2) Calculated to be less than 100 meV per atom above the thermodynamic convex hull by the MP (30![[thin space (1/6-em)]](https://www.rsc.org/images/entities/char_2009.gif) 781)
781)
(3) Oxidation states of all elements can be determined automatically using a bond valence analysis algorithm‡ (24![[thin space (1/6-em)]](https://www.rsc.org/images/entities/char_2009.gif) 376)
376)
(4) Contain at least one anion (as defined above) and at least one metal (16![[thin space (1/6-em)]](https://www.rsc.org/images/entities/char_2009.gif) 735)
735)
Fig. 2 shows the resulting metals that are included after this refinement has been applied. In total, 16![[thin space (1/6-em)]](https://www.rsc.org/images/entities/char_2009.gif) 735 different compounds are included.
735 different compounds are included.
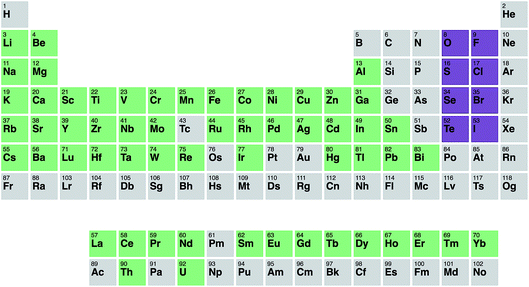 | ||
| Fig. 2 Periodic table illustrating the metals included in our statistical analysis (green) and the anions considered (purple). | ||
B. Occurrence of oxidation states
In the first instance, we examine the occurrence of metal oxidation states as a function of the most electronegative anion present in each compound (see Table 1). In each case, we normalise by the total number of compounds containing a given species (metal in a given oxidation state), i.e. we look at how the total number of instances of each species is distributed across the compounds. This is given by the ratio , where NSX is the number of compounds containing the species S where the most electronegative anion is X, and NS is the total number of compounds containing the species S. These values are shown graphically for all species in the ESI.†
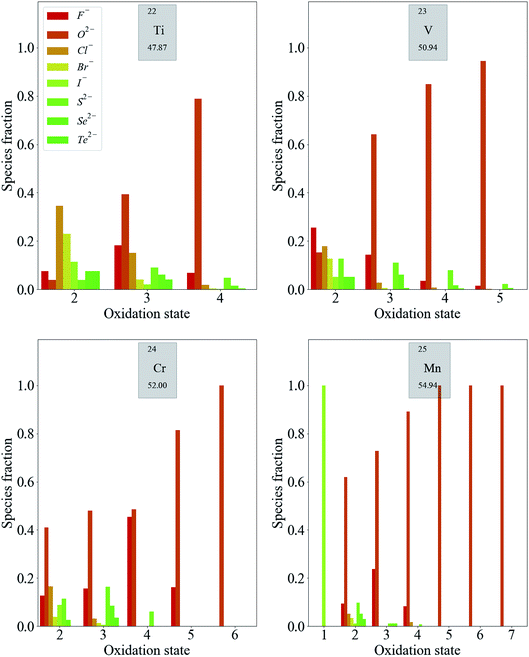
Transition metals have the largest number of accessible oxidation states. Fig. 3 shows the distribution of some first-row d-block species. Each of these exhibits the same general trend: the likelihood of finding a metal in a higher oxidation state increases when a more electronegative anion is present in the compound (increasing relative heights of red bars in Fig. 3). Meanwhile, metals are more likely to exhibit low oxidation states when the most electronegative anion present is of low electronegativity. More specific trends can also be extracted. For example, the higher oxidation states of Mn (Mn5+–Mn7+) are exclusively exhibited in oxides. This is also the case for Cr6+, while Cr5+ is limited to oxides and fluorides.
For higher oxidation states, the likelihood of finding the metal with an anion of moderate electronegativity, such as Cl−, Br− or I−, often goes to zero before the likelihood of finding it with an anion of low electronegativity, such as S2−, Se2−, and Te2−. This is a trend that may not necessarily be expected, for example, going from V2+ to V4+. It is also important to mention at this stage that oxides nearly always dominate each distribution, as 10![[thin space (1/6-em)]](https://www.rsc.org/images/entities/char_2009.gif) 546 of the 16
546 of the 16![[thin space (1/6-em)]](https://www.rsc.org/images/entities/char_2009.gif) 735 compounds contain oxygen. This point is addressed later when using the data predictively, in order to minimise bias.
735 compounds contain oxygen. This point is addressed later when using the data predictively, in order to minimise bias.
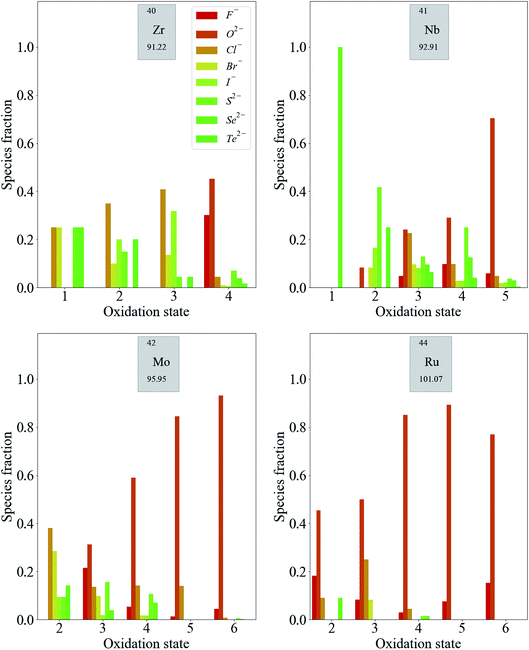
Fig. 4 shows a similar trend in the distribution of some second-row d-block species. Again, compounds containing less electronegative anions, in the absence of any more electronegative anions, are more likely to contain metal species with lower oxidation states. For the highest oxidation states of Ru (Ru5+ and Ru6+), the presence of F− or O2− is required.
The distribution of oxidation states is more even across anions of moderate and low electronegativity for second-row transition metals compared to those in the first row. This is consistent with the established principles of chemical hardness,§ as applied to inorganic compounds by Pearson.25 The order of chemical hardness for the halides is F− > Cl− > Br− > I− and, in general, halide anions are harder than chalcogenide anions, which is consistent with the order of electronegativity in Table 1. For cations, hardness increases with increasing charge. The species in the second row have consistently lower chemical hardness than the corresponding species in the first row of the periodic table with the same oxidation state, so it should be expected that they form more compounds with softer halides.
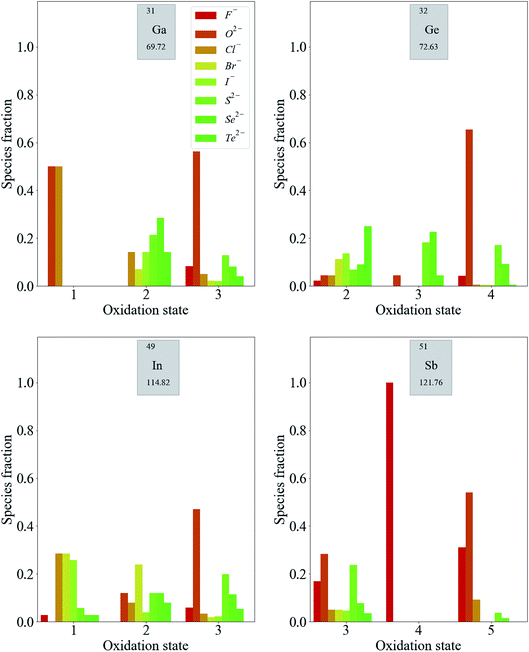
For p-block metals, the trends are less pronounced. As shown in Fig. 5, compounds containing F− and O2− are likely to exhibit higher oxidation states of the metals. Moving from low to high oxidation states, there is less of a reduction in the fraction of compounds containing anions of lower electronegativity compared with the transition metal compounds discussed so far. The reduction in the fraction of compounds containing anions of moderate electronegativity is more pronounced for these metals. The general observation from this data, that the oxidation states of these metals are more weakly correlated to the electronegativities of the counter-ions than in the case of transition metals, is expected based on the fact that transition metals have multiple readily accessible oxidation states by virtue of their partially occupied d-bands. This is not the case for p-block metals, for which adding or removing electrons results in more significant energy differences.
The third-row transition metals and lanthanide series display similar trends to the first- and second-row transition metal series (see ESI†). For completeness, we note that the alkali and alkali-earth metals only exhibit +1 and +2 oxidation states, respectively, for the vast majority of compounds. Similarly, Sc, Y, Zn and Cd are usually not strictly classified as transition metals as there is a strong energetic preference for them to adopt the oxidation states that lead to empty (Sc3+, Y3+) or filled (Zn2+, Cd2+) valence d-orbitals, rather than these being partially filled, as the definition dictates. We also note that the later d-block metals (Ni, Cu, Pd and Ag) do not exhibit trends as clear as those for the rest of the d-block. This is due to similar effects as above, whereby particular closed (or pseudo-closed) shell configurations are favourable, for example, the d8 electronic configuration of Ni2+ and Pd2+.
The abundance or scarcity of particular species–anion pairings in this dataset may not always reflect what is chemically accessible. Even assuming that the dataset is sufficiently diverse, heightened interest in particular compounds or compound classes can result in their over-representation, which is a general problem in data mining. Nevertheless, we have shown that analysis of the dataset both recovers established chemical concepts and provides new insight. We now go on to develop a simple model that can be universally applied based on the dataset as a whole.
C. Probabilistic model of species combinations
There are more compounds where the most electronegative anion present is O than where it is any other anion, as shown in Table 1. To use the information from our analysis, we must ensure that the occurrence of each anion does not bias the results. To this end, we define the probability that a species is present with a given anion as: | (2) |
We use this formula to construct a lookup table of 1320 species–anion pair probabilities (PSA). The table contains 411 probabilities that equal 0, and 195 probabilities that equal 1. The former represent all the pairings that do not occur within the dataset and the latter represent pairings where for a given anion, the metal only exhibits one particular oxidation state. The PSA values are also presented graphically in the ESI.† We note that this still does not mitigate against limitations that are intrinsic to the dataset. For example, there are over 100 distinct CdI2 crystal structures in the dataset (owing to the large number of distinct polymorphs), giving rise to an anomalously high probability for the Cd2+–I− pairing.
An overall compound probability can be calculated as the product of the individual PSA values. For example, for a ternary metal halide AaBbXx, the compound probability is calculated as:
 | (3) |
D. High-throughput compound design
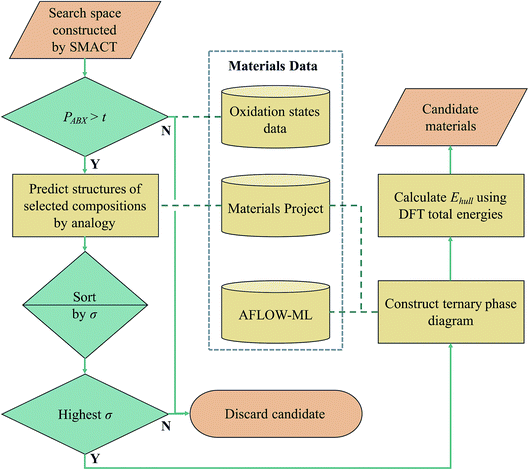
We now use these compound probabilities to inform a high-throughput design workflow. Specifically, we explore the compositional landscape for ternary transition metal halide compounds. An overview of the workflow is shown in Fig. 7. The SMACT code19 is used to generate 54![[thin space (1/6-em)]](https://www.rsc.org/images/entities/char_2009.gif) 484 AaBbXx compositions. Of these, only 4276 are in known chemical systems (A–B–X) within the MP database. The compositions are assigned probabilities as per eqn (3), and only 18
484 AaBbXx compositions. Of these, only 4276 are in known chemical systems (A–B–X) within the MP database. The compositions are assigned probabilities as per eqn (3), and only 18![[thin space (1/6-em)]](https://www.rsc.org/images/entities/char_2009.gif) 164 are non-zero, which represents an immediate three-fold reduction in the search space.
164 are non-zero, which represents an immediate three-fold reduction in the search space.
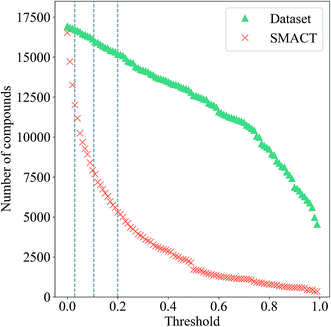
The number of compositions produced by SMACT that pass through this probability filter as the threshold, t, is increased from zero is also shown in Fig. 6. Many compositions have low probabilities, hence, contrary to the scenario for the compound dataset, the total number drops off rapidly as the threshold increases. This separation between the two curves would, in principle, allow for a threshold to be chosen that eliminates many suggested structures but is still inclusive of the majority of the structures in the dataset. For example, choosing a threshold that includes 90% of the structures in the dataset results in a further three-fold reduction of the search space to <6000 compositions.
If we set a probability threshold of t = 1, there are 346 compositions that pass through the filter, equating to 88 distinct sets of three species. In order to demonstrate the rest of our workflow, we take 10 of these sets (Table 2) to the next step, which is to assign them to likely crystal structures (first yellow box in Fig. 7). For this, we adopt the structure substitution algorithm developed by Hautier et al.26 This method also uses a statistical model and relies on a database of known compounds including oxidation state information: a combination of species is substituted onto lattice sites in known structures from the dataset of known materials. Each species substitution is associated with a certain probability, which comes from a model trained on the compounds that already exist in the ICSD. If the overall probability for a given set of substitutions is above a certain threshold, σ, it is added to a list of possible structures. This substitution process is performed on each known crystal structure for each set of species in the MP database. The structure with the highest overall probability for each of the 10 sets of species is taken forward to the next stage of the workflow (second and third green diamonds in Fig. 7). These are listed in Table 2, along with their parent compounds.
| Species set | Formula | Parent formula | E hull (meV per atom) |
|---|---|---|---|
| Co2+ Ru3+ Br− | CoRu2Br8 | TiAl2Cl8 | 287 |
| Mn2+ Cd2+ Br− | MnCdBr4 | CdCuF4 | 99.5 |
| Mn2+ Co2+ Br− | MnCoBr4 | CdCuF4 | 130 |
| Mn2+ Ru3+ Br− | MnRu2Br8 | TiAl2Br8 | 73.2 |
| Mn2+ Zn2+ Br− | MnZnBr4 | GaCuI4 | 0 |
| Sc3+ Zn2+ F− | ScZnF5 | MnCdF5 | 48.3 |
| Y3+ Co2+ I− | Y2CoI8 | TiAl2Br8 | 181 |
| Y3+ Zr4+ F− | YZrF7 | YSnF7 | 0 |
| Zn2+ Cd2+ Cl− | ZnCd2Cl6 | ZnPb2F6 | 132 |
| Zn2+ Co2+ Br− | ZnCoBr4 | CdCuF4 | 40.4 |
Each structure is placed on a phase diagram in order to determine likely competing phases, which requires the total energies to be calculated using DFT. The key quantity of interest is the energy above the convex hull (Ehull) that is formed by drawing straight lines between thermodynamically stable phases. It was recently estimated by Sun et al. that around half of all known inorganic materials are metastable,27 so to focus solely on thermodynamically stable compounds would be to potentially overlook kinetically stabilised, useful materials. The likelihood of existence drops off exponentially as Ehull increases. The rate of decay depends on the chemistry of the system and we use 100 meV per atom as a guiding principle for the maximum Ehull. The set of competing phases on which DFT calculations were performed was determined using a trained machine learning model (AFLOW-ML), in which structures are represented as property-labelled fragments.28
This stage reveals a key advantage of pursuing only those compositions with higher probabilities based on the oxidation state analysis: the parent binary compounds are well defined. Competing binary compounds containing the metals in the same oxidation states as in the ternary (or higher order) compound are more likely to be known and amenable to total energy calculations to determine phase stability. Arbitrary combinations of species can result in stoichiometries that require energies of competitive gas or liquid phases which are subject to larger errors in DFT simulations. Fig. 8 illustrates this point with a comparison between the phase diagrams of three proposed ternary compositions. MnZnBr4 has a probability of 1.0, as both MnBr2 and ZnBr2 are known and these decomposition products do not require a change of oxidation state of either metal. The ternary therefore sits on the tie-line between the two binaries. The proposed compositions of MnRuBr6 and ScMnI7, however, both have probabilities of zero, as in each case one or more species–anion pairs are not known to occur. These compositions sit in an equilibrium triangle as opposed to on a tie-line, and the stabilities of the proposed compounds now depend on the chemical potentials of the anions.
The final Ehull values are shown in Table 2. Two of the new compounds, MnZnBr4 and YZrF7, are predicted to be thermodynamically stable with respect to competing phases. Of the remaining eight compounds, four sit within the metastability window of 0 < Ehull < 100, while four are unlikely to form stable compounds. The crystal structures of the two compounds identified as stable are shown in Fig. 9. By comparison with previous work where a similar workflow was employed,20 this result provisionally indicates that the additional step of considering compound probabilities based on our oxidation state analysis increases the chance of identifying stable compounds.
The main limitation of the procedure outlined here is that it is based on the analysis of known materials with extrapolation to new systems. This assumes that the range of structure types and chemistries found in current materials databases provides a complete basis for materials design. While this is a reasonable starting point, advances in materials synthesis – for example in the area of hybrid organic–inorganic solids – will require adaptations and the development of alternative approaches. We have noted that there are many instances where oxidation states themselves become ill-defined, which are often associated with interesting and important physical behaviour (e.g. superconductivity). Before tackling such challenging cases, we have highlighted19 that a vast amount of “conventional” materials space remains unexplored.
III. Conclusion
We have performed a statistical analysis of the occurrence of oxidation states in 16![[thin space (1/6-em)]](https://www.rsc.org/images/entities/char_2009.gif) 735 inorganic compounds and shown that qualitative trends in keeping with chemical intuition can be extracted from the data. Many of the highest oxidation states of transition metals are only observed in the presence of the most electronegative anions, O2− and F−, whilst the absence of these anions is required for many of the lower oxidation states of transition metals. We go on to use the data to construct a model that is applied to inform a high-throughput search for new stable ternary halide materials. The application of the model results in an immediate three-fold reduction in the search space of 54
735 inorganic compounds and shown that qualitative trends in keeping with chemical intuition can be extracted from the data. Many of the highest oxidation states of transition metals are only observed in the presence of the most electronegative anions, O2− and F−, whilst the absence of these anions is required for many of the lower oxidation states of transition metals. We go on to use the data to construct a model that is applied to inform a high-throughput search for new stable ternary halide materials. The application of the model results in an immediate three-fold reduction in the search space of 54![[thin space (1/6-em)]](https://www.rsc.org/images/entities/char_2009.gif) 484 compositions. The search space is reduced to those compositions which are more likely to have known chemically similar compounds as competing phases, such as binary halides, thereby increasing the confidence we have in their calculated stabilities. Our workflow is able to identify two new stable compounds, YZrF7 and MnZnBr4, using modest computing resources.
484 compositions. The search space is reduced to those compositions which are more likely to have known chemically similar compounds as competing phases, such as binary halides, thereby increasing the confidence we have in their calculated stabilities. Our workflow is able to identify two new stable compounds, YZrF7 and MnZnBr4, using modest computing resources.
IV. Methods
A. Dataset
The MP API22 was used to download the structures of all the compounds that were associated with at least one ICSD entry and had a calculated energy above the hull of <100 meV per atom. An attempt was made to add oxidation states to all the species in each structure using the pymatgen29 bond_valence module (see the subsection ‘Oxidation state assignment’ for details). Those compounds for which oxidation states could not be assigned were discarded. Finally, the dataset was limited to compounds that feature at least one metal element and one of the anions of interest, i.e. O2−, S2−, Se2−, Te2−, F−, Cl−, Br− or I−.B. Oxidation state assignment
In order to assign integer numbers of electrons to atoms, the bond order must be determined. This task is easily carried out for molecules, but not for extended solids. Bond valence (BV) is a quantity similar to bond order that is used instead and, for atoms i and j, is calculated by | (4) |
 | (5) |
We use the maximum a posteriori (MAP) estimation method to determine oxidation states using the BV approach, as implemented within the pymatgen code29 with a maximum nearest-neighbour radius of 4 Å.
C. Compound design
Using as the input the metal species for which we have PSA values, we use the SMACT package19 to generate all the charge-neutral AaBbXx compositions where A and B are d-block metals, X is one of the first four halides, and the stoichiometries a, b and x are integers ≤8. For structure prediction, we use the structure substitution algorithm developed by Hautier et al.,26 as implemented in the pymatgen framework29 with a probability threshold, σ, of 0.00001. The structure with the highest probability that does not contain more than 40 atoms per unit cell is selected as the candidate compound for a given set of species.D. Total energy calculations
For calculating Ehull, first-principles calculations are carried out using Kohn–Sham DFT with a projector-augmented plane wave basis,30 as implemented in the Vienna Ab initio Simulation Package (VASP).31,32 We use the PBEsol exchange-correlation functional33 and a k-point grid is generated for each calculation with a density of 120 Å3 in the reciprocal lattice. The kinetic energy cut-off is set at 600 eV and the force on each atom minimised to below 0.005 eV Å−1.We note that no Hubbard + U parameters are used in the calculations to correct for the self-interaction error present in the generalised gradient approximation (GGA) for some transition metals.34,35 The use of GGA + U has been shown the improve the stability estimates of ternary oxides,36 however, in the absence of any reliable U parameters fitted to metal halides, we use GGA for all calculations for consistency.
V. Data access statement
The SMACT package can be accessed from https://github.com/WMD-group/SMACT. Screening results from these calculations may be reproduced using the Python code available on-line from https://github.com/WMD-group/SMACT/tree/master/examples. Optimised structures are available on-line from https://github.com/WMD-group/Crystal_structures/tree/master/TM_halides. All other data may be obtained from the authors on request.Conflicts of interest
There are no conflicts of interest to declare.Acknowledgements
DWD gratefully acknowledges support from the Engineering and Physical Sciences Research Council (EPSRC) via the Centre for Doctoral Training in Sustainable Chemical Technologies (grant no. EP/L016354/1). Calculations were carried out on the Balena HPC cluster at the University of Bath, which is maintained by Bath University Computing Services. AW acknowledges support from the Royal Society and the Leverhulme Trust.References
- F. Wöhler, Unorganische Chemie, Duncker und Humblot, Berlin, 3rd edn, 1835, p. 4 Search PubMed.
- I. Langmuir, J. Am. Chem. Soc., 1919, 41, 868–934 CrossRef.
- W. M. Latimer, The Oxidation States of the Elements and their Potentials in Aqueous Solutions, Prentice Hall, 1938 Search PubMed.
- W. P. Jorissen, H. Bassett, A. Damiens, F. Fichter and H. Rémy, J. Am. Chem. Soc., 1941, 63, 889–897 CrossRef.
- L. Pauling, J. Chem. Soc., 1948, 1461–1467 RSC.
- L. Pauling, J. Am. Chem. Soc., 1932, 54, 3570–3582 CrossRef.
- IUPAC, Compendium of Chemical Terminology (the“Gold Book”), Blackwell Scientific Publications, Oxford, 2nd edn, 1997 Search PubMed.
- P. Karen, Angew. Chem., Int. Ed., 2015, 54, 4716–4726 CrossRef PubMed.
- D. W. Smith, J. Chem. Educ., 2005, 82, 1202 CrossRef.
- G. Parkin, J. Chem. Educ., 2006, 83, 791 CrossRef.
- H.-P. Loock, J. Chem. Educ., 2011, 88, 282–283 CrossRef.
- L. Jiang, S. V. Levchenko and A. M. Rappe, Phys. Rev. Lett., 2012, 108, 166403 CrossRef PubMed.
- A. Walsh, A. A. Sokol, J. Buckeridge, D. O. Scanlon and C. R. A. Catlow, J. Phys. Chem. Lett., 2017, 8, 2074–2075 CrossRef PubMed.
- M. Jansen and U. Wedig, Angew. Chem., Int. Ed., 2008, 47, 10026–10029 CrossRef PubMed.
- B. R. Pamplin, J. Phys. Chem. Solids, 1964, 25, 675–684 CrossRef.
- C. H. L. Goodman, J. Phys. Chem. Solids, 1958, 6, 305–314 CrossRef.
- A. Walsh, S.-H. Wei, S. Chen and X. G. Gong, 2009 34th IEEE Photovolt. Spec. Conf., 2009, pp. 001875–001878 Search PubMed.
- Z.-H. Cai, P. Narang, H. a. Atwater, S. Chen, C.-G. Duan, Z.-Q. Zhu and J.-H. Chu, Chem. Mater., 2015, 27, 7757–7764 CrossRef.
- D. W. Davies, K. T. Butler, A. J. Jackson, A. Morris, J. M. Frost, J. M. Skelton and A. Walsh, Chem, 2016, 1, 617–627 Search PubMed.
- D. W. Davies, K. T. Butler, J. M. Skelton, C. Xie, A. R. Oganov and A. Walsh, Chem. Sci., 2018, 9, 1022–1030 RSC.
- A. Jain, S. P. Ong, G. Hautier, W. Chen, W. D. Richards, S. Dacek, S. Cholia, D. Gunter, D. Skinner, G. Ceder and K. A. Persson, APL Mater., 2013, 1, 011002 CrossRef.
- S. P. Ong, S. Cholia, A. Jain, M. Brafman, D. Gunter, G. Ceder and K. A. Persson, Comput. Mater. Sci., 2015, 97, 209–215 CrossRef.
- M. O’Keeffe and N. E. Brese, J. Am. Chem. Soc., 1991, 113, 3226–3229 CrossRef.
- R. S. Mulliken, J. Chem. Phys., 1934, 2, 782 CrossRef.
- R. G. Pearson, Inorg. Chem., 1988, 27, 734–740 CrossRef.
- G. Hautier, C. Fischer, V. Ehrlacher, A. Jain and G. Ceder, Inorg. Chem., 2011, 50, 656–663 CrossRef PubMed.
- W. Sun, S. T. Dacek, S. P. Ong, G. Hautier, A. Jain, W. D. Richards, A. C. Gamst, K. A. Persson and G. Ceder, Sci. Adv., 2016, 2, e1600225 Search PubMed.
- O. Isayev, C. Oses, C. Toher, E. Gossett, S. Curtarolo and A. Tropsha, Nat. Commun., 2017, 8, 15679 CrossRef PubMed.
- S. P. Ong, W. D. Richards, A. Jain, G. Hautier, M. Kocher, S. Cholia, D. Gunter, V. L. Chevrier, K. A. Persson and G. Ceder, Comput. Mater. Sci., 2013, 68, 314–319 CrossRef.
- G. Kresse and D. Joubert, Phys. Rev. B, 1999, 59, 1758–1775 CrossRef.
- G. Kresse and J. Furthmüller, Comput. Mater. Sci., 1996, 6, 15–50 CrossRef.
- G. Kresse and J. Furthmüller, Phys. Rev. B, 1996, 54, 11169 CrossRef.
- J. P. Perdew, A. Ruzsinszky, G. I. Csonka, O. A. Vydrov, G. E. Scuseria, L. A. Constantin, X. Zhou and K. Burke, Phys. Rev. Lett., 2008, 100, 136406–136414 CrossRef PubMed.
- V. I. Anisimov, J. Zaanen and O. K. Andersen, Phys. Rev. B, 1991, 44, 943–954 CrossRef.
- V. I. Anisimov, F. Aryasetiawan and A. I. Lichtenstein, J. Phys.: Condens. Matter, 1997, 9, 767–808 CrossRef.
- G. Hautier, S. P. Ong, A. Jain, C. J. Moore and G. Ceder, Phys. Rev. B, 2012, 85, 155208 CrossRef.
Footnotes |
| † Electronic supplementary information (ESI) available. See DOI: 10.1039/c8fd00032h |
| ‡ This rules out those elements that were not included in the original study which proposed the algorithm,23 as well as intermetallic compounds. |
§ Chemical hardness is estimated by  where I is the ionisation potential and A is the electron affinity. This represents half the energy gap between the highest occupied orbital and lowest unoccupied orbital. Absolute electronegativity,24 as distinct from Pauling’s definition,6 is defined as where I is the ionisation potential and A is the electron affinity. This represents half the energy gap between the highest occupied orbital and lowest unoccupied orbital. Absolute electronegativity,24 as distinct from Pauling’s definition,6 is defined as  and represents the midpoint between the two orbitals. and represents the midpoint between the two orbitals. |
| This journal is © The Royal Society of Chemistry 2018 |

