DOI:
10.1039/C8FD00002F
(Paper)
Faraday Discuss., 2018,
208, 123-145
The electronic properties of Au clusters on CeO2 (110) surface with and without O-defects†
Received
12th January 2018
, Accepted 13th February 2018
First published on 13th February 2018
Abstract
We use density functional theory with Hubbard corrections (DFT+U) to understand the local electronic properties of Au adatom and Au2 dimer adsorption on the CeO2 (110) surface. We show that, based on the initial geometries, we can observe Au species in a variety of charge states including Au+, Au−, Auδ− and Auδ+–Auδ−. We present a detailed discussion using Bader charge analysis and partial density of states to support our observations. We also discuss the influence of solvent on the adsorption of Au adatoms adsorbed on top of an O-vacancy, which shows interesting geometrical and electronic properties.
1. Introduction
Since the early work of Haruta on low temperature CO oxidation and on hydrochlorination of ethylene to vinyl chloride by Hutchings using Au as catalyst, there has been widespread interest in understanding the catalytic properties of Au.1–3 Over the years, it has been shown that Au nanoparticles on oxide supports such as CeO2 have high catalytic activity in many important chemical reactions such as in PReferential OXidation of CO in the presence of H2 (PROX) and for cleaning the hydrogen supply for fuel cells.4 One of the key properties of CeO2 is the possibility of reversible release and storage of lattice oxygen to which the success of Au/CeO2 systems in heterogeneous catalysis has been widely attributed. Many previous studies have investigated Au/CeO2 catalysts. For example, Zhang et al. reported cationic Au species during CO oxidation at room temperature over a Au/CeO2 catalyst. They also studied the effect of humidity on catalyst activity.5 Zhou et al. showed that the CO oxidation rate scales with the Au/CeO2 interfacial length in Au/CeO2 nanotowers.6 Wang et al. used synchrotron-based in situ time resolved X-ray diffraction and X-ray absorption spectroscopies to analyse the catalytic behaviour of nanostructured {Au + AuOx}–CeO2 catalysts during the water-gas shift reaction. In this study they proposed that the Auδ+ species is not responsible for this reaction at high temperature.7 The importance of various charged Au species on the CeO2 surface has also been reported by many other workers. Li et al. showed, using in situ FTIR combined with HRTEM, TGA, CO-TPD, O2-TPO and O2-TPD experiments, that Auδ+ species are a prerequisite for the formation of formate and carbonate-like species during CO-oxidation at ambient temperature and in the presence of ultra-low-gold-loaded catalysts.8 In an interesting study, related to the deactivation of an Au/CeO2 catalyst during the low temperature water-gas shift reaction, Karpenko et al. showed the significance of Aun+ and Ce3+ species and concluded that the catalyst is dominated by the formation of stable adsorbed carbonate species and catalyst redox processes are less significant.9 Experimental comparative studies of Au with other metals such as Cu, Pt and Ir on CeO2 surfaces have also been reported.10,11 Scirè et al. suggested that Au/CeO2 catalysts for the PROX reaction could be affected by the oxidation state of Au, which has a significant role in the CO activation energy.12 They also concluded that, in the case of Cu/CeO2, the performance is significantly influenced by the CeO2 morphology/reactivity. Furthermore, comparative studies on the interaction of Au on different surfaces such as CeO2 and Fe2O3 have shown that well dispersed metallic Au nanoparticles can provide active sites for the low temperature CO oxidation reaction on both CeO2 and Fe2O3.13
In addition to the above experimental studies, there have been numerous theoretical studies of Au on CeO2 surfaces. For example, Camellone et al. concluded that the charged Au ions such as Au+ and Au3+ activate molecular CO and its oxidation to CO2. They predicted that the reactivity of Au nanoparticles nucleated at O vacancies can be recovered for cluster sizes as small as Au2.14 For this study they employed density functional theory (DFT) calculations with the Hubbard correction, which is commonly referred to as DFT+U. In their study, they used a U value of 4.5 eV for Ce ions with the Perdew–Burke–Ernzerhof (PBE) exchange and correlation functional. All the calculations were performed using periodic boundary conditions employing the Quantum ESPRESSO package. Chen et al. found that the Au adatom adsorption on CeO2 (111) and CeO2 (110) has the stability order of Ead (Ce-vacancy) < Ead (O-vacancy) < Ead (stoichiometric surface).15 In this study they used DFT+U with a U value of 5.0 eV for Ce and employed SIESTA and VASP code using PBE and BLYP exchange and correlation functionals. Murgida et al. used DFT+U with a U value of 4.5 eV for Ce and the PBE exchange and correlation functional employing VASP to address the crucial question of whether vacancies agglomerate or repel each other.16 They showed that the energetically most stable near-surface oxygen vacancy structures for a broad range of vacancy concentrations have all vacancies at subsurface oxygen sites. In another interesting study, Zhang et al. investigated the adsorption of an Au atom on O-vacancy sites and proposed that O-vacancies and O-vacancy clusters could also be anchoring sites for Au nucleation.17a For this study they used DFT+U, with a U value of 5.0 eV for Ce. Hernandez et al. reported the electronic structure of Au adatom on CeO2 (111) surface. In this work they showed that Au adatom can adopt Au0, Au+ and Au− electronic configuration. In the studies by Branda et al. a series of U values were explored for LDA+U and GGA+U and explained the interesting interplay of the Au0/Au+ (Ce4+/Ce3+) states. However, in these studies the influence of solvent molecules and cluster size effects on the electronic properties of Au/CeO2 systems were not taken into account.17a–c In one of our recent studies we used DFT+U in conjunction with extended X-ray absorption fine structure (EXAFS) experiments on the geometrical and local electronic properties of Cu adatoms and Cu(II) ions in the presence of water molecules and of CuO nanoclusters on the CeO2 (110) surface. In this study we also used a U value of 5.0 eV for the Ce ion species.18
Despite this extensive range of experimental and computational studies of the interaction of Au with the CeO2 surface, there are considerable uncertainties in the nature and origin of various important cationic and anionic species displayed by Au on the surface of CeO2. The current study therefore investigates the fundamental interactions of Au and Au2 clusters on CeO2 surface with and without O-vacancies using the DFT+U methodology. In the following section, we present the computational details followed by our results and discussion on Au adatom adsorption on CeO2 (110) surface both with and without a surface O-vacancy; we also consider the effect of the presence of water molecules as a solvent phase. For these studies involving water molecules the dispersive effects might play a crucial role therefore, we used Grimme's dispersion correction (D3) method. We then extend our study to Au2 clusters. Our results give new insights both into the interaction of Au with the surface of CeO2 and the factors controlling the charge state of the adsorbed atoms.
2. Computational details
Our calculations used periodic boundary conditions employing the Vienna Ab initio Simulation Package (VASP) to perform all the spin-polarized DFT+U calculations.19–21 Theoretical studies have shown that the stability of CeO2 surfaces is in the order of (111) > (110) > (100); and it is generally considered that the CeO2 (110) surface is catalytically more active.22,23 Therefore, for our studies we have focused on the CeO2 (110) surface. We used the projector augmented wave (PAW) method and the cut-off energy for the expansion of the plane-wave basis sets was set to 550 eV, which gave bulk energies converged to within 10−5 eV.24 We chose a convergence criterion of 0.01 eV Å−1 for structural optimizations and a k-point grid of 4 × 4 × 1 was employed for all slab calculations. The Perdew–Burke–Ernzerhof (PBE) version of the generalized gradient approximation (GGA) was used to carry out geometry optimizations and total energy calculations.25
The ideal (110) surfaces were modeled by 2 × 2 and 3 × 3 cells. The slabs were cut from bulk CeO2 with a calculated energy minimized lattice constant of 5.492 Å (which compares well with the experimental value of 5.411 Å) while in the direction perpendicular to the surface we used a vacuum gap of ∼15 Å. For the initial 2 × 2 supercell calculations, we used 9 atomic layers; and in these models, we placed the Au atoms on both sides of the CeO2 surface so as to nullify any spurious dipole moments that would be present in the single-sided system. For the calculations involving 3 × 3 systems, we used 5 atomic layers and the adsorption was allowed on only one of the two surfaces. Here the dipole moment, due to the adsorbed species, was taken into account by using the methods implemented in VASP according to the procedures of Makov et al. and Neugebauer et al.26,27 In our studies involving Au/CeO2 (110) surface with an O-vacancy and water molecules, we have employed Grimme’s dispersion correction (DFT+U+D3) as dispersive effects might be significant for such systems.28
Previous studies have reported that the localization of electrons in f-orbitals in Ce ions is correctly represented by the Hubbard parameter Ueff = 5 eV and following earlier works we also use this value in the present study.17,18,23,29–31 The adsorption energy, Ead, for species (X) placed on both sides of the slab was calculated as:
| | | Ead = {EX+CeO2 − (ECeO2 + 2 × EX)}/2, | (1) |
where
EX+CeO2 is the energy of the system with the species X adsorbed in a symmetric fashion on the two CeO
2 (110) surfaces created in the slab model, with or without O-vacancies.
ECeO2 is the energy of the pristine CeO
2 (110) surface with or without O-vacancies.
EX is the energy of an isolated adsorbate, usually a single Au atom placed in an identical periodic cell to the full slab calculation. Vacancies and adsorbed species are included in symmetrically identical positions on each face of the slab model to ensure that no net dipole perpendicular to the surfaces is introduced. This became cumbersome for the solvated calculations and so in those calculations a single side of the slab was employed and a dipole correction perpendicular to the surfaces was used. In these cases
eqn (1) was adapted by the removal of the factors of 2 when calculating the reported adsorption energies. In the case of slab models with symmetric inclusion of vacancies/adsorbates, the whole system was relaxed on geometry optimization. For the single surface cases, the three lower layers of the slab were frozen in their bulk optimized positions.
Charges on the various atoms were obtained using the Bader charge analysis as implemented by Henkelman and co-workers.32 The charge density difference, ρdiff, was calculated by subtracting the sum of the charge densities of the isolated adsorbate ρX and pristine geometry (ρPristine surface) of the surface of the same geometry from the total charge density (ρtotal) of the system i.e.
| | | ρdiff = ρtotal − (ρPristine surface + ρX) | (2) |
We used the Visualization for Electronic and Structural Analysis (VESTA) package for the visualization of 3D and 2D charge density differences.33,34
3. Results and discussion
3.1. Adsorption of Au adatom on CeO2 (110) surface
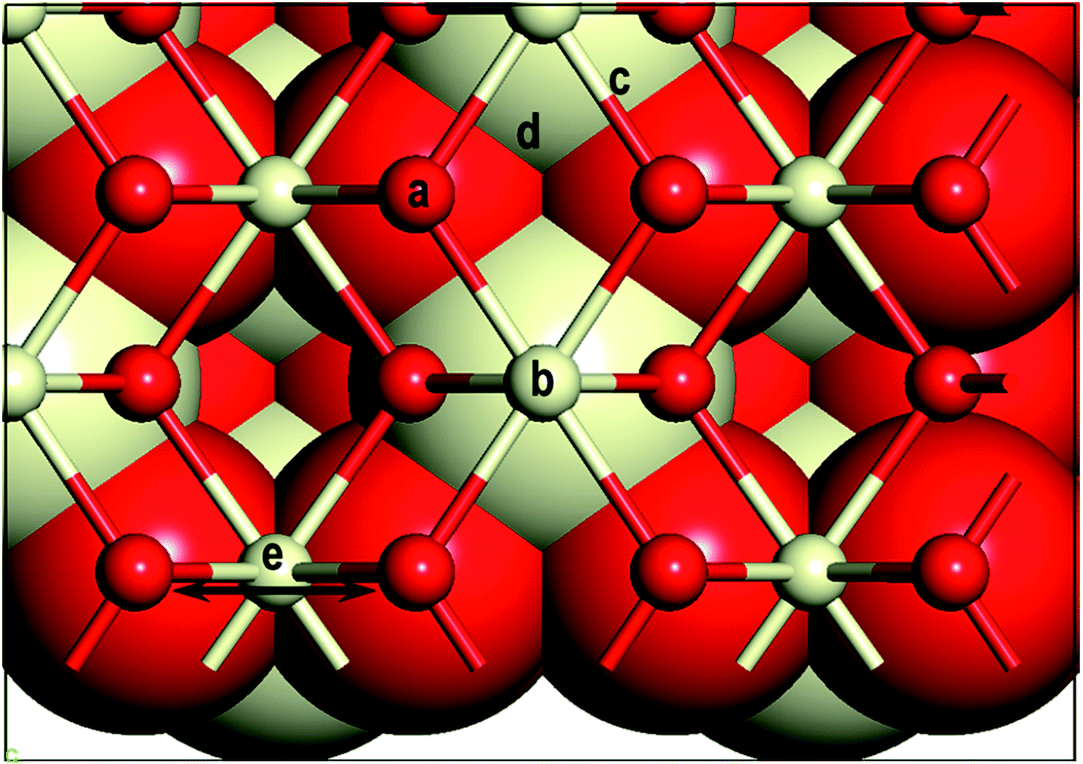
First, we investigate the geometrical and electronic properties of an adsorbed Au adatom in five surface site locations: (a) on top of an O atom (Otop), (b) on top of a Ce atom (Cetop), (c) on the bridge between Ce and O atoms (O–Cebridge), (d) on the four-fold hollow site (4-fold hollow) and (e) long-bridge site (O⋯Obridge) (see Fig. 1).
 |
| | Fig. 1 Sites of Au adatom adsorption (a) on top of oxygen atom (Otop), (b) on top of cerium atom (Cetop), (c) on the bridge between Ce and O atoms (O–Cebridge), (d) on the four-fold hollow site (4-fold hollow) and (e) on long-bridge site (O⋯Obridge). | |
Geometries.
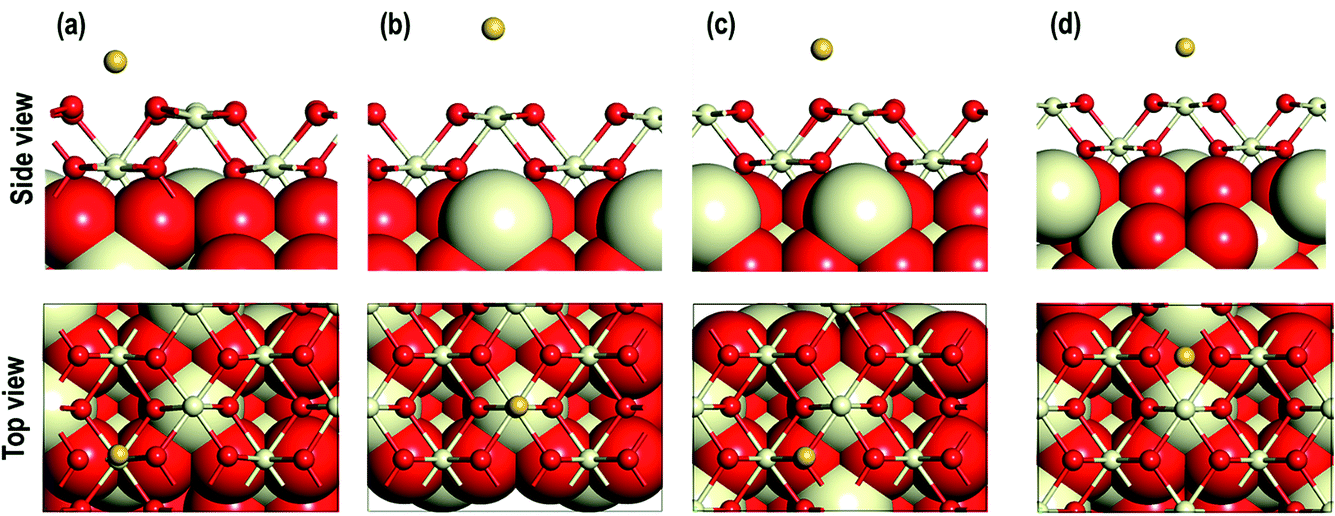
The optimized structures are shown in Fig. 2. After relaxation of an Au adatom on top of a surface O atom (Otop), the Au atom moves to the long-bridge site (O⋯Obridge, Fig. 1(e)). Similarly, relaxation of an Au adatom placed at the bridge site (O–Cebridge) results in the Au atom moving to the Otop site. Therefore, the former model can be referred to as the O⋯Obridge model and the latter as the Otop model. On the other two sites, namely 4-fold hollow site and Cetop, no such movements of the Au atoms are seen. As shown in Table 1, on calculating the various interatomic distances we find that the Ce–O distances on the exposed surfaces and in the bulk of the models are comparable with that of the pristine model. The Au–O distances display an interesting trend i.e., O⋯Obridge (2.132 Å and 2.171 Å) < O–Cetop (2.179 Å) ≪ 4-fold hollow (2.655 Å) site, which suggests that Au interacts relatively strongly in the O⋯Obridge model as compared to the other models. For the Cetop model, the Ce–Au distance is 3.059 Å suggesting a very weak interaction between the Au and the Ce atom. Comparing to our earlier work, it is interesting to note that Au and Cu behave in a similar fashion when adsorbed on-top of an O atom, each moving to an O⋯Obridge site.18 However, in the O–Cebridge case, we note that Au bonds with the nearest O atom, whereas a Cu adatom moves to the O⋯Obridge site.18 In the next section we present a detailed analysis of the electronic properties of the adsorbed configurations to gain insight into this behavior.
 |
| | Fig. 2 Optimized side and top view of Au adatom adsorbed starting at the surface locations: (a) on O⋯Obridge, (b) on Cetop, (c) on Otop, (d) 4-fold hollow sites. | |
Table 1 The average interatomic distances (in Å) for (Ce–O)blk, (Ce–O)srf, Au–O, Au–Ce and the adsorption energy (Ead) in eV for the models with Au atom on different sites
| System |
Average interatomic distances (Å) |
|
| (Ce–O)blk |
(Ce–O)srf |
Au–O |
Au–Ce |
E
ad (eV) |
| Pristine |
2.377 |
2.342 |
— |
— |
— |
| Au on |
O⋯Obridge |
2.378 |
2.327 |
2.132, 2.171 |
— |
−1.132 |
| Cetop |
2.378 |
2.337 |
— |
3.059 |
−0.332 |
| Otop |
2.378 |
2.344 |
2.179 |
— |
−0.977 |
| 4-fold hollow |
2.378 |
2.343 |
2.655 |
3.150 |
−0.684 |
Energetics of Au adsorption on the CeO2 (110) surface.
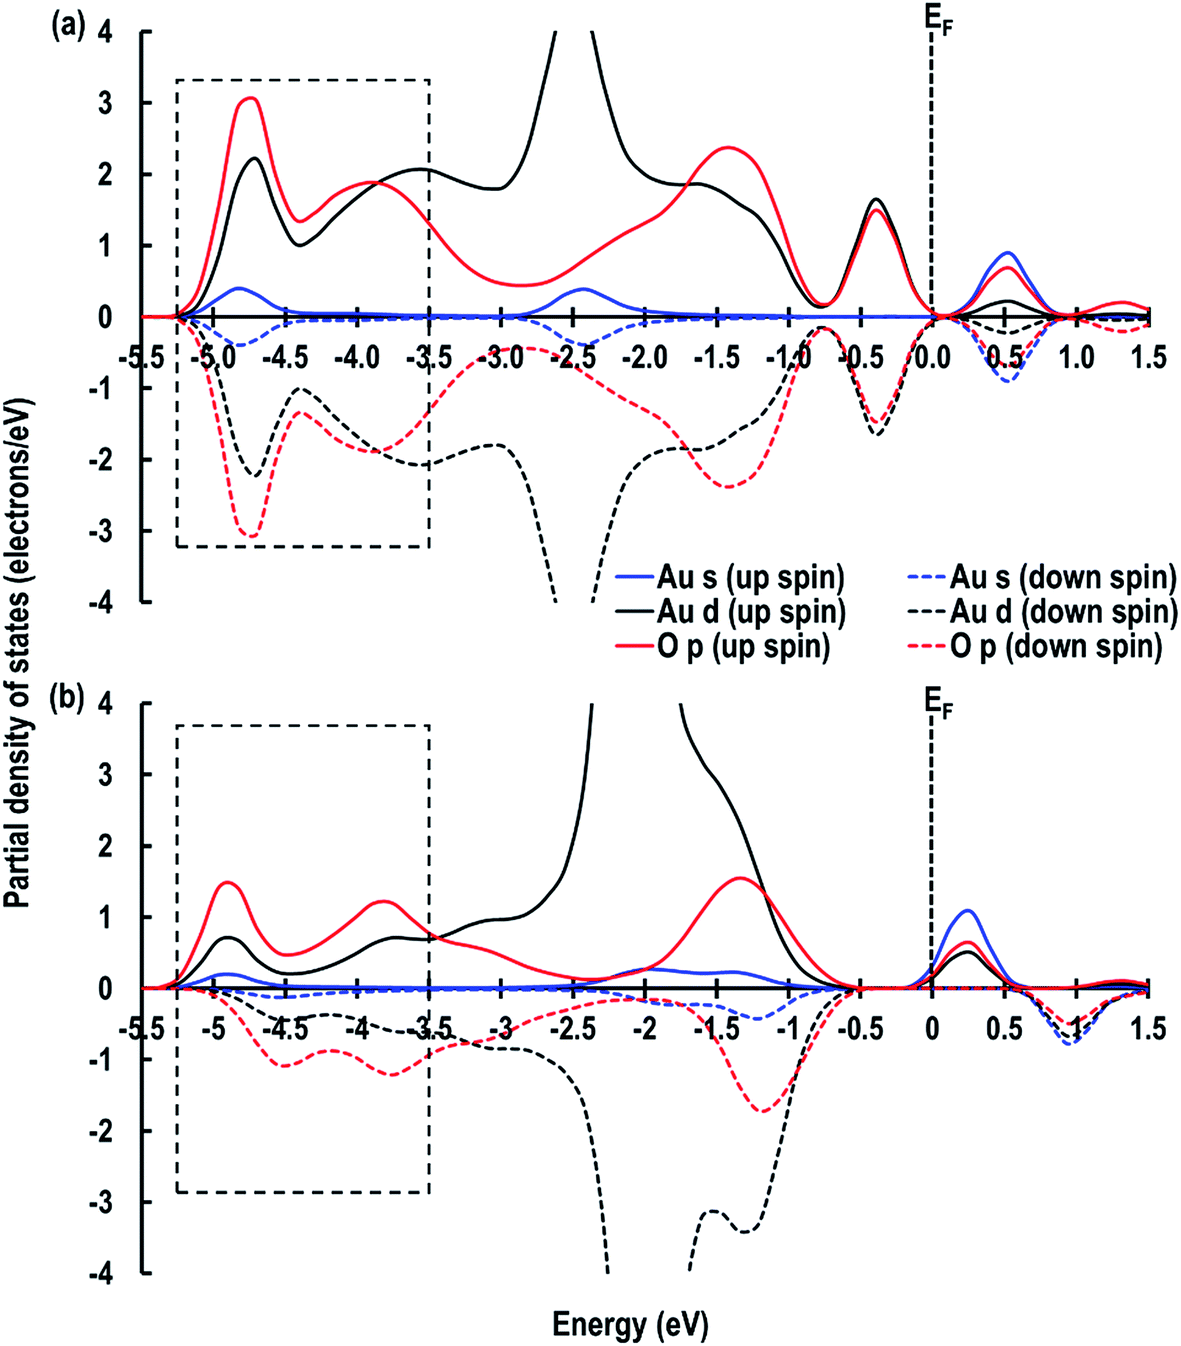
As shown in Table 1, the calculated adsorption energy (Ead) is in the order of: O⋯Obridge (−1.132 eV) < Otop (−0.977 eV) < 4-fold hollow (−0.684 eV) < Cetop (−0.332 eV) i.e., the lowest energy site for an Au atom is the O⋯Obridge position. As mentioned in the previous section, in both Otop and O–Cebridge cases, the Au atom moves from its original position to the O⋯Obridge and Otop sites, respectively, and the O⋯Obridge site is −0.155 eV lower in energy than the Otop system. To help clarify the reason for this difference, we examine the partial density of states (PDOS), which shows that in the case of the O⋯Obridge system, the up and down-spin signatures due to the O p, Au (s and d) orbitals are symmetrical, but in the Otop system, the up-spin and down-spin signatures are asymmetrical (Fig. 3(a and b)), which may be related to the fact that in the former case the O p-orbital signatures are due to Au interacting with two O atoms, while in the latter, only one O atom is involved. Furthermore, we also observe that around the Fermi energy (EF) in the O⋯Obridge system, there is overlapping of the Au d-orbitals with the O p-orbital, which is absent for the Otop system. In addition to it at around ∼−3.5 eV to ∼−5.3 eV (marked by rectangular box in Fig. 3) we can also see that the intensities of the overlapping O p and Au d orbitals are significantly higher for the O⋯Obridge system as compared to the Otop system, which also clearly shows stronger interaction between adsorbed Au atom with the CeO2 surface in the former case.
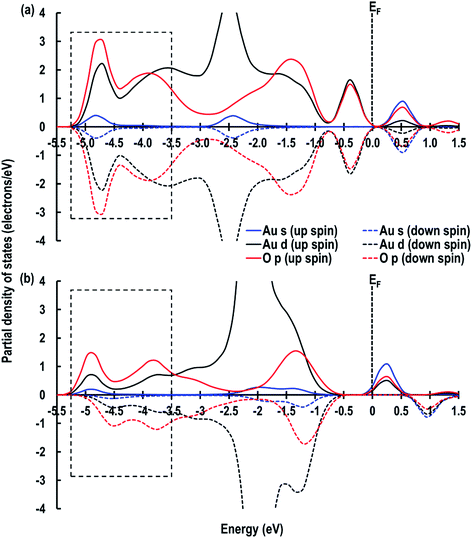 |
| | Fig. 3 Partial density of states for the (a) O⋯Obridge, (b) Otop systems. The Fermi energy (EF) is shifted to zero and is marked by a dashed line. | |
Electron transfer between the Au atom and the CeO2 (110) surface.
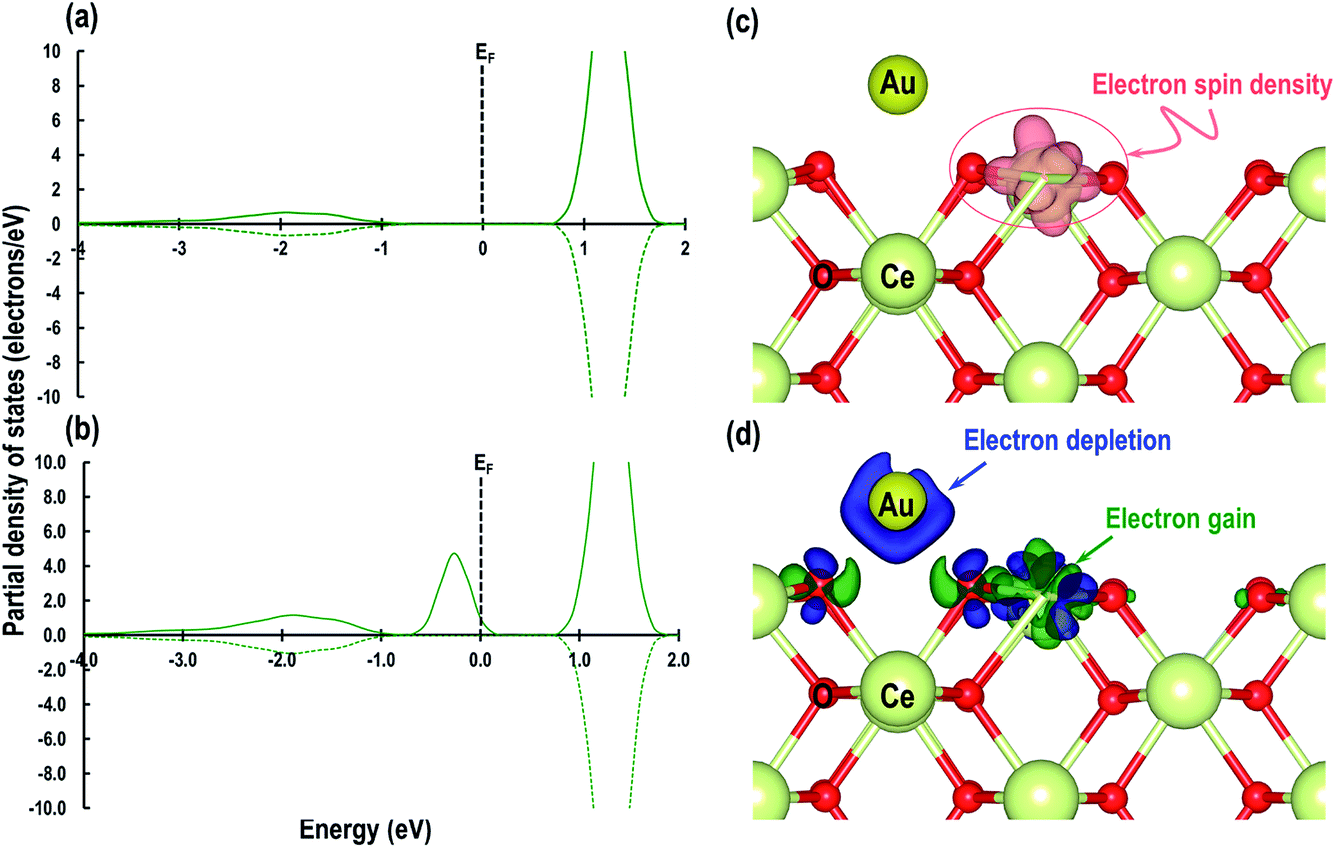
Having studied the adsorption properties of the Au atom on the CeO2 (110) surface, we then investigate the electron transfer between the Au atom and CeO2 (110) surface. We compare the f-orbital contribution for a Ce atom in the pristine CeO2 (110) surface with that of a Ce atom in the O⋯Obridge system. As shown in Fig. 4(a and b), we find that in both cases there are traces of the f-orbital signatures from −3 eV to −1 eV; but after the adsorption of an Au atom on the CeO2 (110) surface in the O⋯Obridge system, the signature due to the f-orbital appears just below the fermi energy (EF), showing the Ce4+ cation is reduced to Ce3+ due to electron transfer from the Au atom. We visualize the isosurface of electron spin density for the O⋯Obridge model, which also displays electron gain by the reduced atom (Fig. 4(c)). We then visualize the electron charge density difference, which is calculated using:| | | ρdiff = ρ(O⋯O)bridge − (ρPristine CeO2 (110) surface + ρAu), | (3) |
where ρdiff is the charge density difference, ρ(O⋯O)bridge is the total charge density of the O⋯Obridge system, ρPristine CeO2 (110) surface is the charge density of the O⋯Obridge system without the Au atoms and ρAu is the charge density of the Au atoms in the gas phase. As shown in Fig. 4(d), we find electron depletion represented by the blue isosurface around the Au atom and electron gain around a Ce atom represented by the green isosurface. There are also some difference density features around two O atoms near the Au atoms, which may be related to the bonding interaction between the surface O atoms and the Au atom.
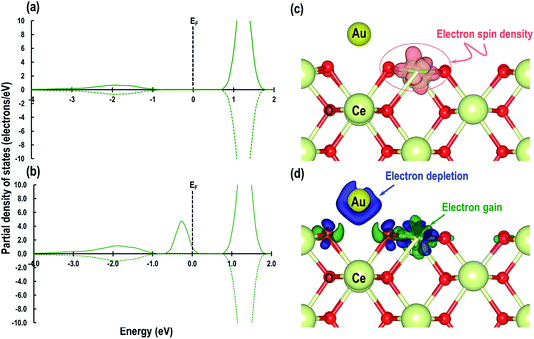 |
| | Fig. 4 Partial density of states of the surface Ce atom that is reduced on adsorption of Au; (a) on a pristine surface and (b) after reduction due to the adsorption of the Au atom. The Fermi energy (EF) is shifted to zero and is marked by a dashed line, (c) electron spin density isosurface of 0.007 e Å−3 representing reduced Ce3+ cation and (d) electron charge density difference with an isosurface of 0.007 e Å−3 showing electron depletion around the Au atom in blue and electron gain in green on the Ce3+ cation. | |
Furthermore, we also compare the Au s-orbital signatures of an Au atom in the gas phase with that of the adsorbed Au atom on the CeO2 (110) surface (see Fig. S1 in ESI†) to confirm the loss of electron from the Au atom. From this comparison, we see that for the free Au atom, the up-spin Au s-orbital signature is just below the EF while the down-spin signature is above it. After the adsorption of the Au adatom both up and down-spin signatures appear above EF, which also confirms the transfer of the Au 6s1 electron to the Ce atom to give an Au+ species. Our results on Au+ agrees well with those reported by Branda et al.17c The electron transfer phenomenon is finally illustrated by calculating the Bader charges, which give +2.383 e, −1.191 e and +0.263 e for Ce4+, O2− and Au+ atoms, respectively, on the CeO2 (110) surface. These calculated charges on O2− and Ce4+ atoms accord with our previous studies on Cu/CeO2 (110) surface,18i.e. +2.385 e for Ce, −1.196 e for O2− atoms and +0.454 e for Cu1+ ions. The Bader charge on the reduced Ce atoms is seen to be +2.092 e confirming electron gain.
3.2. Adsorption of Au on the CeO2 (110) surface with an O-vacancy
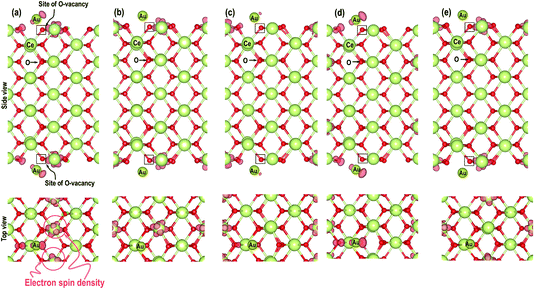
In the next step, we investigate the adsorption of Au on top of an O-vacancy in two steps i.e. we create an O-vacancy on the CeO2 (110) surface and investigate the influence of the resulting reduced Ce atoms at different distances from the O-vacancy on the adsorption properties of Au. We note that previous work has shown that the lowest energy configuration of an oxygen vacancy in ceria involves reduction of neighbouring Ce ions and so these configurations are explored first, followed by a fully unconstrained minimisation.35 The reduced Ce atoms are modelled next to the vacancy sites. The modelling of reduced Ce atoms in the various sites is effected by replacing the chosen Ce atoms with La atoms in the initial relaxation runs followed by full relaxation with the La atoms replaced again by the Ce atoms; a procedure shown previously to be effective in localising charge on the Ce.17c,18 To avoid any spurious dipole moments, the oxygen vacancies were generated in symmetrically equivalent positions on both sides of the slab model. We will refer to these models as “Case X” (X = 1–5).
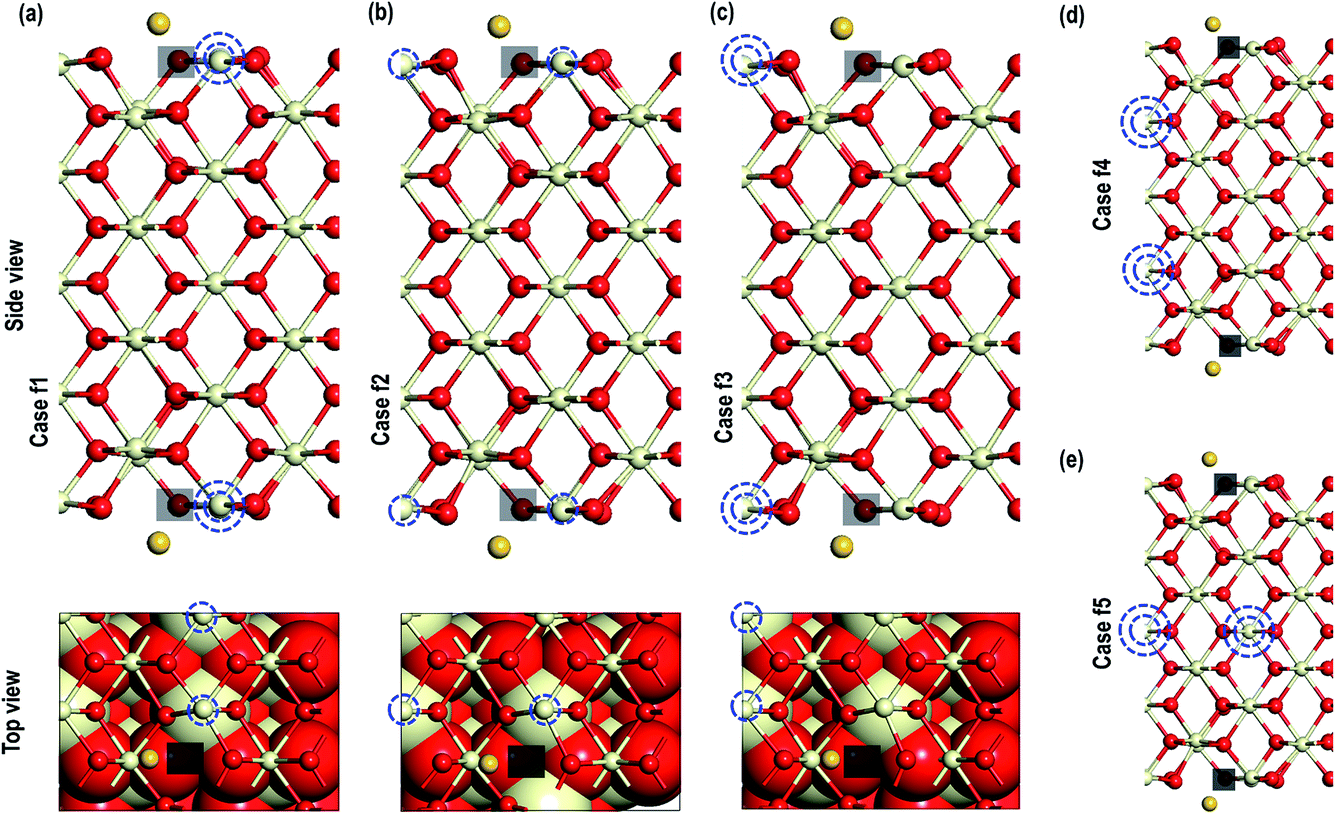
The optimized structures of the Au atom adsorbed on the top of an O-vacancy with the two extra electrons due to the O-vacancy localized on various Ce sites are shown in Fig. 5. In the figure, the localization sites of the electrons are shown with blue dotted lines. The calculated Au adsorption energy shows the following order: case 1 (−1.584 eV) < case 5 (−1.294 eV) < case 2 (−1.289 eV) < case 3 (−1.241 eV) < case 4 (−1.061 eV). On the optimized structures, we analyze the geometry and other electronic properties such as electron density and PDOS for Au atoms for all the cases (1–5). On monitoring the various interatomic distances such as the nearest Au–O, Ce–O on the surface and in the bulk, we find that the Ce–O distances on the surface and in the bulk are comparable (Table 2). The distance between Au–O, however, shows the expected trend, i.e. for the systems with the highest (most negative) adsorption energies (in cases 2 and 5) the Au–O distances are shorter than the rest (i.e., in cases 1, 3, and 4).
 |
| | Fig. 5 Optimized structure of Au adatom adsorbed on top of an O-vacancy with the localisation of extra two electrons on (a) a Ce atom close to the O-vacancy another far (case 1), (b) a Ce atom close to the O-vacancy and another on the other side of the long-bridge (case 2), (c) two Ce atoms on the other side of the long-bridge (case 3), (d) two Ce with localisation in the second sub-surface (case 4) and (e) electron localised on the fifth sub-surface (case 5). The site of electron localisation is shown by blue dotted circles. For clarity the top and side views for first three cases are shown. The transparent black box represents the site of O-vacancies. | |
Table 2 The average (O–Ce)srf (distance between O and Ce on the surface), (O–Ce)blk (distance between O and Ce in the bulk), and Ot–Au (distance between surface O and Au adatom). The Bader charges on O, Ce4+, Ce3+ (1), Ce3+ (2) and Au−
| System |
Average interatomic distances (Å) |
E
ad (eV) |
Average Bader charges (e) |
| (O–Ce)srf |
(O–Ce)blk |
(O–Au)nearest |
O |
Ce |
Ce3+ (1) |
Ce3+ (2) |
Au |
| Case 1 |
2.364 |
2.373 |
2.340 |
−1.584 |
−1.198 |
2.385 |
2.059 |
2.113 |
−0.413 |
| Case 2 |
2.394 |
2.381 |
2.157 |
−1.289 |
−1.198 |
2.380 |
2.047 |
2.094 |
−0.289 |
| Case 3 |
2.376 |
2.379 |
2.305 |
−1.241 |
−1.198 |
2.377 |
2.108 |
2.121 |
−0.314 |
| Case 4 |
2.347 |
2.380 |
2.305 |
−1.061 |
−1.198 |
2.369 |
2.218 |
2.220 |
−0.413 |
| Case 5 |
2.359 |
2.380 |
2.152 |
−1.294 |
−1.198 |
2.368 |
2.098 |
2.240 |
−0.289 |
| Case 6 |
2.321 |
2.378 |
2.978 |
−1.992 |
−1.194 |
2.376 |
2.053 |
— |
−0.657 |
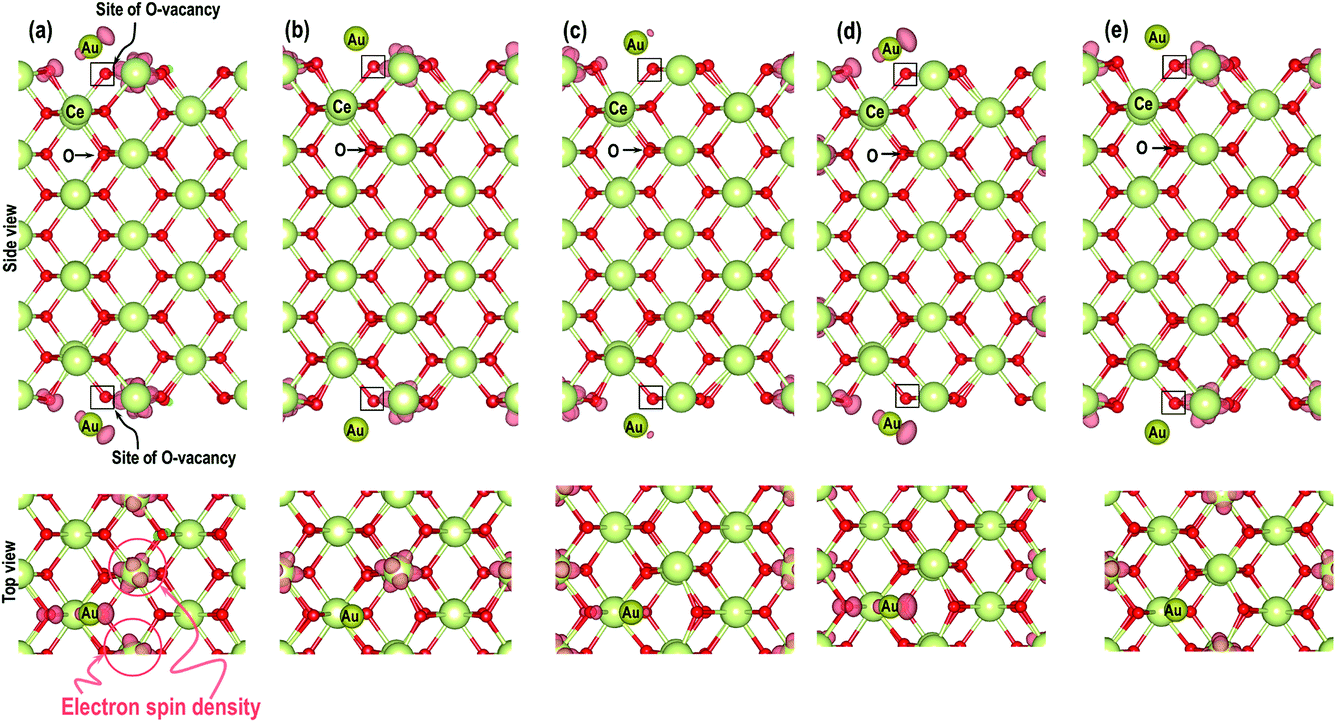
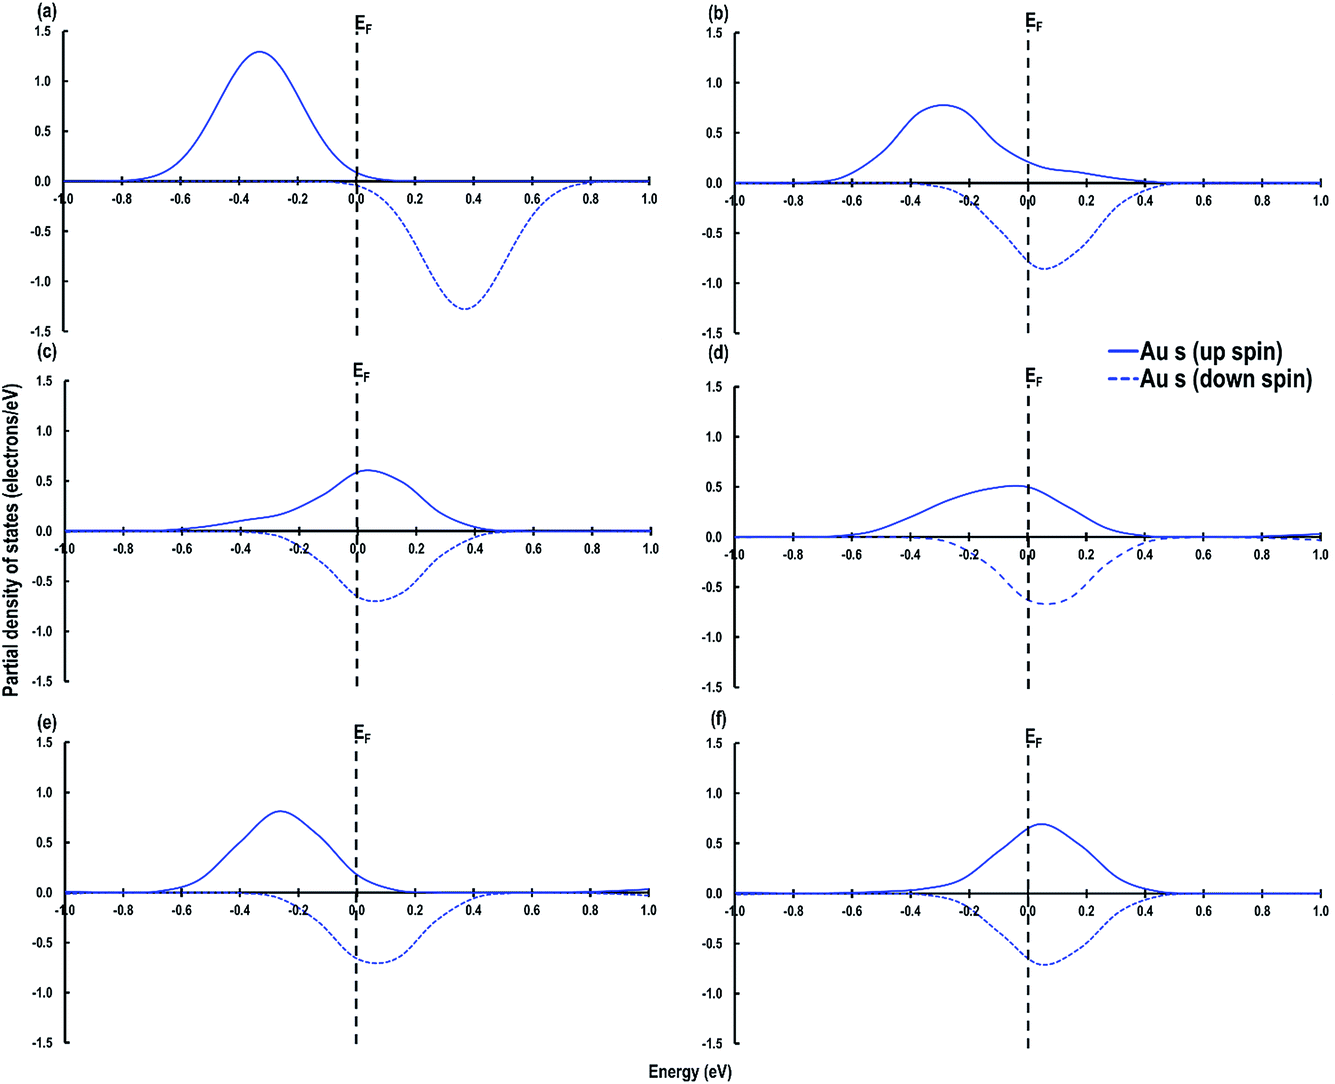
As shown in Fig. 6, we visualize the electron spin density of all these systems, which shows that, except for case 4, we find that irrespective of where the electrons are initially localized, after full relaxation the reduced Ce atoms are located on the surface. From the spin density, we observe, as expected, that two Ce atoms are reduced per O-vacancy. We also find localization of spin density on the Au atoms as well, except for cases 2 and 5. We plot the PDOS of Au atoms and compare it with the PDOS of a single Au atom (Fig. 7(a)), which shows that the unoccupied states of Au 6s orbitals (down-spin signatures in Fig. 7) move slightly below the EF, indicating accumulation of a small amount of charge on Au atoms i.e., Auδ−. As shown in Table 2, the Bader charge on the Au atoms is in the range of −0.289 e to −0.413 e correlating well with our analysis of the PDOS. We note that when the Bader charge on the Au atom is more positive than −0.319 e (cases 2, 3 and 5), the up and down-spin Au s-orbitals both move towards the EF. Furthermore, from the Bader charge analysis, we find that due to an O-vacancy, there are two types of reduced Ce atoms, which we refer to as Ce3+ (1) and Ce3+ (2). One of these Ce3+ atoms is relatively more positive than the other, although the difference in Bader charges between these two Ce atoms is more prominent in cases 1 and 5; but in cases 2 and 3, this difference is insignificant. The charges on the other O2− and Ce4+ ions are approximately −1.197 e and +2.385 e, respectively. This analysis leads us to conclude that the adsorption of an Au adatom on top of an O-vacancy may result in one of the two Ce atoms being partially reduced, with the partial reduction of the Au adatom resulting in an Auδ− species.
 |
| | Fig. 6 Side and top views of electron spin density for the models (a) case 1, (b) case 2, (c) case 3, (d) case 4 and (e) case 5. The site of the O-vacancy is represented by an open black rectangular box and the pink lobe represents the electron spin densities with an isosurface of 0.007 e Å−3. | |
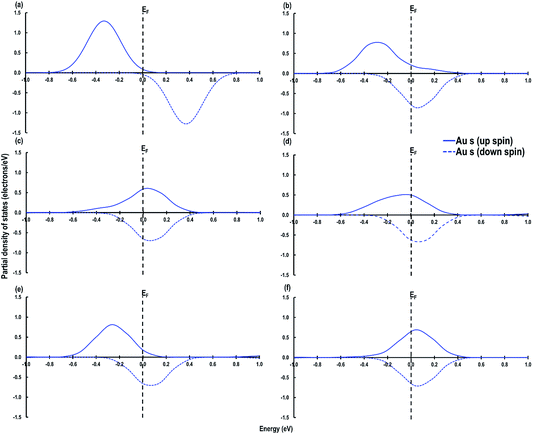 |
| | Fig. 7 Au s-orbital signatures for (a) Au atom in the gas phase, (b) case 1, (c) case 2, (d) case 3, (e) case 4 and (f) case 5. The Fermi energy (EF) is shown by a dashed line crossing through 0. | |
Next we relaxed fully a model of Au adsorbed on top of an O-vacancy without following the procedure for localizing the electrons left behind due to the O-vacancy, which we will refer to as case 6. Our calculation shows that for this model, the adsorption energy is −1.992 eV, which is higher than found in the other configurations and which means the adsorption of an Au atom on the top of an O-vacancy is more stable than the O⋯Obridge of a pristine CeO2 (110) surface. On the fully relaxed case 6 model we performed a detailed electronic structure study. We begin with the analysis of electron spin density from which, as shown in Fig. 8(a), we observe that on both the exposed surfaces, there is only one Ce atom with electron spin density. To clarify the electron transfer phenomenon on this system, we plot the PDOS of the adsorbed Au atom over the O-vacancy and of the reduced Ce. Unlike the PDOS for the s-orbital in an Au atom (ESI Fig. S1(a)†), the PDOS for the s-orbital signature for the Au adatom on top of the O-vacancy shows both the up-spin and down-spin signatures below the EF, which is a clear indication of electron gain (see Fig. 8(b)). Similarly, a plot of the PDOS for the Ce atom with spin density also shows electron gain (see Fig. 8(c)). The average Bader charge on all the O2− ions is −1.194 e and on all the Ce4+ ions is +2.376 e. The average Bader charges on the Au− and the reduced Ce3+ ion are −0.657 e and +2.053 e, respectively, which is also a clear illustration of electron transfer to Au atoms and reduction of the Ce atoms due to the presence of an O-vacancy. Previously Hernandez et al. also reported that Au adatom adsorbed close to an O-vacancy on CeO2 (111) leads to Au− as well.17b We conclude that this configuration with a larger electron transfer to the Au and only one reduced Ce is the lowest energy state of Au absorbed over an oxygen vacancy, which in turn is lower in energy than adsorption on the pristine surface, although we note that alternative configurations involving two reduced Ce ions are close in energy indicating a complex electronic structure for this system.
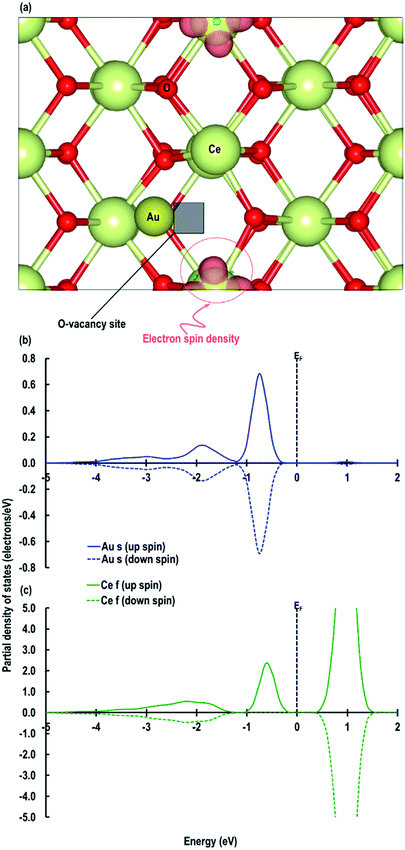 |
| | Fig. 8 (a) Electron spin density for the system of an Au atom adsorbed on top of an O-vacancy (shown as a black transparent box) without following the procedure for localising the electron (case 6), partial density of states (b) for the Au atom adsorbed on top of an O-vacancy and (c) for the reduced Ce on the CeO2 (110) surface close to the O-vacancy. | |
Finally, we carried out a calculation on the adsorption of an Au adatom on top of an O-vacancy with five atomic layered CeO2 (110) (3 × 3) surface model (CeO2 (110)3×3 model). This calculation is performed in order to check the consistencies in results when we study the adsorption of Au adatom on top of an O-vacancy in the presence of water molecules only on one exposed surface of CeO2 (110) models. The bottom three layers of the models are fixed to mimic the bulk of the CeO2 (110) surface. We account for the dipole moment due to the adsorption of the Au atom on only one side of the two exposed surfaces by using the dipole correction methods as implemented in VASP according to the procedures of Makov et al. and Neugebauer et al. as mentioned in the computational details.26,27 The average Bader charges on Ce4+, Ce3+, O and Au− species for the CeO2 (110)3×3 model are +2.350 e, +2.050 e, −1.177 e and −0.674 e respectively. On analyzing other electronic properties such as electron spin density and PDOS of the reduced Ce atom we observe similar results to those discussed above, i.e., reduction of a Ce4+ to Ce3+ cation and electron transfer to Au adatom giving Au− anion due to an O-vacancy (see Fig. S2 in the ESI†).
3.3. Adsorption of Au on the CeO2 (110) surface with an O-vacancy in the presence of water
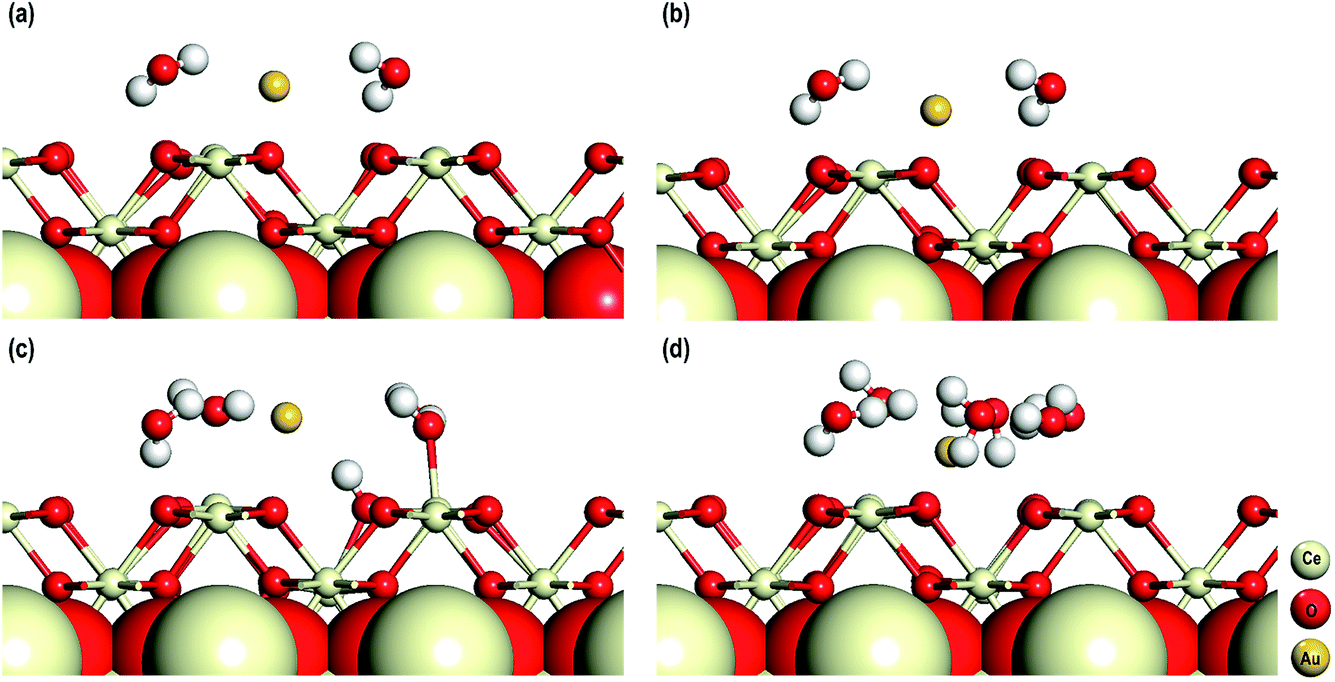
In the final stage of our study, we explore the influence of solvent molecules on their electronic properties on the adsorption of an Au adatom on the CeO2 (110) surface in the presence of an O-vacancy. In addition to DFT+U, for these calculations we also use Grimme’s D3 correction as with the inclusion of solvent molecules the dispersive effects might be important. These calculations are performed in the presence of 2, 4 and 6 water molecules and in all these systems an Au adatom is adsorbed on top of an O-vacancy. For these calculations we used five atomic layered CeO2 (110) (3 × 3) surface models with the bottom three layers fixed to mimic the bulk of the CeO2 (110) surface. The dipole moments are taken into account by considering the procedures of Makov et al. and Neugebauer et al. as mentioned in the computational details.26,27 The optimized structures of these models are shown in Fig. 9.
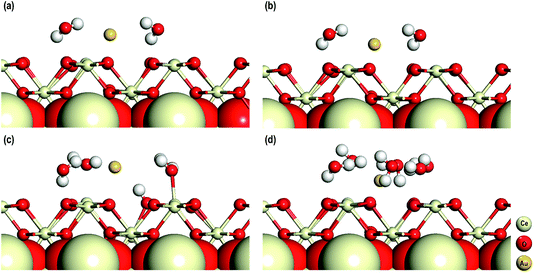 |
| | Fig. 9 (a) The optimized structures of the system with two water molecules at DFT+U level of theory. The optimized structures of the system with (b) two, (c) four and (d) six water molecules at DFT+U+D3 level of theory. | |
The average (O–Ce)srf, (O–H)wat, Owat–Cesrf and Owat–Au interatomic distances are first studied and we find that for all the models these distances are comparable. Interestingly, whether or not we use D3 corrections (for the models with two water molecules) these geometrical parameters are similar (see Fig. 9(a and b) and Table 3). In all the systems, we find that the water molecules arrange themselves in such a way as to form H-bonds either with the surface O atoms or among themselves. In the model with 4 water molecules, we also observe dissociation of one of the four water molecules. The dissociated water molecule is adsorbed on the surface forming a bond with the nearby Ce atom with an interatomic distance of 2.295 Å, which is comparable to the O–Ce distances on the surface (Table 3). The dissociated protonic hydrogen adsorbs on a nearby surface O atom with an interatomic distance of 0.993 Å, which is also comparable with the O–H distance in water molecules. No such dissociation of water molecules is seen in the other models.
Table 3 The average (O–Ce)srf (distance between O and Ce on the surface), (O–H)wat (distance between O and H in the water molecules), Owat–Cesrf (distance between O of water and Ce on the surface) and Owat–Au (distance between O of water and Au adatom). The Bader charges on O, Ce4+, Ce3+, Au−, Owat (O of water molecule) and Hwat (H of water molecule)
| System |
Interatomic distances (Å) |
Bader charges (e) |
| (O–Ce)srf |
Owat–Au |
(O–H)wat |
Owat–Ce |
O |
Ce4+ |
Ce3+ |
Au− |
Owat |
Hwat |
| 2 wat DFT+U |
2.325 |
3.310 |
0.992 |
2.668 |
−1.178 |
2.349 |
2.193 |
−0.666 |
−1.261 |
0.612 |
| 2 wat DFT+U+D3 |
2.324 |
3.292 |
0.992 |
2.658 |
−1.178 |
2.347 |
2.227 |
−0.656 |
−1.276 |
0.619 |
| 4 wat DFT+U+D3 |
2.343 |
3.579 |
0.996 |
2.562 |
−1.179 |
2.357 |
2.070 |
−0.651 |
−1.265 |
0.606 |
| 6 wat DFT+U+D3 |
2.334 |
3.563 |
0.996 |
2.635 |
−1.179 |
2.356 |
2.073 |
−0.604 |
−1.256 |
0.611 |
After having considered the geometries of these systems, we also analyze the electron transfer with the help of Bader charges and partial density of states. In Table 3 we have summarized the Bader charges of different atoms from which we can observe that the average charges on O, Ce4+, Owat and Hwat atoms in all the models are comparable. We can also clearly see that in each of the models, one of the Ce atoms has a slightly lower positive charge compared with the Ce4+ atoms, indicating that the Ce4+ cations are reduced to Ce3+ cations due to the presence of the O-vacancy. The charges on the Au atoms also show electron gain. A visualization of the electron spin densities in all these models supports the reduction of one Ce atom (Fig. 10). Finally, we analyze the PDOS of the adsorbed Au s-orbital signatures and compare it with the Au in all the models. Both the up and down-spin signatures due to Au s-orbitals are below the EF confirming electron gain by the Au adatom leading to an Au− species (Fig. S3†). Furthermore, we compare the Bader charges on the CeO2 (110)3×3 model without any water molecules (Section 3.2) and with two water molecules, which show that even though the charges on Ce4+, O and Au− species are comparable, the charges on Ce3+ cations display slight differences, i.e. the charge on the reduced Ce3+ cation in the absence of two water molecules is +2.050 e while in the presence of two molecules it is +2.193 e. The difference in charge is +0.143 e, which may be attributed to the redistribution of charges due to the presence of water molecules.
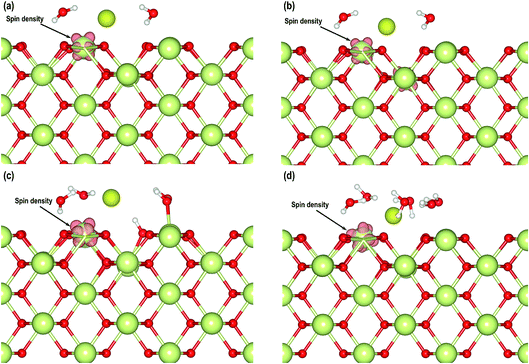 |
| | Fig. 10 (a) Electron spin density for model with two water molecules obtained by DFT+U calculations at an isosurface of 0.007 e Å−3. Electron spin density for model with (b) two, (c) four and (d) six water molecules obtained by DFT+U+D3 calculations at an isosurface of 0.007 e Å−3. | |
From the above study on the adsorption of an Au adatom on top of an O-vacancy we conclude that, both in the presence and absence of water, such adsorption may led to two configurations with similar energies: first, an anionic metal atom (Au−) with the reduction of a Ce4+ cation to Ce3+ cation, secondly, a fully reduced Ce3+ cation and a partially reduced Ce3+ cation with an Auδ− species. In the next section, we extend our study to the Au2 dimer on the CeO2 (110) surface with and without an O-vacancy.
3.4. Adsorption of Au2 on the CeO2 (110) surface
Geometry and their stability.
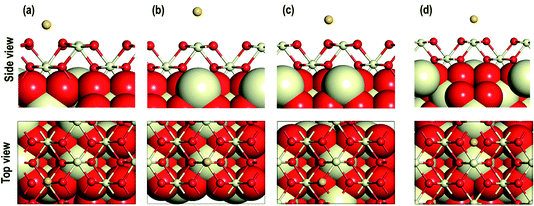
From our studies on Au adatom adsorption on the CeO2 (110) surface, we saw that the Au adatoms are most stable on the long bridge site. Therefore, we use this structure to study the adsorption of an Au2 dimer on the CeO2 (110) surface. We consider three models i.e., MAu-Dim 1: one of the two Au atoms on the long-bridge site and another on the 4-foldhollow site, MAu-Dim 2: both the Au atoms on the long-bridge site, and MAu-Dim 3: one of the two Au atoms is on the long-bridge site and the other above it. Fig. 11 shows the top and side view of the initial and the final structures. In models 1 and 2 we observe that one of the two Au atoms is closer to the surface, causing the Au dimer to slant with respect to the surface. In the third model, the vertical geometry of the Au dimer relative to the surface does not change after relaxation. In MAu-Dim 1, both the Au atoms are within the bonding distance from the surface O atoms with a distance of 2.089 Å and 2.139 Å. In the other two models, however, only one of the two Au atoms are within a bonding distance from a surface O atom. As shown in the Table 4, the Au–Au distances are comparable in all three models. The Ce–O distances on the surface and in the bulk, are also comparable to each other. The calculated adsorption energies show the following order: MAu-Dim 2 (−1.237 eV) < MAu-Dim 3 (−1.039 eV) < MAu-Dim 1 (−1.018 eV), so model 2 has a lower energy than the other two models by approximately −0.20 eV.
 |
| | Fig. 11 Au2 on (a) MAu-Dim 1: one of the two Au atoms on the long-bridge site and another on the 4-foldhollow site, (b) MAu-Dim 2: both the Au atoms on the long-bridge site and (c) MAu-Dim 3: one of the two Au atoms is on the long-bridge site and the other above it. | |
Table 4 The average interatomic distances in Å, adsorption energies in eV and average Bader charges in units of e for the MAu-Dim models
| Systems |
Average interatomic distances (Å) |
E
ad (eV) |
Bader charge analysis (e) |
| Ce–Osrf |
Ce–Oblk |
(Au–O)a |
(Au–O)b |
Au–Au |
O |
O (1) |
O (2) |
Ce |
Au (1) |
Au (2) |
Ce3+ (1) |
Ce3+ (2) |
Ce3+ (3) |
|
Au
2
/CeO
2
(110)
|
| MAu-Dim 1 |
2.356 |
2.377 |
2.139 |
2.089 |
2.588 |
−1.018 |
−1.191 |
−1.046 |
−1.101 |
2.384 |
0.017 |
0.050 |
2.174 |
— |
— |
| MAu-Dim 2 |
2.349 |
2.378 |
2.090 |
— |
2.556 |
−1.237 |
−1.192 |
−1.084 |
−1.096 |
2.389 |
0.274 |
−0.308 |
2.232 |
— |
— |
| 2.274 |
— |
— |
| MAu-Dim 3 |
2.356 |
2.378 |
2.152 |
— |
2.517 |
−1.039 |
−1.195 |
−1.095 |
−1.076 |
2.387 |
0.270 |
−0.214 |
2.159 |
— |
— |
| 2.171 |
— |
— |
![[thin space (1/6-em)]](https://www.rsc.org/images/entities/char_2009.gif) |
|
Au
2
/CeO
2
(110) with O-vacancy
|
| MAu2_O-vac |
2.383 |
2.378 |
2.028 |
— |
2.546 |
−2.759 |
−1.200 |
— |
— |
2.380 |
0.004 |
−0.323 |
2.131 |
2.103 |
— |
Electronic structure.
As shown in Fig. 12(a–c), we find that in all these models the spin densities (with an isosurface of 0.007 e Å−3) are localized on one of the two Au atoms close to the surface and on two O atoms, which may be related to bonding between the Au and O atoms. In addition we note localization of spin densities around one Ce atom with the characteristics of the Ce f orbital, which may be linked to the reduction of the Ce atom. We also plot the 2D contour maps of charge density difference using the equation| | | ρdiff = ρAu2+CeO2 (110) − (ρPristine CeO2 (110) surface + ρAu2), | (4) |
where ρdiff is the charge density difference, ρAu2+CeO2 (110)is the total charge density of the Au2/CeO2 (110) system, ρPristine CeO2 (110) surface is the charge density of the CeO2 (110) system without the Au2 dimmer and ρAu2 is the charge density of the Au2 in the gas phase. We plot 2D contours of ρdiff for one of the two surfaces exposed to the Au2 dimer, which also shows the localization of electrons around two O atoms (labelled as O (1) and O (2)) and a Ce atom (labelled as Ce3+) (see Fig. 12(d–f)). The Bader analysis in Table 4 gives the average charges on the O atoms of ∼−1.193 e but on O (1) and O (2) the average charge is ∼−1.075 e and −1.091 e, respectively, showing that the O atoms closer to the Au share their electrons to form bonds with these nearby Au atoms.
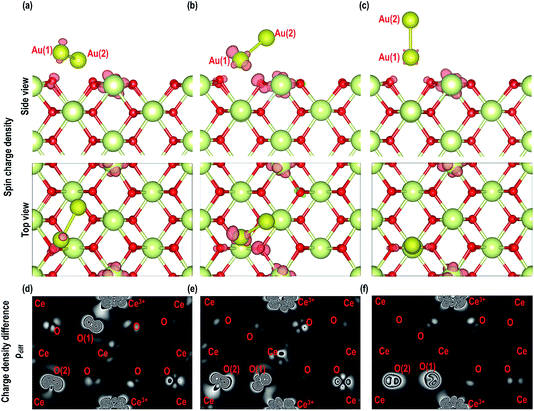 |
| | Fig. 12 Top and side view of isosurface (0.007 e Å−3) of spin densities of Au2 on CeO2 (110) surface for (a) MAu-Dim 1, (b) MAu-Dim 2 and (c) MAu-Dim 3 and 2D charge density difference contour maps of (d) MAu-Dim 1, (e) MAu-Dim 2 and (f) MAu-Dim 3. | |
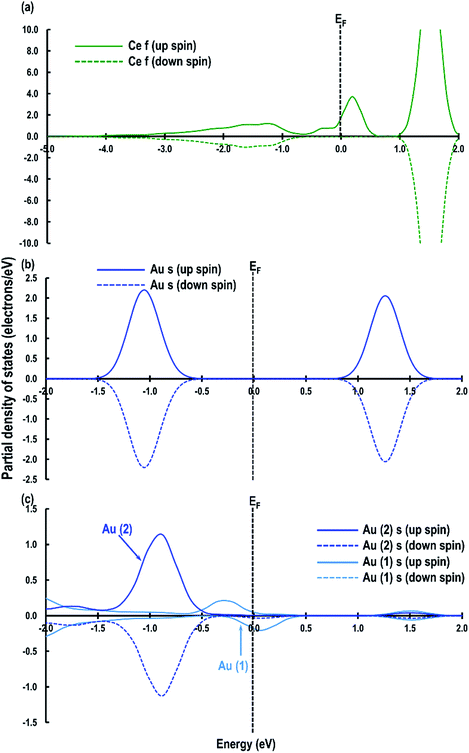
We now investigate the electron transfer phenomenon in the MAu-Dim 2 model which is the most stable structure among all three models considered in this study. The partial density of states for the Ce atom with localized spin density (as shown in Fig. 12(b)) is shown in Fig. 13(a). We observe that the Ce f-orbital signatures are beginning to populate around the EF with a fraction of the signature just below it, indicating partial reduction. Our analysis of the Bader charges shows that the average charge on Ce atoms is +2.387 e and the charge on this Ce atom is +2.188 e, which shows that this Ce atom is partially reduced by the Au atoms closer to the surface, which have a charge of +0.274 e. It is also interesting to note that the Au atom further away from the surface (Au (2)) has a charge of −0.308 e. To clarify this observation, we make a comparative analysis of the PDOS for Au2 dimer in the gas phase and Au2 dimer adsorbed on the CeO2 (110) surface in the MAu-Dim 2 model (Fig. 13(b and c)). The PDOS for Au2 dimer in the gas phase shows symmetrical up and down-spin signatures of Au s-orbitals above and below EF. The two up and down-spin signatures below the EF represent the occupied Au 6s1 electrons from both the Au atoms of the Au2 dimer. Similarly, the up and down-spin orbital signatures above the EF represent the unoccupied 6s-orbitals. It is clear that, unlike the PDOS for the Au atom (Fig. 7(a)), for the Au2 dimer in Fig. 13(b) an energy gap appears between the highest occupied and lowest unoccupied orbitals. We then compared the Au s-orbital signatures from the Au atoms in the Au2 in MAu-Dim 2 model. As shown in Fig. 13(c), the Au (2) atom, which is away from the surface, has prominent signatures for up and down-spin signatures below the EF which are very small above the EF, showing electron gain in Au (2). However, the Au (1) atom, which is closer to the surface, has asymmetric contribution from the Au s-orbital signature around the Fermi energy and a majority of the down-spin signature is above the EF, which shows electron charge depletion on Au (1). Calculated Bader charges show that Au (1) and Au (2) have charges of +0.274 e and −0.308 e, respectively, confirming our PDOS analysis. From this analysis, we find that Au (1) closer to the surface may share its electron partially with the other Au atom leading to a Auδ+–Auδ−-like system and may simultaneously partially reduce a Ce atom on the surface.
 |
| | Fig. 13 Partial density of states for the (a) partially reduced Ce atom, (b) Au2 dimer in the gas phase and (c) for the Au2 in MAu-Dim 2 model. The EF is moved to zero for convenience and is shown by a dotted line. | |
We now extend this study further to investigate the adsorption properties of Au2 systems on the CeO2 (110) surface with an O-vacancy on the surface, sub-surface and in the bulk, which we present in the following section.
3.5. Adsorption of Au2 on the CeO2 (110) surface with an O-vacancy
For our studies on the adsorption properties of the Au2 dimer in the presence of an O-vacancy we consider the most stable structure from the previous section and create an O-vacancy on the surface. We will refer to this model as MAu2_O-Vac. The optimized structure for this model is shown in Fig. 14. There are minute contractions and expansions of bonds around the O-vacancy and near the Au2 adsorbed sites. Various interatomic distances of this model are summarized in Table 4. The distance between O–Au is 2.028 Å. An important feature, noted in the relaxed geometry of this model is that, on relaxation, the Au2 dimer on top of the O-vacancy changes its orientation to form a bond with a nearby O atom as shown in Fig. 14(a and b). The calculated adsorption energy shows that MAu2_O-Vac is the most stable system with a value of −2.759 eV (see Table 4). Like the Au/CeO2 (110) in Au2/CeO2 (110) systems, we find that Au is most stable on top of an O-vacancy.
 |
| | Fig. 14 (a) Initial and (b) final structure of the MAu2_O-Vac model. (c) Top and (d) side views of the isosurface (0.007 e Å−3) of spin densities of the MAu2_O-Vac model. The transparent black rectangle represents an O-vacancy and the dotted circle and rectangle represent the isosurface (0.007 e Å−3) of spin densities. | |
Finally, we analyze the electron transfer phenomenon and, as shown in Fig. 14(c and d), the visualization of the electron spin density shows that two Ce atoms are reduced. To quantify our observation on spin densities we calculated the Bader charges, which show that there are two reduced Ce3+ atoms i.e., Ce3+ (1) with a Bader charge of +2.131 e and Ce3+ (2) with a Bader charge of +2.103 e (see Table 4). Like the MAu-Dim (1–3) models, for the MAu2_O-Vac model the Au atom that is closer to the surface i.e., Au (1) in Table 4, has a slightly positive charge and the Au atom away from the surface Au (2) has a negative charge. From our studies on the adsorption of the Au2 dimer on the CeO2 (110) surface with and without O-vacancies we conclude that we observe Auδ+–Auδ−-like systems. On the CeO2 (110) surface without an O-vacancy we show clear evidence of electron transfer from the Au2 dimer but on the CeO2 (110) surface with an O-vacancy we find reduction of Ce atoms rather than transfer to the Au.
4. Summary and conclusions
Our DFT+U calculations have revealed a range of interesting Au+, Au−, Auδ− and Auδ+–Auδ−-like species on the CeO2 (110) surface, as indicated by our analysis of partial density of states, electron spin densities, electron charge density differences and Bader charges. We conclude that the adsorption of an Au adatom will lead to Au+ species due to electron transfer from Au to Ce; similarly the adsorption of an Au adatom on top of an O-vacancy will lead to Au− species. However, if there is a partial reduction of a Ce atom on the surface of the CeO2 (110) surface then we can see Auδ− species. We also found that the adsorption of the Au-adatom on top of an O-vacancy is more stable than the pristine CeO2 (110) surface. From our studies on the adsorption of the Au2 dimer on the CeO2 (110) surface we also draw similar conclusions that the Au2 dimer is stable on top of an O-vacancy. Another significant point is that in Au2/CeO2 (110) systems, based on whether the Au atoms are closer or away from CeO2 surface, there may be different electron loss or gain behaviour and we may observe unique Auδ+–Auδ−-like species. This study presents a detailed theoretical insight into the conditions under which we can observe the experimentally reported charged Au species. In addition to this it paves the way for further studies on the interaction of Au clusters with increasing size on the CeO2 (110) surface with and without O-vacancies, which will lead to clearer understanding of the electron transfer phenomenon in such systems.
Acknowledgements
The UK Catalysis is thanked for resources and support provided via our membership of the UK Catalysis Hub consortium and funded by EPSRC (grants EP/K014706/1, EP/K014668/1, EP/K014854/1, EP/K014714/1, EP/M013219/1). Via our membership of the UK’s HEC Materials Chemistry Consortium, which is funded by EPSRC (EP/L000202), this work used the ARCHER UK National Supercomputing Service (http://www.archer.ac.uk). We also thank HPCWales for computer time. Data: The data used to generate the results given in this paper can be found at: http://doi.org/10.17035/d.2018.0045182737.
References
- M. Haruta, T. Kobayashi, H. Sano and N. Yamada, Chem. Lett., 1987, 16, 405–408 CrossRef.
- G. J. Hutchings, J. Catal., 1985, 96, 292–295 CrossRef.
- A. S. K. Hashmi and G. J. Hutchings, Angew. Chem., Int. Ed., 2006, 45, 7896–7936 CrossRef PubMed.
- M. Cargnello, C. Gentilini, T. Montini, E. Fonda, S. Mehraeen, M. Chi, M. Herrera-Collado, N. D. Browning, S. Polizzi, L. Pasquato and P. Fornasiero, Chem. Mater., 2010, 22, 4335–4345 CrossRef.
- S. Zhang, X. S. Li, B. Chen, X. Zhu, C. Shi and A. M. Zhu, ACS Catal., 2014, 4, 3481–3489 CrossRef.
- Z. Zhou, S. Kooi, M. Flytzani-Stephanopoulos and H. Saltsburg, Adv. Funct. Mater., 2008, 18, 2801–2807 CrossRef.
- X. Wang, J. A. Rodriguez, J. C. Hanson, M. Pérez and J. Evans, J. Chem. Phys., 2005, 123, 221101 CrossRef PubMed.
- Q. Li, W. Xie, G. Chen, Y. Li, Y. Huang and X. Chen, Nano Res., 2015, 8, 3075–3084 CrossRef.
- A. Karpenko, R. Leppelt, J. Cai, V. Plzak, A. Chuvilin, U. Kaiser and R. J. Behm, J. Catal., 2007, 250, 139–150 CrossRef.
- F. Pilger, A. Testino, M. A. Lucchini, A. Kambolis, M. Tarik, M. El Kazzi, Y. Arroyo, M. D. Rossell and C. Ludwig, J. Nanosci. Nanotechnol., 2015, 15, 3530–3539 CrossRef PubMed.
- T. Akita, M. Okumura, K. Tanaka, M. Kohyama, S. Tsubota and M. Haruta, J. Electron Microsc., 2005, 40, 3101–3106 Search PubMed.
- S. Scirè, C. Crisafulli, P. M. Riccobene, G. Patanè and A. Pistone, Appl. Catal., A, 2012, 417–418, 66–75 CrossRef.
- W. Deng, C. Carpenter, N. Yi and M. Flytzani-Stephanopoulos, Top. Catal., 2007, 44, 199–208 CrossRef.
- M. F. Camellone and S. Fabris, J. Am. Chem. Soc., 2009, 131, 10473–10483 CrossRef PubMed.
- Y. Chen, P. Hu, M.-H. Lee and H. Wang, Surf. Sci., 2008, 602, 1736–1741 CrossRef.
- G. E. Murgida and M. V. Ganduglia-Pirovano, Phys. Rev. Lett., 2013, 110, 1–5 CrossRef PubMed.
-
(a) C. Zhang, A. Michaelides, D. A. King and S. J. Jenkins, J. Phys. Chem. C, 2009, 113, 6411–6417 CrossRef;
(b) N. C. Hernandez, R. Grau-Crespo, N. H. de Leeuw and J. F. Sanz, Phys. Chem. Chem. Phys., 2009, 11, 5246–5252 RSC;
(c) M. M. Branda, N. J. Castellani, R. Grau-Crespo, N. H. de Leeuw, N. C. Hernandez, J. F. Sanz, K. M. Neyman and F. Illas, J. Chem. Phys., 2009, 131, 094702 CrossRef PubMed.
- A. Chutia, E. Gibson, M. R. Farrow, P. P. Wells, D. O. Scanlon, N. Dimitratos, D. J. Willock and C. R. A. Catlow, Phys. Chem. Chem. Phys., 2017, 19, 27191–27203 RSC.
- G. Kresse and J. Hafner, Phys. Rev. B, 1993, 47, 558–561 CrossRef.
- G. Kresse and J. Hafner, Phys. Rev. B, 1994, 49, 14251–14269 CrossRef.
- G. Kresse and J. Furthmüller, Phys. Rev. B, 1996, 54, 11169–11186 CrossRef.
- L. Cui, Y. Tang, H. Zhang, L. G. Hector, C. Ouyang, S. Shi, H. Li and L. Chen, Phys. Chem. Chem. Phys., 2012, 14, 1923 RSC.
- M. Nolan, S. Grigoleit, D. C. Sayle, S. C. Parker and G. W. Watson, Surf. Sci., 2005, 576, 217–229 CrossRef.
- P. E. Blöchl, Phys. Rev. B, 1994, 50, 17953–17979 CrossRef.
- J. P. Perdew, K. Burke and M. Ernzerhof, Phys. Rev. Lett., 1996, 77, 3865–3868 CrossRef PubMed.
- G. Makov and M. Payne, Phys. Rev. B, 1995, 51, 4014–4022 CrossRef.
- J. Neugebauer and M. Scheffler, Phys. Rev. B, 1992, 46, 16067–16080 CrossRef.
- S. Grimme, J. Antony, S. Ehrlich and H. Krieg, J. Chem. Phys., 2010, 132, 154104 CrossRef PubMed.
- L. Szabová, M. F. Camellone, M. Huang, V. Matoln and S. Fabris, J. Chem. Phys., 2010, 133, 234705–11 CrossRef PubMed.
- B. J. Morgan, D. O. Scanlon and G. W. Watson, e-J. Surf. Sci. Nanotechnol., 2009, 7, 389–394 CrossRef.
- H. Raebiger, S. Lany and A. Zunger, Phys. Rev. B, 2007, 76, 45209-1–45209-5 CrossRef.
- W. Tang, E. Sanville and G. Henkelman, J. Phys.: Condens. Matter, 2009, 21, 84204 CrossRef PubMed.
- K. Momma and F. Izumi, J. Appl. Crystallogr., 2011, 44, 1272–1276 CrossRef.
- K. Momma and F. Izumi, J. Appl. Crystallogr., 2008, 41, 653–658 CrossRef.
- M. Nolan, S. C. Parker and G. W. Watson, Surf. Sci., 2005, 595, 223–232 CrossRef.
Footnote |
| † Electronic supplementary information (ESI) available. See DOI: 10.1039/c8fd00002f |
|
| This journal is © The Royal Society of Chemistry 2018 |
Click here to see how this site uses Cookies. View our privacy policy here.  Open Access Article
 This Open Access Article is licensed under a
  *abc,
David J.
Willock
*abc,
David J.
Willock