 Open Access Article
 This Open Access Article is licensed under a
 Creative Commons Attribution 3.0 Unported Licence
Supported metal nanoparticles with tailored catalytic properties through sol-immobilisation: applications for the hydrogenation of nitrophenols†
Scott M.
Rogers
 ab,
C. Richard A.
Catlow
abc,
Diego
Gianolio
d,
Peter P.
Wells
*ade and
Nikolaos
Dimitratos
*c
ab,
C. Richard A.
Catlow
abc,
Diego
Gianolio
d,
Peter P.
Wells
*ade and
Nikolaos
Dimitratos
*c
aUK Catalysis Hub, Research Complex at Harwell, Rutherford Appleton Laboratory, Harwell Oxon, Didcot OX11 0FA, UK
bDepartment of Chemistry, University College London, 20 Gordon Street, London WC1H 0AJ, UK
cCardiff Catalysis Institute, School of Chemistry, Cardiff University, Cardiff CF10 3AT, UK. E-mail: dimitratosn@cardiff.ac.uk
dDiamond Light Source, Harwell Science and Innovation Campus, Chilton, Didcot OX11 0DE, UK
eSchool of Chemistry, University of Southampton, Highfield, Southampton SO17 1BJ, UK. E-mail: p.p.wells@soton.ac.uk
First published on 8th March 2018
Abstract
The use of sol-immobilisation to prepare supported metal nanoparticles is an area of growing importance in heterogeneous catalysis; it affords greater control of nanoparticle properties compared to conventional catalytic routes e.g. impregnation. This work, and other recent studies, demonstrate how the properties of the resultant supported metal nanoparticles can be tailored by adjusting the conditions of colloidal synthesis i.e. temperature and solvent. We further demonstrate the applicability of these methods to the hydrogenation of nitrophenols using a series of tailored Pd/TiO2 catalysts, with low Pd loading of 0.2 wt%. Here, the temperature of colloidal synthesis is directly related to the mean particle diameter and the catalytic activity. Smaller Pd particles (2.2 nm, k = 0.632 min−1, TOF = 560 h−1) perform better than their larger counterparts (2.6 nm, k = 0.350 min−1, TOF = 370 h−1) for the hydrogenation of p-nitrophenol, with the catalyst containing smaller NPs found to have increased stability during recyclability studies, with high activity (>90% conversion after 5 minutes) maintained across 5 catalytic cycles.
Introduction
Supported metal nanoparticles (NPs) attract great interest in the field of heterogeneous catalysis due to their unique optical, electronic and catalytic properties compared with their larger counterparts. Tailoring metal NPs is an important step in optimising their performance for a given process; the metal particle size, shape and structure are all pivotal factors in dictating the overall catalytic performance.1–4 Colloidal methods, particularly the sol-immobilisation method, have been successfully utilised to generate metal NPs with desirable characteristics, compared to conventional techniques such as wet impregnation and deposition–precipitation.5 Typical steps in colloidal synthesis to control the particle properties include changing the type of stabilising and reducing agents, the concentrations of each component, and the metal concentration.6–8 In recent work (2015–present), we have demonstrated that PVA-stabilised Au and Pd NPs with tailored properties, including the stabilisation of ultra-small metal clusters (<5 atoms for Au, <20 atoms for Pd), can be prepared using an optimised sol-immobilisation method with temperature and solvent control.5,9 For Au NPs, tested for the oxidation of glycerol, it was evident that excellent activity was correlated to the population of small Au clusters (<10 atoms), with their existence heavily dependent on the temperature and solvent choice, with systems prepared at 1 °C in H2O having the highest population. For Pd NPs, the importance of solvent during NP synthesis on the resulting metal properties was readily apparent when tested for the hydrogenation of the α,β-unsaturated aldehyde, furfural, where the selectivity to specific products (hydrogenation at C![[double bond, length as m-dash]](https://www.rsc.org/images/entities/char_e001.gif) O or CC) differed depending on the available Pd sites generated during synthesis.5,10
O or CC) differed depending on the available Pd sites generated during synthesis.5,10
Pd NPs have demonstrated pronounced catalytic performance in a range of reactions, most notably in organic C–C coupling reactions,11,12 selective oxidation of alcohols,13,14 and hydrogenations.15 In particular for hydrogenation reactions, Pd NPs excel due to their ability to dissociate hydrogen with a minimal activation energy.16 The importance of the direct hydrogenation of p-nitrophenol to produce p-aminophenol is often overlooked and presented as a ‘model’ reaction to demonstrate catalytic ability and stability. However, p-nitrophenol, arising in industrial waste water from dyes, pesticides and explosives is a concern both to human health and the environment due to its high toxicity.17,18 Exposure may cause damage to blood cells and the central nervous system and so its transformation to a more benign compound is needed.19 Current methods of removal include adsorption,20 photo-degradation21,22 and electrochemical treatment.23 However, all of these processes suffer from high costs or long treatment times, making them unfeasible. An alternative is the direct catalytic hydrogenation to produce aminophenol over a stable heterogeneous catalyst.
As well as reducing environmental waste, the conversion of p-nitrophenol to the chemically benign aminophenol presents many important uses in the chemical industry. p-Aminophenol is used in the manufacture of several analgesic and antipyretic drugs as well as dyeing agents,24–26 with the conventional process for the production of aminophenol through the iron-acid reduction of nitrophenol resulting in large formations of Fe–FeO sludge (1.2 kg per kg of product) causing major disposal problems.27,28 Alternatively, p-aminophenol can be generated through the hydrogenation of nitrobenzene using noble metals and strong sulphuric acid,27 although this process inevitably generates side products such as aniline and smaller amounts of other impurities.29
Previous studies of this reaction have focused around Ni28,30,31 and precious metal based catalysts,32–35 with the former unfavourable as a result of lower catalytic activity and metal leaching. Pd NPs have demonstrated the highest activity, with studies focused both on Pd nanoparticles supported in solution by polymers,35 or supported on solid matrices such as carbon,36–39 metal oxides40 and metal–organic framework (MOF) structures.41 The support material is typically designed to have a high surface area to promote a high dispersion of Pd, which is ultimately the active species. In the present study, the catalytic performance (activity and stability) of size controlled Pd NPs, prepared by an optimised sol-immobilisation method with temperature control and subsequently immobilised on to TiO2, is investigated for the hydrogenation of nitrophenols to aminophenols.
Experimental
Materials
K2PdCl4 (99.99% purity) was supplied by Johnson Matthey. o-, m- and p-Nitrophenol (>99% purity), NaBH4 (>96% purity), and PVA (Mw = 9000–10![[thin space (1/6-em)]](https://www.rsc.org/images/entities/char_2009.gif) 000 g mol−1, 80% hydrolysed) were supplied by Sigma-Aldrich. TiO2 (P25, 50 m2 g−1) was supplied by Degussa/Evonik. Deionised water (18.2 Ω cm−2 Milli-Q purified) was used in all of the experiments.
000 g mol−1, 80% hydrolysed) were supplied by Sigma-Aldrich. TiO2 (P25, 50 m2 g−1) was supplied by Degussa/Evonik. Deionised water (18.2 Ω cm−2 Milli-Q purified) was used in all of the experiments.
Catalyst preparation
Supported Pd NPs were prepared using a modified colloidal method with temperature control to tune the particle size. K2PdCl4 precursor was used to prepare aqueous solutions of the desired palladium concentration ([Pd] = 1.26 × 10⁻⁴ M), to which fresh aqueous solutions of PVA (PVA/Pd wt ratio = 0.65) were added. 0.1 M aqueous solutions of NaBH4 (NaBH4/Pd molar ratio = 5) were freshly prepared and added drop-wise to each solution over a one minute period with stirring to form dark brown/black sols. After the complete reduction of Pd species (15–30 minutes), the colloidal solutions were individually immobilised on TiO2 under vigorous stirring conditions (900 rpm). The amount of support material required was calculated to achieve final metal loadings of 0.2 wt%. The mixtures were acidified to pH 1–2 by sulphuric acid before they were stirred for 60 minutes to accomplish full immobilisation of the metal NPs on to the support. Each slurry was filtered, washed thoroughly with distilled water, and dried overnight at room temperature. 0.2 wt% Pd/TiO2 catalysts were prepared at four different temperatures, with the preparation conditions and respective sample notation detailed in Table 1.| Temperature/°C | Theoretical wt% Pd loading | Sample notation |
|---|---|---|
| 1 | 0 | PdA1 colloid |
| 1 | 0.2 | 0.2 PdA1 |
| 30 | 0.2 | 0.2 PdA2 |
| 50 | 0.2 | 0.2 PdA3 |
| 75 | 0.2 | 0.2 PdA4 |
UV-visible spectroscopy
Formation of colloidal Pd (metal reduction) was analysed by UV-vis spectroscopy. UV-vis spectra (200–800 nm, Shimadzu UV-1800 spectrometer) of the Pd precursor and corresponding sols were recorded in a quartz cuvette after 15 and 30 minutes of generation.Transmission electron microscopy (TEM)
Samples for examination by TEM were prepared by first dispersing the catalyst powder in ethanol using ultra-sonication for 30 minutes. 40 μL of the suspension was dropped on to a holey carbon film supported by a 300 mesh copper TEM grid before the solvent was evaporated. The samples for TEM were then examined using a JEOL JEM 2100 TEM model operating at 200 kV.Infra-red (IR) CO chemisorption studies
Fourier transform (FT) transmission IR spectra were obtained with an iS10 Nicolet spectrometer at a spectral resolution of 2 cm−1 and accumulating up to 64 scans. For each experiment, the ∼25 mg catalyst was pressed to form a self-supported wafer (area = 1.3 cm2). The cell was purged with helium for 30 minutes to obtain a background spectrum before CO was introduced using a 10% CO/He mixture at a flow rate of 70 cm3 min−1 over a 30 second period. Three CO doses of this nature were administered for each experiment. The gas was switched to helium for 30 minutes, at a flow rate of 70 cm3 min−1, in order to remove gaseous and physisorbed CO from the catalyst surface before a spectrum was then obtained. Subtraction of the background resulted in a spectrum containing bands responsible for CO adsorption on Pd sites.X-ray absorption spectroscopy (XAS)
XAS studies were performed to examine the Pd oxidation state (X-ray Absorption Near Edge Spectroscopy (XANES)) as well as the local Pd coordination environments (Extended X-ray Absorption Fine Structure (EXAFS)) for the 0.2 wt% Pd catalysts. Pd K-edge XAFS studies were carried out on the B18 beamline at the Diamond Light Source, Didcot, U.K. Measurements were performed in fluorescence mode using a QEXAFS set-up with a fast-scanning Si(311) double crystal monochromator and a 36 element Ge detector. The undiluted samples were pressed to form pellets (100 mg, area = 1.3 cm2) for analysis. The time resolution of the spectra was 2 min per spectrum (kmax = 14). On average, 15 scans were acquired to improve the signal-to-noise level of the data. XAFS data processing was performed using IFEFFIT with the Horae package (Athena).42,43Catalytic hydrogenation of o-, m- and p-nitrophenol
The four 0.2 wt% Pd/TiO2 catalysts prepared at different temperatures, as well as colloidal Pd prepared at 1 °C, was tested for the hydrogenation reactions. In a typical experiment, the required amount of solid catalyst (or colloidal Pd) was measured in to a polystyrene cuvette and fresh NaBH4 (0.3 mL) was added. After 10 seconds, nitrophenol solution (2.7 mL, [p-nitrophenol] = 0.18 mM, [o-nitrophenol] = 0.5 mM and [m-nitrophenol] = 1.2 mM) was added, initiating the reaction. UV-vis spectra (600–300 nm, Shimadzu UV-1800 spectrometer) were then collected at room temperature with 12–16 second time intervals. For catalyst recycling studies, the catalysts were collected after reaction, washed thoroughly with water and dried at room temperature. The specific conditions for each experiment are as follows: p-nitrophenol/Pd molar ratio = 13, o-nitrophenol/Pd molar ratio = 14, m-nitrophenol/Pd molar ratio = 36 and in all cases a NaBH4/nitrophenol molar ratio of 24 was used. Turnover frequencies (TOFs), expressed as the moles of nitrophenol converted per mole of Pd metal, per hour, were calculated after 30 seconds of nitrophenol hydrogenation.Results and discussion
The formation of colloidal Pd was observed using UV-vis spectroscopy by assessing the reduction of electronic transitions associated with the metal precursor salt, K2PdCl4. Disappearance of the peaks at λ = 210 and 238 nm, indicative of ligand to metal charge transfer in [PdCl4]2− at 15 minutes indicated that full reduction of the metal precursor was complete for colloidal Pd prepared at 50 and 75 °C (Fig. S1†),13 and thus subsequent immobilisation of Pd on to the TiO2 support was performed to reduce agglomeration in the colloid. Reduction of the Pd precursor at 1 and 30 °C was slower, and therefore in these cases, the colloidal Pd was immobilised after 30 minutes after addition of reagents. TEM measurements were performed to assess the Pd particle size distribution for the supported catalysts, however the 0.2 wt% metal loading resulted in average Pd diameters calculated over only 100 particles due to the highly disperse nature of the particles and the low metal loading. A small decrease in mean Pd diameter was observed with decreasing temperature of colloidal reduction, with colloidal Pd prepared at 1 and 75 °C affording average particle sizes of 2.2 and 2.6 nm (Fig. S2 and S3†), respectively, with the trend consistent with previous work we have performed.9Fig. 1 shows the effect of Pd metal loading on the resulting average particle diameter obtained by TEM; for all temperature preparations, the 1 wt% Pd catalyst yields the larger particle size. The metal nanoparticle properties are said to be ‘preformed’ during colloidal synthesis, and thus the variation in particle size observed upon immobilisation indicates Pd growth occurs at the TiO2 surface. Although not observed for this series of catalysts (0.2 wt% Pd), it is highly probable that a high population of Pd clusters exist (<20 atoms) in the catalyst prepared at 1 °C, in line with the previous work.9
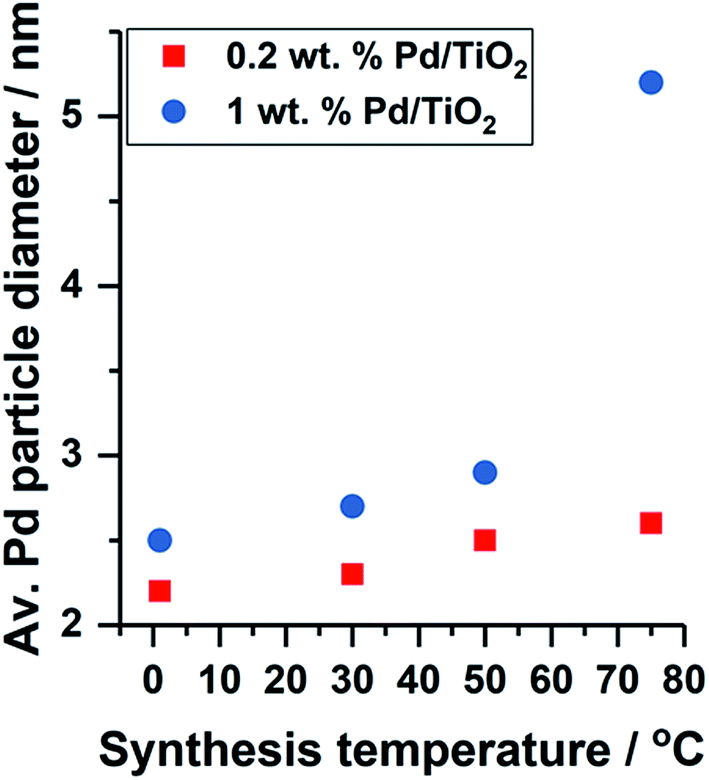 | ||
| Fig. 1 Effect of Pd metal loading and colloidal synthesis temperature on the average Pd particle diameter obtained by TEM. | ||
XANES is a valuable tool in probing the speciation of metal nanoparticles, in this instance for determining the Pd oxidation state in the Pd/TiO2 catalysts. The ratio between Pd2+ and Pd0 was performed by linear combination analysis (LCA) of the 1st derivative of the XANES profile, using PdO and Pd foil as reference standards (Table 2 and Fig. S4†). It is evident that reducing the temperature at which the colloidal Pd is prepared results in a gradual increase in Pd2+. For NP systems, the contribution to the XAFS signal is not only dominated by the core (bulk), as with most systems, but also by surface speciation. Small Pd NPs form an oxidic surface layer (Pd2+–O) at room temperature when exposed to the atmosphere,44 with the surface, and therefore contribution from Pd2+ to the XAFS signal, being more dominant as the Pd particles become smaller.
| Sample | Av. Pd particle size by TEM/nm | Reference standards/% | ||
|---|---|---|---|---|
| Pd2+ | Pd0 | R factor | ||
| 0.2 PdA1 | 2.2 ± 0.6 | 43 | 57 | 0.046 |
| 0.2 PdA2 | 2.3 ± 0.8 | 34 | 66 | 0.042 |
| 0.2 PdA3 | 2.5 ± 1.0 | 32 | 68 | 0.046 |
| 0.2 PdA4 | 2.6 ± 0.7 | 32 | 68 | 0.044 |
The ratio of Pd2+/Pd0 from LCA analysis can therefore be used indicatively to observe the Pd particle size trend, which we find is in good correlation with that obtained from TEM. EXAFS was used to confirm the existence of an oxidic layer on the palladium nanoparticles rather than large PdO crystallites. In the k2-weighted FT of 0.2 PdA1 (preparation at 1 °C, Fig. 2A) the Pd–O–Pd scattering path that would otherwise be present at 3 Å, and can be observed in the PdO reference, is not observed for 0.2 PdA1. The magnitude at ∼2.79 Å in the k2-weighted FT of the 0.2 wt% Pd catalysts (Fig. 2B), corresponding to the Pd–Pd scattering path, can be used to conclude the trend in average Pd particle size.
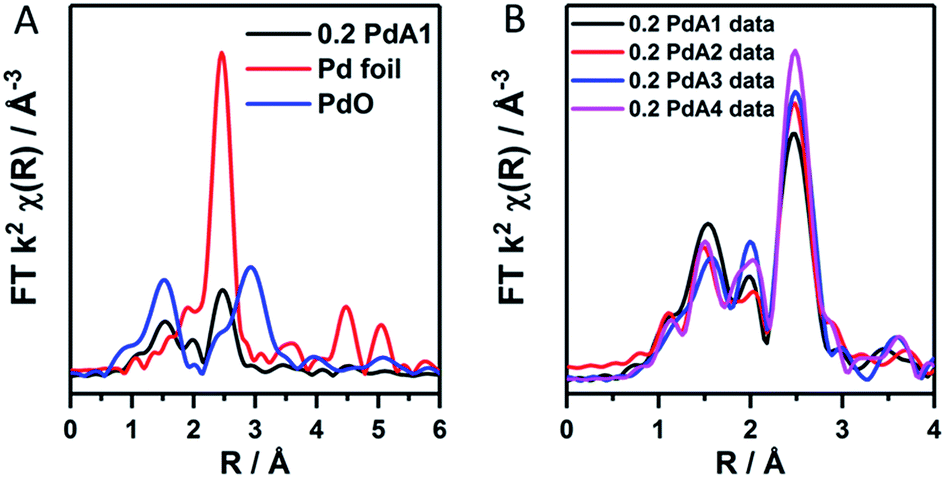 | ||
| Fig. 2 k 2 weighted forward FT data for (A) the 0.2 PdA1 catalyst (1 °C H2O), Pd foil and PdO reference, and (B) all 0.2 wt% Pd/TiO2 catalysts. | ||
Chemisorption of CO on the metal nanoparticles, monitored by IR spectroscopy, was employed to assess the available Pd surface sites for the 0.2 wt% Pd/TiO2 catalysts (Fig. 3 and S5†). The two bands at ∼2134 and ∼2145 cm−1, labelled (i) in Fig. 3, are assigned to CO adsorbed on Pd+ and Pd2+, respectively.45 The shape and sharpness of these bands are much the same in catalysts prepared at 30 to 75 °C (0.2 PdA2, 0.2 PdA3 and 0.2 PdA4), but for the catalyst prepared at 1 °C (0.2 PdA1), in which the smallest average Pd diameter exists, the band is broader with adsorption up to 2152 cm−1. Infrared bands consistent with linearly adsorbed CO on Pd corner sites, labelled (ii) in Fig. 3, can be observed in all catalysts at 2080–2090 cm−1,46 although the band in 0.2 PdA1 appears the most asymmetric, with a shoulder at 2063 cm−1, indicating there is CO adsorption on Pd edge sites.47 Assigning the adsorption features below 2000 cm−1 to bridge-bonded CO, labelled (iii), is difficult as a result of the broad bands observed.46 For all spectra, the band starts around 1980 cm−1, which is attributed to CO adsorption on facets, but for 0.2 PdA1 and 0.2 PdA2, the bands are sharper, with the peak at 1945 cm−1, indicative of bridge bonded CO adsorption on edge sites.45,46 Moreover, we can comment on the effect of synthesis temperature on the ratio of available linear bonded:bridge bonded sites, with increased temperature increasing the ratio. To summarise, preparation of colloidal Pd at lower temperatures generates smaller Pd particles which contain a high proportion of lowly coordinated edge sites.
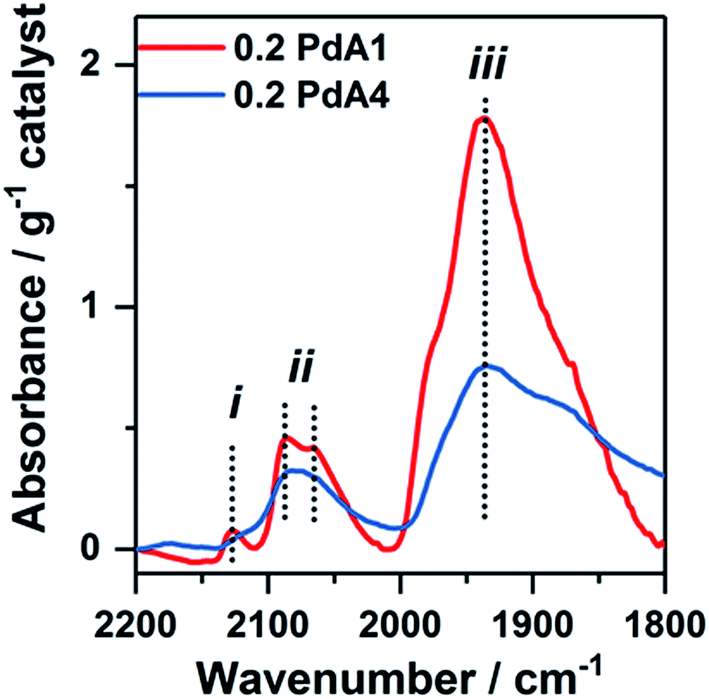 | ||
| Fig. 3 FTIR spectra from CO-adsorption studies onto different 0.2 wt% Pd/TiO2 catalysts: red = 0.2 PdA1 and blue = 0.2 PdA4. | ||
The catalytic performance of the 0.2 wt% Pd/TiO2 catalysts was investigated for the hydrogenation of o-, m-, and p-nitrophenol, using NaBH4 as the hydrogen source. As XANES analysis of the 0.2 wt% Pd/TiO2 catalysts provides evidence that a surface oxide layer exists on the small metal NPs, the Pd NPs were pre-treated with NaBH4 (NaBH4/Pd molar ratio = 312) to transform the Pd into the metallic state, so that the effect of Pd surface area (Pd particle size) on the activity could be correlated and minimise the induction period due to the presence of Pd2+. Pre-treating the catalysts in this manner is common, and also prevents an induction period as a result of NaBH4 reacting faster with the dissolved oxygen than with nitrophenol.48
The p-nitrophenol hydrogenation conversion profiles for the supported Pd catalysts, pre-treated first with NaBH4, as well as colloidal Pd prepared at 1 °C, are presented in Fig. 4A. For the TiO2 supported Pd catalysts it is clear that preparation of the colloid at 1 °C (0.2 PdA1) results in the most active catalyst, and is markedly better than the unsupported Pd colloid (PdA1 colloid). The catalysts containing the smallest and largest average Pd particle sizes, 0.2 PdA1 and 0.2 PdA4, were also tested for the hydrogenation of m- and o-nitrophenol, with the conversion profiles shown in Fig. S6.† The differing rates of conversion between each nitrophenol isomer (o-, m- and p-) follows a similar trend observed previously, and is dependent on the stability of each nitrophenolate ion.36,49 In the case of o- and p-nitrophenolate the negative charge on the phenoxide ion can be delocalized into the nitro group, stabilising the group. As well as a resonance effect, there is also an inductive effect (−I), which is stronger in o-nitrophenolate due to the shorter distance between the substituent group and the reacting group. The stronger −I makes the nitrogen atom more positively charged, and therefore more reactive. For m-nitrophenolate, there is no resonance stabilisation of the negative charge in to the nitro group, and only a small inductive effect. Therefore, the rate of hydrogenation for the nitrophenol isomers follows the order m- > o- > p-, which is experimentally observed in the present study. When an excess of NaBH4 is used, as here (NaBH4/nitrophenol molar ratio = 24), the reaction proceeds with pseudo first-order kinetics as previously reported,36 with the rate constant, k, determined via a first-order integrated rate law.
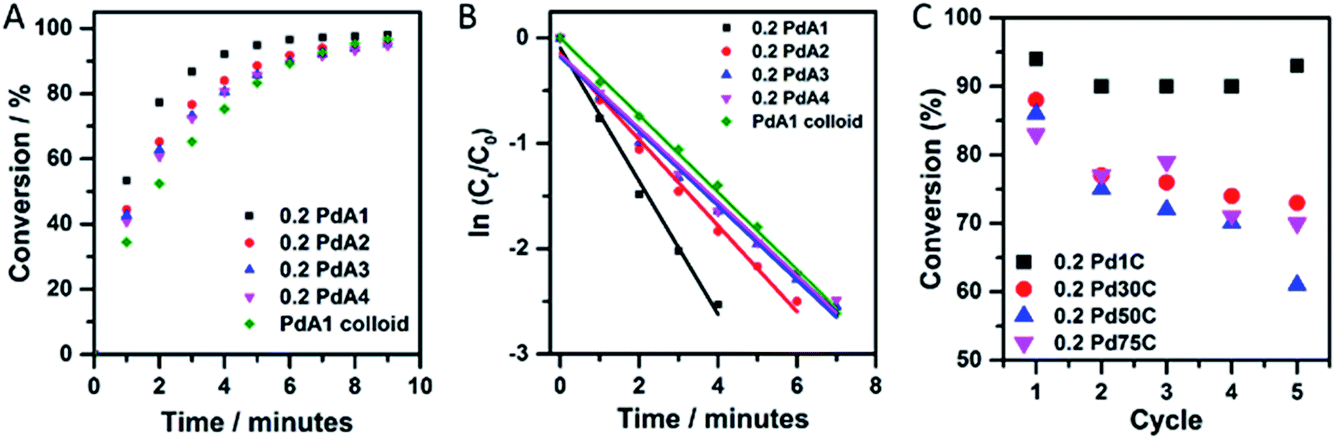 | ||
| Fig. 4 (A) Conversion profiles of Pd catalysts for the hydrogenation of p-nitrophenol, (B) ln(Ct/C0) versus time plots for Pd catalysts tested for p-nitrophenol and (C) catalyst recycling studies outlining the conversion achieved through five successive cycles of p-nitrophenol hydrogenation over each 0.2 wt% Pd/TiO2 catalyst, conversion calculated after 5 minutes. Reaction conditions: p-nitrophenol:Pd molar ratio = 13, NaBH4:p-nitrophenol molar ratio = 24. | ||
A plot of ln(Ct/C0) versus time (Fig. 4B and S6†) is therefore linear, with a gradient equal to −k. The use of high substrate/catalyst (metal) ratio whilst maintaining high conversion rates is economically favourable; however, the rate constant does not reflect the catalytic activity in terms of the metal content, unless comparable substrate/metal ratios are stated. Rate constants and TOFs are expressed in Table 3. (TOFs calculated based on Pd metal loadings in Table S1† calculated from Microwave Plasma-Atomic Emission Spectrometer (MP-AES)). There is a clear difference in TOF between the unsupported (PdA1 colloid = 260 h−1) and TiO2 supported catalyst (0.2 PdA1 = 560 h−1) for the hydrogenation of p-nitrophenol, with the latter a higher value than for current TiO2 and C supported Pd NP catalysts.25,36 The enhanced performance of the supported catalyst indicates the possible role(s) of TiO2 during the catalysis; the Pd–TiO2 interaction restricts growth and agglomeration, and there is increased dispersion of Pd nanoparticles across the TiO2. Although the pseudo first-order rate constants for the catalysts 0.2 PdA2, 0.2 PdA3 and 0.2 PdA4 exhibit a size dependent trend, the calculated TOFs do not, showing values of 370, 445 and 370 h−1, respectively. Unless the substrate/metal ratio is detailed, typically rate constants k (min−1) do not account for the amount of catalyst used during the reaction, whereas TOF is a more appropriate parameter for evaluating the catalytic activity of heterogeneous catalysts. Indeed, similar particle sizes for these catalysts, which, when coupled with the slightly differing metal loadings and therefore varied substrate/metal ratios during the reaction (0.14 to 0.18 wt% Pd/TiO2), makes it difficult to elucidate structure–property relationships for this small scale reaction. We have previously shown that the generation of colloidal Pd at low temperature (1 °C) results in a higher population of ultra-small Pd clusters (<20 atoms), more so than catalysts prepared at higher temperatures. Although the presence of these clusters has not been shown in this study, we consider that they are very probably still present, and may be responsible for the high activity of 0.2 PdA1 compared to the other catalysts, as supported by previous work.32 Additionally, the IR study concluded that the 0.2 PdA1 also has the highest ratio of lowly coordinated edge sites, which can provide active sites for the reaction to proceed.
| Catalyst | Average Pd particle size/nm (TEM) | x-Nitrophenol, k/min−1 (TOF/h−1) | ||
|---|---|---|---|---|
| p- | m- | o- | ||
| 0.2 PdA1 | 2.2 | 0.63 (560) | 1.57 (4680) | 1.91 (1365) |
| 0.2 PdA2 | 2.3 | 0.41 (370) | — | — |
| 0.2 PdA3 | 2.5 | 0.40 (445) | — | — |
| 0.2 PdA4 | 2.6 | 0.35 (370) | 1.00 (2355) | 1.05 (685) |
| PdA1 colloid | — | 0.37 (260) | — | — |
The recyclability of a catalyst is a very important attribute when considering its use in industry. Fig. 4C illustrates the catalyst reusability for the 0.2 wt% Pd/TiO2 catalysts, in which p-nitrophenol hydrogenation conversion was calculated after 5 minutes of reaction time, over five successive cycles. 0.2 PdA1 in particular showed excellent stability throughout, with the catalyst conversion maintained above 90%. Again, this catalyst is more stable than other TiO2 supported Pd nanoparticles, where deactivation of 42% was observed across 6 cycles.50 It is evident that between the 4th and 5th cycles, the conversion after 5 minutes increased (∼3%), however, this is within experimental error of the catalytic reaction protocol. It is difficult to elucidate the deactivation of the catalysts prepared between 30 and 75 °C, but we propose that the irreversible adsorption of product at the nanoparticle surface could be a contributing factor.
Summary and conclusions
This study demonstrates that the sol-immobilisation method can be used to prepare metal nanoparticles with characteristics enabling them to demonstrate high catalytic activity, in this instance, for the hydrogenation of nitrophenols (o-, m- and p-). Pd/TiO2 catalysts were prepared using a modified sol-immobilisation method, in which colloidal Pd was formed at different temperatures, and the resulting catalysts tested for their performance in the conversion of nitrophenol; a critical transformation in environmental remediation.We conclude that an important experimental parameter affecting the metal particle diameter during colloidal reduction is, as well as temperature, the duration of stirring specifically at higher temperatures (>30 °C). At low temperatures of preparation (≤30 °C), the colloid appears stable over long stirring periods; however above this temperature, the colloid is generated quickly (in 15 opposed to 30 minutes), and is prone to aggregation (resulting in larger metal nanoparticles).
For the hydrogenation of p-nitrophenol reaction, Pd particle size, support effect, as well as catalyst stability was investigated. We demonstrated the enhanced role of TiO2 by comparing the activities of the unsupported (TOF = 260 h−1) and supported Pd catalysts (TOF = 370–560 h−1). The 0.2 wt% Pd/TiO2 catalyst prepared at 1 °C in H2O undoubtedly showed the best catalytic performance, not only in terms of activity (k = 0.632 min−1, TOF = 560 h−1), but also recyclability, in which 90% conversion was achieved after 5 minutes, over 5 successive cycles. The high activity for this particular catalyst may be a result of a large number of ultrasmall Pd clusters, which results in a larger total Pd surface area. As a result of the high activity maintained throughout the reusability tests, we propose that these Pd clusters are stable, and are preserved during the reaction.
Conflicts of interest
There are no conflicts to declare.Acknowledgements
The UK Catalysis Hub Consortium is funded by the EPSRC (portfolio grants EP I019693, EP/K014706/1, EP/K014668/1, EP/K014854/1 and EP/K014714/1). The authors wish to acknowledge the Diamond Light Source for provision of beamtime (SP10306). Diamond Light Source is also thanked for the outstanding support of the staff on B18: Prof. Andrew Dent, Dr Giannantonio Cibin, Dr Stephen Parry, and Mr Phil Robbins. The RCaH is acknowledged for use of facilities and support of their staff. June Callison and Kristina Penman are thanked for performing the MP-AES measurements. UK Catalysis Hub is kindly thanked for resources and support provided via our membership of the UK Catalysis Hub Consortium. All data created during this research is openly available from the University of Cardiff Research Portal. Information about the data underpinning the results here, included how to access them, can be found in the Cardiff University data catalogue at http://doi.org/10.17035/d.2018.0049146792.Notes and references
- C. Burda, X. Chen, R. Narayanan and M. A. El-Sayed, Chem. Rev., 2005, 105(4), 1025–1102 CrossRef PubMed.
- Y. Sun and Y. Xia, Science, 2002, 298(5601), 2176–2179 CrossRef PubMed.
- B. R. Cuenya, Thin Solid Films, 2010, 518(12), 3127–3150 CrossRef.
- O. M. Wilson, M. R. Knecht, J. C. Garcia-Martinez and R. M. Crooks, J. Am. Chem. Soc., 2006, 128(14), 4510–4511 CrossRef PubMed.
- S. M. Rogers, C. R. A. Catlow, C. E. Chan-Thaw, D. Gianolio, E. K. Gibson, A. L. Gould, N. Jian, A. J. Logsdail, R. E. Palmer, L. Prati, N. Dimitratos, A. Villa and P. P. Wells, ACS Catal., 2015, 5(7), 4377–4384 CrossRef.
- N. Dimitratos, A. Villa, L. Prati, C. Hammond, C. E. Chan-Thaw, J. Cookson and P. T. Bishop, Appl. Catal., A, 2016, 514, 267–275 CrossRef.
- A. R. Tao, S. Habas and P. D. Yang, Small, 2008, 4(3), 310–325 CrossRef.
- M. P. Pileni, Nat. Mater., 2003, 2(3), 145–150 CrossRef PubMed.
- S. M. Rogers, C. R. A. Catlow, C. E. Chan-Thaw, A. Chutia, N. Jian, R. E. Palmer, M. Perdjon, A. Thetford, N. Dimitratos, A. Villa and P. P. Wells, ACS Catal., 2017, 7, 2266–2274 CrossRef.
- J. Pritchard, M. Piccinini, R. Tiruvalam, Q. He, N. Dimitratos, J. A. Lopez-Sanchez, D. J. Morgan, A. F. Carley, J. K. Edwards, C. J. Kiely and G. J. Hutchings, Catal. Sci. Technol., 2013, 3(2), 308–317 Search PubMed.
- R. Narayanan and M. A. El-Sayed, J. Am. Chem. Soc., 2003, 125(27), 8340–8347 CrossRef PubMed.
- Y. Li and M. A. El-Sayed, J. Phys. Chem. B, 2001, 105(37), 8938–8943 CrossRef.
- C. L. Bianchi, P. Canton, N. Dimitratos, F. Porta and L. Prati, Catal. Today, 2005, 102–103, 203–212 CrossRef.
- N. Dimitratos, A. Villa, D. Wang, F. Porta, D. Su and L. Prati, J. Catal., 2006, 244(1), 113–121 CrossRef.
- D. Teschner, E. Vass, M. Havecker, S. Zafeiratos, P. Schnorch, H. Sauer, A. Knop-Gericke, R. Schloegl, M. Chamam, A. Wootsch, A. S. Canning, J. J. Gamman, S. D. Jackson, J. McGregor and L. F. Gladden, J. Catal., 2006, 242(1), 26–37 CrossRef.
- H. Nakatsuji and M. Hada, J. Am. Chem. Soc., 1985, 107(26), 8264–8266 CrossRef.
- S. Hrapovic, E. Majid, Y. Liu, K. Male and J. H. T. Luong, Anal. Chem., 2006, 78(15), 5504–5512 CrossRef PubMed.
- M. Miranzadeh and M. Z. Kassaee, Chem. Eng. J., 2014, 257, 105–111 CrossRef.
- C. Wang, H. Y. Zhang, C. Feng, S. T. Gao, N. Z. Shang and Z. Wang, Catal. Commun., 2015, 72, 29–32 CrossRef.
- Z. B. Wu, X. Z. Yuan, H. Zhong, H. Wang, G. M. Zeng, X. H. Chen, H. Wang, L. Zhang and J. G. Shao, Sci. Rep., 2016, 6, 25638 CrossRef PubMed.
- M. L. Chen, J. S. Bae, H. S. Yoon, C. S. Lim and W. C. Oh, Bull. Korean Chem. Soc., 2011, 32(3), 815–820 CrossRef.
- P. Xiong, Y. S. Fu, L. J. Wang and X. Wang, Chem. Eng. J., 2012, 195–196, 149–157 CrossRef.
- P. Canizares, C. Saez, J. Lobato and M. A. Rodrigo, Ind. Eng. Chem. Res., 2004, 43(9), 1944–1951 CrossRef.
- M. Pinza, M. Brufani and C. Milanese, US Pat., 6043285, 2000.
- L. Chassot and H. J. Braun, US Pat., 6592631 B2, 2003.
- F. Faranda, US Pat., 5998110, 1999.
- C. V. Rode, M. J. Vaidya and R. V. Chaudhari, Org. Process Res. Dev., 1999, 3(6), 465–470 CrossRef.
- H. B. Lu, H. B. Yin, Y. M. Liu, T. S. Jiang and L. B. Yu, Catal. Commun., 2008, 10(3), 313–316 CrossRef.
- C. V. Rode, M. J. Vaidya, R. Jaganathan and R. V. Chaudhari, Chem. Eng. Sci., 2001, 56(4), 1299–1304 CrossRef.
- A. L. Wang, H. B. Yin, M. Ren, H. H. Lu, J. J. Xue and T. S. Jiang, New J. Chem., 2010, 34(4), 708–713 RSC.
- Y. Du, H. L. Chen, R. Z. Chen and N. P. Xu, Appl. Catal., A, 2004, 277(1–2), 259–264 CrossRef.
- J. A. Johnson, J. J. Makis, K. A. Marvin, S. E. Rodenbusch and K. J. Stevenson, J. Phys. Chem. C, 2013, 117(44), 22644–22651 Search PubMed.
- S. M. El-Sheikh, A. A. Ismail and J. F. Al-Sharab, New J. Chem., 2013, 37(8), 2399–2407 RSC.
- M. J. Vaidya, S. M. Kulkarni and R. V. Chaudhari, Org. Process Res. Dev., 2003, 7(2), 202–208 CrossRef.
- S. Harish, J. Mathiyarasu, K. Phani and V. Yegnaraman, Catal. Lett., 2009, 128(1–2), 197–202 CrossRef.
- J. W. Sun, Y. S. Fu, G. Y. He, X. Q. Sun and X. Wang, Catal. Sci. Technol., 2014, 4(6), 1742–1748 Search PubMed.
- Y. X. Fang and E. K. Wang, Nanoscale, 2013, 5(5), 1843–1848 RSC.
- H. Q. Li, L. N. Han, J. Cooper-White and I. Kim, Green Chem., 2012, 14(3), 586–591 RSC.
- C. X. Wang, F. Yang, W. Yang, L. Ren, Y. H. Zhang, X. L. Jia, L. Q. Zhang and Y. F. Li, RSC Adv., 2015, 5(35), 27526–27532 RSC.
- D. H. Zhang, L. Chen and G. L. Ge, Catal. Commun., 2015, 66, 95–99 CrossRef.
- H. Jiang, Q. Yan, Y. Du and R. Z. Chen, React. Kinet., Mech. Catal., 2016, 117(1), 307–317 CrossRef.
- M. Newville, J. Synchrotron Radiat., 2001, 8(2), 322–324 CrossRef PubMed.
- B. Ravel and M. Newville, J. Synchrotron Radiat., 2005, 12(4), 537–541 CrossRef PubMed.
- P. P. Wells, E. M. Crabb, C. R. King, R. Wiltshire, B. Billsborrow, D. Thompsett and A. E. Russell, Phys. Chem. Chem. Phys., 2009, 11(27), 5773–5781 RSC.
- K. I. Hadjiivanov and G. N. Vayssilov, Characterization of oxide surfaces and zeolites by carbon monoxide as an IR probe molecule, Adv. Catal., 2002, 47, 307–511 Search PubMed.
- H. Q. Zhu, Z. F. Qin, W. J. Shan, W. J. Shen and J. G. Wang, J. Catal., 2004, 225(2), 267–277 CrossRef.
- T. Lear, R. Marshall, J. A. Lopez-Sanchez, S. D. Jackson, T. M. Klapotke, M. Baumer, G. Rupprechter, H. J. Freund and D. Lennon, J. Chem. Phys., 2005, 123(17), 174706 CrossRef PubMed.
- S. Wunder, F. Polzer, Y. Lu, Y. Mei and M. Ballauff, J. Phys. Chem. C, 2010, 114(19), 8814–8820 Search PubMed.
- S. Jana, S. K. Ghosh, S. Nath, S. Pande, S. Praharaj, S. Panigrahi, S. Basu, T. Endo and T. Pal, Appl. Catal., A, 2006, 313(1), 41–48 CrossRef.
- Z. Y. Ma, L. X. Zhang, R. Z. Chen, W. H. Xing and N. P. Xu, Chem. Eng. J., 2008, 138(1–3), 517–522 CrossRef.
Footnote |
| † Electronic supplementary information (ESI) available. See DOI: 10.1039/c7fd00216e |
| This journal is © The Royal Society of Chemistry 2018 |