 Open Access Article
 This Open Access Article is licensed under a
 Creative Commons Attribution 3.0 Unported Licence
The deposition of metal nanoparticles on carbon surfaces: the role of specific functional groups
B.
Bowden
,
M.
Davies
,
P. R.
Davies
 *,
S.
Guan
,
D. J.
Morgan
,
V.
Roberts
and
D.
Wotton
*,
S.
Guan
,
D. J.
Morgan
,
V.
Roberts
and
D.
Wotton
Cardiff Catalysis Institute, School of Chemistry, Cardiff University, CF10 3AT, UK. E-mail: daviespr@cardiff.ac.uk
First published on 20th February 2018
Abstract
The enormous complexity of a typical heterogeneous catalyst makes understanding the development and properties of any active nanoparticles present extremely challenging. In the case of carbon based catalysts that difficulty is compounded by the variability of the carbon powders used. We have previously developed a strategy that addresses these problems by mimicking the catalyst preparation conditions very closely but using highly ordered pyrolytic graphite crystals (HOPG) as a model surface. This enables us to examine the effects of specific functional groups on nanoparticle formation. We report here an extension of our work characterising functional groups on the HOPG surface, using XPS and AFM to explore the deposition of gold from aqueous solution onto HOPG surfaces treated in a variety of ways to alter the surface functionality. The structure and oxidation state of the resulting nanoparticles depend critically on the nature of the functional groups present and offers some insight into the development of catalysts based on these materials. Hydroxyls are identified as key functional species, reducing gold ions to their metallic state whilst being oxidised themselves to carbonyls. Carbonyls meanwhile promote the nucleation of Au3+, creating a network of islands at the HOPG surface. The results have relevance not only to catalysts using activated carbons but also the new generation of materials based on graphene and carbon nanotubes.
Introduction
The design of nanoparticle systems for catalysis involves the control of an enormous number of factors which affect the formation of the nanoparticles, including the chemistry of the surface on which they are supported, the interface between nanoparticle and the support, and the nanoparticle–solution interface, and most likely all three. Carbon as a support for heterogeneous catalyst nanoparticles is particularly challenging in this respect because of the complex surfaces that it can exhibit and because of the ability to change the nature of the surface with different surface treatments. An insightful study by Derbyshire et al. highlighted this issue in 1986,1 and it was later reviewed by Radovic2 who emphasised its importance to catalysis. A recent study of ruthenium deposition on activated carbon is a good example of the complex behaviour that can take place. The surface functionality of the carbon was altered by acid treatment leading to additional oxygen species. Although the new surface oxygen groups appeared to promote the dispersion of a ruthenium precursor deposited from solution, the authors concluded that, subsequently, oxygen states weakened the ruthenium nanoparticle/support interaction.3 Xu et al.4 studied this issue for gold, using concentrated HNO3 solutions, (65 wt% at 90 °C for 6 h) followed by thermal treatment to influence the functional groups available at the surface. They concluded that phenol, ether, and carbonyl groups stabilise the gold catalyst and enhance activity but could not distinguish between the different groups or their mode of action.Whilst there continues to be intense interest in functional groups at activated carbon surfaces, which are largely sp3 in nature, other carbon allotropes have also attracted attention within the catalysis community. In particular, the unique thermal, mechanical and electronic properties of graphene, combined with its inherently high surface area, has resulted in a number of papers considering its potential as a catalyst support (ref. 5, 6 and references therein). The role of the functional groups in the nucleation and adsorption of the active particles on these substrates is readily acknowledged in these papers and a study by Marques et al.6 addressed the issue directly, looking at the nucleation of gold from aqueous solutions at graphene and graphene oxide powders. Marques showed that oxygen functionality was essential for the nucleation of gold nanoparticles with no nanoparticles being observed in TEM images of the fully reduced graphene oxide surfaces. FTIR was used to characterise the functional groups present but the paper can only speculate on the nature of the functional groups involved in each case.
Our approach to this issue has been to study the surface functional groups and the adsorption of active species in systems which can be more easily characterised than the complex surfaces present in carbon powder catalysts.7–9 Whilst highly ordered pyrolytic graphite (HOPG) surfaces exhibit only a very limited set of carbon sites compared to activated carbon they are directly relevant to graphene based materials. The ability to probe their chemistry with some degree of certainty, offers the possibility of an insight into the role of individual variables on the behaviour of the more complex systems.
In the present case, we aimed to explore how the functional groups present on graphite surfaces affect the deposition of gold from solution with an experimental procedure that mimics that used for the deposition of these active species on practical catalysts. The metals are deposited as salts from solution, allowed to dry and then characterised with X-ray photoelectron spectroscopy (XPS) to determine the oxidation state of the deposited metal and atomic force microscopy (AFM) to determine the topography of the deposited species.
We have previously discussed the modification of HOPG surface with HCl and HNO3 acids and characterised the resulting functional groups and surface topography.7–9 At room temperature both acids generated principally OH groups on the HOPG surface; there was negligible adsorption of chloride or nitrate groups. Over time, at room temperature (in air) but somewhat faster if heated, the OH(a) species oxidise further to form characteristic oxygen species we assigned to carbonyl and ether like groups. We presented some preliminary studies of gold deposition onto these surfaces. In the present paper, we study the question of whether different acids create different functional groups and, if so, how the different groups affect the deposition of gold on the carbon in terms of both the oxidation state of the metals and the topographical nature of the species deposited.
Experimental
HOPG samples (∼10 mm square, ZYH quality, supplied by Scanwel Ltd, UK) were cleaned before each experiment by peeling off the top few graphene monolayers using adhesive tape. A variety of treatments were employed to modify the surface chemistry of the carbons: acid treatment involved the placement of a 100 μl droplet of fresh diluted (see below) acid, allowing the system to stand for 30 minutes before drying under a pure helium or nitrogen stream. Generally, acids wet the surface very effectively and so larger droplets were not needed to provide complete coverage of the crystal surfaces. Gold deposition was achieved in a similar fashion: 100 μl droplet of a gold precursor solution (HAuCl4·xH2O, Sigma-Aldrich, 99.999%), was placed on the pre-treated sample and left for 1 minute. The sample was subsequently dried under a stream of helium or nitrogen for 2 minutes. Preliminary studies of gold deposition showed very high concentrations at the surface from gold solutions of 10−5 M or greater. To study the initial deposition therefore, gold solutions of ∼10−6 M proved necessary. The pH of the 1 × 10⁻⁵ mol dm−3 solution of gold was measured to be 5.26 whereas the 2 × 10⁻⁶ mol dm−3 was 5.63.Ultra-pure water (“UPW”, Millipore) was used for dilution of the acids and the gold solution before surface treatment and also for control experiments that replicated dosing and analysis conditions. We discovered that these experiments are extremely prone to contamination of the surface by silicon oxides. As a result, all solutions were prepared and stored in plastic containers and only for short periods of time. Nevertheless, silicon was a frequent contaminant seen in the XPS of the samples and resulting in a dominant SiOx peak in the O (1s) region of the spectrum. In these cases, the data was abandoned and the samples recleaned.
Where indicated, selected samples were heated to 573 K for 1 hour after surface treatment and allowed to cool to ambient temperature before analysis.
It is worth noting here, that the concentration of different oxygen components in the XP spectra of the treated HOPG surfaces was slightly variable from sample to sample (±20%) meaning that quantitative estimates between samples is difficult. However, binding energies of the components within the spectra were reproducible from sample to sample and general trends can be deduced.
X-ray photoelectron spectroscopy (XPS) was performed on a Thermo Fisher Scientific K-alpha+ spectrometer. Samples were analysed using a micro-focused monochromatic Al X-ray source (72 W) over an area of approximately 400 microns. Data was recorded at pass energies of 150 eV for survey scans and 40 eV for high resolution scan with 1 eV and 0.1 eV step sizes respectively. Charge neutralisation of the sample was achieved using a combination of both low energy electrons and argon ions.
The XPS data was analysed using CasaXPS v2.3.19 using sensitivity factors supplied by the manufacturer with all binding energies referenced to the C (1s) peak at 284.5 eV. Curve fits were made using a Gaussian–Lorentzian 30:70 mixed lineshape with spin orbit splitting components for the Au (4f), S (2p) and Cl (2p) spectra fixed at 3.7, 1.16 and 1.6 eV, and relative areas of 4![[thin space (1/6-em)]](https://www.rsc.org/images/entities/char_2009.gif) :3, 2:1 and 2:1 respectively. To investigate the extent of metal reduction under the X-ray beam, spectra of the Au (4f) region were routinely taken twice, firstly at the start of a set of XP spectra and then at the end. Typically, there was no increase in the proportion of Au0 present after 30–40 minutes under the X-ray beam.
:3, 2:1 and 2:1 respectively. To investigate the extent of metal reduction under the X-ray beam, spectra of the Au (4f) region were routinely taken twice, firstly at the start of a set of XP spectra and then at the end. Typically, there was no increase in the proportion of Au0 present after 30–40 minutes under the X-ray beam.
AFM images were acquired on a Bruker Veeco Multimode system in tapping mode using silicon nitride tips. Multiple images were recorded of several different sites on the surface and on several different samples. AFM images were analysed using WSxM software.10
Results and discussion
Gold deposition on HOPG pre-treated with HCl
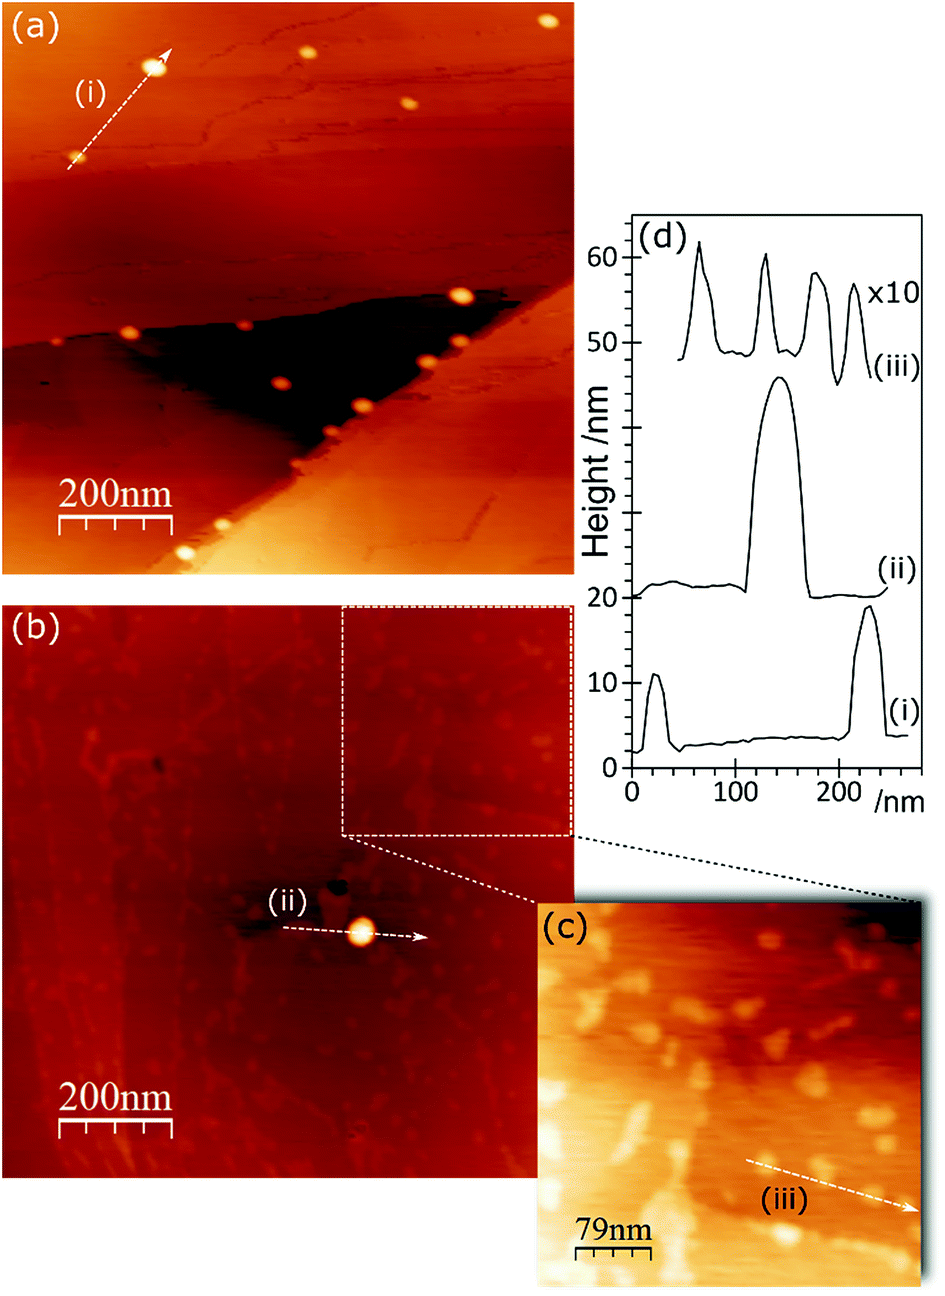
AFM imaging shows that treating HOPG surfaces with dilute HCl or HNO3 acids gives rise to prominent features typically 50–100 nm in diameter and in the region of 5–10 nm in height; some examples are shown in Fig. 1. We have shown previously8,9 that these features are associated with the formation of OH groups at existing defects and we have attributed them to a local delamination of the graphite. The effect is reduced or eliminated by heating to ∼473 K, by which temperature the OH at the surface is transformed into carbonyls and/or ethers.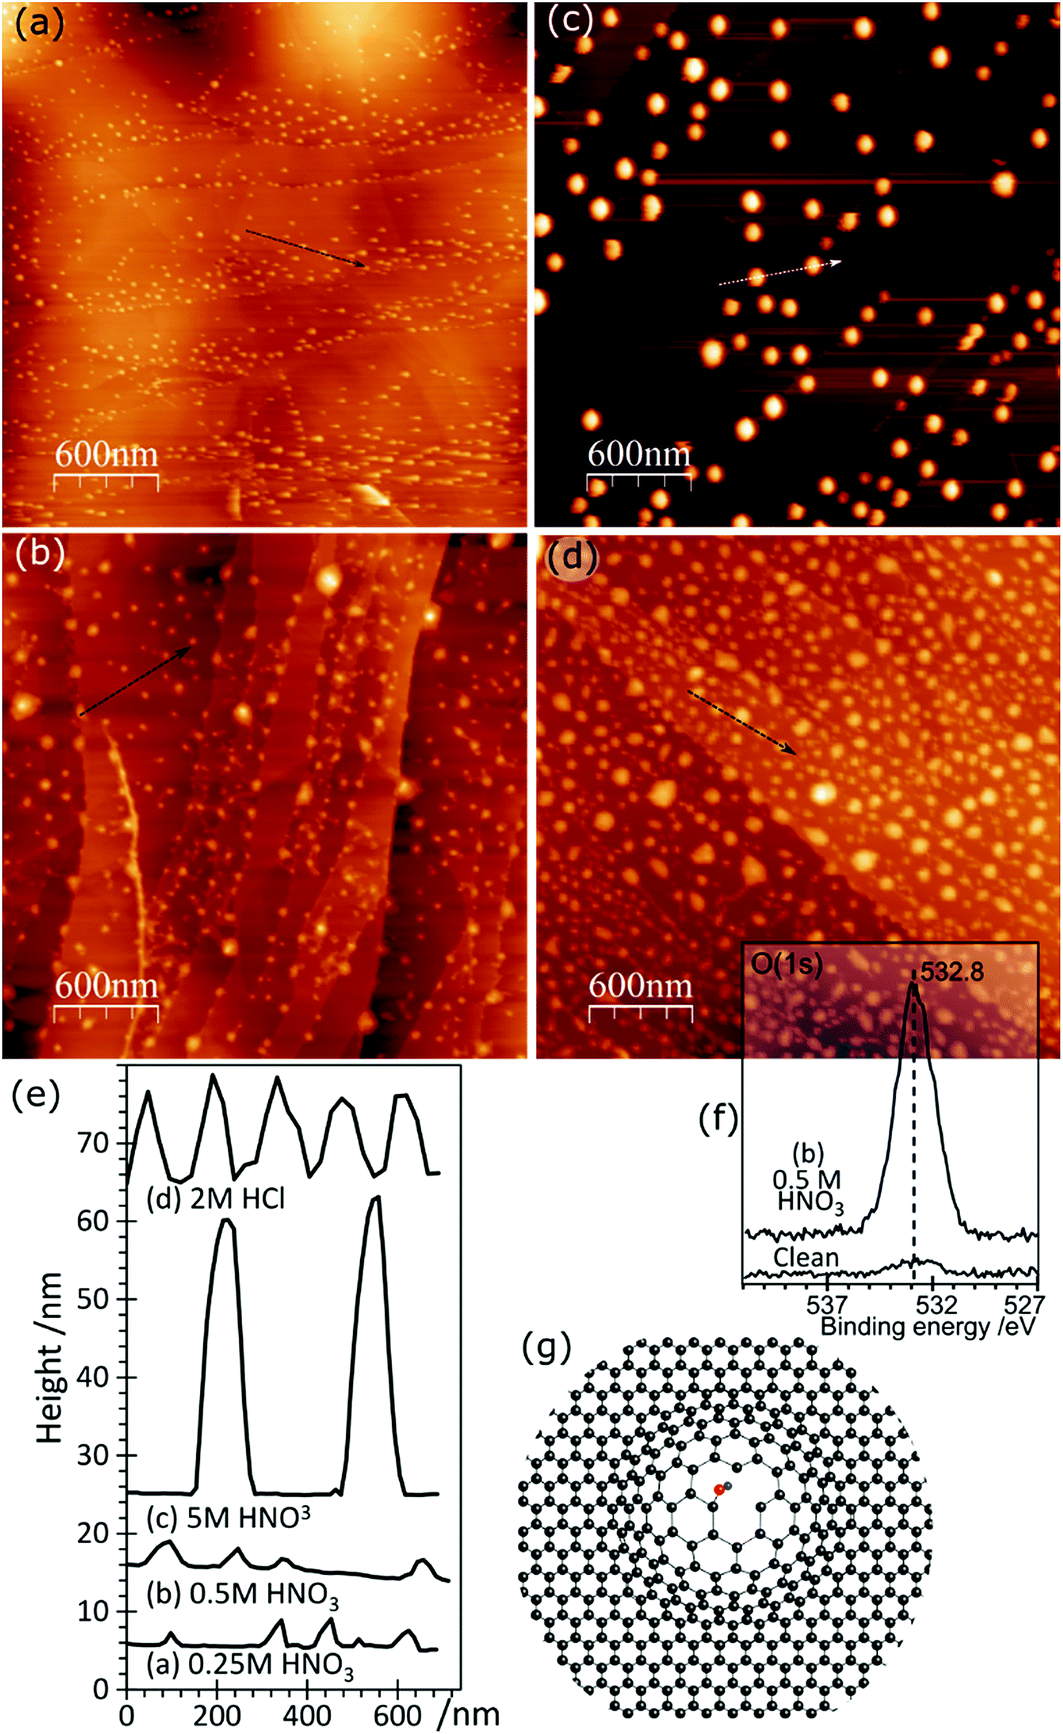 | ||
| Fig. 1 AFM images showing the effect of different acid treatments on HOPG surfaces: (a) 0.25 M HNO3; (b) 0.5 M HNO3; (c) 5.0 M HNO3; (d) 2.0 M HCl; (e) corresponding line profiles; (f) XP spectrum of (1s) region from image (b); (g) model previously proposed7 to account for AFM features in which functionalisation of existing defects in the lattice leads to a local delamination. | ||
Contact angle measurements, Fig. 2, show that HCl has very little effect on the overall surface properties of the graphite, with the contact angle unchanged at approximately 82.5 ± 3° for acid concentrations up to 5 M, but also after heating the acid treated surfaces to 473 K.
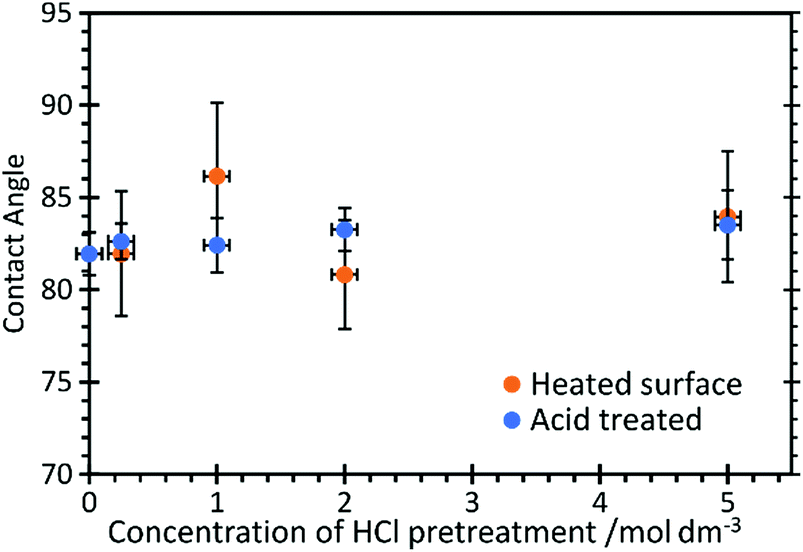 | ||
| Fig. 2 Contact angle measurements of water on HCl treated HOPG surfaces before and after heating to 473 K. | ||
Although it doesn’t change the wetting behaviour, acid treatment does have a marked effect on the deposition of gold from aqueous solutions. Very little gold deposition occurs on the untreated HOPG surface but, consistent with the observations of Marques et al. on graphene powders,6 the XP spectra in Fig. 3 show unequivocal evidence for gold adsorption on the acid treated surfaces. A single gold state is present, with a characteristic binding energy for the Au (4f7/2) peak of 84.0 eV indicating Au0. There is a simultaneous, and much greater, increase in the oxygen coverage on the surface. The new peak is centred at around 532.5 eV, but clearly consists of at least two components at ∼533.1 and 531.9 eV. No other adsorbates are apparent. In particular, no chlorine adsorption is observed at the surface until the pre-treatment acid concentration is increased to 5.0 M. The final set of spectra in this set, Fig. 3(e), are from the surface after acid treatment (5 M HCl) followed by heating to 473 K and cooling before gold adsorption. This procedure results in a very different Au (4f) spectrum; there is now significant intensity at the higher binding energy of 86.8 eV, indicating the presence of a Au3+ state in addition to the Au0; the two components are in an approximately 3:1 Au3+:Au0 ratio.
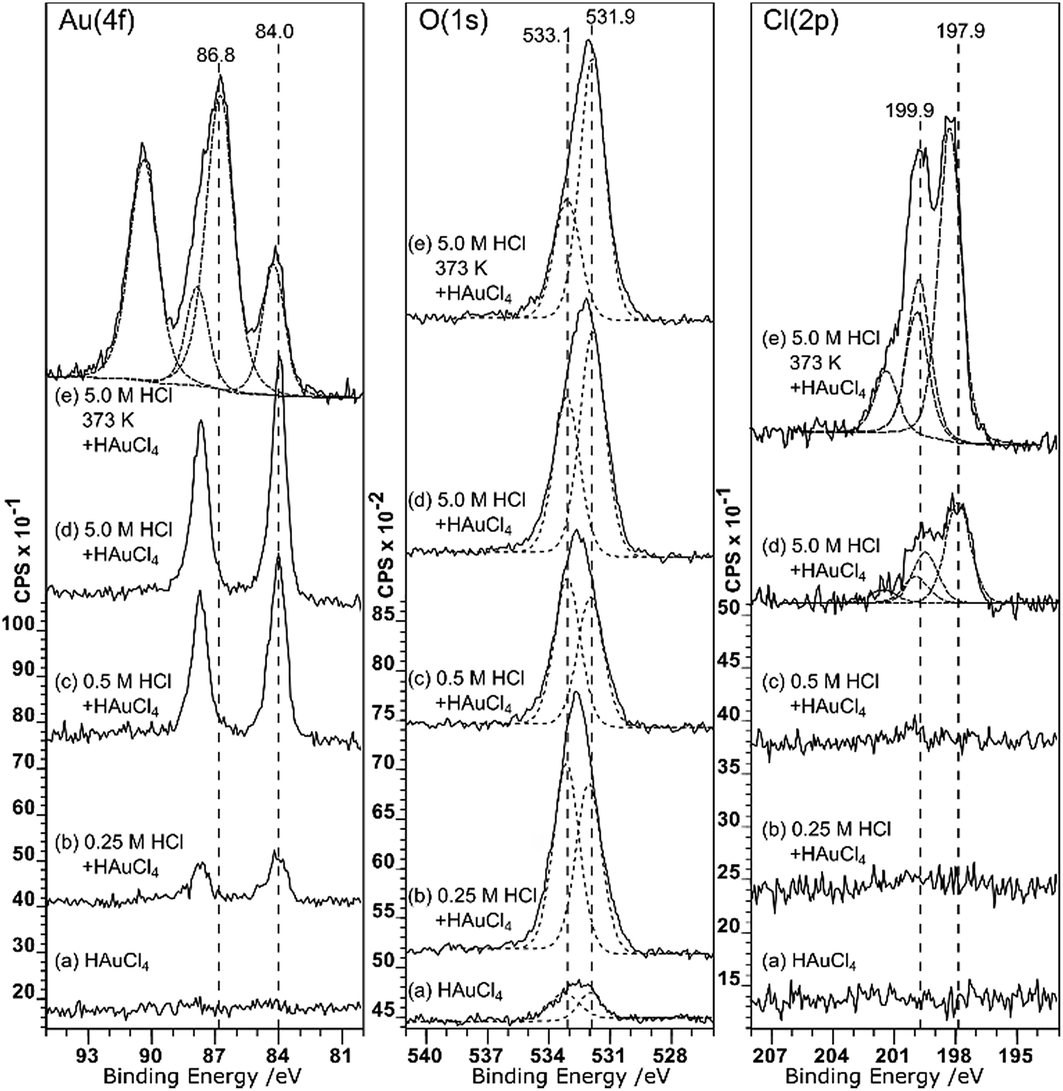 | ||
| Fig. 3 (a)–(d) XPS spectra of HOPG samples pre-treated with HCl at different concentrations and then, after drying, to a 2 × 10⁻⁶ M aqueous solution of HAuCl4. (e) Similar to (d) but heated to 373 K after treatment with HCl and then, after cooling to ∼285 K, treated with the 2 × 10⁻⁶ M HAuCl4 aqueous solution. Curve fitting of the spectra is discussed in the Experimental section. | ||
Associated with the gold deposition are two Cl states with 2p3/2 peaks at ∼198 eV and ∼200 eV and surface concentrations approximately 2.5 and 1 times the Au3+ state, respectively. At pH 5.6, the gold would be expected11,12 to exist in solution as a mixed chloride/hydroxide ion, dominated by AuCl3(OH)− and AuCl2(OH)·H2O species. The presence of chlorine at the surface is fully consistent with the deposition of the ionic gold as one of these mixed chloride/hydroxide species and very similar spectra were observed for gold catalysts deposited on activated carbon.13 We speculate that the two states are related to chlorine associated with the gold ion and with the carbon support but we cannot distinguish between them.
Covalently bonded chlorine on carbon surfaces is expected to give rise to Cl (2p) binding energies in the range of ∼200 eV (ref. 14) whereas metal chlorides are generally observed between 199 and 200 eV; Kishi and Ikeda, for example, reported15 bulk AuCl at 198.6 eV and a gold film exposed to Cl2 gas at 199.4 eV. This suggests that the Cl (2p) peak at the lower binding energy state is associated with the gold. However, the calculated stoichiometry argues for the opposite assignment.
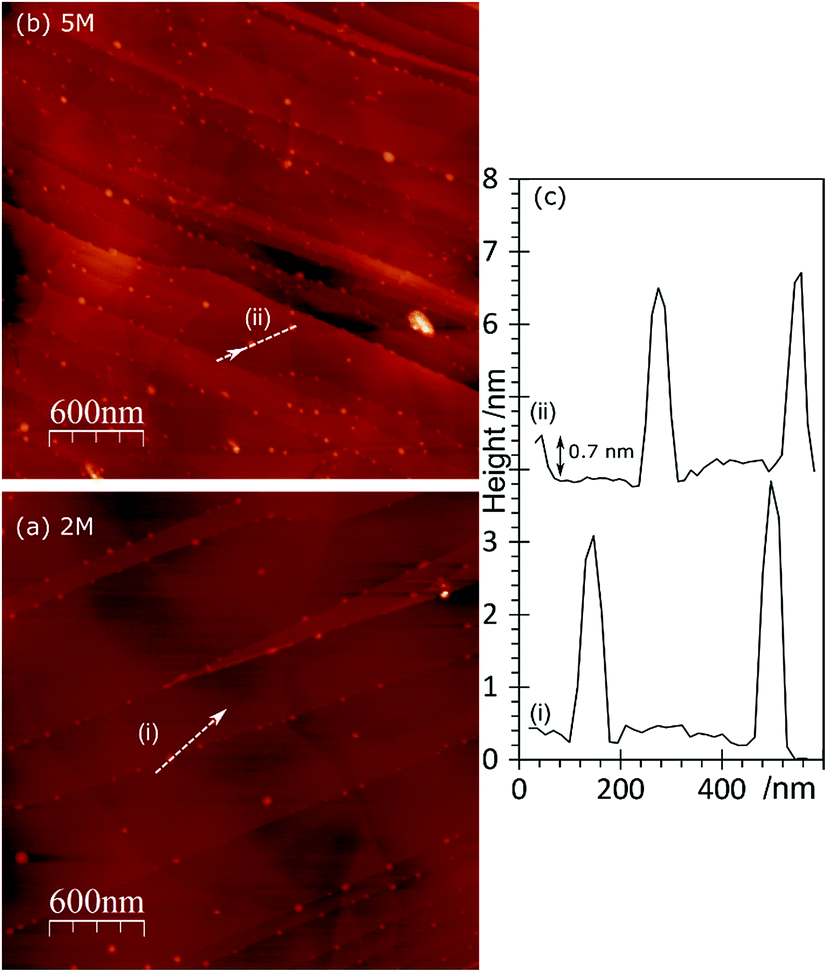
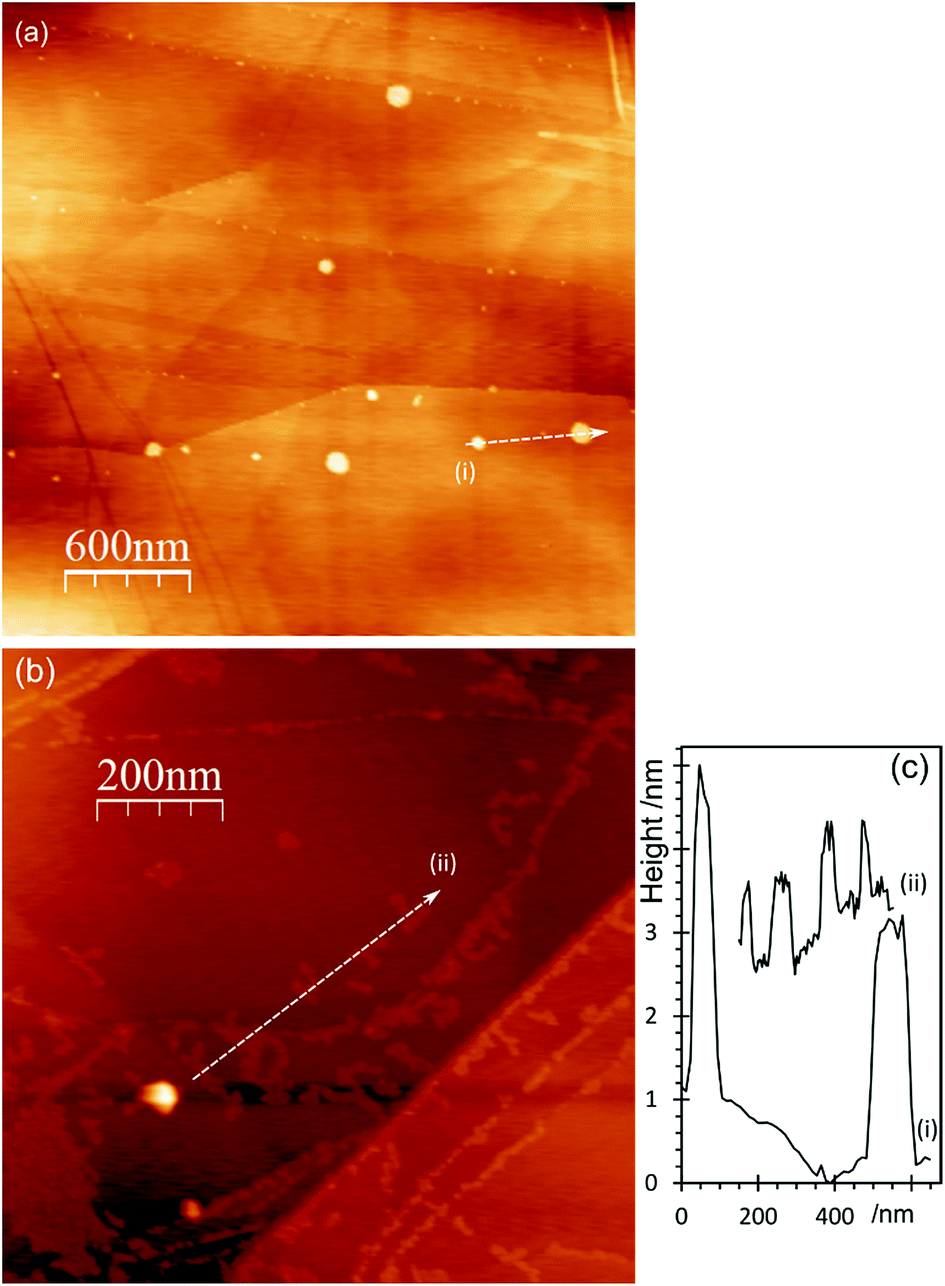
The topography of the HCl treated HOPG surface doesn’t change dramatically when the surface is exposed to a gold solution, Fig. 4. Higher concentrations of acid lead to higher gold concentrations but where the gold on the surface is predominantly Au0 the AFM images show mainly discrete features. At higher coverages, these are often arranged in chains across the surface, Fig. 4(c). On the other hand, where the XPS shows the gold is predominantly present as Au3+ the surface features are generally lower in height (∼1.5 nm) and form a network over the surface; an example is shown in Fig. 4(d).
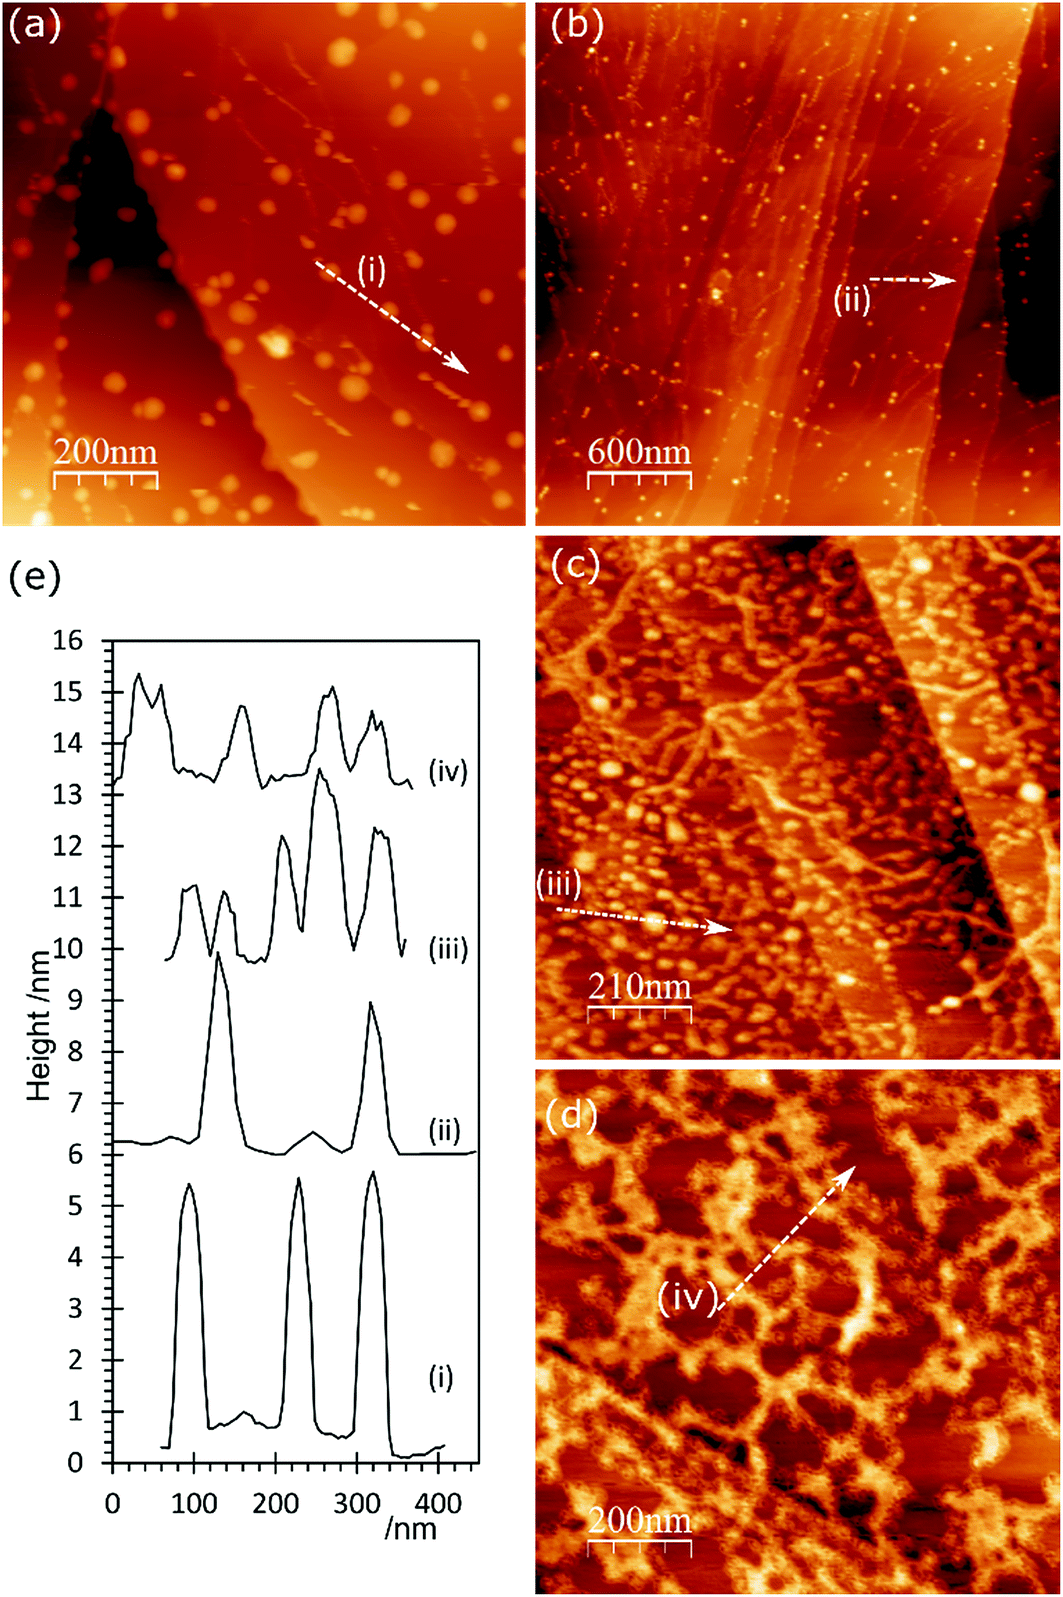 | ||
| Fig. 4 AFM images of HOPG surfaces treated with HCl and subsequently with a 2 × 10⁻⁶ M aqueous solution of HAuCl4. (a) After treatment with 1 M HCl; (b) 0.5 M HCl followed by 2 × 10⁻⁶ M HAuCl4; (c) 1.0 M HCl followed by 2 × 10⁻⁶ M HAuCl4; (d) 1.0 M HCl, heated to 373 K followed by 2 × 10⁻⁶ M HAuCl4; (e) line profiles from (a–d) as numbered on figures. | ||
Gold deposition on HOPG pre-treated with HNO3
Gold deposition on HOPG pretreated with nitric acid gives a surface that shows predominantly Au0 in the XP spectra, with some evidence for Au3+ at lower acid concentrations, Fig. 5. There is virtually no deposition on the untreated surface and no nitrogen or chlorine adsorption is observed. The Au (4f7/2) peak intensity lies mainly at 84.0 eV indicating Au0, although at lower acid concentrations the weak peak shows an intensity approximately 0.5 eV higher in binding energy. This could indicate the presence of Au+, but since the peak remains stable under the X-ray beam over ∼50 minutes a more probable assignment is to very small nanoparticles of gold which are known to exhibit increased binding energies in some circumstances.16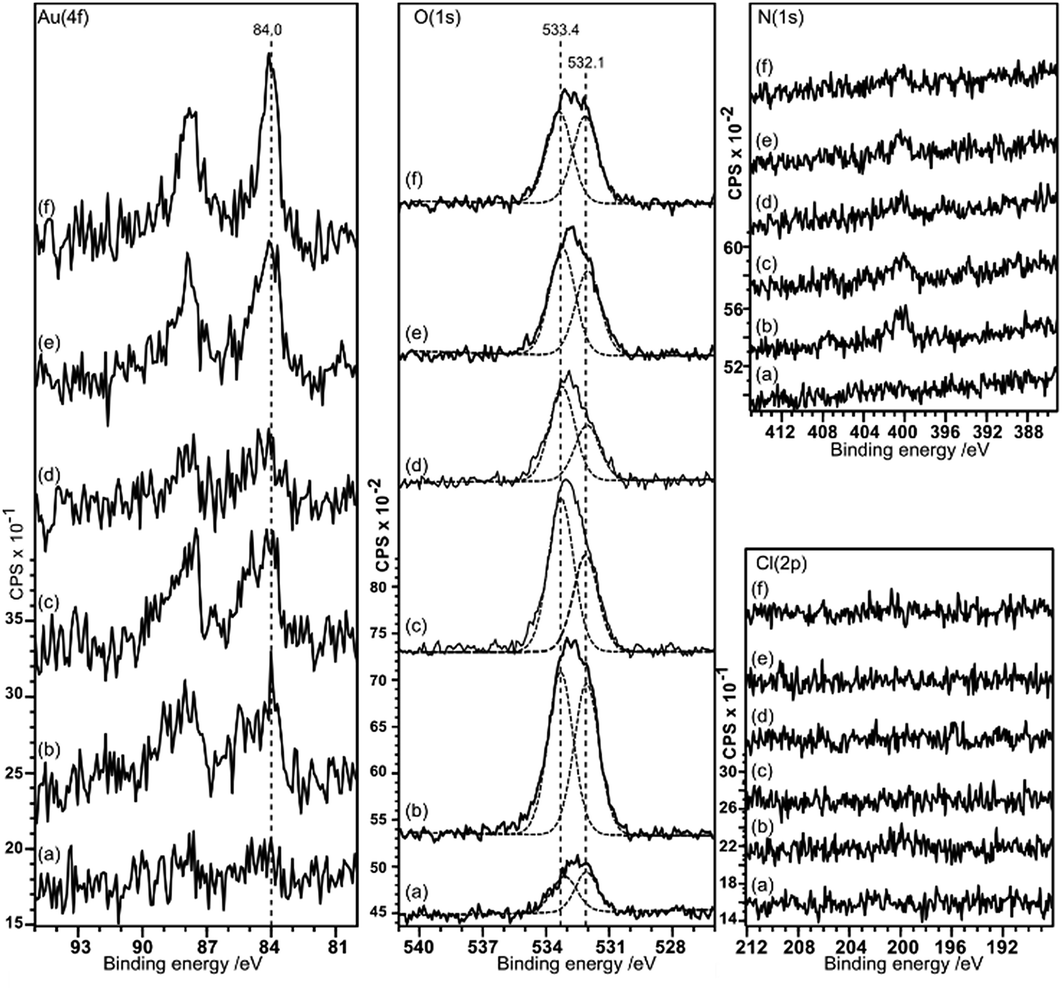 | ||
| Fig. 5 XPS spectra showing the deposition of gold from a 2 × 10⁻⁶ M aqueous solution of HAuCl4 on HOPG surfaces pre-treated with HNO3 at different concentrations: (a) clean surface treated with gold solution; (b) 0.25 M HNO3; (c) 0.5 M HNO3; (d) 1.0 M HNO3; (e) 2.0 M HNO3; (f) 5.0 M HNO3. Curve fitting of the spectra is discussed in the Experimental section. | ||
As in the case of gold deposition on the HCl treated surfaces, there is a significant increase in oxygen coverage after gold deposition. The peak in the O (1s) region consists of two components at ∼533.4 and 532 eV. Since the deposited gold appears to be metallic in character the two oxygen components must be associated with the HOPG. The binding energies of the two peaks are different from those recorded after acid treatment alone (532.7 eV) and attributed to OH(a) but similar to the two states observed after heating the acid treated surface (531.8 and 533.5 eV) previously attributed to ether and carbonyl type species.9 Over a large range of samples, the intensity ratio between the two components varies between ∼0.75 to 1.
In the AFM images of this experiment, Fig. 6, gold treatment following acid treatment leads to a surface with a number of raised features approximately 2–3 nm in height and ∼25 nm in diameter. These are markedly smaller than the features observed after acid treatment only, but closely resemble the features observed after heating the acid treated surface. They tend to be associated with step edges although there are examples apparently in the middle of terraces. Because of their similarity to the heated treated surfaces, we tentatively assign these raised features to weakened delamination features rather than gold nanoparticles.
 | ||
| Fig. 6 AFM images of HOPG surfaces treated with HNO3 and subsequently with a 2 × 10⁻⁶ M aqueous solution of HAuCl4. (a) After treatment with 2 M HNO3 followed by 2 × 10⁻⁶ M HAuCl4; (b) after treatment with 5 M HNO3 followed by 2 × 10⁻⁶ M HAuCl4; (c) line profiles from (a) and (b) as labelled on the figure. | ||
Gold deposition on HOPG pre-treated with “aqua regia” 1 HNO3![[thin space (1/6-em)]](https://www.rsc.org/images/entities/h3_char_2009.gif) :3 HCl
:3 HCl
Aqua regia is widely employed as a solvent for noble metals but has also been proven to be an effective pre-treatment for carbon based catalysts because of its powerful oxidising capabilities.17 We have investigated its effect on the HOPG surfaces and on the deposition of gold on these treated surfaces.
The greater oxidising power of aqua regia is evident in the O (1s) spectra of the treated HOPG. Whereas nitric acid and hydrochloric acid give rise primarily to hydroxyls at the surface, characterised by an O (1s) peak at ∼532.7 eV, aqua regia immediately generates two peaks at ∼532 and 533.5 eV associated with the carbonyl and ether groups, Fig. 7. This has a corresponding effect on gold deposition once the acid concentration increases beyond 0.25 M. In the Au (4f) spectra, significant intensity arises at 86.4 eV characteristic of Au3+. A prominent peak remains at ∼84 eV indicating the presence of Au0, but this may be due to reduction of the Au3+ under the X-ray beam (although the surface is stable during extended scans, an immediate reduction of some of the gold during the first spectrum cannot be ruled out).
 | ||
| Fig. 7 XPS spectra showing the effect of aqua regia (AQR, 3HCl:1HNO3) treatment on gold deposition from a 2 × 10⁻⁶ M aqueous solution of HAuCl4 on HOPG surfaces. (a) O (1s) spectrum showing the oxygen states generated on a clean surface by 5.0 M AQR treatment. Spectra (b)–(f) show gold deposition on the HOPG after treatment with AQR at increasing concentrations: (b) 0.25 M AQR; (c) 0.5 M AQR; (d) 1.0 M AQR; (e) 2.0 M AQR; (f) 5.0 M AQR. Curve fitting of the spectra is discussed in the Experimental section. | ||
The corresponding AFM images of the aqua regia treated surfaces, Fig. 8, show the typical raised features associated with a local delamination after acid treatment. It is noticeable however, that the features are not as high or as wide as those after separate HNO3 or HCl treatments. This is consistent with the XPS evidence that the aqua regia leads to more carbonyl type functional groups which we have observed previously are less effective at delamination.9 When gold is deposited on this surface, the major features remain largely unaffected, however new structures appear, with heights in the 1 nm range, forming chains and clusters of individual particles on the surface.
 | ||
| Fig. 8 AFM images of HOPG surfaces treated with aqua regia (AQR, 3HCl:1HNO3) and subsequently with a 2 × 10⁻⁶ M aqueous solution of HAuCl4. (a) After treatment with 0.25 M AQR (b) after treatment with 1 M AQR followed by 2 × 10⁻⁶ M HAuCl4; (c) line profiles from (a) and (b) as labelled on the figure. | ||
Gold deposition on HOPG pre-treated with sulfuric acid
Sulfuric acid is much more aggressive towards the HOPG than the other acids studied in this work; at concentrations of 0.5 M and above, the surface was too rough to be conveniently studied with AFM. The data in Fig. 9 and 10 therefore focus on surfaces treated with H2SO4 concentrations between 0.1 and 0.3 M. The XP spectra show an increase in oxygen content after exposure to H2SO4 solution, with peaks at 533.3 and 531.9 eV accompanied by a sulfur species with a concentration approximately 1/8th of the total oxygen. The S 2p binding energy of 168.5 eV is characteristic of a sulfate,18 the associated oxygen is presumably contained within the overall O (1s) spectrum. There is no chlorine adsorption and the Au (4f) spectrum shows unambiguously that gold is present in the metallic state. AFM data from the experiments show that after treatment with the gold solution, the surface retains a few of the large features attributed to locally delaminated areas but also now exhibits a series of reasonably discrete features with a height of ∼1 nm and diameters of ∼10–20 nm. The features are subtly different from the connected chains observed where the XPS shows that there is Au3+ present. We attribute these features to gold nanoparticles.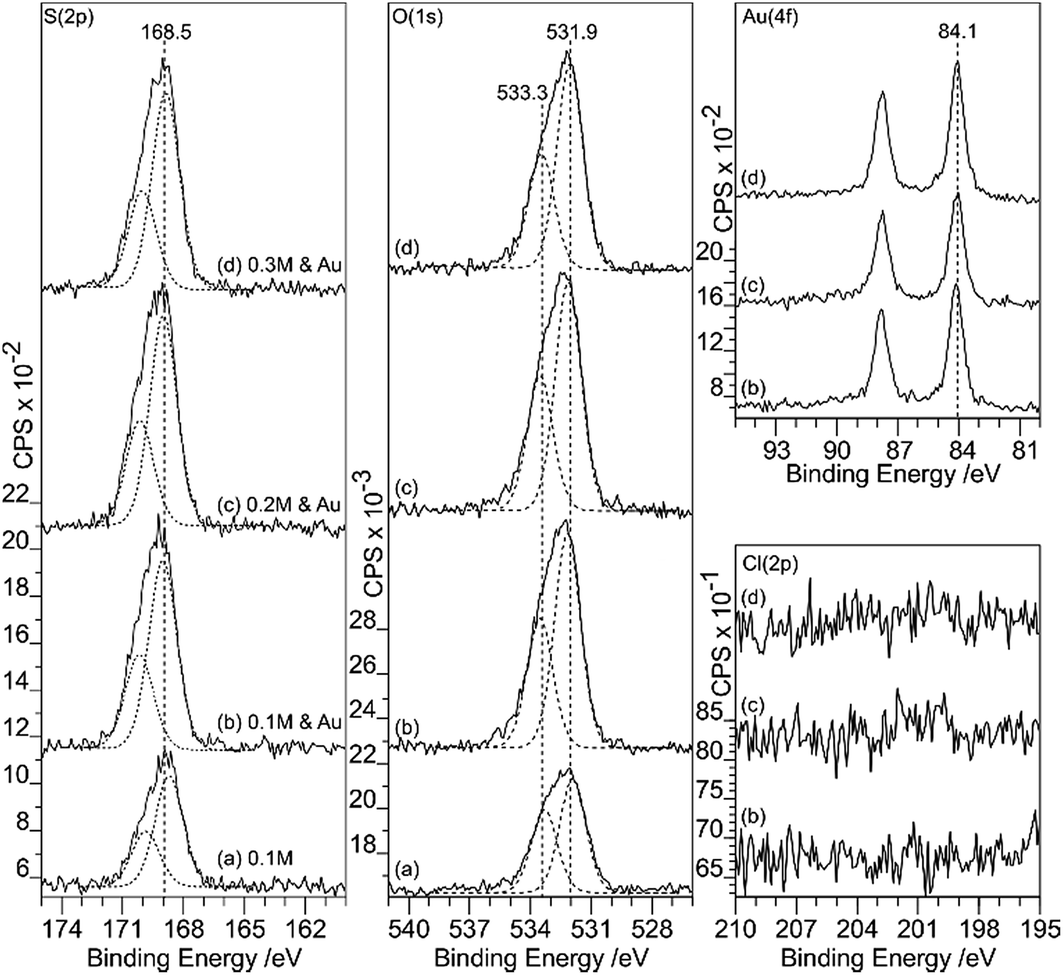 | ||
| Fig. 9 XPS spectra showing the effect of H2SO4 treatment of HOPG surfaces on gold deposition from a 2 × 10⁻⁶ M aqueous solution of HAuCl4. (a) After 0.1 M H2SO4; (b)–(f) show gold deposition on the HOPG after treatment with H2SO4 at increasing concentrations: (b) 0.1 M H2SO4; (c) 0.2 M H2SO4; (d) 0.3 M H2SO4. Curve fitting of the spectra is discussed in the Experimental section. | ||
 | ||
| Fig. 10 AFM images of HOPG surfaces treated with H2SO4 and subsequently with a 2 × 10⁻⁶ M aqueous solution of HAuCl4. (a) After treatment with 0.1 M H2SO4; (b) 0.1 M H2SO4 followed by 2 × 10⁻⁶ M HAuCl4; (c) expanded section of (b). (d) Line profiles from (a)–(c). | ||
Discussion
Treatment of the HOPG surface with weak acids results in discernible changes to its properties; whilst the contact angle measurements show no overall change to the wetting behaviour, there are effects on the XPS and AFM studies of the surface. Photoelectron spectroscopy of the surface shows there is a correlation between the extent of functionalisation and the extent of nucleation of gold at the surface, both in its oxidised form and in the metallic form. We also see a correlation between the nature of the functional groups produced at the surface and the nature of the gold that is deposited: OH groups generated by the weaker acids (HCl & HNO3) tend to result in the deposition of Au0 species whereas further oxidation, engendered either by a stronger acid such as aqua regia, or by heating in air after acid treatment results in a surface on which exposure to the aqueous gold solution leads predominantly to Au3+ deposition. We have also noticed that higher concentrations of gold at the surface tends to involve a greater extent of Au3+ deposition perhaps because the initial adsorption removes the active hydroxyls but the remaining, or resulting oxygen states continue to catalyse gold nucleation.At pH 5.6, the gold ion is expected to exist in solution primarily as a mixed hydroxy-chloride, but the chloride ion is only seen at the surface when Au3+ is also present. XP spectra show there is a significant increase in oxygen intensity on the adsorption of the gold, with two components at ∼532 eV and ∼533.5 eV when gold is deposited either as the Au3+ ion or as Au0. In the latter case, the oxygen is almost certainly associated with the HOPG rather than the gold, with the binding energies of the two states closely resembling those of the two states created after heating a hydroxide species. The tendency for higher OH(a) coverages to lead to Au0 deposition, whereas the carbonyl like oxygen states result in Au3+ adsorption, could be due to the reduction of the gold being associated with the further oxidation of the OH to carbonyls. However, in this type of experiment the quantification is not certain enough to provide more compelling evidence. Another possibility is that Au3+ is deposited in every case but is less stable against reduction by the X-rays in the presence of OH than the carbonyl. Previous calculations8 suggested that OH at the HOPG surface interacts more strongly with gold nanoparticles than the carbonyls do, but the stability of the Au3+ ion wasn’t considered.
In the AFM images, the identification of species at the surface is difficult. We have previously9 associated large features present after exposure to the gold chloride solution as gold related. However, the present data indicates that this would require much higher gold concentrations than are evident in the XPS. We propose, therefore, that these large features are the remnants of the local delamination phenomenon seen immediately after treating with acids. Instead, the gold deposits are showing up as much smaller features, islands approximately 1 nm or less in height and 10–20 nm in diameter. Where Au3+ is dominant in the XP spectra, the AFM shows a surface with a network of species on the surface.
The deposition of gold onto HOPG surfaces treated by the four acids studied here can be rationalised in terms of the model presented above. HCl and HNO3 both generate predominantly OH functional groups and these reduce the Au3+ to Au0, being oxidised themselves to C![[double bond, length as m-dash]](https://www.rsc.org/images/entities/char_e001.gif) O. In contrast, aqua regia oxidises the surface to a greater extent, leaving few hydroxyls to reduce the gold but generating carbonyl and ether type groups which appear to encourage the nucleation of Au3+ clusters on the surface. The exception to this picture appears to be sulfuric acid, since gold deposition on a sulfuric acid treated surface generates exclusively Au0 despite the O (1s) spectrum apparently exhibiting similar components to the surface treated by aqua regia – where Au3+ dominates.
O. In contrast, aqua regia oxidises the surface to a greater extent, leaving few hydroxyls to reduce the gold but generating carbonyl and ether type groups which appear to encourage the nucleation of Au3+ clusters on the surface. The exception to this picture appears to be sulfuric acid, since gold deposition on a sulfuric acid treated surface generates exclusively Au0 despite the O (1s) spectrum apparently exhibiting similar components to the surface treated by aqua regia – where Au3+ dominates.
This apparent inconsistency can be resolved if the curve fitting of the O (1s) spectrum before gold deposition is reconsidered. Fig. 11 shows how three peaks could also fit the overall envelope; in the fit, the FWHM of the components are restricted to 1.5 eV but the binding energies of all three peaks are allowed to vary. The fit now shows a strong component at 532.7 eV, a binding energy previously attributed to OH(a) at the HOPG surface.8,9 The lower binding energy component has a surface coverage approximately 3 times that of the sulfur and this ratio remains similar after gold deposition and as the acid strength is increased.
 | ||
| Fig. 11 A comparison of curve fits of the O (1s) spectra from Fig. 8. In (a) and (b), fits to the acid treated surface spectrum using two and three components respectively are compared. Whilst two components are sufficient to fit the overall envelope, three components, in which a peak at 532.7 eV can be assigned to OH(a), is also successful. The three peak fit is consistent with a model in which OH(a) reduces Au3+ to Au0 showing that both produce acceptable models. | ||
Conclusions
A consistent picture has emerged of gold deposition on acid treated HOPG surfaces. Different oxygen functional groups have been identified through their characteristic XP binding energies8,9 and their influence on gold deposition from aqueous solution determined: OH(a) reduces Au3+ to Au0 being oxidised itself in the process to form carbonyl and ether groups. Carbonyls and ethers promote the deposition of Au3+ networks at the surface without reduction. The results give some clues to the way that different acids and treatment conditions can result in different surface and hence catalytic chemistries: less oxidising conditions give rise to OH(a) and thus enhance Au0 deposition whereas more oxidising treatments lead to Au3+ directing groups. These observations help explain some aspects of the work published on carbon powders4 where there is general agreement that oxygen species help stabilise gold catalysts but the role of specific functional groups could not be unravelled. They may also help guide the design of new catalysts based on carbon and gold where specific oxidation states are thought to be required: the hydrochlorination of ethyne being one example.19The general approach used here would seem to provide a means by which deposition and nucleation effects can be studied in some detail for many different systems, but future progress would benefit considerably from a means to identify the topographic distribution of functional groups through the AFM images.
Conflicts of interest
There are no conflicts to declare.Acknowledgements
The research was supported by EPSRC Grant EP/I038748/1 and an NRN Advanced Engineering and Materials studentship for DW from project NRN101. SG was supported by the UK Catalysis Hub Consortium funded by EPSRC (grants EP/K014706/2, EP/K014668/1, EP/K014854/1, EP/K014714/1 and EP/M013219/1). B. B. was supported by a Cardiff University summer studentship under the CUROP scheme. The authors would also like to thank Swansea University for access to the equipment for contact angle measurements. XPS data collection was performed at the EPSRC National Facility for XPS (‘HarwellXPS’), operated by Cardiff University and UCL, under contract No. PR16195.References
- F. J. Derbyshire, V. H. J. de Beer, G. M. K. Abotsi, A. W. Scaroni, J. M. Solar and D. J. Skrovanek, Appl. Catal., 1986, 27, 117–131 CrossRef.
- L. R. Radovic and F. RodriguezReinoso, in Chemistry and Physics of Carbon, ed. P. A. Thrower, Marcel Dekker, New York, 1997, vol. 25, pp. 243–358 Search PubMed.
- F. R. García-García, E. Gallegos-Suarez, M. Fernández-García, A. Guerrero-Ruiz and I. Rodríguez-Ramos, Appl. Catal., A, 2017, 544, 66–76 CrossRef.
- J. Xu, J. Zhao, J. Xu, T. Zhang, X. Li, X. Di, J. Ni, J. Wang and J. Cen, Ind. Eng. Chem. Res., 2014, 53, 14272–14281 CrossRef.
- Z. Hajjar, M. Kazemeini, A. Rashidi and M. Bazmi, Fuel, 2016, 165, 468–476 CrossRef.
- G. Goncalves, P. A. A. P. Marques, C. M. Granadeiro, H. I. S. Nogueira, M. K. Singh and J. Grácio, Chem. Mater., 2009, 21, 4796–4802 CrossRef.
- E. Bouleghlimat, P. R. Davies, R. J. Davies, R. Howarth, J. Kulhavy and D. J. Morgan, Carbon, 2013, 61, 124–133 CrossRef.
- C. Buono, P. R. Davies, R. J. Davies, T. Jones, J. Kulhavý, R. Lewis, D. J. Morgan, N. Robinson and D. J. Willock, Faraday Discuss., 2014, 173, 257–272 RSC.
- R. Burgess, C. Buono, P. R. Davies, R. J. Davies, T. Legge, A. Lai, R. Lewis, D. J. Morgan, N. Robinson and D. J. Willock, J. Catal., 2015, 323, 10–18 CrossRef.
- I. Horcas, R. Fernandez, J. Gomez-Rodriguez, J. Colchero, J. Gomez-Herrero and A. Baro, Rev. Sci. Instrum., 2007, 78, 013705 CrossRef PubMed.
- M. L. Machesky, W. O. Andrade and A. W. Rose, Geochim. Cosmochim. Acta, 1991, 55, 769–776 CrossRef.
- J. A. Peck, C. D. Tait, B. I. Swanson and G. E. Brown, Geochim. Cosmochim. Acta, 1991, 55, 671–676 CrossRef.
- X. Liu, M. Conte, D. Elias, L. Lu, D. J. Morgan, S. J. Freakley, P. Johnston, C. J. Kiely and G. J. Hutchings, Catal. Sci. Technol., 2016, 6, 5144–5153 Search PubMed.
- E. Papirer, R. Lacroix, J.-B. Donnet, G. Nansé and P. Fioux, Carbon, 1995, 33, 63–72 CrossRef.
- K. Kishi and S. Ikeda, J. Phys. Chem., 1974, 78, 107–112 CrossRef.
- A. Felten, C. Bittencourt and J. J. Pireaux, Nanotechnology, 2006, 17, 1954 CrossRef.
- J. K. Edwards, B. Solsona, E. N. N, A. F. Carley, A. A. Herzing, C. J. Kiely and G. J. Hutchings, Science, 2009, 323, 1037–1041 CrossRef PubMed.
- N. H. Turner, J. S. Murday and D. E. Ramaker, Anal. Chem., 1980, 52, 84–92 CrossRef.
- G. Malta, S. J. Freakley, S. A. Kondrat and G. J. Hutchings, Chem. Commun., 2017, 53, 11733–11746 RSC.
| This journal is © The Royal Society of Chemistry 2018 |