 Open Access Article
Creative Commons Attribution 3.0 Unported Licence
Adaptation of Rhodopseudomonas acidophila strain 7050 to growth at different light intensities: what are the benefits to changing the type of LH2?
A. T.
Gardiner
 *a,
D. M.
Niedzwiedzki
 b and
R. J.
Cogdell
a
aInstitute of Molecular, Cellular and Systems Biology, University of Glasgow, University Avenue, Glasgow, G12 8QQ, UK. E-mail: alastair.gardiner@glasgow.ac.uk
bPhotosynthetic Antenna Research Center, Washington University in St Louis, MO 63130, USA
First published on 18th October 2017
Abstract
Typical purple bacterial photosynthetic units consist of light harvesting one/reaction centre ‘core’ complexes surrounded by light harvesting two complexes. Factors such as the number and size of photosynthetic units per cell, as well as the type of light harvesting two complex that is produced, are controlled by environmental factors. In this paper, the change in the type of LH2 present in the Rhodopsuedomonas acidophila strain 7050 is described when cells are grown at a range of different light intensities. This species contains multiple pucBA genes that encode the apoproteins that form light-harvesting complex two, and a more complex mixture of spectroscopic forms of this complex has been found than was previously thought to be the case. Femto-second time resolved absorption has been used to investigate how the energy transfer properties in the membranes of high-light and low-light adapted cells change as the composition of the LH2 complexes varies.
Introduction
The primary reactions of purple bacterial photosynthesis involve light harvesting (LH) complexes and reaction centres (RC) that are located in intracytoplasmic membranes (ICM).1 Light energy absorbed by the light harvesting system is transferred to the RCs where it is trapped by a series of transmembrane electron transfer reactions. The cell’s capacity for LH is flexible and can be adjusted in response to environmental factors, such as the incident light intensity.2,3 Under low light (LL) conditions there is an extensive system of ICM in the cell, whereas under high light (HL) conditions the amount of ICM is a lot less. Typically, there are two types of LH complexes present, called LH1 and LH2. The LH1 complexes surround the RC to form the so called ‘core’ complex, with the LH2 complexes arranged more peripherally around the core complexes.4–6 The incident light intensity also regulates the ratio of the LH2 complexes to core complexes; this ratio is higher under low intensity illumination. These adaptations allow the purple bacteria to optimise their LH apparatus in response to changing environmental conditions.7The LH1 complex has a single major bacteriochlorophyll a (Bchl a) Qy absorption band in the near infra-red (NIR) region at 884 nm, whereas LH2 has two major Bchl a Qy absorption bands around 800 and 850 nm. Chemically it is the same Bchl a molecules that give rise to these absorption bands, with the different positions being due to specific pigment–pigment and pigment–protein interactions within the various LH complexes.8,9 Importantly, these wavelength differences establish an energy gradient to ensure that the energy from the harvested photons is directed downhill from LH2 to LH1 and then on to the RC.10
In purple bacteria, changes in the amount and composition of the LH system, in response to environmental stimuli, serve to enhance their ability to harvest sufficient solar energy to allow photosynthetic growth under the changing conditions experienced in different ecological niches. Some species, however, exhibit an additional response to growth at different light intensities. Within the genome, these species contain a multigene family of pucBA genes that encode the alpha and beta apoproteins that form LH2 complexes.11 The expression of different pucBA genes results in LH2 complexes that exhibit markedly different absorption spectra in the NIR spectral range.12
Rhodopseudomonas (Rps.) acidophila has a form of LH2 that has its main Bchl a Qy bands at 800 and 850 nm when the cells are grown under HL conditions, and this switches to a form that has its Bchl a Qy bands at 800 and 820 nm under LL conditions. The question then arises as to what extra benefits this ability gives species such as Rps. acidophila at LL intensities? A start towards answering this question forms the major focus of this paper. Previously the energy transfer properties of the isolated B800–820 and B800–850 LH2 complexes have been investigated using ultrafast laser flash photolysis.18–20 The time constant for 800 to 820 nm excitation energy transfer (EET) is ∼0.75 ps at room temperature (RT) and 0.9 ps at 77 K. This compares with 0.8 ps at RT and 1.3 ps at 77 K for 800-to-850 nm energy transfer, i.e., the EET rates for both these types of LH2 are rather similar. The rates of energy transfer from both these types of LH2 to LH1 in photosynthetic membranes are also rather similar; B820 to LH1 is just a bit slower than B850 to LH1. However, when one considers that in the absence of LH1 the lifetime of the excited singlet state of both B850 and B820 is about 1 ns, the small differences in the LH2 to LH1 EET rates do not significantly change the overall high efficiency of this energy transfer step. Therefore, the question is worth repeating; what does the organism gain by this change in the type of LH2 upon going from growth at high to low light intensities?
A partial answer has been suggested from experiments on membranes using high intensity laser flashes that induce exciton annihilation.21 This process requires singlet–singlet fusion. Two excited singlet states must be able to migrate, ‘collide’ and then de-excite with the excess energy released as heat. This approach has been used to measure the size of the domain in which the excited singlet states can move around in and ‘find’ each other to annihilate.22 The presence of B800–820 complexes in the LL membranes confined the excited singlet states into smaller domains around the LH1 core complexes compared with HL grown membranes containing B800–850 complexes.21 It was, therefore, suggested that the presence of B800–820 complexes slowed down the back reaction from LH1 to LH2 compared to when B800–850 was present. It was assumed that this could then give more time for the trapping of the excited state by the RC, which is more important under light limiting conditions.
Previously, we investigated how the light harvesting systems in three strains of Rps. acidophila (10050, 7750 and 7050) adapt to growth at different light intensities.23,24 These studies were mainly carried out in order to learn how to grow these strains under defined, standardised conditions, where the type of LH2 complex made is consistent.
It has been known for some time that the genome of Rps. acidophila contains a large multi-gene family of the pucBA genes.25 Recently, however, the genome of Rps. acidophila 10050 was sequenced which revealed that in this strain there are twelve copies of the pucBA genes.26 This suggests that a full and complete understanding of LH2 complexes and their role is much more complicated than imagined. As the technology underpinning laser flash photolysis has significantly improved, compared to that used in our previous study in 1991,21 it was decided to reinvestigate how this species of purple bacteria adapts to growth at different light intensities and the possible benefits that these adaptations confer.
Results and discussion
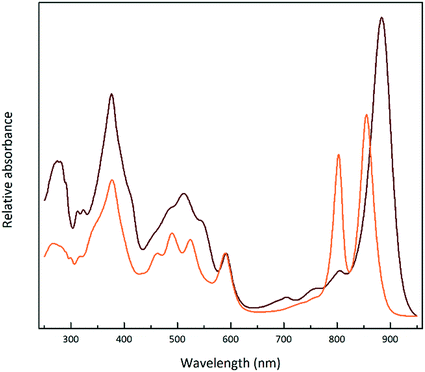
Fig. 1 shows the absorption spectra of the isolated, purified core and LH2 complexes from the purple bacterium Rps. acidophila. Fig. 2 illustrates some examples of the variety of spectra that these different forms of LH2 can exhibit.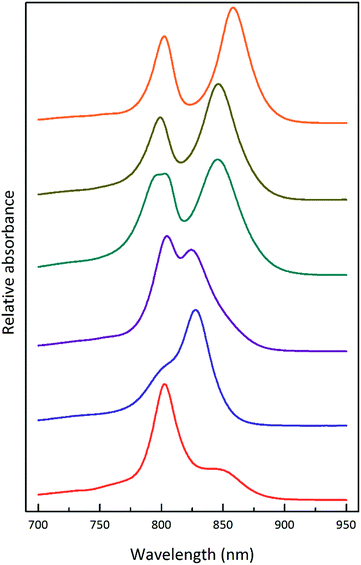 | ||
| Fig. 2 Selected LH2 complexes to illustrate the spectral variability in the NIR region. The archetypal Rps. acidophila 10050 LH2 (orange) complex exhibits the B850 maximum at 858 nm.13 The octameric Phaeospirillum molischianum LH2 (olive) complex exhibits the B850 maximum at 846 nm.14 The B850 maximum of the Allochromatium vinosum LH2 (turquoise) complex is at 845 nm, but this complex additionally contains a split B800 band.15 The most discernible low-light LH2 complex from Rhodopseudomonas acidophila 7050 (purple), the subject of this paper, exhibits a blue-shifted B850 peak at a maximum of 824 nm.16 For this reason, the complex is referred to as a B800–820 LH2 complex and the old nomenclature of LH3 is no longer used. The octameric B800–830 LH2 complex from Marichromatium purpuratum (navy blue) exhibits its NIR maximum at 828 nm.17 The low-light form of LH2 from Rhodopseudomonas palustris (red) exhibits a much reduced B850 band.12 All of the LH2 complex spectra shown in this figure were produced by the Cogdell laboratory in Glasgow. | ||
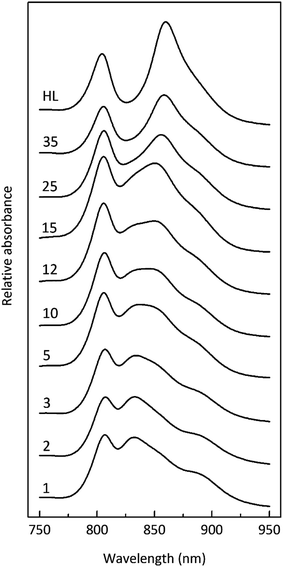
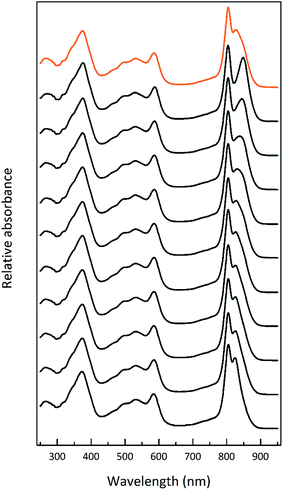
Fig. 3 shows how the absorption spectrum of the photosynthetic membranes from Rps. acidophila strain 7050 changes depending upon the incident light intensity at which the cells were grown.
The light intensity was varied by growing the cells at different distances from an incandescent bulb. This strategy ensures that the spectral composition of the incident light does not vary as these bacteria also contain bacteriophytochromes.27 This is important as the purple bacterial light harvesting system is also subject to regulation by the wavelength of the incident radiation as well as its intensity.28,29 The top absorption spectrum is from HL adapted cell membranes. It is dominated by peaks at 800 and ∼850 nm that embody the typical HL form of LH2. There is a clear shoulder on the red side of the 850 nm band at about 880 nm that originates from the underlying LH1 complex (Fig. 1). As the incident light intensity is reduced the 850 nm absorption band gets smaller and appears to blue shift. A new peak at about 820 nm grows in as the light intensity decreases. Initially this is evident as the ‘valley’ between the 800 and 850 nm bands filling in but then a 820 nm band can be clearly seen at lower light intensities. The changes in the absorption spectrum can also be seen by comparing the relative heights of the 850 nm and 800 nm bands. As the light intensity is lowered the relative height of the 850 nm band strongly reduces. In all cases except at the highest light intensity the population of LH2 complexes present seems to be a mixture of different spectroscopic types. If the situation solely represents a progressive shift of the amount of B800–850 to B800–820 then the normalised difference spectra of the absorption spectra should reveal an isosbestic point somewhere between the 850 and 820 nm bands. A full set of difference spectra, where the absorption spectrum of each lower light intensity sample is subtracted from the HL spectrum, is shown in Fig. 4.
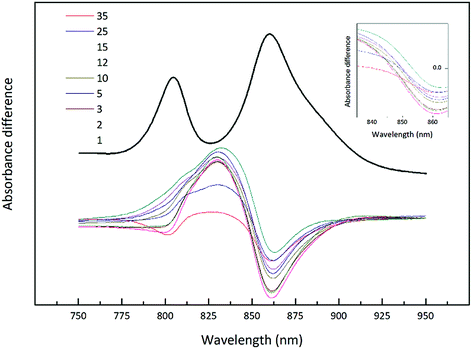 | ||
| Fig. 4 Difference spectra of the NIR absorption from the Rhodopseudomonas acidophila 7050 membranes presented in Fig. 3. All absorption spectra were normalised at the Bchl a Qx band, with the high-light membranes given in black. Each subsequent spectrum has been subtracted from this initial absorption spectrum to generate the set of difference spectra. The inset shows the possible isobestic region magnified for clarity. | ||
This set of difference spectra show that there is no clear isosbestic point (Fig. 4 inset), which suggests that the changes in the absorption spectra shown cannot be simply explained by a shift between two well-defined types of LH2. There must be a more complicated mixture of different spectroscopic forms of LH2 present.
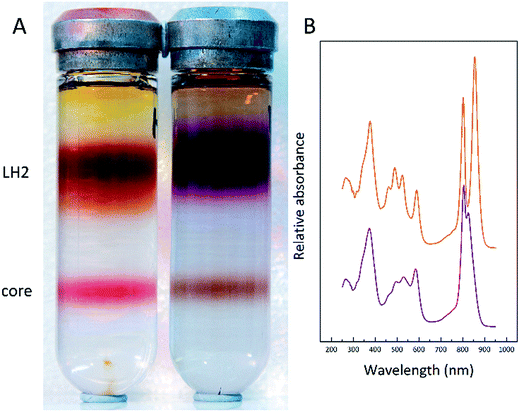
To further investigate this finding, membrane samples were fractionated into LH2 and LH1 core complexes by sucrose gradient centrifugation following detergent solubilisation. Two such typical sucrose gradients are shown in Fig. 5A. The LH2 band is the major one about one third down the gradient and the LH1 core complex is the smaller band nearer the bottom of the tube. Two features are very clear. The ratio of the amount of LH2 to core complex present in the two examples shown is quite different. The LL tube has much more LH2 relative to the amount of core complex present. In addition, the colour of the LH2 band changes.
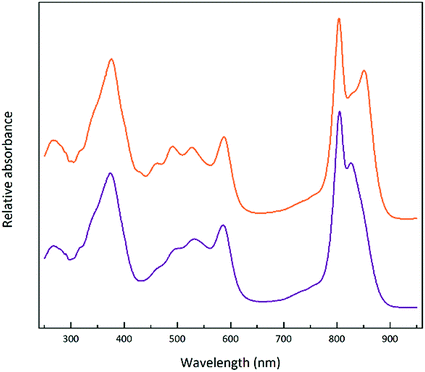
In the HL sample the LH2 band is orange/brown but in the LL tube the LH2 band is purple. This change has been documented before and is due to a change in the major type of carotenoid present. At HL, the major carotenoid in LH2 is rhodopin/rhodopin glucoside whereas at LL the major carotenoid is rhodopinal/rhodopinal glucoside.24,30 Interestingly, rhodopinal is about 50% more efficient as an accessory light harvesting pigment than rhodopin.31 The colour change of these LH2 complexes is reflected in the change in the absorption spectra in the region between 450 and 550 nm where the carotenoids absorb. Other factors such as the carbon source on which the cells are grown also affect the response to growth at different light intensities.30Rps. acidophila 7050 cells were grown under identical conditions at the same LL intensity but in one case using succinate as the carbon source and the other in the presence of pyruvate. Growing with pyruvate rather than succinate shifts the light intensity response so that the cells have an absorption spectrum that is more like that of succinate cells grown at a higher light intensity.30Fig. 6 shows the resultant LH2 band spectra of the sucrose gradients of solubilised ICM isolated from succinate and pyruvate LL grown cells.
A solubilised ICM sample from succinate-grown LL cells was separated on a sucrose gradient and the isolated LH2 band further fractionated by ion exchange chromatography. Fig. 7 shows the absorption spectra of these different fractions that elute as the salt concentration increases. There appears to be a transition between several different forms of LH2 that cannot be simply explained by a mixture of the two previously described B800–850 (ref. 13) and B800–820 (ref. 16) complexes.
Considering the basic, repeating heterodimeric structure of a LH2 complex, when different pucBA genes contribute polypeptides to form the complete native structure, if these different polypeptides encode different site-energies for the group of strongly coupled Bchl a molecules, then there are a large number of possible spectroscopic outcomes.32,33
Steady-state absorption of the membranes used in the transient absorption measurements
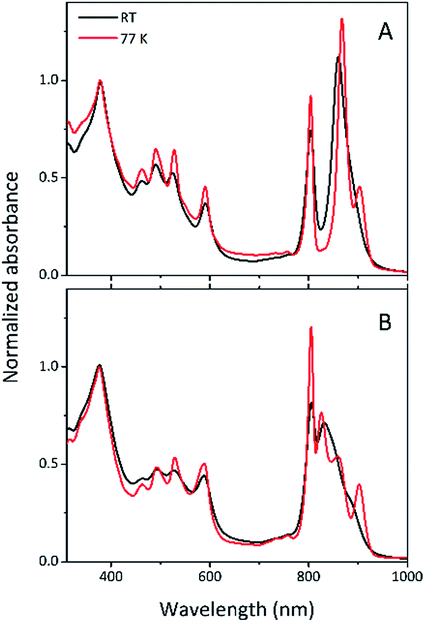
Steady-state absorption spectra of the HL and LL photosynthetic membranes of Rps. acidophila 7050 used in the transient absorption measurements, taken at room temperature and at 77 K, are shown in Fig. 8.Low temperature clearly affects the spectra of each membrane sample. At 77 K the absorption spectra gain spectral resolution (the bands sharpen) and reveal additional details not seen in the room temperature spectra. For both HL and LL samples the absorption band at 903 nm becomes clearly recognizable. This peak is associated with the Qy band of the LH1–RC core complex. In addition, for the LL membrane sample the broad absorption band between 820 and 880 nm, unresolved at room temperature, splits into two peaks with maxima at about 826 and 860 nm. The positions of those peaks suggest the presence of a mixture of at least two different spectroscopic forms of LH2. A clearer view of these differences between the two membranes is shown in Fig. 9 in which the 77 K absorption spectra are overlaid. This overlay shows an additional difference between the samples in the spectral shape of the Bchl a Qx bands. The Qx band is blue shifted and broader in the case of the LL membrane, which is consistent with the presence of a mixture of types of LH2 complexes, as seen in the fractionation studies described above.
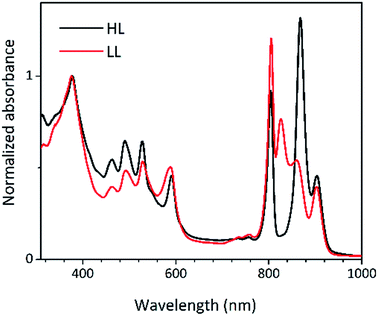 | ||
| Fig. 9 Overlay of the 77 K absorption spectra of the photosynthetic membranes of Rps. acidophila 7050 cells grown under high-light (black) and low-light (red) intensity conditions. | ||
Time-resolved absorption
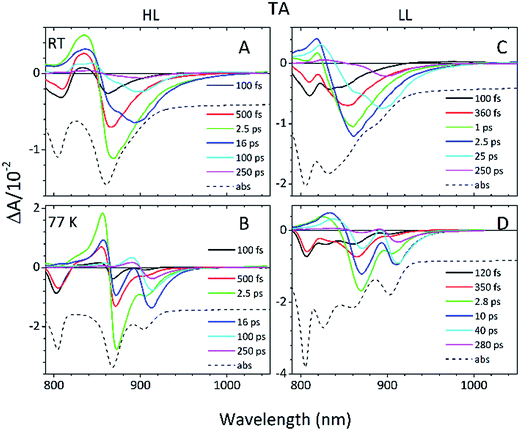
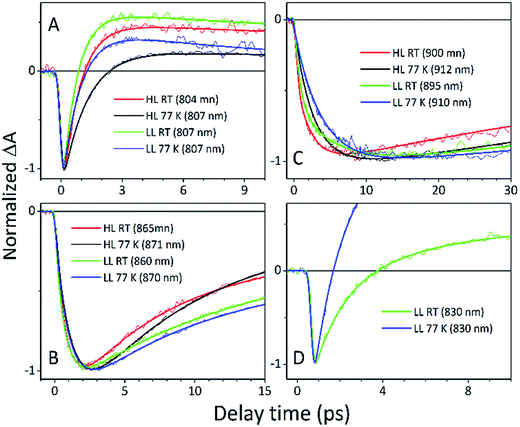
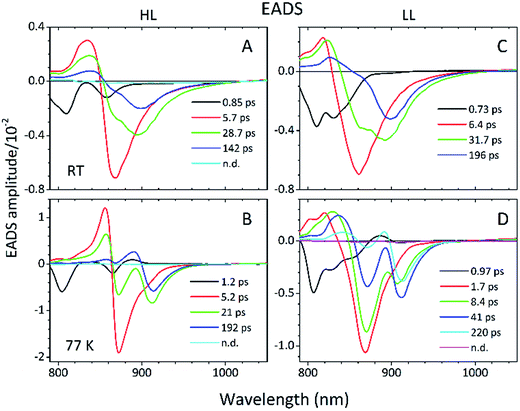
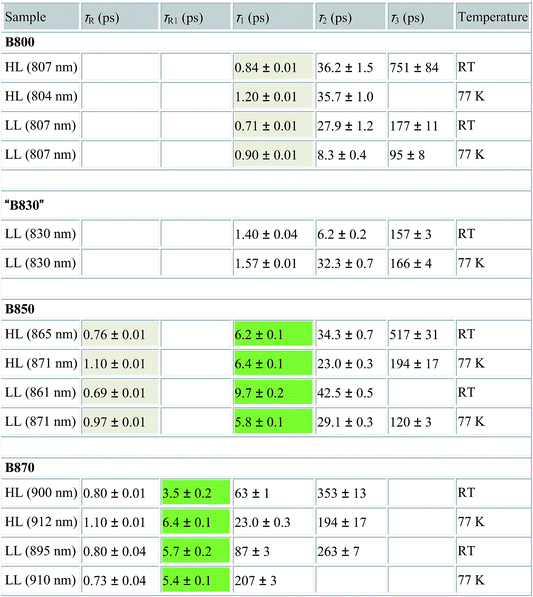
Detailed information about the photo-physical processes that occur in the membrane after specific excitation (into the B800 band of the LH2 complexes) can be obtained from time-resolved absorption (TA) studies. Such a set of experiments are depicted in Fig. 10.For easier interpretation of this data, the TA spectra are accompanied by a mirror image of the respective steady-state absorption (given as a dashed line). Just as seen in the case of the steady-state spectra, at 77 K the TA spectra gain a spectral resolution that cannot be seen at room temperature. The intermediate stages in time spectral evolution now also become visible. Since cryogenic data provide more insight into the photo-physical processes in the membranes, these will be described here but conclusions drawn from this can also be extended to the room temperature data. Excitation at 800 nm of the HL membranes leads to the instantaneous bleaching of two bands at 803 and 867 nm (black line). Those correspond to the bleaching of the Qy bands of B800 and B850 Bchls in the well-characterised HL LH2 complex. The perfect match of the positions of the B850 band from the steady-state absorption spectrum and the observed bleaching band suggests that this excitonic level is not yet populated, otherwise it would be distorted by stimulated emission that would broaden and red-shift the observed “bleaching” band. Instead, excitation at 800 nm is also partially absorbed by the higher excitonic band of the “B850” exciton manifold that overlaps with the B800 band and which is responsible for efficient B800 → B850 energy transfer.34,35 Population of the higher excitonic level of the B850 exciton will depopulate the ground state, thus resulting in the bleaching of all excitonic bands, which explains this initial fast bleaching in the B850 band. As time evolves bleaching of the B800 band decays and within ∼1 ps all of the excitation is transferred to the B850 exciton (see the 500 fs and 2.5 ps TA spectra). At this stage the bleaching of the B850 band will also involve stimulated emission (SE) from this excitonic level (stimulation is by the probe light). This is clearly observed as a red-shift of the bleaching-SE band that shows a minimum at 872 nm (vs. 867 nm for the steady-state absorption). As the time delay increases to tens of picoseconds the excited B850 band of LH2 decays and excitation is passed to the LH1–RC core complex. Finally, the TA spectra completely recover back to the ground state in the sub-nanosecond time domain. For the LL membrane sample, one can clearly observe an additional intermediate spectral component that seems to be simultaneously populated with B800 and which decays within a couple of picoseconds. More details about the dynamics of those processes were obtained by fitting the TA data. First, single wavelength fitting was carried out on chosen kinetic traces corresponding to the changes seen at the maxima of B800, B850 (HL LH2) and B870 (LH1–RC) (HL membranes) and at 820 and 830 nm for the LL membranes (corresponding to the additional “B850-like” bands seen at LL). The fitting was carried out using a simple model based on a sum of exponentially decaying components convoluted by the instrument response function (IRF). In principle, the parameters obtained from the fitting show the effective decay lifetimes of the excited states of the pigments of interest (B800, B850, etc.) as well as the inter-pigment energy transfer rates that should be observed as rise components. This then should reveal any differences in the energy transfer properties between the membranes at both temperatures. These results are shown in Fig. 11. The rise and decay lifetimes obtained from the fitting are listed in Table 1.
| a τ R,R1 – lifetimes of the rise components, τ1–3 – lifetimes of the decay components, RT – room temperature, HL – high light membrane, LL – low light membrane. The rise and decay lifetimes that are coupled due to energy transfer between B800 → B850 and B850 → B870 are shaded. |
|---|
|
The fitting at each wavelength gave multiple decay constants, which is completely understandable as various spectral features (ground state bleaching, stimulated emission, excited state absorption) of different molecular species (B800, B850, etc.) can coexist and overlap. From the fitting results of the recovery of the B800 band, the most interesting is the set of the fastest decaying lifetimes (dominating components) as those determine how efficiently energy transfer between B800 and ‘B850’ in LH2 occurs. The results suggest that energy transfer from the B800 Bchls to other molecular species (like ‘B850’) is enhanced in LL membranes. This is visible as the shortening of the B800* lifetime and this same trend is also noticeable at 77 K. This higher rate of energy transfer may be a consequence of the enhanced spectral overlap with the B830 absorption band of a different spectroscopic form(s) of the LH2 complex that is (are) only present in LL membranes. Note that it was impossible to resolve the rise component of the B830* band, thus suggesting that B800 → B830 energy transfer may be limited by the time resolution (∼200 fs) of the spectrometer or may be due to a heterogeneous mixture of LH2 types being present.
The lifetimes associated with the rise components in the fitting of the signals associated with the bleaching of the B850 band correspond very well to the observed decay lifetimes of B800*, thus further confirming that efficient B800 → B850 energy transfer is indeed taking place. Subsequently, the majority of the B850* bleaching recovers with lifetimes ranging from 5.8 to 9.7 ps. Those lifetimes are typical for B850 → B870 (LH2 to LH1–RC) energy transfer.34,36 Interestingly the rise components that are characteristic of the B800 → B850 energy transfer process also make a minor contribution to the population of signals that would be expected to be associated only with the bleaching of the B870 Bchls from LH1–RC. This is not an indication of any B800 → B870 energy transfer but rather reflects the fact that the transient signal associated with the B850* band also, however minimally, contributes to the absorption changes in this spectral range. Regardless of the fact that the steady-state absorption of the B850 band does not extend to such long wavelengths, the TA signal will also contain stimulated emission that overlaps, to some degree, with the B870 band. The TA spectra of the membranes, therefore, may always show some long-lived residual ‘B850’ bleaching associated with uncoupled LH2 complexes. A further complication arises from the possibility that some of the RCs may be closed during the measurements. This will unavoidably lead to substantial variation in the lifetime of B870*. This phenomena was observed in the present study as multiple kinetic components that are still associated with the same spectral species, B870*. The outcomes from the single wavelength fits were used to undertake some more advanced fitting, so-called global analysis that simultaneously fits the whole TA dataset. The results of such an analysis are given in Fig. 12.
Essentially, the effective lifetimes that are now associated with the EADS components are in a good agreement with those from the single wavelength fits. The EADS provide more insight into the temporal evolution of the system as a whole, and allow the identification of the spectral change associated with each specific decay lifetime.
Back energy transfer
An interesting aspect of a whole membrane study is the probability of reversed energy transfer. This will depend on the extent of the spectral overlap of the emission spectrum of LH1 and the absorption spectrum of the longest wavelength band of the LH2 nearest to the excited LH1 complex. Unfortunately, the present experiments are unable to resolve any back transfers. One way to approach this problem would be to excite LH1 specifically and then to look for any transfer of excitation energy to the different ‘B850’ absorption bands in the membranes of cells grown at different light intensities. This type of approach has already been used.35 However, what is really needed is an experimental protocol that is to be able to image the organisation of the LH complexes in individual membrane patches and which is then able to measure the energy transfer just from those small imaged regions. This approach would be able to avoid averaging over different arrangements of the LH complexes and thus would remove a lot of the current ambiguity. Unfortunately, at present there are no methods available to conduct these types of measurements.Experimental
Cell growth
Cells of Rps. acidophila strain 7050 were grown anaerobically in C-succinate media in flat, glass bottles at 30 °C under anaerobic conditions at different light intensities as previously described.18 HL cultures were placed between two incandescent bulbs at 100 μmol photons per s per m2 and grown overnight. LL cultures were also grown under up to nine different conditions at 5, 10, 20, 25, 30, 40, 50, 75 and 100 cm away from the light source. These distances correspond to light intensities of (approximately) 35, 25, 15, 12, 10, 5, 3, 2 and 1 μmol photons per s per m2. For the time-resolved measurements the membranes were prepared from cells grown at 100 (HL) and 15 (LL) μmol photons per s per m2.Membrane preparation and protein purification
Rps. acidophila cells were harvested by centrifugation, re-suspended in 20 mM Tris·Cl pH 8.0, homogenised with the addition of ∼100 μg of DNase and a few mg of MgCl2 and disrupted by two passages through a French Pressure cell (∼15![[thin space (1/6-em)]](https://www.rsc.org/images/entities/char_2009.gif) 000 psi). The photosynthetic membranes were immediately pelleted by ultracentrifugation (180
000 psi). The photosynthetic membranes were immediately pelleted by ultracentrifugation (180![[thin space (1/6-em)]](https://www.rsc.org/images/entities/char_2009.gif) 000 × g, 90 min, 4 °C). The supernatant was discarded and the membranes gently re-suspended with 20 mM Tris·Cl pH 8.0 and adjusted to an optical density (OD) at the Qx band (approx. 580 nm) of 25 cm−1. The re-suspended membranes were solubilised at room temperature for 1 h with 1% N,N-dimethyldodecylamine N-oxide (LDAO) and then centrifuged to remove any un-solubilised material. The solubilised membrane fraction (ODV = 15 loading) was fractionated using stepwise sucrose density centrifugation (150
000 × g, 90 min, 4 °C). The supernatant was discarded and the membranes gently re-suspended with 20 mM Tris·Cl pH 8.0 and adjusted to an optical density (OD) at the Qx band (approx. 580 nm) of 25 cm−1. The re-suspended membranes were solubilised at room temperature for 1 h with 1% N,N-dimethyldodecylamine N-oxide (LDAO) and then centrifuged to remove any un-solubilised material. The solubilised membrane fraction (ODV = 15 loading) was fractionated using stepwise sucrose density centrifugation (150![[thin space (1/6-em)]](https://www.rsc.org/images/entities/char_2009.gif) 000 × g, 4 °C, 16 h). The LH2 complex band was collected from the gradient and loaded on to a Q-Sepharose (GE Healthcare) anion exchange column. The LH2 was washed on the column with 20 mM Tris·Cl pH 8.0, 0.1% LDAO buffer solution and eluted with increasing concentrations of NaCl. Typically, the LH2 band would elute at around 100–150 mM NaCl.
000 × g, 4 °C, 16 h). The LH2 complex band was collected from the gradient and loaded on to a Q-Sepharose (GE Healthcare) anion exchange column. The LH2 was washed on the column with 20 mM Tris·Cl pH 8.0, 0.1% LDAO buffer solution and eluted with increasing concentrations of NaCl. Typically, the LH2 band would elute at around 100–150 mM NaCl.
Spectroscopic methods
The steady state absorption spectra shown in Fig. 1–7 were recorded using a Shimadzu UV-1700 spectrophotometer, with those shown in Fig. 8–9 recorded using a Shimadzu UV-1800 spectrophotometer. The spectroscopic measurements recorded at 77 K were carried out using a VNF-100 liquid nitrogen cryostat from Janis (Janis, USA) in 1 cm PMMA cuvettes. The samples were diluted in 60![[thin space (1/6-em)]](https://www.rsc.org/images/entities/char_2009.gif) :
:![[thin space (1/6-em)]](https://www.rsc.org/images/entities/char_2009.gif) 40 v/v glycerol
40 v/v glycerol![[thin space (1/6-em)]](https://www.rsc.org/images/entities/char_2009.gif) :
:![[thin space (1/6-em)]](https://www.rsc.org/images/entities/char_2009.gif) buffer (20 mM Tris, 0.1% LDAO, pH 8.0), forming a fully transparent glass at cryogenic temperature. The absorbance of the samples in the Qy region of Bchl a was set to ∼0.5. The TA experiments were carried out using Helios, a femtosecond time-resolved and pump-probe absorption spectrometer (UltrafastSystems, LCC) coupled to a Spectra-Physics femtosecond laser system, as described in detail previously.37 The samples were excited at 800 nm. The energy of the excitation beam was set to 50 nJ, corresponding to a photon flux of ∼3 × 10¹³ photons per cm2 per pulse (the beam was focused to a ∼1 mm diameter spot on the sample and the laser repetition was set to 1 kHz), which was low enough to prevent a nonlinear response of the sample and excited singlet–singlet state annihilation.
buffer (20 mM Tris, 0.1% LDAO, pH 8.0), forming a fully transparent glass at cryogenic temperature. The absorbance of the samples in the Qy region of Bchl a was set to ∼0.5. The TA experiments were carried out using Helios, a femtosecond time-resolved and pump-probe absorption spectrometer (UltrafastSystems, LCC) coupled to a Spectra-Physics femtosecond laser system, as described in detail previously.37 The samples were excited at 800 nm. The energy of the excitation beam was set to 50 nJ, corresponding to a photon flux of ∼3 × 10¹³ photons per cm2 per pulse (the beam was focused to a ∼1 mm diameter spot on the sample and the laser repetition was set to 1 kHz), which was low enough to prevent a nonlinear response of the sample and excited singlet–singlet state annihilation.
Data analysis
Group velocity dispersion (temporal chirp) of the TA datasets was corrected using Surface Explorer software (UltrafastSystems LCC, Sarasota, FL, USA) by building a dispersion correction curve from a set of the initial times of transient signals obtained from single wavelength fits of the representative kinetics. Global analysis of the TA datasets was carried out by applying a sequential irreversible decay path model (A → B → C → D → …). In the sequential model, back-reactions are ignored on the assumption that the energy losses are large enough that the reverse reaction rates are negligible, however this may not be a true in a complex system such as a photosynthetic membrane. The spectral profiles obtained from this fitting of the TA datasets are termed Evolution Associated Difference Spectra (EADS). According to this model, a transient signal at any time delay and wavelength, ΔA(t,λ), can be decomposed to a superposition of the nthCSi(t)EADSi(λ) products38 | (1) |
Conclusions
Cells of Rps. acidophila strain 7050 produce more types of LH2 complexes than previously thought, and because these different spectroscopic forms are so similar it is not currently possible to individually isolate and purify them. Indeed with 12 members of the pucBA gene family present in the genome of Rps. acidophila 10050 (ref. 20), and with a similar number, possibly even more, present in the Rps. acidophila 7050 (ref. 19) genome, the actual apoprotein composition of these LH2 complexes could be even more complicated. Different apoprotein combinations might not even give different spectroscopic forms due to the heterogeneity of both of the different types of LH2 and their organisation in the photosynthetic membrane.33 New experimental techniques are needed in order for definitive data to be obtained that can unequivocally explain the possible benefits that this species can obtain by regulating the type of LH2 that is made in response to changing environmental conditions.Conflicts of interest
There are no conflicts to declare.Acknowledgements
The authors gratefully acknowledge the support from the Photosynthetic Antenna Research Center, an Energy Frontier Research Center funded by the U.S. Department of Energy, Office of Science, Office of Basic Energy Sciences under the Award Number DE-SC 0001035.References
- R. A. Niederman and K. D. Gibson, in The Photosynthetic Bacteria, ed. R. K. Clayton and W. R. Sistrom, Plenum Press, New York and London, 1978, pp. 79–118 Search PubMed.
- J. Aargaard and W. R. Sistrom, Photochem. Photobiol., 1972, 15, 209–225 CrossRef.
- S. Kaplan, in The Photosynthetic Bacteria, ed. R. K. Clayton and W. R. Sistrom, Plenum Press, New York and London, 1978, pp. 809–839 Search PubMed.
- B. Robert, R. J. Cogdell and R. van Grondelle, in Light Harvesting Antennas in Photosynthesis, ed, B. R. Green and W. W. Parson, Kluwer Academic Press, New York, 2003, vol. 5, pp. 169–194 Search PubMed.
- S. Scheuring and J. N. Sturgis, Science, 2005, 309, 484–487 CrossRef CAS PubMed.
- J. N. Sturgis, J. D. Tucker, J. D. Olson, C. N. Hunter and R. A. Niederman, Biochemistry, 2009, 48, 3679–3698 CrossRef CAS PubMed.
- C. S. Young and J. T. Beatty, in Light Harvesting Antennas in Photosynthesis, ed, B. R. Green and W. W. Parson, Kluwer Academic Press, New York, 2003, vol. 16, pp. 449–470 Search PubMed.
- R. J. Cogdell, T. D. Howard, N. W. Isaacs, K. McLuskey and A. T. Gardiner, Photosynth. Res., 2002, 74, 135–141 CrossRef CAS PubMed.
- B. Robert, in The Purple Phototrophic Bacteria, ed. C. N. Hunter, F. Daldal, M. C. Thurnauer and J. T. Beatty, Springer, Dordrecht, 2009, vol. 11, pp. 199–212 Search PubMed.
- R. J. Cogdell, A. Gall and J. Kohler, Q. Rev. Biophys., 2006, 39, 227–324 CrossRef CAS PubMed.
- S. L. Henry and R. J. Cogdell, in Genome Evolution of Photosynthetic Bacteria, ed. J. T. Beatty, Elsevier, Amsterdam, 2013, vol. 66, pp. 205–226 Search PubMed.
- T. H. P. Brotosudarmo, A. M. Collins, A. Gall, A. W. Roszak, A. T. Gardiner, R. E. Blankenship and R. J. Cogdell, Biophys. J., 2011, 440, 51–61 CAS.
- G. McDermott, S. M. Prince, A. A. Freer, A. M. Hawthornthwaite-Lawless, M. Z. Papiz, R. J. Cogdell and N. W. Isaacs, Crystal structure of an integral membrane light-harvesting complex from photosynthetic bacteria, Nature, 1995, 374, 517–521 CrossRef CAS.
- J. Koepke, X. C. Hu, C. Muenke, K. Schulten and H. Michel, Structure, 1996, 4, 581–597 CrossRef CAS PubMed.
- A.-M. Carey, K. Hacking, N. Picken, S. Honkanen, S. Kelly, D. M. Niedzwiedzki, R. E. Blankenship, Y. Shimizu, Z. Y. Wang-Otomo and R. J. Cogdell, Biochim. Biophys. Acta, Bioenerg., 2014, 1837, 1849–1860 CrossRef CAS PubMed.
- K. McLuskey, S. M. Prince, R. J. Cogdell and N. W. Isaacs, Biochemistry, 2001, 40, 8783–8789 CrossRef CAS PubMed.
- L. J. Cranston, A. W. Roszak and R. J. Cogdell, Acta Crystallogr., Sect. F: Struct. Biol. Commun., 2014, 70, 808–813 CrossRef CAS PubMed.
- Y. Z. Ma, R. J. Cogdell and T. Gillbro, J. Phys. Chem. B, 1997, 101, 1087–1095 CrossRef CAS.
- Y. Z. Ma, R. J. Cogdell and T. Gillbro, J. Phys. Chem. B, 1998, 102, 881–887 CrossRef CAS.
- D. Zigmantas, E. L. Read, T. Mančal, T. Brixner, A. T. Gardiner, R. J. Cogdell and G. R. Fleming, Proc. Natl. Acad. Sci. U. S. A., 2006, 103, 12672–12677 CrossRef CAS PubMed.
- G. Deinum, S. C. M. Otte, A. T. Gardiner, T. J. Aartsma, R. J. Cogdell and J. Amesz, Biochim. Biophys. Acta, 1991, 1060, 125–131 CrossRef CAS.
- T. Kolubayev, N. E. Geacintov, G. Paillotin and J. Breton, Biochim. Biophys. Acta, 1985, 808, 66–76 CrossRef CAS.
- R. J. Cogdell, I. Durant, J. Valentine, J. G. Lindsay and K. Schmidt, Biochim. Biophys. Acta, 1983, 722, 427–435 CrossRef CAS.
- A. T. Gardiner, S. Takaichi and R. J. Cogdell, Photosynth. Res., 1993, 38, 159–167 CrossRef CAS PubMed.
- A. T. Gardiner, R. C. MacKenzie, S. J. Barrett, K. Kaiser and R. J. Cogdell, Photosynth. Res., 1996, 49, 223–235 CrossRef CAS PubMed.
- R. M. Mulvaney, PhD thesis, University of Glasgow, 2013.
- E. Giraud, S. Zappa, L. Vuillet, J. M. Adriano, L. Hannibal, J. Fardoux, C. Berthomieu, P. Bouyer, D. Pignol and A. Vermegli, J. Biol. Chem., 2005, 280, 32389–32397 CrossRef CAS PubMed.
- M. Li, S. Noll and J. T. Beatty, Curr. Microbiol., 2010, 61, 429–434 CrossRef CAS PubMed.
- K. Evans, A. P. Fordham-Skelton, H. Mistry, C. D. Reynolds, A. M. Lawless and M. Z. Papiz, Photosynth. Res., 2005, 85, 169–180 CrossRef CAS PubMed.
- E.-A. Heinemeyer and K. Schmidt, Arch. Microbiol., 1983, 134, 217–221 CrossRef CAS.
- A. Angerhofer, F. Bornhauser, A. Gall and R. J. Cogdell, Chem. Phys., 1995, 194, 259–274 CrossRef CAS.
- T. H. P. Brotosudarmo, R. Kunz, P. Boehm, A. T. Gardiner, V. Moulisova, R. J. Cogdell and J. Koehler, Biophys. J., 2009, 97, 1491–1500 CrossRef CAS PubMed.
- M. Taniguchi, S. Henry, R. J. Cogdell and J. S. Lindsey, Photosynth. Res., 2014, 121, 49–60 CrossRef CAS PubMed.
- V. Sundstrom, T. Pullerits and R. van Grondelle, J. Phys. Chem. B, 1999, 103, 2327–2346 CrossRef.
- L. Luer, V. Moulisova, S. Henry, D. Polli, T. H. P. Brotosudarmo, S. Hoseinkhani, D. Brida, G. Lanzani, G. Cerullo and R. J. Cogdell, Proc. Natl. Acad. Sci. U. S. A., 2012, 109, 1473–1478 CrossRef CAS PubMed.
- S. Hess, M. Chachisvilis, K. Timpmann, M. R. Jones, G. J. S. Fowler, C. N. Hunter and V. Sundstrom, Proc. Natl. Acad. Sci. U. S. A., 1995, 92, 12333–12337 CrossRef CAS.
- D. M. Niedzwiedzki, T. Tronina, H. Liu, H. Staleva, J. Komenda, R. Sobotka, R. E. Blankenship and T. Polivka, Biochim. Biophys. Acta, Bioenerg., 2016, 1857, 1430–1439 CrossRef CAS PubMed.
- I. H. M. van Stokkum, D. S. Larsen and R. van Grondelle, Global and target analysis of time-resolved spectra, Biochim. Biophys. Acta, Bioenerg., 2004, 1657, 82–104 CrossRef CAS PubMed.
| This journal is © The Royal Society of Chemistry 2018 |

