
 Open Access Article
 This Open Access Article is licensed under a Creative Commons Attribution-Non Commercial 3.0 Unported Licence
Bismuth titanate modified and immobilized TiO2 photocatalysts for water purification: broad pollutant scope, ease of re-use and mechanistic studies†
Gylen
Odling
,
Zhi Yi
Pong
,
Gavin
Gilfillan
,
Colin R.
Pulham
and
Neil
Robertson
 *
*
School of Chemistry, David Brewster Road, The King's Buildings, Edinburgh, Scotland EH9 3FJ, UK. E-mail: neil.robertson@ed.ac.uk
First published on 9th November 2018
Abstract
Deposition of titanium dioxide (TiO2) coatings onto glass beads from a P25 enriched sol of titanium butoxide is described. This method gives a robust and stable covering, to which small bismuth containing clusters of 1–5 nm have been introduced using a simple and scalable sequential ionic layer adsorption reaction (SILAR) method. This bismuth-modified TiO2 coating has been proven to show significant improvements over the pristine TiO2 samples for a variety of different pollutants including intermediates in consumer product manufacture, pesticides, drugs and explosives. Using scavenger tests, the mechanism of degradation for each of the pollutant molecules tested has been probed, and a thorough discussion of the differences presented. The applicability of the system has also been assessed, with ease of re-use of the photocatalyst-bead apparatus investigated through recycling tests.
Water impactPhotocatalytic water purification is an emerging method by which micropollutants may be removed from drinking water. We prepare and use an enhanced photocatalyst immobilised on macroscopic glass beads. By focussing on a simple, efficient, solution-processed, non-toxic, stable, immobilised photocatalytic material, broadly applicable to various pollutants, this system is suitable to be scaled up and applied in remote areas of the developing world. |
Introduction
Technologies for water purification are becoming increasingly important in the modern world.1 Lack of access to even basic water purification currently affects around 844 million people,2 a number which is expected to rise in coming years.3,4 An increasing global population and increased industrialization is likely to cause further water stress5 as natural drinking water sources become too polluted to be fit for safe consumption. It is key therefore to develop cheap and reliable methods of removing such pollutants from drinking water.A large component of impurities that may be present in drinking water sources are organic in nature, which can arise from a wide variety of sources such as leeching from agriculture,6,7 medical wastes,8,9 and domestic10 or industrial11,12 effluents. Thus, it is important that any remediation strategy is effective against such a wide range of different pollutants.
One method which has generated significant interest in recent years is that of semiconductor photocatalysis.13–15 Through photocatalytic generation of reactive oxygen species (ROS), semiconductors such as titanium dioxide (TiO2) can mineralize organic pollutants eventually converting them into harmless CO2 and H2O.16 To date, most photocatalytic water purification literature focuses on single test pollutants or small groups of similar compounds, and very few examples exist of photocatalysis being thoroughly tested against a broad spectrum of chemically dissimilar molecules. The work described herein aims to highlight some of the differences in activity and mechanism which arise when carrying out such a study.
While much work has been undertaken in design and development of new photocatalytic materials, often overlooked are the challenges that exist in producing an applicable system using such materials. Achieving high photocatalytic degradation rates necessitates the photocatalyst being nanoscale due to relatively short lifetimes of photogenerated charges.17 This presents a problem in separation of the photocatalyst particles post-use, as the typical centrifugation method used in the laboratory scale18–20 is not suitable for large scale water purification Much work has been undertaken in remedying this by forming magnetic composites,21,22 however this restricts the choice of semiconductors available for use to those which exhibit magnetic properties under ambient conditions. Much simpler is the immobilization of the photocatalyst on a macroscopic support such as glass, removal of which is trivial.
To date, TiO2 is the most commonly studied material in this field due to its low cost and environmental friendliness, however improvements can be made by formation of a composite with another suitable semiconductor.23–25 Composites often improve on pristine TiO2 by expanding the absorption into the visible and/or improving charge separation across the interface between the two materials.26–28 For this purpose, composites of bismuth with TiO2 have gained considerable interest in recent years, with many examples of bismuth vanadate,29,30 tungstate,31,32 molybdate33 and oxide34 having been reported in the literature. Previous work within our group has found that bismuth titanate (Bi4Ti3O12, BTO) shows promise for this purpose,35 giving both moderate extension of the light absorption into the visible and good charge separation due to offset valence and conduction bands when composited with TiO2.
In this work we describe a method by which TiO2 is robustly coated onto the surface of glass beads using a P25 enriched Ti sol. This process produces a film of P25 particles with a degree of surface roughness derived from the sol, which binds strongly to the glass surface. To this composite, a simple, scalable sequential ionic layer adsorption reaction (SILAR) is applied, giving nanoplates of bismuth oxybromide. After annealing this bismuth oxybromide decomposes, giving very small bismuth containing nanoparticles covering the surface of the P25. The photocatalytic activity of these immobilized bismuth containing TiO2 composites has been thoroughly investigated in the degradation of four classes of compound: herbicides, pesticides, drugs and explosives, and the key reactive species has been identified in each case. Further investigations into the ease of recycling of the photocatalytic bead system has also been carried out, with almost no loss in activity noted against each of the pollutants tested after five recycles. Thus, this work aims to produce both a highly applicable photocatalytic system with good stability and a simple mechanism for re-use, with activity against a variety of different pollutants of interest. In doing so this work provides the framework by which this system may move beyond the laboratory.
Experimental section
Photocatalyst bead preparation
Soda-lime glass beads were added into a solution of potassium bifluoride (10 mg ml−1) and left to etch for 4 days, with occasional agitation. The beads were then rinsed thoroughly with water, then sonicated in water for 15 minutes, followed by rinsing with ethanol and sonication in ethanol for a further 15 minutes. The beads were then recovered by filtration and dried at 100 °C for 30 minutes. Once dry and cool, the beads were then subjected to a treatment with TiCl4 (40 mM) at 70 °C for 30 minutes. The beads were then filtered and washed with water and ethanol before drying in the same manner as before. The etched and treated beads were then annealed at 500 °C for 30 minutes.The suspension used for coating the etched beads was prepared as follows. A Ti(OBu)4 sol was first prepared by adding Ti(OBu)4 (1 ml) to a mixture of n-butanol (20 ml) and HCl (0.23 ml, 37%) slowly under vigorous stirring. To this sol was added P25 TiO2 (0.667 g) and the resulting suspension stirred overnight before use. While not in use this suspension was constantly stirred.
The etched and treated glass beads were then coated with the suspension by immersion of an appropriate amount of the beads in the prepared suspension for 5 minutes. The excess suspension was then drained by initially decanting and then using a syringe to remove the last few drops. The beads were then spread on a glass dish and heated to 150 °C while constantly swirling the dish to ensure an even coating until the beads were dry and not clumped together. The beads were then annealed at 500 °C for 1 hour. This process was repeated three times to build up a larger amount of TiO2 on the bead surface. This was found to deposit around 0.2 mg of photocatalytic material onto the surface of each bead. To simplify some of the analytical methods used to characterise the materials, where a flat surface is required, standard microscope slides were coated with the TiO2 suspension by dip-coating. The slides were wiped clean on one side, and allowed to dry at 150 °C until dry. The coated slides then annealed at 500 °C for 1 hour. This process was repeated three times as before.
Modification with bismuth was carried out using a sequential ionic layer adsorption reaction (SILAR) method according to our previously reported procedure.35 The TiO2 coated glass beads were firstly packed into a standard chromatography column. Two solutions were then prepared, solution A consisting of Bi(NO3)3 in water (1 mM), and solution B consisting of KBr (1 mM) in water. Solution A was added to the column in enough volume such that the beads were fully immersed, and left to stand for 300 seconds. Solution A was then drained and de-ionised water was then added and allowed to stand for 300 seconds. The water was then drained and solution B added and allowed to stand for 300 seconds. After draining, water was finally added and allowed to stand for another 300 seconds. This process is termed as one SILAR cycle, and was repeated 7 times to give a greater loading of bismuth onto the bead surface. To convert the SILAR deposited BiOBr made using this method, the coated glass substrates were then annealed at 600 °C in air, for 1 hour. Modification of the coated microscope glass was achieved in similar fashion. TiO2 coated glass slide substrates were dipped for 300 seconds into a beaker containing solution A, then washed with de-ionised water for 300 seconds, then dipped into solution B for 300 seconds, before finally washing with water for a further 300 seconds. As before, this was repeated 7 times, before finally drying and annealing at 600 °C for 1 hour in air.
Photocatalyst characterisation
X-ray diffraction studies were performed using a Bruker D2 phaser using Cu kα radiation. SEM images were collected using a Carl Zeiss SIGMA HD VP field emission SEM, operated in InLens mode with a 10 kV accelerating voltage. SEM-EDS measurements were made on the same instrument, using an Oxford AZtec ED X-ray analysis set up. TEM images were captured using a JEOL JEM 2011 microscope and a FEI Titan Themis electron microscope. Elemental maps were obtained using a Super-X high sensitivity windowless EDX detector attached to the FEI Titan Themis electron microscope. Analyses accompanied by an error have been calculated based on three separate measurements.Photocatalyst testing
Photocatalytic testing was carried out in a simple glass dish fitted with a plastic cup to hold a stirrer bar. A quantity of photocatalyst coated beads sufficient to form a monolayer (8 g), were added to the dish and a pollutant solution (5 ml) was then added. The pollutants chosen were pentachlorophenol, nonylphenol, tetracycline hydrochloride, paracetamol, trinitrotoluene or nitrotriazolone of 20 ppm concentration. To improve the solubility of pentachlorophenol and nonylphenol, they were dissolved in 50 mM KOH solution. Absorption maxima of these solutions were determined using a Jasco J670 UV-vis spectrophotometer. The photocatalytic beads were stirred in contact with a pollutant solution in the dark until no change in the absorption maximum was noted. A foil cover slip was then placed over the top of the dish and the entire apparatus irradiated with two LED arrays of 5 LEDs (410 nm peak wavelength, 4 W total, Intelligent LED solutions). At certain time points samples were withdrawn and the absorption measured using the same spectrophotometer as before to calculate the degradation. Recycle tests were carried out by rinsing the beads with water and leaving them to dry overnight before addition of fresh pollutant solution and determining the degradation efficiency at the same final time point that was used for the pollutant in question. Scavenging tests were carried out using methanol, tertiary butanol and degassing using N2. Methanol and tertiary butanol were introduced in 50 mM concentration to the pollutant solutions and the photocatalytic degradation tests carried out as before. Degassing with N2 to remove O2 was carried out by bubbling N2 through the pollutant solutions for 30 minutes prior to degradation tests. Error bars were calculated based on three separate measurements.Results & discussion
Photocatalyst bead preparation
Glass beads were chosen as a suitable substrate for photocatalyst immobilization due to their thermal stability, a key factor considering the annealing temperatures common for oxide materials, and for their versatility for filling various irregularly sized containers. The general process of producing the photocatalytic bead system is given in Fig. 1a. Before deposition of P25, roughening of the glass beads via fluoride etching and treating the rough surface with TiCl4 to give a compact TiO2 layer36 was found to improve the adhesion of the latterly applied P25 particles. Coating using a suspension of P25 in a sol of Ti(OBu)4 rather than the typical suspension in water or alcohols37,38 was found to give a well attached coverage of titania on the bead surface, with only relatively severe impacts able to remove the material from the bead surface. Indeed, compared to our previously work using a simple P25 suspension in water, this method was found to be significantly better in terms of robustness of the resulting coating. To this coating, modification using a sequential ionic layer adsorption reaction (SILAR) process to give BiOBr was applied, details of which are given in Fig. 1b. SILAR is ideally suited as a method by which immobilized materials may be modified in a simple and scalable way. In this work SILAR was carried out 7 times to build up a greater amount of BiOBr on the bead surface, before drying and annealing. Due to the heating in the annealing stage, decomposition of the BiOBr takes place as noted by our own previous work,35 and that of Zhang et al.,39 consuming the nearby titania to form bismuth titanate in the process. The resulting material is termed 7xBTO for the remainder of this work. It was noted that this process deposits around 0.2 mg of photocatalytic material onto the surface of each bead. Film thickness however, could not be determined in scanning microscopy (vide infra) due to the curved substrate surface of the bead. | ||
| Fig. 1 A) Production of the photocatalytic beads B) SILAR process. | ||
Photocatalytic material characterisation
X-ray diffraction (XRD) studies on the prepared pristine TiO2 coatings and 7xBTO sample showed little difference between the two materials (Fig. S1†). No new peaks were observed on SILAR processing which could be indexed, although an indistinct bump in the baseline can be observed between ∼25° and ∼35° when the traces were stacked together (Fig. S2†). The peaks which were observed can be indexed clearly to the anatase and rutile peaks expected in P25 (JCPDS card numbers: 21-1272 & 76-1940). The lack of peaks corresponding to BTO could be due particle sizes resulting in amorphous characteristics. Often in samples prepared by SILAR the crystal domain sizes can be small initially40 where the material has had little chance to grow into a crystal large enough to be observed in the XRD.Further investigations into the particle size were conducted by scanning electron microscopy. Prior to thermal decomposition of the BiOBr precursor, large nanoplates of BiOBr could be observed covering the whole surface of the film (Fig. S3†), a typical morphology with which bismuth oxyhalides have been found to form.41,42 After annealing however these nanoplates disappear, indicating decomposition of the BiOBr. Both pristine (Fig. 2a) and 7xBTO modified materials (Fig. 2b) display a porous network of interconnected particles. A particle size increase was noted upon modification of the TiO2 surface, likely due to the higher temperatures used to decompose the BiOBr precursor. Energy dispersive X-ray spectroscopy (EDX) analysis of the material revealed the presence of ∼5 atomic% Bi present in the material (Fig. 3A). No loss of bismuth was apparent before and after annealing however no peaks were observed for Br after annealing, indicating the complete decomposition of the BiOBr precursor in forming BTO. The levels of Bi and Br in the original BiOBr material were found to not be 1![[thin space (1/6-em)]](https://www.rsc.org/images/entities/char_2009.gif) :1, as would be expected for pure BiOBr. However, many different stoichiometries of BiOBr exist, such as Bi24O31Br10, Bi4O5Br2, Bi3O4Br and Bi5O7Br,43,44 which have different Bi:Br ratios. It may also be possible to form a mixture of BiOBr materials in a single sample, which could be the origin of the non-stoichiometry observed in the EDX analysis. Transmission electron microscope (TEM) images revealed the effect of a sol based P25 coating suspension versus coating from a water based P25 suspension. Covering the surface of the particles in the pristine TiO2 sample were very small clusters, giving the particles a certain amount of surface roughness (Fig. 3B). These clusters were not observed in the absence of the Ti(OBu)4 sol (Fig. S4†) and can be concluded to arise from decomposition of the sol under raised temperatures. After SILAR processing and annealing, these particles were found to have grown to particles around 5 nm (Fig. 3C), which could again be due to the increased annealing temperature used to decompose the BiOBr precursor, or growth of the BTO material on these high surface energy particles. The particles grown in this way were observed to be highly dependent on the beam conditions, aggregating when the TEM beam was kept in place for extended periods of time. TEM high angle annular dark field (HAADF) and the corresponding elemental mapping revealed the distribution of Bi on the titania particle surface (Fig. 3D–F). While some Bi was found across much of the particles, higher concentrations were observed in areas coinciding with the small particles, suggesting that the growth of these particles is in part driven by growth of BTO on these secondary particles.
:1, as would be expected for pure BiOBr. However, many different stoichiometries of BiOBr exist, such as Bi24O31Br10, Bi4O5Br2, Bi3O4Br and Bi5O7Br,43,44 which have different Bi:Br ratios. It may also be possible to form a mixture of BiOBr materials in a single sample, which could be the origin of the non-stoichiometry observed in the EDX analysis. Transmission electron microscope (TEM) images revealed the effect of a sol based P25 coating suspension versus coating from a water based P25 suspension. Covering the surface of the particles in the pristine TiO2 sample were very small clusters, giving the particles a certain amount of surface roughness (Fig. 3B). These clusters were not observed in the absence of the Ti(OBu)4 sol (Fig. S4†) and can be concluded to arise from decomposition of the sol under raised temperatures. After SILAR processing and annealing, these particles were found to have grown to particles around 5 nm (Fig. 3C), which could again be due to the increased annealing temperature used to decompose the BiOBr precursor, or growth of the BTO material on these high surface energy particles. The particles grown in this way were observed to be highly dependent on the beam conditions, aggregating when the TEM beam was kept in place for extended periods of time. TEM high angle annular dark field (HAADF) and the corresponding elemental mapping revealed the distribution of Bi on the titania particle surface (Fig. 3D–F). While some Bi was found across much of the particles, higher concentrations were observed in areas coinciding with the small particles, suggesting that the growth of these particles is in part driven by growth of BTO on these secondary particles.
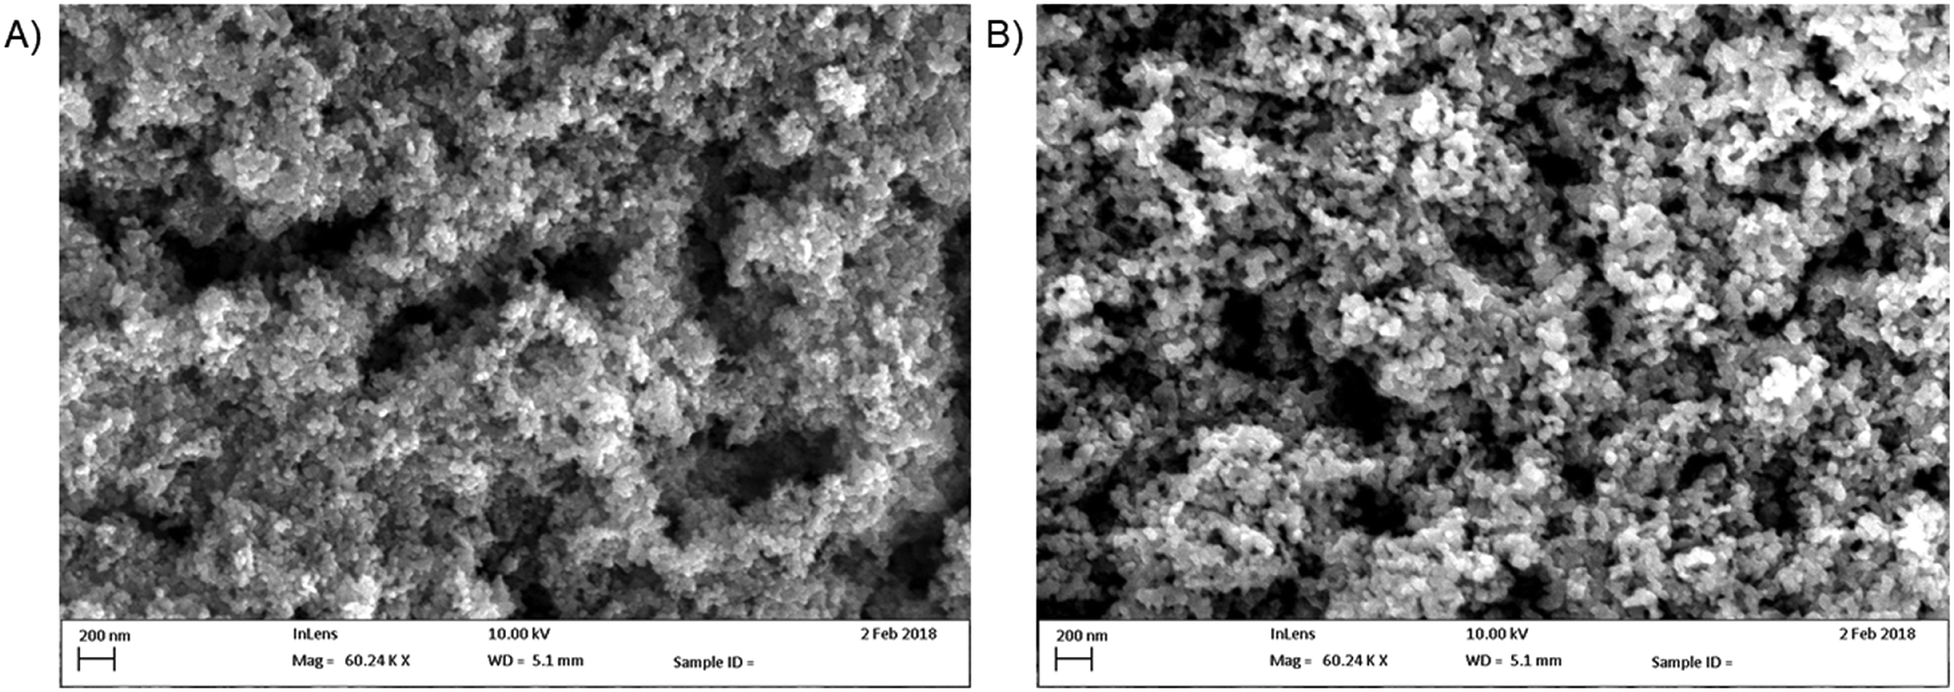 | ||
| Fig. 2 SEM images of the A) pristine TiO2 photocatalyst surface and B) the 7xBTO photocatalyst surface. | ||
 | ||
| Fig. 3 A) SEM energy dispersive X-ray spectroscopy analysis, TEM images of B) the pristine TiO2 sample and C) the 7xBTO material, D) HAADF image of the 7xBTO material with corresponding elemental maps for E) Bi and F) Ti. | ||
Photocatalytic test pollutant choice
Model pollutants used in testing were chosen based on key examples from important molecule classes, such as pesticides, drugs and explosives. Pentachlorophenol, nonylphenol, trinitrotoluene, nitrotriazolone, paracetamol and tetracycline were chosen in this work, giving a diverse sample of targets with different structural features to test against. The structures of the pollutants are given in Fig. 4. Pentachlorophenol (PCP) was used as a model pesticide pollutant, having been noted as a having renal, carcinogenic and neurological effects,45 its removal has been designated a priority by the European Union Water Framework Directive (EUWFD).46 Nonylphenol (NP) is another phenolic pollutant priority substance of the EUWFD used in this study, being an endocrine disruptor47 commonly used in the manufacture of consumer products such as nonylphenol ethoxylates, which are typically used in surfactants.48 Leeching of explosives into drinking water sources from the mining industry and military operations has been noted to cause significant contamination of drinking water sources.49,50 Typically containing nitro groups, these molecules are resistant to standard oxidation processes due to the electron withdrawing nature of these substituents.51 As such, two widely used explosives, trinitrotoluene (TNT) and nitrotriazolone (NTO), were chosen for study, with TNT being a known poison with hematological effects52 and NTO exposure being suggested to cause reductions in sperm production in mammalian model studies.53 The presence of pharmaceutical molecules in drinking water has been noted as an area of increasing concern in recent years.54 The popular analgesic drug paracetamol (PC) has been found at relatively high concentrations of 6 ppb in treated water samples,55 and while its toxicity is not high, low continuous doses have been suggested to be a target for removal as a precautionary measure.56 Tetracycline (TC) is a common anti-biotic compound often studied in photocatalytic degradation tests,57 removal of low levels of which from water is key in avoiding the spread of anti-biotic resistant bacteria.58 | ||
| Fig. 4 Structures of the model pollutants studied. | ||
Photocatalytic test set up
In testing of the photocatalyst coated beads, a simple dish batch reactor fitted with a stirrer bar on a raised platform to avoid direct contact with the beads was used, irradiated with a 410 nm LED array from below. Photographs of the reactor and a setup schematic may be found in the ESI† (Fig. S5).Photocatalytic testing
Photocatalytic degradation reactions are known to follow pseudo first order kinetics,59 and therefore the rate constant can be given by the following equation:where C is the concentration of a pollutant at a certain time point, C0 is the initial pollutant concentration, k is the rate constant and t is time. Accordingly, the rate constant can be determined from the slope of a plot of −ln(C/C0) against time. Prior to irradiation, each bead set up was allowed to stir in the dark to measure any dark adsorption (Fig. S6†). Minimal adsorption was observed for all of the pollutants other than TC, which showed strong adsorption over 30 minutes. Such adsorption has been previously reported and shown to be beneficial in the overall degradation process.60

Upon irradiation, each species was observed to degrade at somewhat different rates, with different improvements over the TiO2 and photolysis controls. In every case however, the BTO-modified photocatalyst performed substantially better than unmodified TiO2. First order rate constants for the 7xBTO samples and controls are given in Fig. 5, with rate plots given in the ESI† (Fig. S7–S12). Highest activity was noted for the degradation of TC, achieving ∼94% removal in 4 minutes of irradiation, a first order rate constant of 0.67 min−1, note should be taken of the scaling necessary in Fig. 5 to bring the bar into a similar range to the others due to this high efficiency. It is possible that some sensitization of the semiconductor was occurring due to this surface adsorption of TC, as the LED used has some overlap with the absorption spectra of TC. During the test it is possible that this increased activity, and relatively high activity on plain TiO2, is in part due to excitation and subsequent electron or hole transfer from TC to the semiconductor photocatalyst. This process is often noted for dye molecules used in photocatalytic testing, and is known as dye-sensitisation or self-sensitisation.61,62 While this can be advantageous as it typically increases photocatalytic rates, care should be taken when suggesting photocatalytic activity based on such a test alone. Indeed, it has been noted that some reported materials have little to no activity in the absence of this effect,63 and much of the literature should be treated with caution. Aside from TC, the other molecules studied showed varying degrees of activity, with rate constants ranging from 0.017 min−1 for PCP to 0.10 min−1 for NTO. Interestingly, there seemed little link between structural features and degradation rate. PCP, PC and NP may be grouped together as phenolic pollutants; however, it can be noted that PCP degrades much slower than PC and NP. A likely caused for this could be the highly electron deficient nature of the aromatic ring system due to the presence of five chlorine substituents. Often for phenolic pollutants a key step is the hole driven oxidation of the phenol ring, followed by hydroxylation of the resulting radical.64 Previous studies on pentachlorophenol have suggested that the presence of multiple electron withdrawing groups will make such molecules resistant to oxidation in this way.65 Aside from the phenolic type pollutants, TNT and NTO can be grouped as nitro group containing compounds. While greater in similarity in terms of their degradation rate than the phenolic pollutants, it was noted that NTO was destroyed somewhat quicker than TNT. This difference can be ascribed once again to the effects of self-sensitisation of NTO on the photocatalyst surface. NTO has an absorption tail into the emission wavelength region of the LED light source and hence a similar sensitization mechanism as described for TC can be assumed. This study highlights the significant differences in photocatalytic degradation rates that can be demonstrated even when studying relatively similar molecules, suggesting that there may be many previously reported photocatalyst materials which may behave very differently against targets other than those for which they have been reported. While some thorough studies covering large groups of similar compounds exist,66,67 it is much more common to test on a single model pollutant, and as such there are many studies to date which may not completely reflect potential of the material in question. While there is clearly a place for short studies using a single pollutant to demonstrate interesting activity, if claims are to be made about the promise or otherwise of a material, demonstration of activity against a broader pollutant scope is key. A commonly applied method for the identification of the key reactive species involved in a photocatalytic degradation experiment is to scavenge for these reactive species.16 Introduction of a large excess of certain molecules soaks up reactive species generated photocatalytically, effectively removing them from the reaction. In this work, methanol, tertiary butanol, and degassing with N2 have been applied to scavenge for holes,68 hydroxyl radicals,69 and O2 as an electron acceptor70 respectively. Quantification of the degradation was achieved according to degradation efficiency (DE) achieved by the photocatalyst upon the spiked pollutant solutions, using the equation below:
 | ||
| Fig. 5 First order rate constants for photolysis, TiO2 photocatalysis and 7xBTO photocatalyst beads against the chosen pollutants. | ||
 | ||
| Fig. 6 A) Scavenger tests of 7xBTO against the chosen pollutants, B) recycling test of 7xBTO against the chosen pollutants. | ||
Photocatalytic recyclability
In terms of usability of photocatalyst systems, the recyclability is key in producing a working solution for water treatment. Recycling tests were carried out by introducing fresh pollutant solution and testing in the same way as before and quantified according to their DE, the results of which are given in Fig. 6B. No losses in activity were noted for the photocatalyst against all pollutants other than nonyl-phenol, where the DE decreased from ∼56% to around 35% at its lowest. Losses such as this can be due to incomplete destruction of the pollutant, leaving degradation products on the semiconductor surface and hindering the degradation of fresh pollutant. Interestingly, there appeared to be a small increase in activity for NTO after recycling, going from ∼93% to ∼99% DE. This could be due to the same self-sensitisation effect noted earlier, where some of the NTO molecules are retained from the previous run and are able to sensitise the 7xBTO material to the LED light source, increasing the DE.The good recyclability demonstrated in this work is a key feature of the photocatalyst bead system, where the photocatalytic material is both stable under irradiation and adhered well enough to the substrate to be repeatedly immersed in water samples with no loss of activity. Coupling such recyclability with the immobilization of the photocatalyst material indicates the potential of a system such as this for real world application.
Conclusions
The removal of contaminants from water sources by photocatalysis is a method with potential for application beyond the laboratory. Sequential ionic layer adsorption reaction (SILAR) processing of TiO2 immobilised on glass beads has been demonstrated as a method by which a simple, re-usable photocatalyst system can be generated. This system has been applied against a variety of different pollutants including drugs, pesticides, industrial intermediates and explosives using an inexpensive 410 nm LED light source. An investigation into the mechanism of photocatalytic degradation of the prepared photocatalyst beads against each target molecule is presented, concluding that even when comparing pollutants with similar structural features distinct differences in mechanism can be noted. The application of such a system in the real world relies upon the ability to simply re-use the photocatalyst system, which has been investigated through recyclability tests. Each pollutant tested in this study showed little to no loss of photocatalyst activity after five recycles, indicating the good stability of the material, and the strong adhesion to the glass bead substrate. This work demonstrates the viability of our immobilized and enhanced TiO2-based system to a wide range of pollutants, however also draws attention to the major differences in photocatalytic rates which can be demonstrated against different target molecules.Conflicts of interest
There are no conflicts of interest to declare.Acknowledgements
The authors would like to thank the CRITICAT Centre for Doctoral Training (Ph.D. studentship to O. G.; Grant Code: EP/L016419/1). TEM studies were achieved with the support of the EPSRC Capital for Great Technologies Grant (EP/L017008/1). Open data: http://dx.doi.org/10.7488/ds/2452References
- M. A. Shannon, P. W. Bohn, M. Elimelech, J. G. Georgiadis, B. J. Mariñas and A. M. Mayes, Nature, 2008, 452, 301–310 CrossRef CAS PubMed.
- WHO, Progress on Drinking Water, Sanitation and Hygiene, 2017 Search PubMed.
- The United Nations, Water Scarcity, 2013 Search PubMed.
- UNESCO, The 4th edition of the UN World Water Development Report (WWDR4), 2012 Search PubMed.
- The United Nations, Water for a sustainable world, 2015 Search PubMed.
- I. C. Yadav, N. L. Devi, J. H. Syed, Z. Cheng, J. Li, G. Zhang and K. C. Jones, Sci. Total Environ., 2015, 511, 123–137 CrossRef CAS PubMed.
- M. A. Rodrigo, N. Oturan and M. A. Oturan, Chem. Rev., 2014, 114, 8720–8745 CrossRef CAS PubMed.
- D. Kanakaraju, B. D. Glass and M. Oelgemöller, J. Environ. Manage., 2018, 219, 189–207 CrossRef CAS PubMed.
- Y. Yang, Y. S. Ok, K. H. Kim, E. E. Kwon and Y. F. Tsang, Sci. Total Environ., 2017, 596–597, 303–320 CrossRef CAS PubMed.
- J. Altmann, F. Zietzschmann, E.-L. Geiling, A. S. Ruhl, A. Sperlich and M. Jekel, Chemosphere, 2015, 125, 198–204 CrossRef CAS PubMed.
- Z. Hasan and S. H. Jhung, J. Hazard. Mater., 2015, 283, 329–339 CrossRef CAS PubMed.
- X. C. Hu, D. Q. Andrews, A. B. Lindstrom, T. A. Bruton, L. A. Schaider, P. Grandjean, R. Lohmann, C. C. Carignan, A. Blum, S. A. Balan, C. P. Higgins and E. M. Sunderland, Environ. Sci. Technol. Lett., 2016, 3, 344–350 CrossRef CAS PubMed.
- H. Park, Y. Park, W. Kim and W. Choi, J. Photochem. Photobiol., C, 2013, 15, 1–20 CrossRef CAS.
- T. Ochiai and A. Fujishima, J. Photochem. Photobiol., C, 2012, 13, 247–262 CrossRef CAS.
- I. Mohmood, C. B. Lopes, I. Lopes, I. Ahmad, A. C. Duarte and E. Pereira, Environ. Sci. Pollut. Res., 2013, 20, 1239–1260 CrossRef CAS PubMed.
- Y. Nosaka and A. Y. Nosaka, Chem. Rev., 2017, 117, 11302–11336 CrossRef CAS PubMed.
- M. R. Hoffmann, S. T. Martin, W. Choi and D. W. Bahnemann, Chem. Rev., 1995, 95, 69–96 CrossRef CAS.
- X. Li, H. Lin, X. Chen, H. Niu, J. Liu, T. Zhang and F. Qu, Phys. Chem. Chem. Phys., 2016, 18, 9176–9185 RSC.
- C. Ratanatawanate, A. Bui, K. Vu and K. J. Balkus, J. Phys. Chem. C, 2011, 115, 6175–6180 CrossRef CAS.
- H. Li, L. Zhou, L. Wang, Y. Liu, J. Lei and J. Zhang, Phys. Chem. Chem. Phys., 2015, 17, 17406–17412 RSC.
- S. Ma, S. Zhan, Y. Jia and Q. Zhou, ACS Appl. Mater. Interfaces, 2015, 7, 21875–21883 CrossRef CAS PubMed.
- Z.-J. Li, Z.-W. Huang, W.-L. Guo, L. Wang, L.-R. Zheng, Z.-F. Chai and W.-Q. Shi, Environ. Sci. Technol., 2017, 51, 5666–5674 CrossRef CAS PubMed.
- E. Rahmanian, R. Malekfar and M. Pumera, Chem. – Eur. J., 2018, 24, 18–31 CrossRef CAS PubMed.
- J. Low, J. Yu, M. Jaroniec, S. Wageh and A. A. Al-Ghamdi, Adv. Mater., 2017, 29, 1601694 CrossRef PubMed.
- Y. Wang, Q. Wang, X. Zhan, F. Wang, M. Safdar and J. He, Nanoscale, 2013, 5, 8326–8339 RSC.
- M. Wang, Y. Hu, J. Han, R. Guo, H. Xiong and Y. Yin, J. Mater. Chem. A, 2015, 3, 20727–20735 RSC.
- G. Chen, S. Ji, Y. Sang, S. Chang, Y. Wang, P. Hao, J. Claverie, H. Liu and G. Yu, Nanoscale, 2015, 7, 3117–3125 RSC.
- S. J. A. Moniz and J. Tang, ChemCatChem, 2015, 7, 1659–1667 CrossRef CAS.
- H. Li, H. Yu, X. Quan, S. Chen and H. Zhao, Adv. Funct. Mater., 2015, 25, 3074–3080 CrossRef CAS.
- M. Zalfani, B. van der Schueren, Z.-Y. Hu, J. C. Rooke, R. Bourguiga, M. Wu, Y. Li, G. Van Tendeloo and B.-L. Su, J. Mater. Chem. A, 2015, 3, 21244–21256 RSC.
- S. Murcia López, M. C. Hidalgo, J. A. Navío and G. Colón, J. Hazard. Mater., 2011, 185, 1425–1434 CrossRef PubMed.
- J. Xu, W. Wang, S. Sun and L. Wang, Appl. Catal., B, 2012, 111–112, 126–132 CrossRef CAS.
- J. Cai, J. Huang and Y. Lai, J. Mater. Chem. A, 2017, 5, 16412–16421 RSC.
- M. Ge, C. Cao, S. Li, S. Zhang, S. Deng, J. Huang, Q. Li, K. Zhang, S. S. Al-Deyab and Y. Lai, Nanoscale, 2015, 7, 11552–11560 RSC.
- G. Odling, E. Chatzisymeon and N. Robertson, Catal. Sci. Technol., 2018, 8, 829–839 RSC.
- H. Choi, C. Nahm, J. Kim, J. Moon, S. Nam, D.-R. Jung and B. Park, Curr. Appl. Phys., 2012, 12, 737–741 CrossRef.
- E. Portjanskaja, M. Krichevskaya, S. Preis and J. Kallas, Environ. Chem. Lett., 2004, 2, 123–127 CrossRef CAS.
- C.-S. Chiou, J.-L. Shie, C.-Y. Chang, C.-C. Liu and C.-T. Chang, J. Hazard. Mater., 2006, 137, 1123–1129 CrossRef CAS PubMed.
- J. Zhang, L. Huang, P. Liu, Y. Wang, X. Jiang, E. Zhang, H. Wang, Z. Kong, J. Xi and Z. Ji, J. Alloys Compd., 2016, 654, 71–78 CrossRef CAS.
- T. P. Niesen and M. R. De Guire, in Solid State Ionics, 2002, vol. 151, pp. 61–68 Search PubMed.
- S. Luo, J. Chen, Z. Huang, C. Liu and M. Fang, ChemCatChem, 2016, 8, 3780–3789 CrossRef CAS.
- Y. Mei, Y. Su, Z. Li, S. Bai, M. Yuan, L. Li, Z. Yan, J. Wu and L.-W. Zhu, Dalton Trans., 2017, 46, 347–354 RSC.
- Y.-R. Jiang, S.-Y. Chou, J.-L. Chang, S.-T. Huang, H.-P. Lin and C.-C. Chen, RSC Adv., 2015, 5, 30851–30860 RSC.
- J. Shang, W. Hao, X. Lv, T. Wang, X. Wang, Y. Du, S. Dou, T. Xie, D. Wang and J. Wang, ACS Catal., 2014, 4, 954–961 CrossRef CAS.
- Toxicological Profile for pentachlorophenol (Update), Agency for Toxic Substances and Disease Registry (ATSDR), Public Health Service, U.S. Department of Health and Human Services , Atlanta, GA, 1999 Search PubMed.
- Priority Substances and Certain Other Pollutants according to Annex II of Directive 2008/105/EC, European Commission Water Framework Directive, 2016 Search PubMed.
- A. Soares, B. Guieysse, B. Jefferson, E. Cartmell and J. N. Lester, Environ. Int., 2008, 34, 1033–1049 CrossRef CAS PubMed.
- Nonylphenol (NP) and Nonylphenol Ethoxylates (NPEs) Action Plan [RIN 2070-ZA09], United States Environmental Protection Agency, 2010 Search PubMed.
- D. T. F. Kuo, M. Simini and H. E. Allen, Sci. Total Environ., 2017, 599–600, 2135–2141 CrossRef CAS PubMed.
- H. A. Yu, J. Lee, S. W. Lewis and D. S. Silvester, Anal. Chem., 2017, 89, 4729–4736 CrossRef CAS PubMed.
- R. Podlipná, B. Pospíšilová and T. Vaněk, Ecotoxicol. Environ. Saf., 2015, 112, 54–59 CrossRef PubMed.
- Public Health Statement, 2,4,6-Trinitrotoluene, Agency for Toxic Substances and Disease Registry (ATSDR), Public Health Service, U.S. Department of Health and Human Services, 1995 Search PubMed.
- M. S. Johnson, W. S. Eck and E. M. Lent, Propellants, Explos., Pyrotech., 2017, 42, 9–16 CrossRef.
- J. Rivera-Utrilla, M. Sánchez-Polo, M. Á. Ferro-García, G. Prados-Joya and R. Ocampo-Pérez, Chemosphere, 2013, 93, 1268–1287 CrossRef CAS PubMed.
- T. A. Ternes, Water Res., 1998, 32, 3245–3260 CrossRef CAS.
- R. Andreozzi, V. Caprio, R. Marotta and D. Vogna, Water Res., 2003, 37, 993–1004 CrossRef CAS PubMed.
- F. Chen, Q. Yang, J. Sun, F. Yao, S. Wang, Y. Wang, X. Wang, X. Li, C. Niu, D. Wang and G. Zeng, ACS Appl. Mater. Interfaces, 2016, 8, 32887–32900 CrossRef CAS PubMed.
- C. Reyes, J. Fernández, J. Freer, M. A. Mondaca, C. Zaror, S. Malato and H. D. Mansilla, J. Photochem. Photobiol., A, 2006, 184, 141–146 CrossRef CAS.
- A. Mills, J. Wang and D. F. Ollis, J. Phys. Chem. B, 2006, 110, 14386–14390 CrossRef CAS PubMed.
- L. Zhao, J. Deng, P. Sun, J. Liu, Y. Ji, N. Nakada, Z. Qiao, H. Tanaka and Y. Yang, Sci. Total Environ., 2018, 627, 1253–1263 CrossRef CAS.
- G. Odling and N. Robertson, ChemPhysChem, 2016, 17, 2872–2880 CrossRef CAS PubMed.
- L. Zhang, C. G. Niu, G. X. Xie, X. J. Wen, X. G. Zhang and G. M. Zeng, ACS Sustainable Chem. Eng., 2017, 5, 4619–4629 CrossRef CAS.
- S. P. Sahu, S. L. Cates, H.-I. Kim, J.-H. Kim and E. L. Cates, Environ. Sci. Technol., 2018, 52, 2973–2980 CrossRef CAS PubMed.
- G. Mills and M. R. Hoffmann, Environ. Sci. Technol., 1993, 27, 1681–1689 CrossRef CAS.
- A. P. Davis and C. P. Huang, Water Res., 1990, 24, 543–550 CrossRef CAS.
- Y. He, N. B. Sutton, H. H. H. Rijnaarts and A. A. M. Langenhoff, Appl. Catal., B, 2016, 182, 132–141 CrossRef CAS.
- M. Cruz, C. Gomez, C. J. Duran-Valle, L. M. Pastrana-Martínez, J. L. Faria, A. M. T. Silva, M. Faraldos and A. Bahamonde, Appl. Surf. Sci., 2017, 416, 1013–1021 CrossRef CAS.
- M. Shen and M. A. Henderson, J. Phys. Chem. Lett., 2011, 2, 2707–2710 CrossRef CAS.
- J. Kim, C. W. Lee and W. Choi, Environ. Sci. Technol., 2010, 44, 6849–6854 CrossRef CAS PubMed.
- Y. Jin, D. Jiang, D. Li and M. Chen, Catal. Sci. Technol., 2017, 7, 2308–2317 RSC.
- K. Inumaru, M. Murashima, T. Kasahara and S. Yamanaka, Appl. Catal., B, 2004, 52, 275–280 CrossRef CAS.
- J. Mack and J. R. Bolton, J. Photochem. Photobiol., A, 1999, 128, 1–13 CrossRef CAS.
- G. K. C. Low, S. R. McEvoy and R. W. Matthews, Environ. Sci. Technol., 1991, 25, 460–467 CrossRef CAS.
- J. Farner Budarz, A. Turolla, A. F. Piasecki, J.-Y. Bottero, M. Antonelli and M. R. Wiesner, Langmuir, 2017, 33, 2770–2779 CrossRef CAS PubMed.
Footnote |
| † Electronic supplementary information (ESI) available. See DOI: 10.1039/c8ew00568k |
| This journal is © The Royal Society of Chemistry 2018 |