
 Open Access Article
 This Open Access Article is licensed under a
 Creative Commons Attribution 3.0 Unported Licence
Metaldehyde removal from drinking water by adsorption onto filtration media: mechanisms and optimisation†‡
C. A.
Rolph
 ab,
B.
Jefferson
a,
F.
Hassard
a and
R.
Villa
*a
ab,
B.
Jefferson
a,
F.
Hassard
a and
R.
Villa
*a
aCranfield University, Cranfield, Bedfordshire, MK43 0AL, UK. E-mail: r.villa@cranfield.ac.uk
bOpen University, Milton Keynes, MK7 6AA, UK
First published on 10th August 2018
Abstract
Trace micropollutants should be removed during drinking water production without increasing the disinfection-by-product formation potential or energy demand of the treatment process. We demonstrate the efficacy of different filtration media to remove metaldehyde through controlled batch experiments on water augmented with metaldehyde. Equilibrium concentrations of metaldehyde and surrogate organics were successfully described by the Freundlich isotherm. Metaldehyde can be attenuated to varying degrees with activated carbon and sand with an active and inactive biofilm with kf values ranging from 0.006–0.3 (mg g−1)(L mg−1)1/n. The presence of the active biofilm improved metaldehyde adsorption by sand media, due to additional biosorption mechanisms, a greater surface area or biodegradation. Baseline levels of competing natural organic matter surrogates (NOM) reduced overall adsorption efficacy but increasing concentrations of NOM did not impact metaldehyde removal efficacy in a significant way. Biological activated carbon was identified as the most suitable adsorbent of metaldehyde (94% removal) but sand with an acclimated biofilm was capable of acting as a bio-adsorbent of metaldehyde even under environmentally relevant concentrations (41% adsorption from 0.002.5 mg L−1). Moreover, we observed that thermal hydrolysis of metaldehyde occurred at 60 °C, suggesting that thermal regeneration of GAC for this pesticide was possible at relatively low temperatures. Biological adsorption and thermal hydrolysis approaches presented herein offered a way forward to increase efficiency and cost effectiveness of existing treatments for metaldehyde.
Water impactOur study is topical, as it provides insights into adsorption of metaldehyde onto different sorbents. Bio-active carbon had the greatest metaldehyde removal through biosorption to biofilms which along with thermal hydrolysis represent strategies for improving the performance and resilience of filtration media to polar pesticides. |
Introduction
In Europe, water treatment works (WTW) are required to meet the European Union drinking water standard of 0.1 μg L−1 for individual pesticides. This includes the molluscicide, metaldehyde, which is an uncharged, low Mw, highly soluble compound. Such characteristics make it difficult to remove in traditional drinking water treatment processes as evidenced by the fact that it is responsible for most pesticide related drinking water failures in the UK.1 Effective technologies for metaldehyde removal include adsorption/regeneration by granular activated carbon (GAC) and advanced oxidation processes (AOPs), which may be limited by high energy requirements, the concentration and type of background organic matter and high regeneration costs.2,3 Although new methods require low-energy and low-chemical input, GACs are helping to overcome these issues.4,5 The high regeneration cost of GAC is principally due to rapid bed exhaustion, estimated at 44 days when treating real waters containing metaldehyde.6 The simple structure of metaldehyde prevents the formation of strong interactions with an adsorbent, limiting the overall adsorption levels.2 A combination of adsorption and biosorption could be considered as an alternative technique as extra metaldehyde sorption to a biological material would result in a reduced need for media regeneration and possibly improve the overall metaldehyde adsorption capacity.7,8 The impact of background interferences, on the metaldehyde adsorption, remains poorly quantified, in particular, the role of organic and inorganic compounds which are typically present in source waters. This is important as these compounds compete for adsorption sites in adsorptive media.Slow sand filters (SSFs) could provide an effective treatment for metaldehyde by promoting coupled adsorption and biosorption.8 The adsorption efficiency of SSFs or microbial biofilms has been reported for some micropollutants.9–11 Inactive biofilms were found to be less effective for the removal of odorous compounds such as geosmin or pharmaceuticals,12 although the mechanisms for biological metaldehyde degradation in water remain unknown, biocoenosis has been demonstrated in aquatic sediments13 and soils14 suggesting that biodegradation occurs in natural systems, and therefore possible in engineered bio-physical processes. Metaldehyde degradation is exothermic, producing 3370 kJ mol−1 during thermal combustion, suggesting that it could be a useful carbon source for microbial growth.14
Here, we report metaldehyde adsorption isotherms for biological activated carbon (BAC) and slow sand filter media and its individual components (active, inactive and clean sand) from a process perspective, to understand the role of biosorption/biodegradation on the removal of metaldehyde from water in treatment works. Batch tests were also used to confirm the role of the biofilm in the adsorption of metaldehyde. Furthermore, the impact of natural organic matter (NOM) adsorption efficacy was evaluated using surrogate NOM compounds (serine, leucine and resorcinol) due to their hydrophilic/hydrophobic nature. The potential for low temperature regeneration of GAC was evaluated by looking at the degradation of metaldehyde and NOM surrogates in ultrapure water at low temperatures (20–85 °C).
Materials and methods
Chemicals
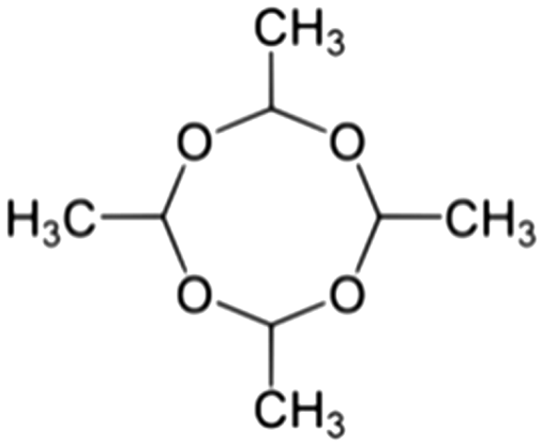
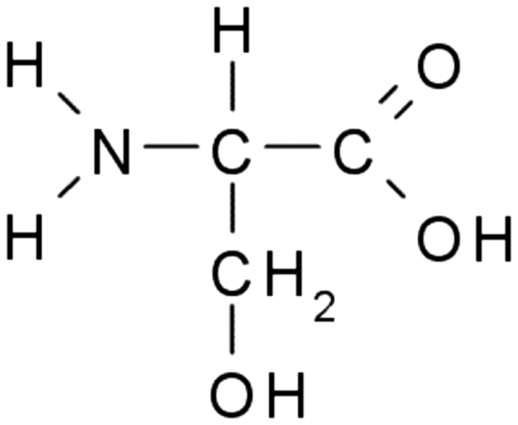
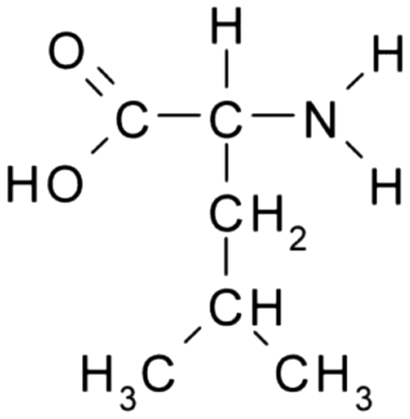
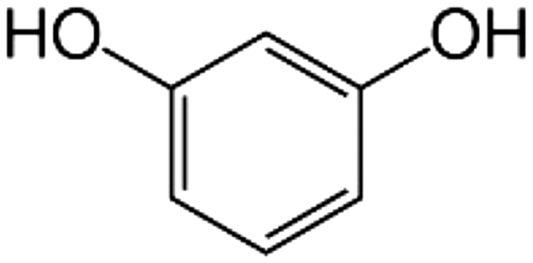
Solutions of metaldehyde (99%), L-serine (99%) and L-leucine (99%) (Acros Organics, USA) and resorcinol (99%) (Sigma Aldrich, UK) were prepared in ultrapure water (PureLab Option s7/15, 18.2 MΩ cm and TOC < 3 ppb). HPLC grade dichloromethane, methanol and acetone were purchased from Rathburn Chemicals, UK. Serine and leucine were selected to represent hydrophilic compounds which are poorly treated by coagulation and resorcinol was selected as a component of the hydrophobic bleed post-coagulation. Surrogate competitive compounds were selected based on their octanol water coefficient after Autin et al.3 (Table 1). Stock solutions of metaldehyde (10 mg L−1), serine, leucine and resorcinol (1 g L−1) were prepared in ultrapure water. For metaldehyde, 10 mg of powder was added to 1 L of water and stirred on a heating plate until dissolved (approx. 30 °C), and other compounds (resorcinol, serine and leucine) are readily dissolved in ultrapure water. These solutions were then diluted using serial dilutions as required prior to spiking.| Organic compound | Metaldehyde | Serine | Leucine | Resorcinol |
|---|---|---|---|---|
| Structure |
|
|
|
|
| Molecular weight (g mol−1) | 176 | 105 | 131 | 110 |
log![[thin space (1/6-em)]](https://www.rsc.org/images/entities/char_2009.gif) Kow Kow |
0.12 | −3.07 | −1.52 | 0.80 |
| K oc | 240 | Low mobility | Low mobility | 65 |
| Moderate mobility | High mobility | |||
| Solubility at 20 °C (mg L−1) | 188 | 5 × 10⁴ | 2.4 × 10⁴ | 106 |
| Henry's law constant (Pa m3 mol−1) | 3.5 × 10⁵ | 1.02 × 10⁻⁹ | 6.3 × 10⁻⁹ | 9.9 × 10⁻¹¹ |
| Volatile | Non-volatile | Non-volatile | Non-volatile |
Adsorbents
The SSF media was collected from an operational water treatment works (WTW) in the Anglian Water region, UK (maximum capacity 10 MLD−1). Sand with a biofilm (visual observation) was collected from the top 5 cm using a seeding tool from an operational SSF henceforth ‘active sand’. Sand which had been cleaned using the onsite mechanical cleaning system was also collected from the same site henceforth ‘clean sand’. Biological activated carbon was collected from a different WTW (average capacity 210 MLD−1) from a rapid gravity filter where the BAC was the primary method for pesticide treatment. The media was placed in sterile plastic containers and stored at 4 °C.A subsample of the active sand was incubated overnight at 105 °C to obtain an inactivated biofilm henceforth, ‘inactive sand’.15 Then, subsamples of the three types of sand (active, inactive and clean) were sieved to 2 mm to remove large particles. Subsamples of the media were examined using an environmental scanning electron microscope ESEM TMP (XL30, FEI/Phillips, UK) to confirm the presence or absence of a biofilm (Fig. 1).
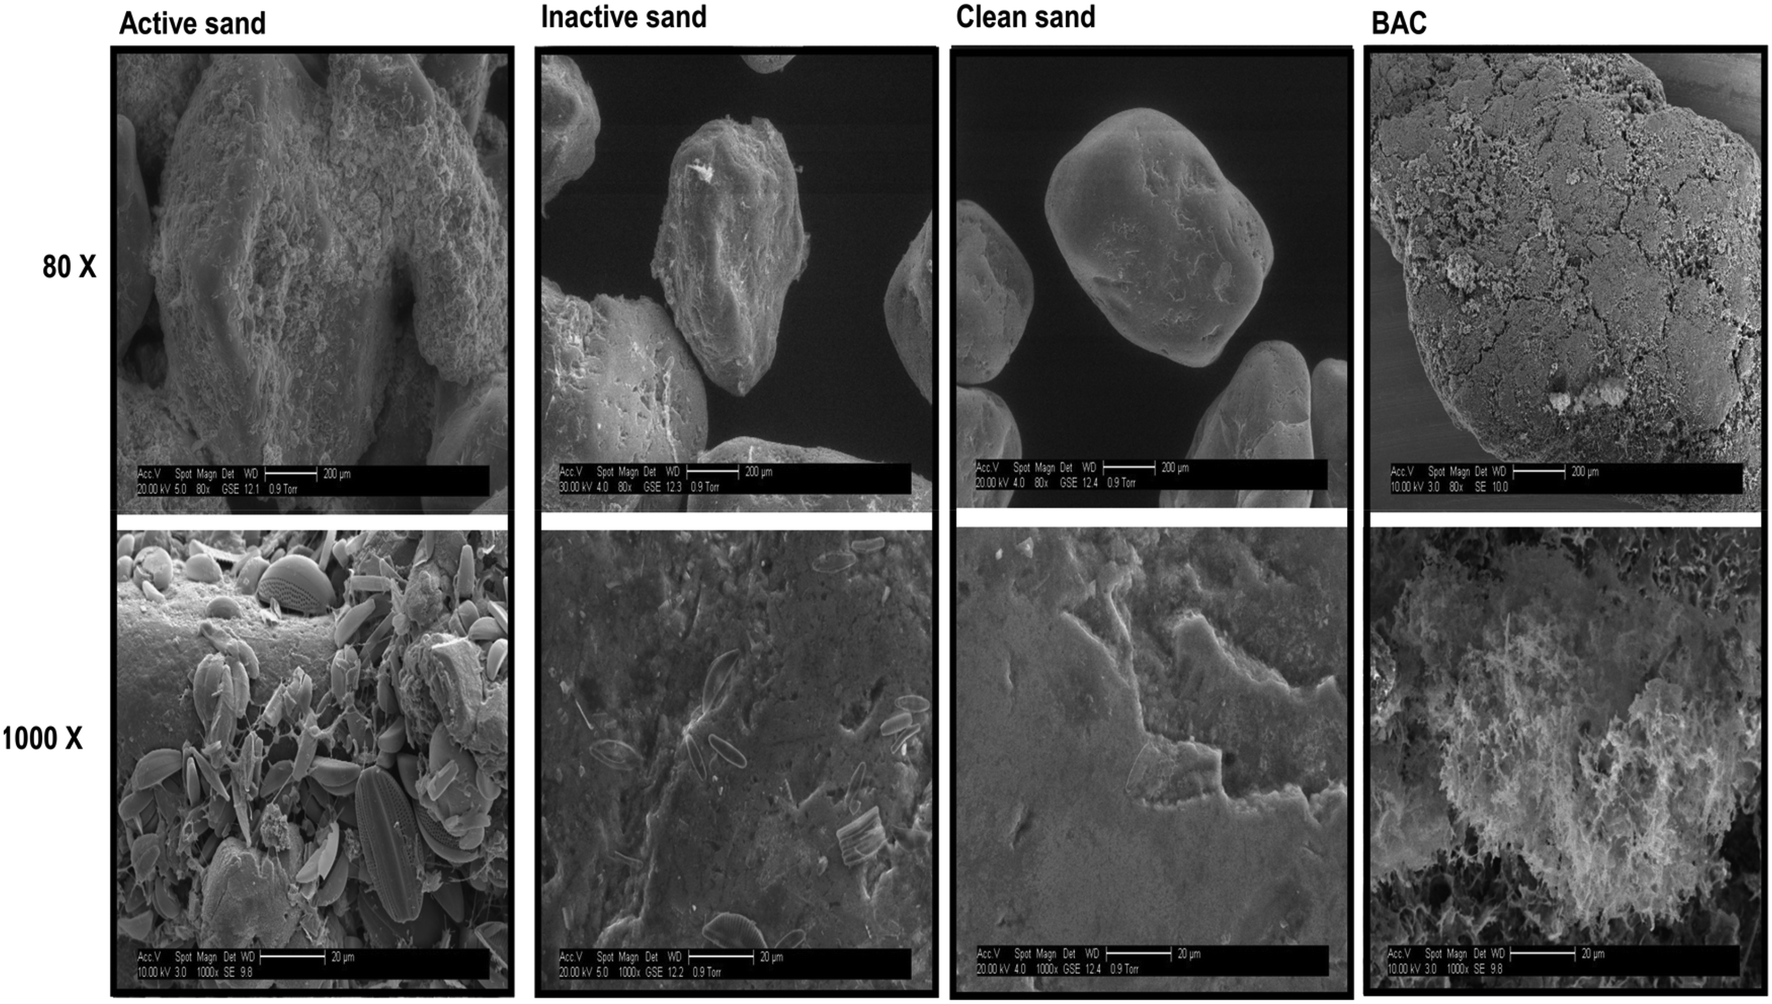 | ||
| Fig. 1 SEM images of different media at 80× (top) and 1000× (bottom) magnification. From left to right, active sand, inactive sand, clean sand and biological activated carbon. Scale bars are 200 μm for 80× and 20 μm for 1000×. | ||
Analytical methods for quantification of trace compounds
The determination and quantification of metaldehyde, serine and leucine were performed using liquid chromatography tandem-mass spectrometry (LC/MS/MS) consisting of high performance liquid chromatography (HPLC) (Waters Alliance HPLC system 2695, US) coupled with MS–MS (Quattro Premier Xe, Waters, US) as described by Ramos et al.16 Briefly, the aqueous mobile phase (A) consisted of 5 mM ammonium acetate and 0.1% formic acid and the organic mobile phase (B) was acetonitrile/0.1% formic acid. The flow rate was set at 0.2 mL min−1 with 50% A and 50% B held for 2 minutes. Source conditions were set at capillary voltage 3.5 kV, source temperature 120 °C, desolvation temperature 350 °C and a nitrogen drying gas flow rate of 1000 L h−1. The instrument was set to detect ions m/z 199 for metaldehyde, m/z 131.7 for leucine and m/z 105.7 for serine. The LC was fitted with an Agilent Eclipse Plus C18 column (3.5 μm × 2.1 mm × 150 mm). Calibration curves were derived prior to each run with at least 6 concentration points in the range (0–0.2 mg L−1 for metaldehyde and 0–400 mg L−1 for competitive compounds) and quantification was undertaken using Micromass QuantLynx (Waters, US). The limit of detection (LOD) was 0.0005 mg L−1 for metaldehyde and 0.01, and 0.005 mg L−1 for serine and leucine, respectively.Resorcinol was determined using a HPLC system with a UV-vis detector (Shimadzu, Japan). The HPLC-UV was used under conditions described by Mradu et al.17 Briefly, 15% acetonitrile and 85% of 0.1% phosphoric acid were held for 10 minutes and detected using a UV wavelength of 280 nm. A Grace Vydac 5 μm C18 300 (250 × 4.6 mm) column was used with a flow rate of 1.0 mL min−1. Resorcinol was quantified using calibration curves of response against known concentrations in the range of 0–400 mg L−1. The LOD was 0.001 mg L−1.
A combination of solid phase extraction (SPE) followed by gas chromatography mass spectrometry (GC-MS) was used to quantify metaldehyde at concentrations <3 μg L−1. Styrene-divinylbenzene Strata (200 mg/3 mL) SPE cartridges (Phenomenex, UK) were conditioned with 10 mL of methanol followed by 2 mL of UPW. 250 mL of sample which was spiked with metaldehyde-d16 (as an internal standard) was passed through the cartridge under vacuum, and the cartridge was then rinsed with 2 mL of UPW and dried under vacuum. The samples were eluted using 2 mL of dichloromethane, evaporated to a volume of 0.5 mL and analysed using GC-MS. The GC-MS consisted of an Agilent 6890 N gas chromatograph coupled with an Agilent 5673 mass selective detector with a detection limit of 0.05 μg L−1 (GC-MS + SPE). A HP-5MS column was used (30 m × 250 μm × 25 μm), and the oven was set to 35 °C which was increased to 260 °C at a rate of 20 °C min−1 for a total run time of 19.5 minutes with helium used as a carrier gas. Calibration standards and blanks were run in an identical manner to samples, and the metaldehyde concentration was quantified using the ChemStation software. Extraction efficiency was assessed through comparison between the observed and expected concentration of metaldehyde-d16. The response values for metaldehyde were corrected based on the metaldehyde-d16 extraction efficiency and was therefore presented as corrected values.
Single and multi-component batch experiments
Batch experiments were prepared by spiking 50 mL of ultrapure water with a 10-fold molar dilution of metaldehyde, serine, leucine and resorcinol at concentrations of 0.28, 2.8, 28, 280, and 2800 μM (Table 2). Each spiked water sample was subsequently added to 15 g of sand (active, inactive or clean) or 1 g of BAC. A lower mass of BAC and therefore greater specific metaldehyde loading based on the mass of the absorbent was used due to elevated adsorption rates compared to sand (data not presented). Each spiked microcosm was sealed and placed on a rotary shaker at 150 rpm at ambient temperature (measured temperature range 20–22 °C). In facilitating the experiments, ambient temperature was chosen and was not varied as part of this study. There is disagreement in the literature as some studies have identified that adsorption is temperature dependent, others reported that temperature did not have a significant role in metaldehyde adsorption to GAC.18 The impact of temperature on micropollutant adsorption may therefore present an avenue for further work. The incubator speed was selected to provide sufficient mixing but restrict biofilm sloughing.19 1 mL of the solution was withdrawn from each flask prior to the addition of the media and analysed using LC/MS/MS for metaldehyde, serine and leucine and HPLC for resorcinol analysis. The samples were incubated for 24 hours after which a 1 mL sample was filtered (0.45 μm, Millex-HA) and analysed for each contaminant. Flasks with no media were run as negative controls to quantify if metaldehyde losses were not attributed to the media directly. For multi-component batch experiments, surrogate NOM compounds (serine, leucine and resorcinol) were added to a metaldehyde solution in molar ratios increasing tenfold from 1:1 through to 1:10000 (Table 2). Other experimental conditions were identical to the single component batch tests reported above.
| Molar ratio | Metaldehyde molarity (M) | Competitive compounds (M) | Metaldehyde (MW 176) | Serine (MW 105) | Leucine (MW 131) | Resorcinol (MW 110) |
|---|---|---|---|---|---|---|
| Concentration (mg L−1) | ||||||
| 1:1 |
2.8 × 10⁻⁷ | 2.8 × 10⁻⁷ | 0.05 | 0.029 | 0.036 | 0.03 |
| 1:10 |
2.8 × 10⁻⁷ | 2.8 × 10⁻⁶ | 0.05 | 0.29 | 0.36 | 0.30 |
| 1:100 |
2.8 × 10⁻⁷ | 2.8 × 10⁻⁵ | 0.05 | 2.9 | 3.6 | 3.08 |
| 1:1000 |
2.8 × 10⁻⁷ | 2.8 × 10⁻⁴ | 0.05 | 29.4 | 36 | 30.8 |
| 1:10000 |
2.8 × 10⁻⁷ | 2.8 × 10⁻³ | 0.05 | 294 | 368 | 308 |
Thermal degradation of metaldehyde
200 mL of 0.2 mg L−1 of metaldehyde, serine, leucine and resorcinol was prepared and placed in a water bath at 20, 40, 60 and 85 °C for 24 hours. 1 mL of solution was analysed by LC/MS/MS before and after exposure to heat to help understand whether there is potential for the thermal regeneration of adsorptive media for metaldehyde at low temperatures.Isotherm modelling
To determine the concentration at equilibrium (qe), a mass balance can be determined using eqn (1). | (1) |
The evaluation of the isotherms was performed using the Freundlich model (eqn (2)). This model describes the relationship between the loading of the media (qe) and the residual concentration in the solution at equilibrium (Ce) where kf (mg g−1)(L mg−1)1/n and n (dimensionless) are empirical constants representing the Freundlich constant and the magnitude of the driving force of adsorption (adsorption capacity or surface heterogeneity), respectively. The kf value is representative of the maximum adsorption capacity kmax of a surface when n approaches infinity. The n value permits understanding of the adsorption process, and the adsorption isotherm is linear when n = 1, while the adsorption is favourable when n < 1, and unfavourable when n > 1; however in practise the n values should not exceed 10.20,21
| qe = kfCe1/n | (2) |
The Freundlich model is widely used to study adsorption, as it assumes first, non-ideal sorption onto a heterogeneous media surface, second that all sites are not available for adsorption, and third, a variation in binding energy between sites.22,23 The suitability of the Freundlich model varies depending on organic adsorbates and type of adsorbents.24–26 Previous studies have used the Freundlich method for pesticide isotherm modelling on GAC media.5,27,28
The linear form of the Freundlich equation is:
| log(qe) = logkf + (1/n)logCe | (3) |
Regression of a plot of logCe and logqe shows how effective the Freundlich model represents the data (eqn (3)). n and kf are calculated from the slope and intercept, respectively.
Statistical analysis
All statistical analyses were undertaken using SPSS v22 (IBM Corp., Armonk, NY).Results
Metaldehyde removal from water by adsorption onto different media
| Adsorbent | Adsorbate | k f (mg g−1)(L mg−1)1/n | n | R 2 | Temperature (°C) | Reference |
|---|---|---|---|---|---|---|
| Active sand | Metaldehyde | 0.006 | 0.70 | 0.979 | 20–22 | This study |
| Inactive sand | Metaldehyde | 0.008 | 0.69 | 0.977 | 20–22 | This study |
| Clean sand | Metaldehyde | 0.0005 | 0.65 | 0.951 | 20–22 | This study |
| BAC | Metaldehyde | 0.3 | 0.91 | 0.991 | 20–22 | This study |
| GAC | Metaldehyde | 18.36 | 3.71 | 0.99 | 22 | 30 |
| GAC | Metaldehyde | 1800 | 0.51 | 0.989 | Room temperature | 5 |
| AC cloth | Bentazon | 53 | 0.56 | 0.986 | 25 | 28 |
| AC cloth | Propanil | 73 | 0.30 | 0.995 | 25 | 28 |
The adsorption of metaldehyde to active and inactive sand ranged from 16–40% (Fig. 2). At metaldehyde concentrations <0.01 mg L−1, metaldehyde adsorption was limited in active and inactive sand indicating that adsorption is not a significant removal pathway. At an influent concentration of 0.0005 mg L−1, it can be expected that the adsorption to an active or inactive biofilm will be 0.006 (mg g−1)(L mg−1)1/n sand. BAC had a greater adsorption capacity of 0.3 (mg g−1)(L mg−1)1/n, possibly due to greater porosity and a large number of active sites for the metaldehyde to bind.29 Qualitative analysis of media by SEM revealed that there was elevated biomass attached to the BAC compared to sand (Fig. 1) probably providing greater biological area for metaldehyde biosorption to occur.
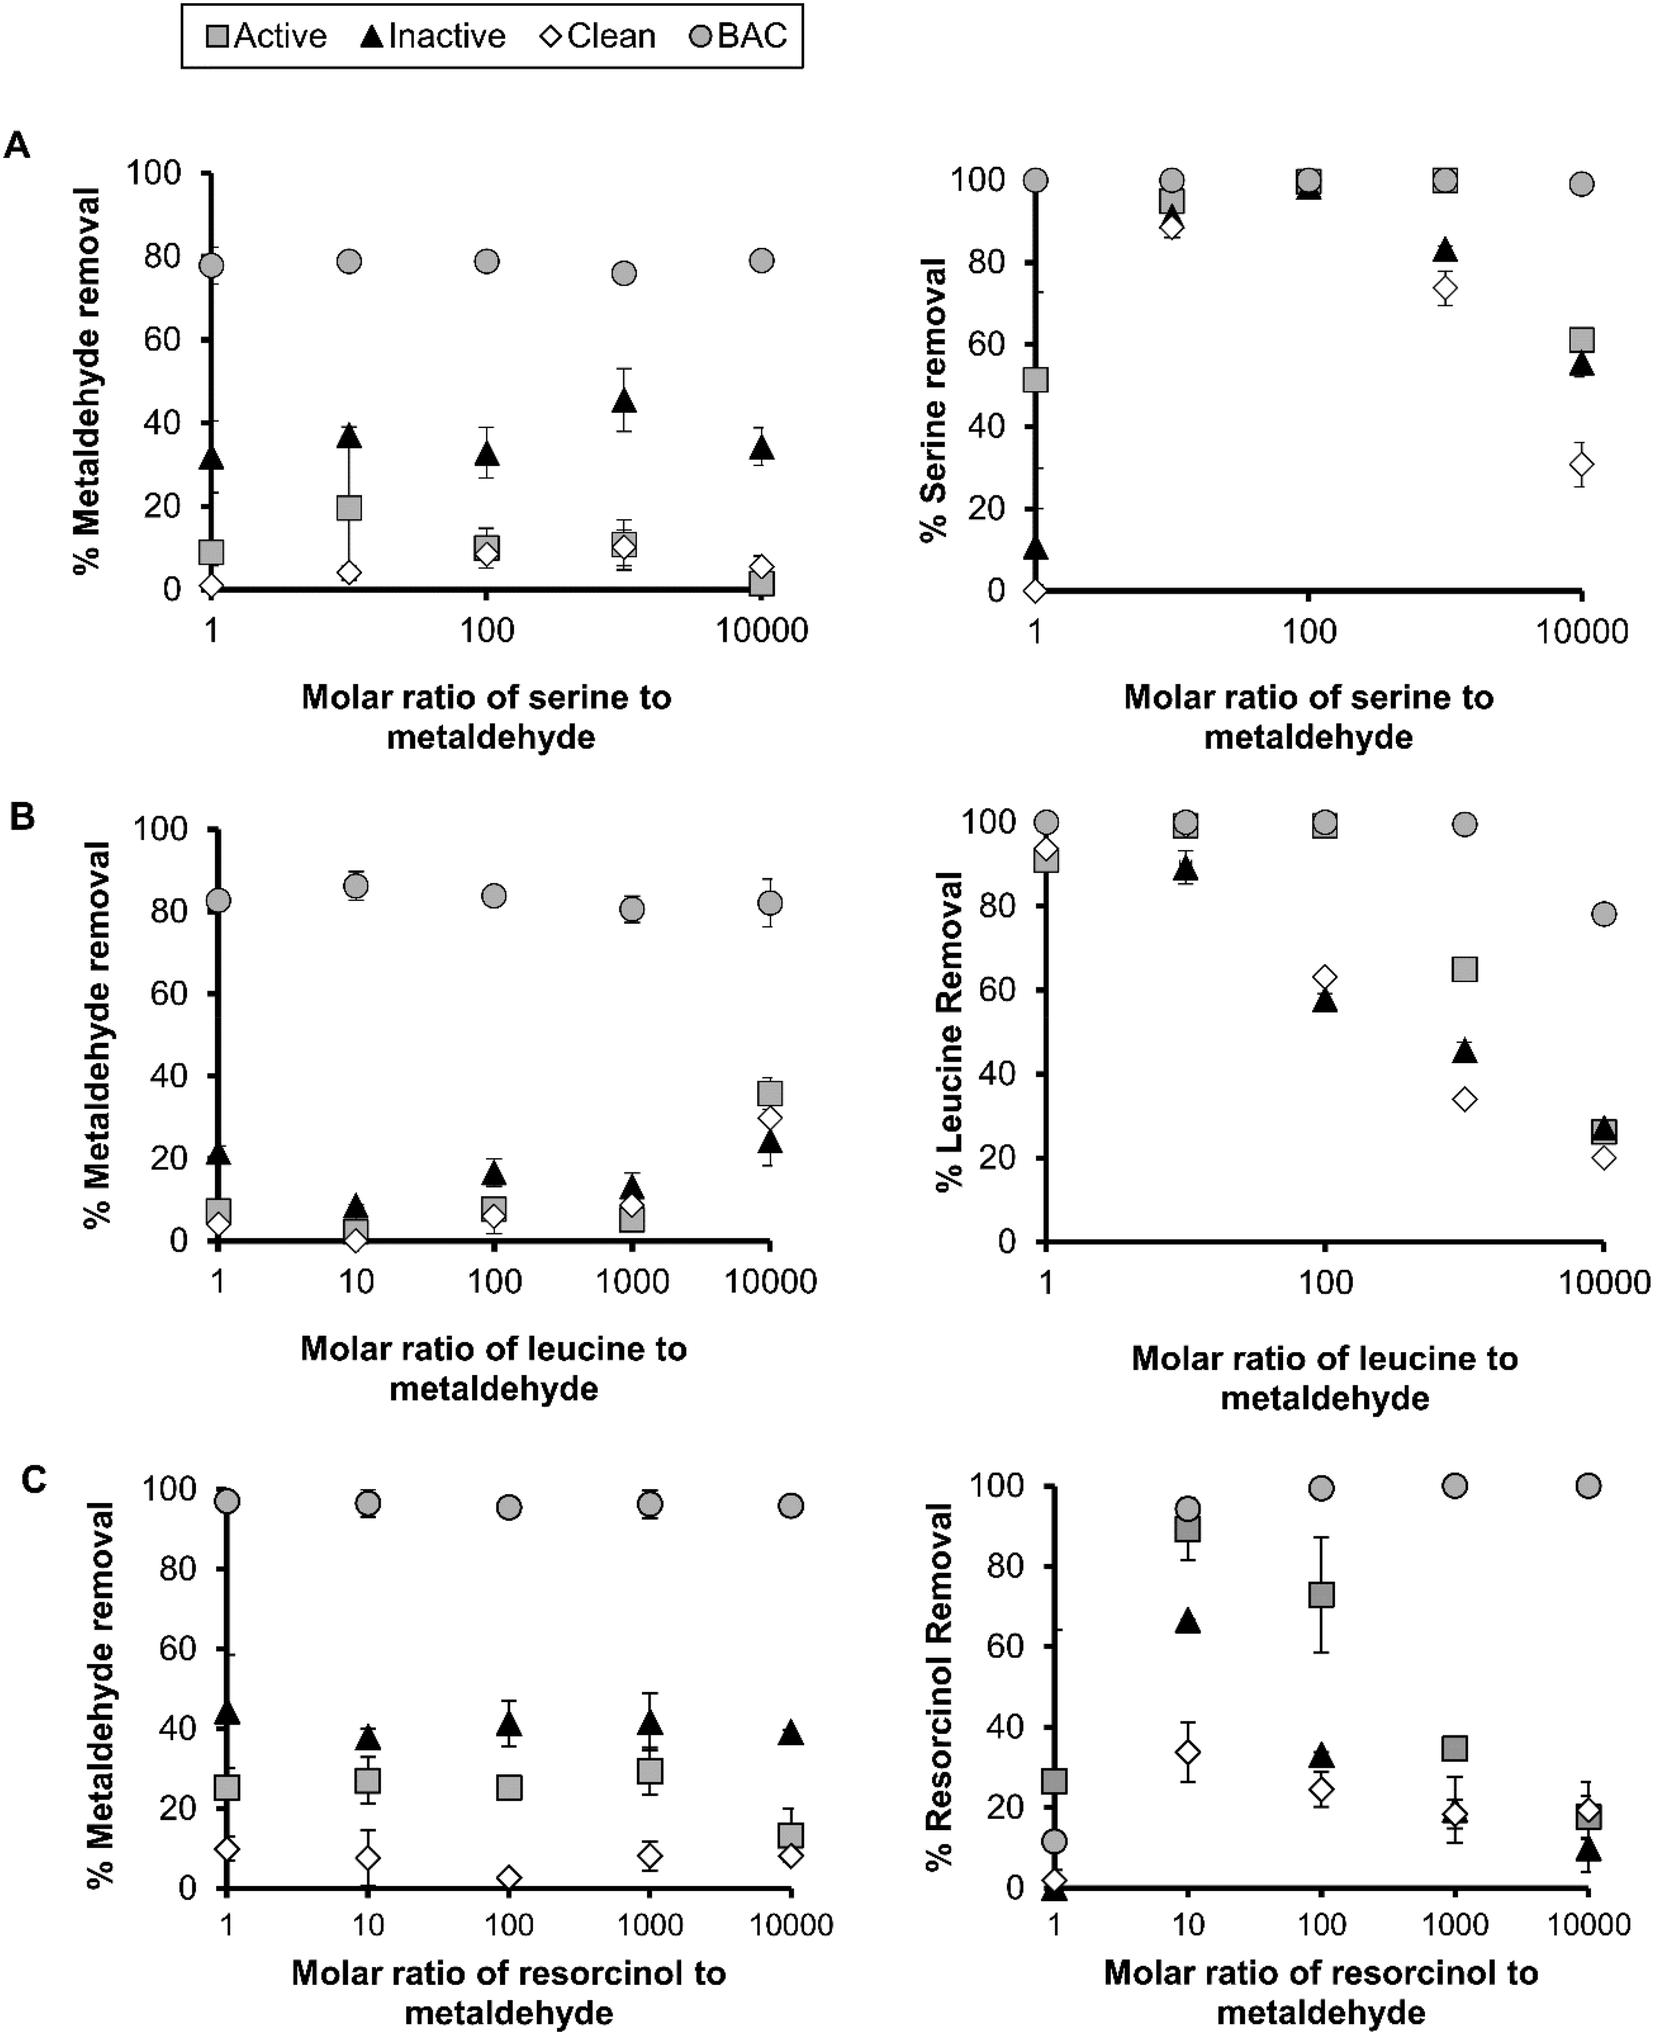 | ||
| Fig. 2 Removal of metaldehyde (left) and the surrogate compound (right) when active sand, inactive sand, clean sand and BAC media are exposed to different molar concentrations (A serine, B leucine, C resorcinol); error bars represent ±1 standard deviation. | ||
Impact of NOM on metaldehyde adsorption
Leucine adsorption onto active sand had a kf value of 0.17 (mg g−1 L mg−1)1/n suggesting that it was more readily adsorbed, compared to the kf values 0.03, 0.02, and 0.005 (mg g−1 L mg−1)1/n for serine, resorcinol and metaldehyde, respectively (Fig. 3), which were poorly adsorbed in comparison. The active sand biofilm had kf values 5.9, 4.3 and 10.2-fold higher for leucine, serine and resorcinol compared to the inactive sand (Fig. 3). In contrast, adsorption of metaldehyde was similar between active and inactive sand. The sand without a biofilm was not effective at adsorbing leucine, serine or resorcinol with kf values < 0.009 mg g−1 (L mg−1)1/n (Fig. 3). This suggests that biofilm mediated biosorption was an important route for the adsorption/removal of these compounds.
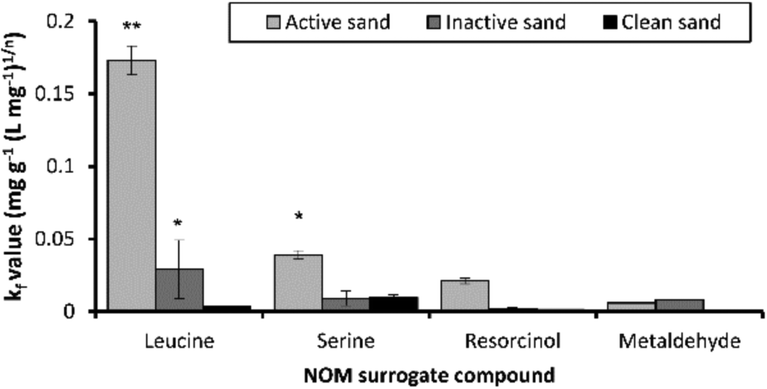 | ||
| Fig. 3 Comparison of Freundlich isotherm constants (kf) for leucine, serine, resorcinol and metaldehyde in active sand, inactive sand and clean sand. ** = p < 0.001, * = p < 0.05; error bars represent ±1 standard deviation. | ||
The NOM surrogates were poorly adsorbed by clean media except for serine which had a similar kf value of 0.009 mg g−1 (L mg−1)1/n for clean and inactive sand (Fig. 3). In all cases, sorption values of NOM surrogates to clean sand were greater than that observed for metaldehyde, with kf values ∼ 100 fold greater. The Freundlich isotherm driving force parameter (n) was highly variable for the NOM surrogate compounds ranging from 0.7–2.5 (Table S1‡).
Resorcinol has limited adsorption potential based on its organic carbon sorption coefficient (Koc) value of 65 (Table 1), therefore despite low sorption potential to sediment, it is biodegradable, which is evident from the active sand having 10 and 16-fold greater kf values compared to inactive and clean sand (Fig. 3). Therefore, the chemical characteristics of the compounds being adsorbed such as biodegradability, logKoc and logKow coupled with the bioactivity of the biofilm together define the adsorption characteristics of NOM compounds. The adsorption capacity of different types of adsorbents used for the removal of pesticides from water was compared (Table 3). The kf values for metaldehyde were greater in ref. 5 and 30 compared to adsorbents used in this study (Table 3). However, this could be due to the use of virgin materials in other studies compared to the exposed and regenerated media used in this study. The adsorbents used here were from active WTW and therefore could have lower capacity for metaldehyde due to prior exposure and regeneration cycles. A comparison with the kf and n values between this study and other pesticides suggested that metaldehyde has much lower adsorption capacity (1–6 orders of magnitude less), however n was similar between metaldehyde and other recalcitrant micro-pollutants such as bentazon and propanil.28
:10000 to evaluate the impact of competing organics on metaldehyde removal in different media. The average percentage removal of metaldehyde from water at an initial concentration of 0.05 mg L−1 in a single component batch test was 29.5 ± 2.7, 39.4 ± 4.4, 4.7 ± 6.0 and 94.2 ± 2.3% for active, inactive, clean and BAC, respectively (data based on 2 independent replicates per experiment), suggesting that BAC and inactive sand performed best for metaldehyde adsorption.
In batch tests, under competitive conditions with serine, there was no significant reduction in metaldehyde adsorption with increasing molar ratios of serine:metaldehyde (Fig. 2A). However, metaldehyde adsorption was inhibited in clean sand as 12.3% of the metaldehyde was removed across ratios of 1:1 and 1:1000 on average. The metaldehyde adsorption in active sand was 1.5% at 1:10000 (serine:metaldehyde), which coincided with a 40% reduction in serine adsorption efficiency (Fig. 2). The inactive sand was more effective in removing metaldehyde than active sand at the serine:metaldehyde ratios studied here. The average metaldehyde adsorption was 36.4 ± 5.5% between ratios and the adsorption of metaldehyde was similar between single and multi-component adsorption modes, suggesting that NOM did not interfere with adsorption in inactive sand. Leucine attained the highest kf value of 0.17 mg g−1 (L mg−1)1/n, however leucine saturation occurred at a molar ratio of 1:1000 as evidenced by a 35% reduction in the leucine adsorption level (Fig. 2B).
Clean sand had a greater capacity for resorcinol than serine or leucine (up to 33%). Under competitive conditions with resorcinol, the metaldehyde adsorption ranged from 25–29% between 1:1 and 1:1000 (resorcinol:metaldehyde) in active sand, however at 1:10000 this reduced to an adsorption level of 13% (Fig. 2C). At this high concentration of resorcinol, the active sand approached saturation as 18% of resorcinol was adsorbed. The adsorption of metaldehyde with clean sand was similar between NOM surrogates and metaldehyde at ∼7%. The adsorption of metaldehyde in inactive sand was similar (38–44%) across molar ratios (resorcinol:metaldehyde) but significantly higher than clean sand. Competing NOM surrogate compounds reduced the metaldehyde adsorption to BAC by up to 17%, however the BAC media outperformed the SSF media in all scenarios tested (Fig. 2).
Impact of biofilm on metaldehyde biosorption/removal
In batch studies performed on the different SSF media, the metaldehyde adsorption improved in the presence of a biofilm. The SSF media without a biofilm, which was reliant only on adsorption, (inactive sand and clean sand) achieved kf values which ranged from 0.0005 to 0.28 (mg g−1)(L mg−1)1/n. The media with an active biofilm on the surface (active sand and BAC) showed larger metaldehyde kf values between 0.006 and 0.3 (mg g−1)(L mg−1)1/n (Table 3). BAC was effective for metaldehyde treatment, however partial desorption of metaldehyde occurred in batch experiments (Fig. 4), particularly for inactive as opposed to active sand. This desorption is common, when influent adsorbate concentrations decrease; in this study, the difference between the active and inactive sand suggests that the sorption characteristics are worse in the inactive biofilm.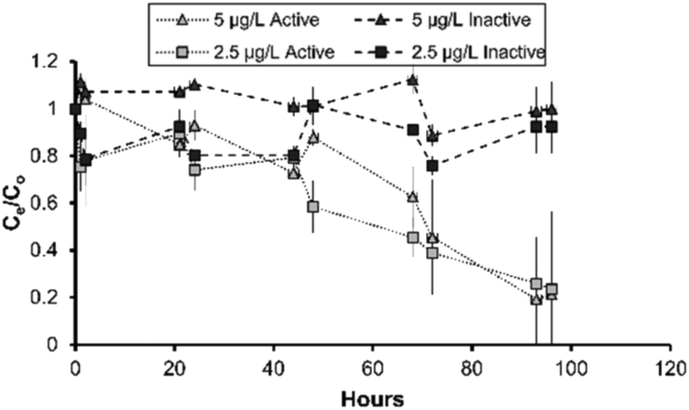 | ||
| Fig. 4 Metaldehyde removal with active and inactive sand at 0.0025 and 0.005 mg L−1; error bars represent ±1 propagated error term (sum of root squared error terms for Ce and C0). | ||
Batch tests comparing active and inactive sand showed that active sand had greater metaldehyde adsorption over 96 hours of incubation (Fig. 4). Initial concentrations of 0.0025 and 0.005 mg L−1 were selected as representative metaldehyde concentrations in raw water during the peak season.13 The active and inactive biofilms had similar removal from the water phase, with the Ce/C0 between 0.58 and 1 over the initial 48 hours (p > 0.05) with some adsorption and desorption (Fig. 4). This is important for metaldehyde remediation as tightly bound compounds typically exhibit low biodegradability.31 After 48 hours, limited metaldehyde biosorption was attained by the active sand with the Ce/C0 of 0.9 and 0.6 for the 0.005 and 0.0025 mgL−1 experiments (p > 0.05; Fig. 4). After 72 hours, significant biosorption was achieved by the active sand (p < 0.001) with residual metaldehyde concentrations <0.0002 mg L−1, which was equivalent to 75–80% of the initial concentration biosorped (p = 0.006). The better metaldehyde adsorption properties are therefore linked to enhanced removal through biosorption or biocenosis in the active sand.
To further confirm this hypothesis, desorption experiments were undertaken to evaluate metaldehyde binding efficiency to the biomass present on the sand surface.32 Active sand exposed to high metaldehyde levels for 72 hours was reconstituted with ultrapure water and shaken for 24 hours at 150 rpm (Fig. S1‡). Metaldehyde desorption from the active sand was negligible (0.03 ± 0.01 μg L−1), suggesting that either degradation within the biofilm or possibly very high binding affinity between adsorbate and adsorbent (Fig. S1‡) had occurred.
Discussion
Adsorbent media for removal of metaldehyde from water
Removal of metaldehyde from the water phase using adsorbents is challenging at the low concentrations often found in source waters. This is due to poor specificity of adsorbate to most adsorbents and the polar, simple low Mw nature of most pesticides including metaldehyde. For the inactive and the clean sand used here, adsorption was the primary mechanism for metaldehyde removal from water. Metaldehyde desorption from the media limited the metaldehyde removal which could be achieved over a short period (e.g. 24 hours) from water.30 The residence time in batch experiments required to achieve biological metaldehyde treatment (e.g. 48 hours) is too long for commercial WTW possibly due to the metaldehyde concentrations used here being too low for effective growth of metaldehyde degrading organisms. Experiments in single component systems revealed that clean sand was ineffective for metaldehyde adsorption (<10%), because minerals such as quartz represent poor adsorbents of non-ionic compounds.33 However, in multicomponent experiments, inactive sand had greater metaldehyde adsorption capacity than active sand (Fig. 2), which could be due to modifications of the biomass during the inactivation process such as drying or volatisation, which could free up active sites or increase the surface area for adsorption.34Metaldehyde adsorption not impacted by competition
In this study, the NOM surrogates did not significantly limit the adsorption of metaldehyde under most scenarios, possibly as metaldehyde did not compete for active sites with the NOM surrogates (Fig. 2). Busquets et al. (2014) also found that high concentrations of organic matter or saline water had no impact on the uptake of metaldehyde using synthetic carbon.2 However, a previous study showed that the characteristics of NOM surrogates was important for the removal of metaldehyde through AOPs. The more hydrophilic compounds did not affect the UV based degradation of metaldehyde, whilst resorcinol had a detrimental impact on UV degradation.3 Here, we found that resorcinol did not restrict metaldehyde adsorption except at very high resorcinol concentrations (Fig. 2C). This is probably due to limited adsorption potential for resorcinol to BAC or sand, governed by the chemical properties of resorcinol (logKow = 0.8 and Koc = 65; Table 1). Overall, the kf values of leucine, serine and resorcinol (kf value of 0.003–0.17 mg g−1 (L mg−1)1/n) suggest that the adsorption capacity for surrogates is greater than metaldehyde.
Leucine adsorption was less favourable (n > 1) for sand compared to metaldehyde (n < 1), however the kf for the media studied was several orders of magnitude higher for leucine than for metaldehyde on most media types, which may account for this reduction at high ratios (1:1000 leucine:metaldehyde) (Fig. 2). At 1:10000 (leucine:metaldehyde), more metaldehyde was removed (35.8%) which was more than at lower ratios (<20%) (Fig. 2).
It is established that pesticides can form electron donor–acceptor complexes with organics,35 and a stronger interaction could be formed between the complex and the adsorbent through co-adsorption of the pesticide-complex to the adsorbents (Fig. 2). In addition, surface conditioning of adsorbent surfaces could change the interactions between organic molecules to enforce or reduce adsorption. Elevated adsorption by BAC compared to sand media could be due to a stronger metaldehyde adsorbent interaction in the micropores of the AC media, than in larger pores present on sand media according to the Polyani theory.26 The penetration of an adsorbate molecule into interstitial spaces of the AC media could lead to entrapment and loss of active sites for adsorption, surface area and eventual media exhaustion.36
Biofilm based metaldehyde adsorption
The BAC media resulted in effective metaldehyde sorption or degradation and BAC achieved 44–95% removal from water across the 0–0.2 mg L−1 concentration range studied here. Busquets et al.2 reported that the van der Waals forces involved in metaldehyde adsorption permit weak connections to the carbon surface. Despite good adsorption of metaldehyde under these experimental conditions, data from full-scale operations have shown that adsorption to GAC is not sustained as desorption occurs when the inlet metaldehyde levels decrease.36 In other systems, mesoscale pores in granular media permit effective diffusive flow and metaldehyde removal in biofilm systems2 by promoting gradients in pollutants and transfer through biofilms.37Shintani et al.38 demonstrated a metaldehyde adsorption capacity of activated charcoal of 0.4 mg g−1 carbon. In contrast, Tao and Fletcher30 reported a significantly higher metaldehyde adsorption capacity of 50 mg g−1 carbon. These differences could be a result of the carbons used and the presence of different functional groups on the carbons. Using similar media as those in this study, Busquets et al.2 reported a GAC metaldehyde adsorptive capacity of just over 10 mg g−1 carbon, from an initial metaldehyde concentration of 62 mg L−1. The BAC in this work achieved a metaldehyde adsorption capacity of 19 mg g−1 carbon, at an equilibrium metaldehyde concentration of 50 mg L−1.
In this study, biologically active media degraded metaldehyde over 72 hours suggesting that metaldehyde was being metabolised as a substrate (Fig. 4). The delay in metaldehyde removal activity could be due to diffusion limitation by biological hydrogels or the lag between the enzyme up-regulation and the function within the biofilm or growth of specialised metaldehyde degrading strains. Selection of slow growing strains could occur as the biofilm microbial population adjusts to more recalcitrant carbon sources such as metaldehyde.13 Future works could assess the growth of these strains in real waters where metaldehyde is not the primary bioavailable carbon source.39 The presence of readily biodegradable compounds has been shown to impact pesticide biosorption/removal in biological systems, possibly due to resource prioritisation, out-grow of slow growing specialised strains or the requirement of a primary carbon source (other than metaldehyde) for removal.
Potential for the low temperature regeneration of AC media
Virgin carbon (without prior flow through) achieved good metaldehyde adsorption in this study, but rapid saturation was estimated at ∼44 days in a different study.36 Costly thermal or chemical (low temperature) regeneration of GAC media is required to restore performance. Here, we undertook experiments to see if low temperatures (20–85 °C) can be used to thermally degrade metaldehyde. The ultimate aim of this work is to reduce the frequency of GAC media regeneration through local regeneration. In this study, metaldehyde was effectively degraded from ultrapure water (without media) over a period of 24 hours at temperatures of 60 °C and 85 °C with 45% and 65% removal, respectively (Fig. 5). Metaldehyde degradation was negligible at 20 and 40 °C. Therefore, low temperature (60 °C) metaldehyde treatment is attainable. The NOM compounds used in this study were not impacted by temperature suggesting that filter efficacy for removal of other organics is unlikely to be impacted during low temperature regeneration for metaldehyde. Further work could determine if the biological integrity or the function of the BAC biofilm is impacted by low temperature based regeneration. The potential for low temperature regeneration of BAC to increase its capacity for metaldehyde removal from water is likely to be of interest to the water industry as this is one of the most common technologies applied for drinking water treatment. | ||
| Fig. 5 Metaldehyde degradation in ultrapure water at different temperatures; error bars represent ±1 propagated error term (sum of root squared error terms for Ce and C0). | ||
Conclusions
This study identified that a variety of media are suitable for the removal of metaldehyde from drinking water. Overall, BAC from a full scale WTW had a metaldehyde adsorption capacity of 0.3 (mg g−1)(L mg−1)1/n in batch tests, however desorption and increased regeneration required to maintain effective metaldehyde removal from water limit the process economy at present. Here, we show that the presence of NOM surrogates at elevated concentrations does not further inhibit the biosorption of metaldehyde, rather metaldehyde does not compete well for active sites at concentrations frequently encountered in European source waters. Biofilm based treatments could complement existing adsorption based treatment processes for metaldehyde by providing an additional mechanism for treatment, potentially overcoming capacities of adsorbent media. Biological degradation/sorption and thermal depolymerisation offer a way forward for metaldehyde removal for water treatment industries utilising existing drinking water treatment assets such as SSFs and GAC.Conflicts of interest
The authors have no competing interests to declare.Acknowledgements
The authors gratefully acknowledge financial support from the Engineering and Physical Sciences Research Council (EPSRC) through their funding of the STREAM Industrial Doctorate Centre (Grant no. EP/L015412/1). The authors are grateful for the support of Anglian Water Ltd., the Water Research Centre (WRC) and Yorkshire Water Ltd.References
- B. Jefferson, P. Jarvis, G. K. Bhagianathan, H. Smith, O. Autin, E. H. Goslan, J. MacAdam and I. Carra, Chem. Eng. J., 2016, 288, 359–367 CrossRef.
- R. Busquets, O. P. Kozynchenko, R. L. D. Whitby, S. R. Tennison and A. B. Cundy, Water Res., 2014, 61, 46–56 CrossRef PubMed.
- O. Autin, J. Hart, P. Jarvis, J. Macadam, S. A. Parsons and B. Jefferson, Water Res., 2013, 47, 2041–2049 CrossRef PubMed.
- L. V. Nguyen, R. Busquets, S. Ray and A. B. Cundy, Chem. Eng. J., 2017, 307, 159–167 CrossRef.
- S. Salvestrini, P. Vanore, A. Bogush, S. Mayadevi and L. C. Campos, J. Water Reuse Desalin., 2017, 7, 280–287 CrossRef.
- T. Hall, in CIWEM drinking water quality conference on emerging contaminants and advanced treatment technologies, 2010 Search PubMed.
- D. P. Wilcox, E. Chang, K. L. Dickson and K. R. Johansson, Appl. Environ. Microbiol., 1983, 46, 406–416 Search PubMed.
- C. A. Rolph, B. Jefferson, B. Holden, T. Hall and R. Villa, in Water treatment and supply conference, Cheltenham, 2011 Search PubMed.
- J. V. Headley, J. Gandrass, J. Kuballa, K. M. Peru and Y. Gong, Environ. Sci. Technol., 1998, 32, 3968–3973 CrossRef.
- D. Wicke, U. Böckelmann and T. Reemtsma, Water Res., 2007, 41, 2202–2210 CrossRef PubMed.
- W. Wang, W. Wang, X. Zhang and D. Wang, Water Res., 2002, 36, 551–560 CrossRef PubMed.
- F. Persson, G. Heinicke, T. Hedberg, M. Hermansson, W. Uhl and P. Taylor, Environ. Technol., 2010, 28, 95–104 CrossRef PubMed.
- C. A. Rolph, B. Jefferson and R. Villa, Prog. Slow Sand Altern. Biofiltration Process., 2014, p. 195 Search PubMed.
- J. Thomas, T. Helgason, C. J. Sinclair and J. W. B. Moir, Microb. Biotechnol., 2017, 10, 1824–1829 CrossRef PubMed.
- Standard Methods for examination of water and wastewater, American Public Health Association, Washington, 22nd edn, 2012, p. 1360, ISBN 978-087553-013-0 Search PubMed.
- A. M. Ramos, M. J. Whelan, S. Cosgrove, R. Villa, B. Jefferson, P. Campo, P. Jarvis and I. Guymer, Water Environ. J., 2017, 31, 380–387 CrossRef.
- G. Mradu, S. Saumyakanti, M. Sohini and M. Arup, Int. J. Pharmacognosy and Phytochem. Res., 2012, 4, 162–167 Search PubMed.
- B. Schreiber, V. Schmalz, T. Brinkmann and E. Worch, Environ. Sci. Technol., 2007, 41, 6448–6453 CrossRef PubMed.
- Y. C. Choi and E. Morgenroth, Water Sci. Technol., 2003, 47, 69–76 CrossRef PubMed.
- H. N. Tran, S. J. You, A. Hosseini-Bandegharaei and H. P. Chao, Water Res., 2017, 120, 88–116 CrossRef PubMed.
- U. Kumar and M. Bandyopadhyay, Bioresour. Technol., 2006, 97, 104–109 CrossRef PubMed.
- C. Ng, J. N. Losso, W. E. Marshall and R. M. Rao, Bioresour. Technol., 2002, 85, 131–135 CrossRef PubMed.
- H. Chen, J. Zhao, J. Wu and G. Dai, J. Hazard. Mater., 2011, 192, 246–254 Search PubMed.
- E. J. Petersen, Q. Huang and W. J. Weber, Environ. Sci. Technol., 2008, 42, 3090–3095 CrossRef PubMed.
- K. Yang and B. Xing, Chem. Rev., 2010, 110, 5989–6008 CrossRef PubMed.
- K. Yang, L. Z. Zhu and B. S. Xing, Environ. Sci. Technol., 2006, 40, 1855–1861 CrossRef PubMed.
- B. H. Hameed, J. M. Salman and A. L. Ahmad, J. Hazard. Mater., 2009, 163, 121–126 CrossRef PubMed.
- E. Ayranci and N. Hoda, Chemosphere, 2004, 57, 755–762 CrossRef PubMed.
- J. Rivera-Utrilla, I. Bautista-Toledo, M. A. Ferro-Garca and C. Moreno-Castilla, J. Chem. Technol. Biotechnol., 2001, 76, 1209–1215 CrossRef.
- B. Tao and A. J. Fletcher, J. Hazard. Mater., 2013, 244–245, 240–250 CrossRef PubMed.
- P. H. Jensen, H. C. B. Hansen, J. Rasmussen and O. S. Jacobsen, Environ. Sci. Technol., 2004, 38, 6662–6668 CrossRef PubMed.
- OECD, OECD Guidel. Test. Chem., 2000, pp. 1–44 Search PubMed.
- L. Clausen, I. Fabricius, L. Madsen and P. May, J. Environ. Qual., 2001, 30, 846–857 CrossRef PubMed.
- G. M. Lule and M. U. Atalay, Part. Sci. Technol., 2014, 32, 426–430 CrossRef.
- G. Sheng, C. T. Johnston, B. J. Teppen and S. A. Boyd, J. Agric. Food Chem., 2001, 49, 2899–2907 CrossRef PubMed.
- UKWIR, DW14: Treatment for new and emerging pesticides Final, London, 2011 Search PubMed.
- F. Hassard, J. Biddle, E. Cartmell and T. Stephenson, Process Saf. Environ. Prot., 2016, 103, 69–75 CrossRef.
- S. Shintani, K. Goto, Y. Endo, C. Iwamoto and K. Ohata, Vet. Hum. Toxicol., 1999, 41, 15–18 Search PubMed.
- J. Svojitka, L. Dvořák, M. Studer, J. O. Straub, H. Frömelt and T. Wintgens, Bioresour. Technol., 2017, 229, 180–189 CrossRef PubMed.
Footnotes |
| † Data for this publication are available at: 10.17862/cranfield.rd.4702747. Supplementary data for this publication are available at: 10.17862/cranfield.rd.4702774. |
| ‡ Electronic supplementary information (ESI) available: The following is the supplementary data related to this article: Table S1 kf and (n) values for metaldehyde and NOM surrogate compounds. Fig. S1 metaldehyde and active sand 72 hour batch test. See DOI: 10.1039/c8ew00056e |
| This journal is © The Royal Society of Chemistry 2018 |