
 Open Access Article
 This Open Access Article is licensed under a Creative Commons Attribution-Non Commercial 3.0 Unported Licence
Searching for relevant criteria to distinguish natural vs. anthropogenic TiO2 nanoparticles in soils†
Ana Elena
Pradas del Real
 ab,
Hiram
Castillo-Michel
b,
Ralf
Kaegi
c,
Camille
Larue
d,
Wout
de Nolf
b,
Juan
Reyes-Herrera
b,
Rémi
Tucoulou
b,
Nathaniel
Findling
a,
Eduardo
Salas-Colera
b and
Géraldine
Sarret
*a
ab,
Hiram
Castillo-Michel
b,
Ralf
Kaegi
c,
Camille
Larue
d,
Wout
de Nolf
b,
Juan
Reyes-Herrera
b,
Rémi
Tucoulou
b,
Nathaniel
Findling
a,
Eduardo
Salas-Colera
b and
Géraldine
Sarret
*a
aISTerre (Institut des Sciences de la Terre), Univ. Grenoble Alpes, CNRS, 38000 Grenoble, France. E-mail: geraldine.sarret@univ-grenoble-alpes.fr
bESRF The European Synchrotron, CS 40220, 38043 Grenoble Cedex 9, France
cEawag, Particle Laboratory, Dübendorf 8600, Switzerland
dECOLAB, Universite de Toulouse, CNRS, INPT, UPS, Toulouse, France
First published on 29th October 2018
Abstract
Nanosized TiO2 is one of the most produced nanomaterials. Agricultural soils are a major compartment of accumulation of TiO2-NPs after release from consumer products into the sewer system, due to the use of sewage sludge as a soil amendment. TiO2 is naturally present in soils, and distinguishing between anthropogenic and natural TiO2 in soils is thus important to assess the risks associated with the increased use of nano-TiO2. Methods to distinguish these materials in complex matrices such as soils are currently lacking. The purpose of this study was, therefore, to search for characteristic physical and chemical properties of natural and engineered nano-TiO2, based on a combination of bulk, micro and nanofocused X-ray fluorescence and X-ray absorption spectroscopy, transmission electron microscopy, X-ray diffraction and chemical analyses. Digested sewage sludge, agricultural soil and sludge-amended soil were studied by these techniques. The particle size distribution was not a relevant criterion since the sludge and the sludge-amended soil contained a variety of nanometer- and micrometer sized Ti-containing particles. Both the sludge and the soil contained a mixture of rutile and anatase, with a minor proportion of amorphous TiO2. In the sludge, there was no trend relating particle size and Ti mineralogy. The morphology of the TiO2 particles proved to be different in the two matrices, with smooth faceted particles in the sludge and rough irregular ones in the soil. In addition, natural TiO2 particles were included in micro and macroaggregates of the soil and formed intricate assemblages with minerals and organic compounds. In the sludge, TiO2 formed homo and heteroaggregates of simpler structure, richer in organic matter. Thus, the study of the morphology of TiO2 particles and their status in unperturbed mineral–organic assemblages may provide some insights into their origin. The observed differences may attenuate over time, due to the incorporation of the sludge material within the soil structure.
Environmental significanceTracing engineered nanoparticles in complex matrices and distinguishing them from the natural background is a great challenge. So far, there is no criterion that discriminates between natural and engineered TiO2 NPs. In this manuscript, we study sewage sludge, agricultural soil and sludge-amended soil. Our results show that the size, speciation and speciation as a function of size are not relevant criteria, but that the morphology of the TiO2 crystals and the mineral assemblage and their status within the micro and macroaggregates do provide insights into their origin. We conclude the article by suggesting that engineered TiO2 may become undistinguishable from the natural background in soil, thanks to mineral weathering and aggregation processes. |
Introduction
Nanosized TiO2 is one of the most produced nanomaterials with up to 10![[thin space (1/6-em)]](https://www.rsc.org/images/entities/char_2009.gif) 000 t of worldwide production.1 Microsized TiO2 has been used for decades as a pigment in many types of products (food, paint, textile, cosmetics, etc.), but these pigments generally contain a fraction of nanosized particles. For example, in food-grade TiO2 identified as E171, up to 36% of the particles were smaller than 100 nm.2 The main reasons for the use of nanosized TiO2 is its very attractive properties, including its high UV absorbing properties but transparency to visible light, and photocatalytic effects. Amorphous TiO2 is also used as a component of solar cells3 and high performance electrodes.4 There is no available data on the world production of amorphous TiO2, but it is probably minor compared to anatase and rutile. Current models for fluxes of nanomaterials into the environment suggest that nanoTiO2 represents by far the largest volumes.5 Soil is a major compartment of accumulation for nanoTiO2 due to the application of sewage sludge which accumulates these nanomaterials5 and the use of nanoTiO2 in agriculture.6
000 t of worldwide production.1 Microsized TiO2 has been used for decades as a pigment in many types of products (food, paint, textile, cosmetics, etc.), but these pigments generally contain a fraction of nanosized particles. For example, in food-grade TiO2 identified as E171, up to 36% of the particles were smaller than 100 nm.2 The main reasons for the use of nanosized TiO2 is its very attractive properties, including its high UV absorbing properties but transparency to visible light, and photocatalytic effects. Amorphous TiO2 is also used as a component of solar cells3 and high performance electrodes.4 There is no available data on the world production of amorphous TiO2, but it is probably minor compared to anatase and rutile. Current models for fluxes of nanomaterials into the environment suggest that nanoTiO2 represents by far the largest volumes.5 Soil is a major compartment of accumulation for nanoTiO2 due to the application of sewage sludge which accumulates these nanomaterials5 and the use of nanoTiO2 in agriculture.6
TiO2 is naturally present in soils. It occurs mainly as rutile or anatase and only a small fraction is present as brookite.7 Ti may also be present in Ti-containing silicates such as titanite (CaTiO2(SiO5)), in high temperature minerals such as ilmenite (FeTiO2) and perovskite (CaTiO3),7 and in clays.8 In consumer products, TiO2 is introduced as micro and nanoparticles (NPs) of mainly rutile and anatase. The widely used E171 food additive can be in the anatase or rutile form,2 or present as a mixture.9
Distinguishing between TiO2 from anthropogenic inputs and the natural background is important for several reasons. First, current models of fluxes in environmental compartments have large uncertainties, so field monitoring could help to quantify actual anthropogenic inputs. Second, like in any case study of impact assessment, distinguishing the geochemical background from the anthropogenic inputs is a prerequisite. Finally, evaluating how different (in terms of composition and structure) natural and anthropogenic nanomaterials are may provide clues to interpret data on toxicity. Possible fingerprint criteria to distinguish between anthropogenic and natural TiO2 include the size and morphology of the particles, their trace element content, and their mineralogy. A few studies have characterized Ti-containing phases in sewage sludge. Kiser et al.10 and Westerhoff et al.11 identified nanoscale and microscale TiO2 by transmission electron microscopy coupled to energy dispersive X-ray spectroscopy (TEM-EDX), as well as Ti associated with Si-containing minerals (silicates and aluminosilicates) and Fe- and Ca-containing ones. Kim et al.12 identified rutile in three sewage sludges from a survey conducted by the US EPA. The particles were 40 to 300 nm in diameter, and formed small, loosely packed aggregates. Tong et al.13 compared the sewage sludge and effluent of a wastewater treatment plant (WWTP) and river sediments upstream of the WWTP by bulk X-ray absorption near edge structure (XANES) spectroscopy and TEM-EDX. The authors found a mixture of anatase, rutile and ilmenite (FeTiO3), nanosized or nearly nanosized in the sludge and effluent, and a mixture of anatase, rutile, ilmenite and amorphous TiO2, both nano and microsized in river sediments. The relative abundance of anatase to rutile was significantly lower in the sludge and effluent than in the sediments, and this finding was attributed to the high level of domestic usage of rutile as a pigment in personal care products.
Single particle inductively coupled plasma-mass spectrometry (sp-ICP-MS) is a promising technique to distinguish between anthropogenic and natural NPs based on the characteristic elemental signatures14 such as La in CeO2 nanoparticles,15 but this approach may not be successful for TiO2 NP due to the limited capability of TiO2 to incorporate other elements. The fact that TiO2-NPs are used both in the nano- and micro size in consumer products adds some complexity to the system. A recent study showed a distinct clustering of natural and engineered TiO2-NPS when plotting {Ti + Zn} to {Ti/Zn}/{Fe + Al} on a log scale, and on a ternary plot of {Ti + Zn}, Fe, and Al.16 However, these results were based on the analysis of bulk samples after digestion (without prior separation of the TiO2-NPs). Samples included natural colloids from an ilmenite mine (probably very rich in Fe and Al), sunscreen and paints, and pure TiO2-NPs. The observed clustering is, therefore, probably caused by the high Fe and Al contents in the samples from the mine.
The purpose of this study was to evaluate possible criteria to distinguish between natural and anthropogenic TiO2 based on complementary bulk, micro and nanofocused synchrotron techniques, TEM-EDX and ICP-MS. Sewage sludge, agricultural soil and sludge-amended soil which have been previously characterized for Ag speciation17 were studied by synchrotron-based methods including Ti K-edge bulk XANES spectroscopy, X-ray diffraction, micro and nano X-ray fluorescence (μXRF and nanoXRF) and Ti K-edge microXANES spectroscopy complemented by analytical electron microscopy (TEM-EDX) and bulk elemental analyses by inductively coupled plasma-mass spectrometry (ICP-MS).
Materials and methods
1. Preparation of the sewage sludge, soil and sludge-amended soil samples
The origin of the samples and preparation procedure have been described in details in a previous study.17 The sludge used for this experiment is the so-called high dose sludge, resulting from the addition of silver NPs to the wastewater. Briefly, the sewage sludge was produced in a pilot wastewater treatment plant at Eawag (Dübendorf, Switzerland) fed with municipal wastewater. The pilot plant included a large sedimentation tank (primary clarifier, 9 m3), a non-aerated tank (denitrification tank, 91 L), an aerated tank (nitrification tank, 120 L), a secondary clarifier (120 L), a thickener (32 L) and an anaerobic digester (300 L). The hydraulic retention time was 21 hours and the average sludge age was 14 days. No TiO2-NP was spiked to the WWTP, so the Ti found in the sewage sludge originates from the wastewater of Dübendorf (Switzerland) and the runoff into the sewer systems. The soil was loamy soil (Luvisol, WRB, 2006) under permanent pasture, collected at La Côte Saint-André (Isère, France). This soil did not receive sludge amendments before. The soil and sludge main characteristics and the sludge + soil mixing procedure in a 1:10 ratio are described in our previous study.17 The sludge-amended soil was placed in a pot and incubated for four weeks under controlled conditions (pot without plant described in ref. 17). The soil, sludge and sludge-amended soil were then air dried and prepared as thin sections (20 μm) embedded in epoxy resin for synchrotron micro and nano-analyses. In parallel, samples were ground and thoroughly mixed using a mechanical agate mortar (Fritsch Pulverisette 7) for bulk analyses.
2. Elemental analyses
The elemental composition of the soil, sludge and soil + sludge mixture was determined by HR-ICP-MS at EcoLab using triplicate samples digested independently according to Larue et al.18 with minor changes. The experimental details are provided in the ESI.†3. Bulk XANES spectroscopy
Ti K-edge XANES spectra were collected on pellets pressed from powdered sewage sludge, soil and soil amended with sewage sludge. Measurements were performed using a scanning X-ray microscope at the ID21 beamline of the European Synchrotron Radiation Facility (ESRF) in unfocused mode with a 200 μm diameter beam defined with the use of a pinhole. The flux was 2.24 × 10¹⁰ ph s−1. The incoming beam intensity was measured using a photodiode and the emitted fluorescence by a silicon drift detector (SDD, X-flash Bruker 80 mm2 active area). Three independent measurements were performed for each condition.4. μXRF and μXANES analyses
Coupled μXRF and μXANES were performed on the sludge and sludge-amended soil thin sections at beamline ID21 (ESRF). Focusing was realized using a Kirkpatrick–Baez (KB) mirror system. The photon flux was 3.47 × 10¹⁰ ph s−1 at 5.8 keV with a beam size of 0.30 × 0.87 μm. μXRF maps were recorded with various step sizes (from 0.5 × 0.5 μm2 to 3 × 3 μm2) and a dwell time of 100 ms. Maps collected at 5.2 keV were used to localize Ti hotpots to perform Ti K-edge μXANES. In order to further study spatial correlations of Ti with other elements, additional elemental maps were recorded at 5.8 keV to excite Ba and rare earth elements. The elemental maps presented in this paper were obtained after fitting the XRF spectrum of each pixel of the map for peak deconvolution using PyMCA software19 (batch fitting module). The largest Ti-rich particles caused saturation of the detector and were therefore excluded from this analysis.In the Ti-rich areas identified in the μXRF maps, Ti K-edge μXANES spectra were recorded in fluorescence mode. Spectra for large aggregates were recorded by classical μXANES point analysis (4.95 to 5.2 keV energy range, 0.5 eV step). For smaller aggregates or regions with a more diffuse Ti concentration, the full XAS (FXAS) mapping mode was used.20 In this latter case, μXANES spectra were extracted from a stack of images recorded at each energy step of the spectrum, with a step size of 0.5 μm (horizontal) × 0.5 μm (vertical). The 139 XRF images recorded using a region of interest selective for Ti Kα emission lines, corrected for the detector deadtime and normalized by I0, were aligned using Elastix21 and saved to an hdf5 file containing the intensities and energy values for each map. μXANES spectra were then extracted from the FXAS maps using PyMCA.
Bulk XANES and μXANES spectra were normalized and treated by linear combination fitting (LCF) using ATHENA software22 with a set of Ti XANES reference spectra. This database included rutile (nominal diameter 70 and 700 nm), anatase (nominal diameter 4 and 140 nm), Ti oxalate and Ti acetate as previously described,23 as well as amorphous TiO2 provided by Hengzhong Zhang.24
5. NanoXRF analyses
Further analyses of the soil thin sections were made by nanoXRF at ID16b at the ESRF.25 Measurements were performed using a pink beam (ΔE/E = 10−2) at 29.6 keV with a photon flux of 1.5 × 10¹⁰ ph s−1 (4-bunch ring filling mode). The optics used were a double white mirror with a Pt coating and a KB mirror system focusing the beam down to 50 × 50 nm. Two fluorescence detectors were used: a VORTEX single element silicon drift detector (SDD) and a three-element SDD array from SGX Sensortech.25 The analysis of the particle size distribution was based on an image analysis procedure that considers the possibility of over- or underestimation of particle sizes. Since particles are not necessary spherical, the diameter of the particles was calculated based on the Feret diameter. All steps of the particle size analysis using ImageJ26 are described in the ESI,† Fig. S1–S6.6. TEM-EDX analyses
Powdered samples (20 mg) were dispersed in 100 ml of 0.2% sodium dodecyl sulfate (SDS). The suspension was further diluted 1:10 using ultrahigh quality (UHQ) water, and 1 mL of the diluted suspension was sonicated for 1 min in a VialTweeter (Hielscher Ultrasonics GmbH, Germany) and directly centrifuged on poly-L-lysine (PLL)-functionalized TEM grids (carbon-coated Cu TEM grids, EM Resolutions Ltd, UK). For that purpose, dedicated aluminum (Al) cones fitting into a standard 2 mL Eppendorf centrifugation tube were used. TEM grids were placed on the Al cones which were covered with a thin layer of Parafilm® and placed in the Eppendorf tubes. 1 mL of the suspension was carefully pipetted into the Eppendorf tubes which were inserted into a swing-our rotor and centrifuged for 1 h at 14000g. TEM grids were investigated using a dedicated scanning transmission electron microscope (HD200Cs, Hitachi, Japan) operated at 200 kV. For the image formation, a high-angle annular dark field (HAADF) detector was used and elemental analyses of selected particles were conducted with an EDX system (EDAX, USA) coupled to the microscope.
7. XRD analyses
XRD patterns of the soil and sludge-amended soil were recorded with a Bruker D5000 powder diffractometer equipped with a SolX Si(Li) solid state detector from Baltic Scientific Instruments using CuKα_1+2 radiation. Intensities were recorded at 0.026° 2θ step intervals from 5 to 90° (3 s counting time per step). The XRD pattern of the sludge was recorded on beamline BM25 at the ESRF using an experimental set-up described previously,27 with an incident beam λ = 0.77545 Å.8. Statistical tests
Statistical analysis of the elemental composition was performed using the statistical package SPSS version 20.0 (IBM, Armonk, N. Y.). The results were analyzed by one-way ANOVA. The means were separated by using Tukey's multiple test (p < 0.05).Results
1. Elemental composition
The elemental contents of the soil, sludge and sludge-amended soil are shown in Fig. 1 and Table S1.† The measured elemental concentrations for the sludge-amended soil samples were consistent with the ones calculated based on a 1:10 ratio, which shows that the mixing procedure was correct and the digestion and ICP-MS analysis were robust. The sludge had higher concentrations (p < 0.01) of Mg, P, S, Ca, Ba, and metal pollutants including Cr, Ni, Cu, Zn, Cd, Sn and Sb than the soil. The high content of P, S and metals is typical for sewage sludge (the wastewater treatment did not include P removal). The soil was higher in Al, Si, and K (likely related to the presence of alumino-silicates) and also to some extent in Mn, Ti, Ce, Cs and Ga. The values for the soil and sludge were consistent with previously reported ones.28–30
 | ||
| Fig. 1 Comparison of the major (A) and trace (B) element contents of the soil, sludge and sludge-amended soil mixture (logarithmic scale). The soil + sludge, calculated (in blue), corresponds to the weighted sum of the soil and sludge data (0.9 and 0.1, respectively). The analysis data of Si in the soil were missing, so the Si content was calculated based on the analysis of the sludge and sludge-amended soil (appearing in light orange). The values are given in Table S1.† | ||
2. Ti distribution in the sludge and sludge-amended soil
Thin sections of sludge and sludge-amended soil were studied by μXRF. Fig. 2 shows the distribution of Ti, S, Ca, Ce, Ba, Al and Si. In both matrices, Ti-containing particles exhibited a wide range of sizes, from <1 μm to several tens of μm. The sludge was rich in organic matter, as attested by the higher S signal (Fig. 2A). It presented microaggregates (<250 μm) mostly composed of organic matter, with a small proportion of alumino-silicates (Fig. 2C). Ti spots were observed in the aggregates, and Ti was not colocalized with Si, Al, S or Ca on the micrometer scale. An association of Ti with Ce and Ba was suggested for some of the Ti-rich spots (Fig. 2B). However, there is a strong overlap of the X-ray fluorescence lines of these elements (4512.2 and 4933.4 eV for Ti Kα1 and Kβ1, 4466.5 and 4828.3 eV for Ba Lα1 and Lβ1, and 4839.2 eV for Ce Lα1) which may cause this apparent association of Ti with Ba and Ce. To confirm the presence of Ba and Ce in the Ti-rich spots, μXRF spectra extracted from selected Ti-rich spots were fitted with and without Ba and Ce (Fig. S7a†). Four of the five Ti-rich particles which we evaluated contained Ti only, one contained Ti and Ba, and none of them contained Ce. This analysis shows that the XRF peak deconvolution procedure, although much more accurate than the region of interest (ROI) mode, may be misleading in case of strong overlap between peaks. The absence of detectable Ce is not surprising since the Ce/Ti ratio in the sludge is 0.02 (Table S1†). Ba is more concentrated in the sludge (Ba/Ti = 0.75, Table S1†), but by analyzing all pixels of the map, it turned out that regions containing Ba and Ti represented only 0.6% of the Ti-rich regions (Fig. S7b–d†).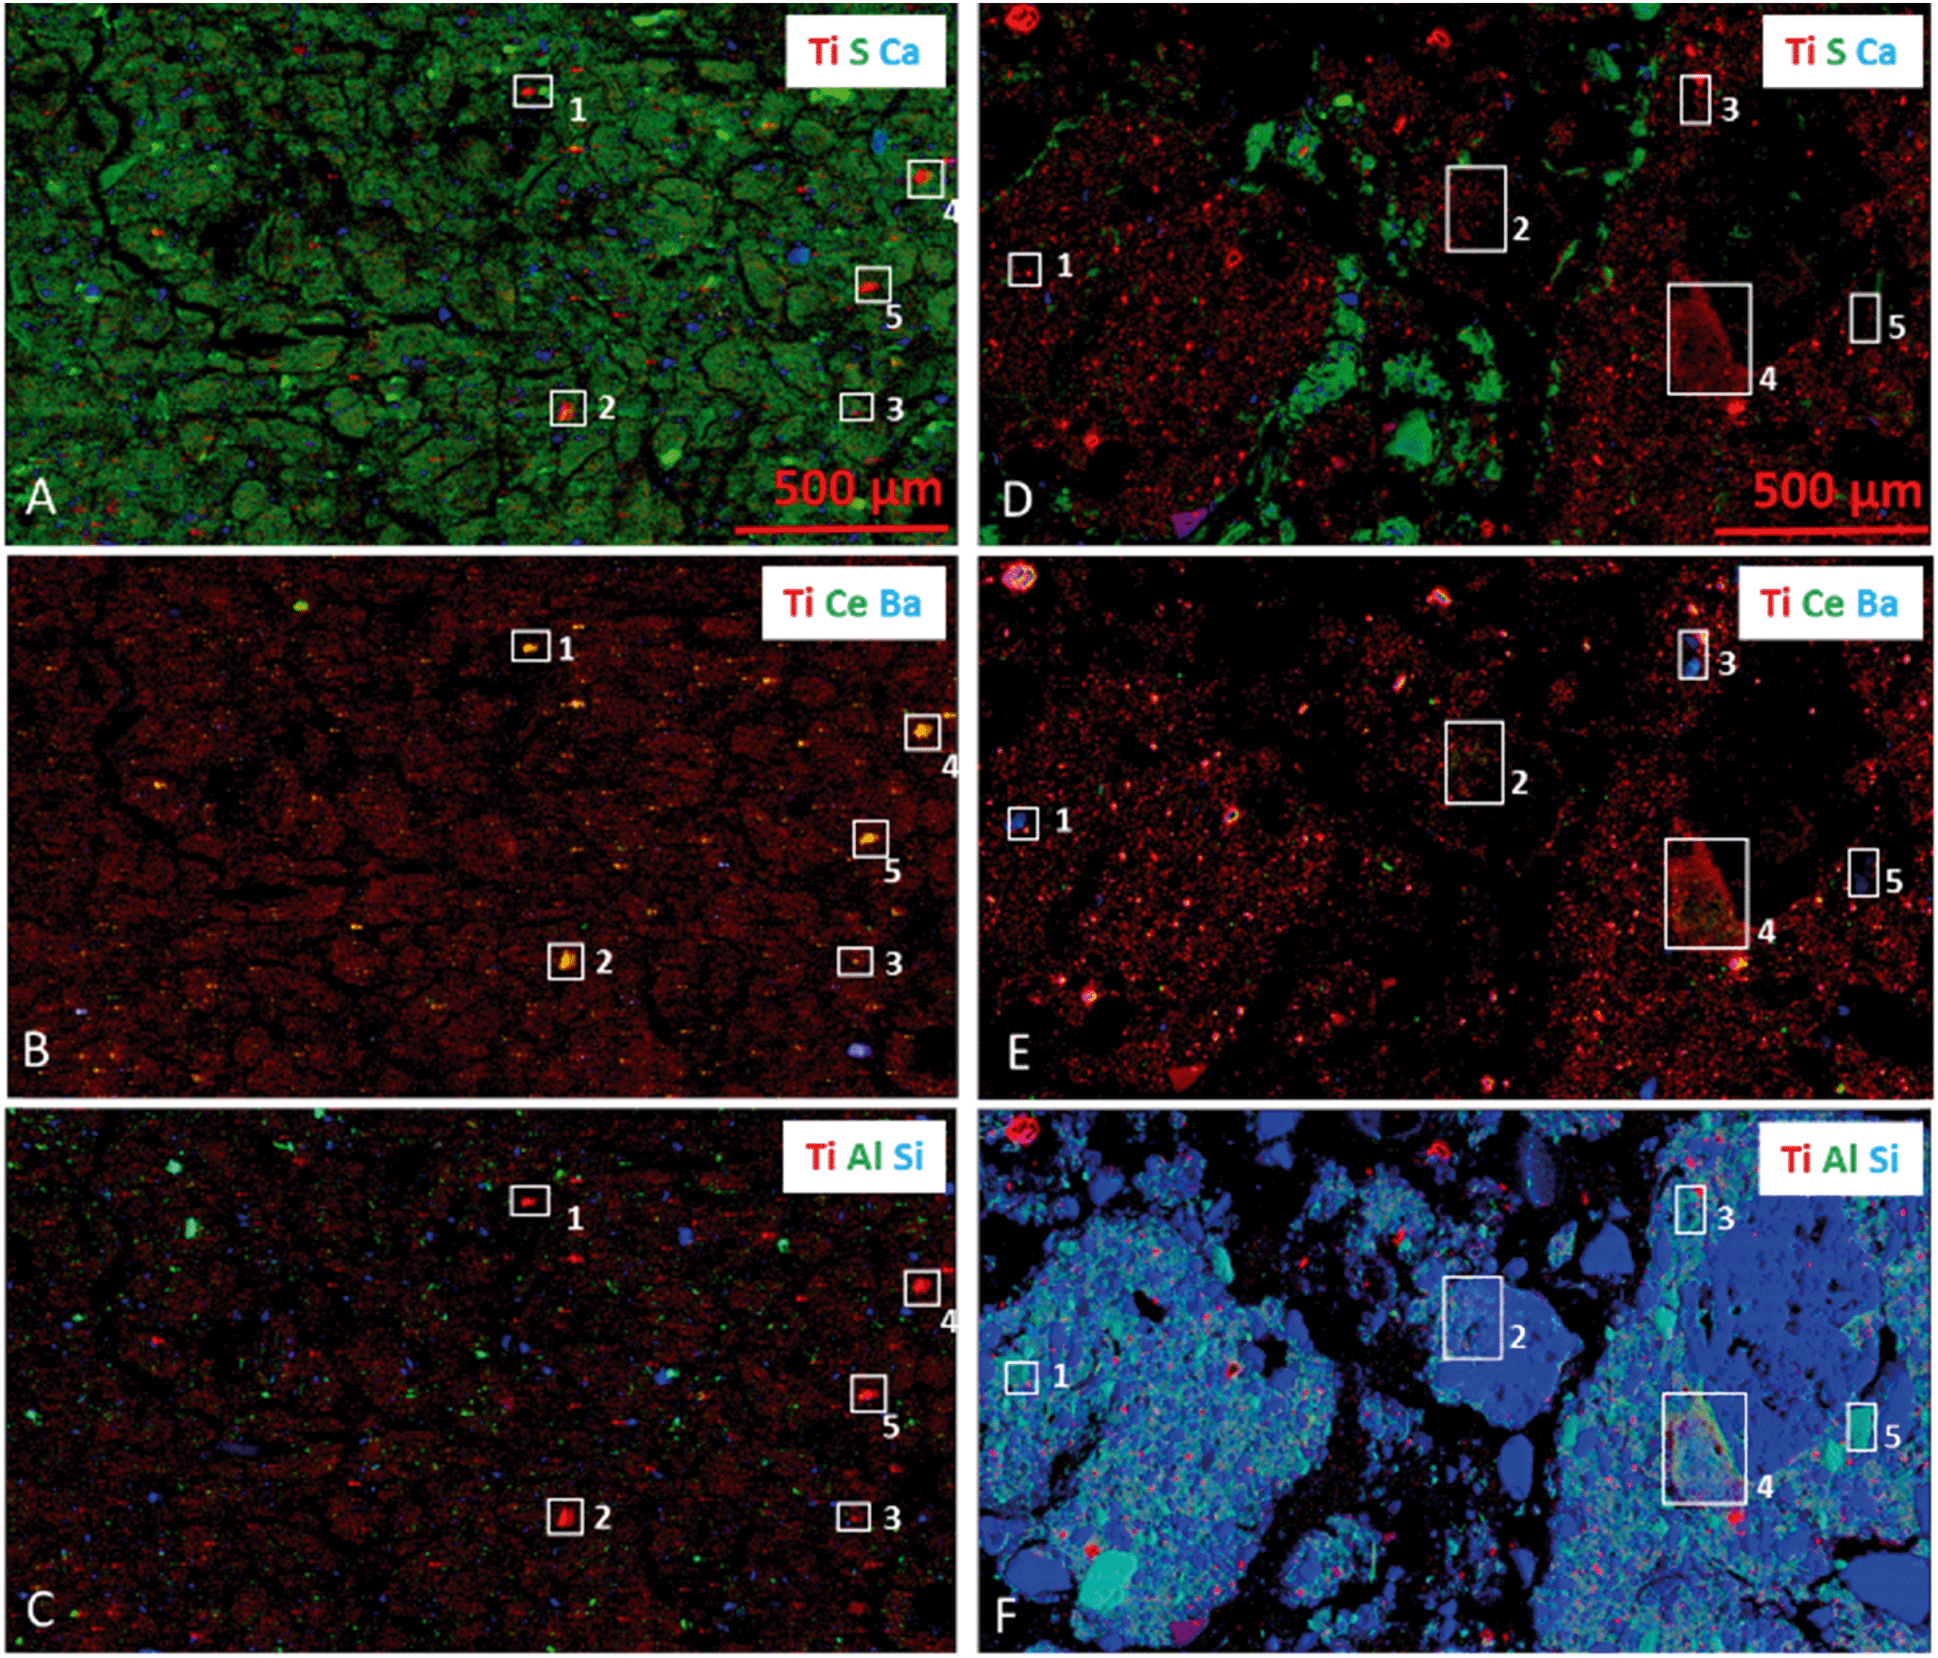 | ||
| Fig. 2 Tricolor μXRF maps for the sewage sludge (A–C) and for the sludge-amended soil (D–F). Incident energy: 5.8 keV, step size: 3 × 3 μm, dwell time: 100 ms. XRF spectra were extracted from the white rectangles and for the Ba-rich pixels of the whole maps (see Fig. S7 and S8†). | ||
The soil presented a typical structure, with organo-mineral micro (<250 μm) and macroaggregates (>250 μm)31 dominated by silicates and alumino-silicates (Fig. 2F), also containing organic compounds (appearing as S-containing regions in Fig. 2D) and Ca-containing phases (Fe could not be investigated at this energy but was also present, see the TEM-EDX section). These results were consistent with the Al, Si and S contents measured by ICP-MS. Ti-containing particles were mainly included in the soil aggregates, but Ti was not specifically colocalized with Si, Al, S or Ca. Some organic-rich particles, appearing in green in Fig. 2D, might result from the sludge amendment. They also contain red spots corresponding to Ti particles. Again, a possible association of Ti with Ba and Ce on the micrometer scale was suggested (Fig. 2E) and further investigated based on the extracted XRF spectra. Among the five regions analyzed, all contained Ba in addition to Ti, and two contained Ce as well in lower amounts (Fig. S8a†). However, considering the entire map, the Ti–Ba co-localization concerned only 5.5% of the Ti-rich regions (Fig. S8b–d†), and the Ti–Ba–Ce even less (not shown). The Ba-rich spots, appearing as larger aggregates than in the sludge, contained significant amounts of Ti (Fig. S8c and d†), but the reverse was not true: the vast majority of Ti-rich regions did not contain Ba or Ce (Fig. S8c†). To conclude, although the sludge and soil presented some specificities concerning Ti–Ba–Ce elemental associations, these differences were marginal considering the entire pool of Ti-containing particles in each matrix.
3. Presence of nanosized Ti-containing particles in the sludge and sludge-amended soil
In order to examine the size distribution of sub-micrometer-sized Ti-containing particles, the thin sections were studied by nanoXRF. Fig. 3 compares Ti maps of the sludge and sludge-amended soil, and their particle size distributions obtained by image analysis. Particles with a diameter of less than 200 nm represented about 50% of the total number of particles for both matrices. Both matrices contained particles with a diameter of less than 100 nm in roughly the same proportion (26 ± 3 and 20 ± 5% for the sludge and sludge-amended soil, respectively).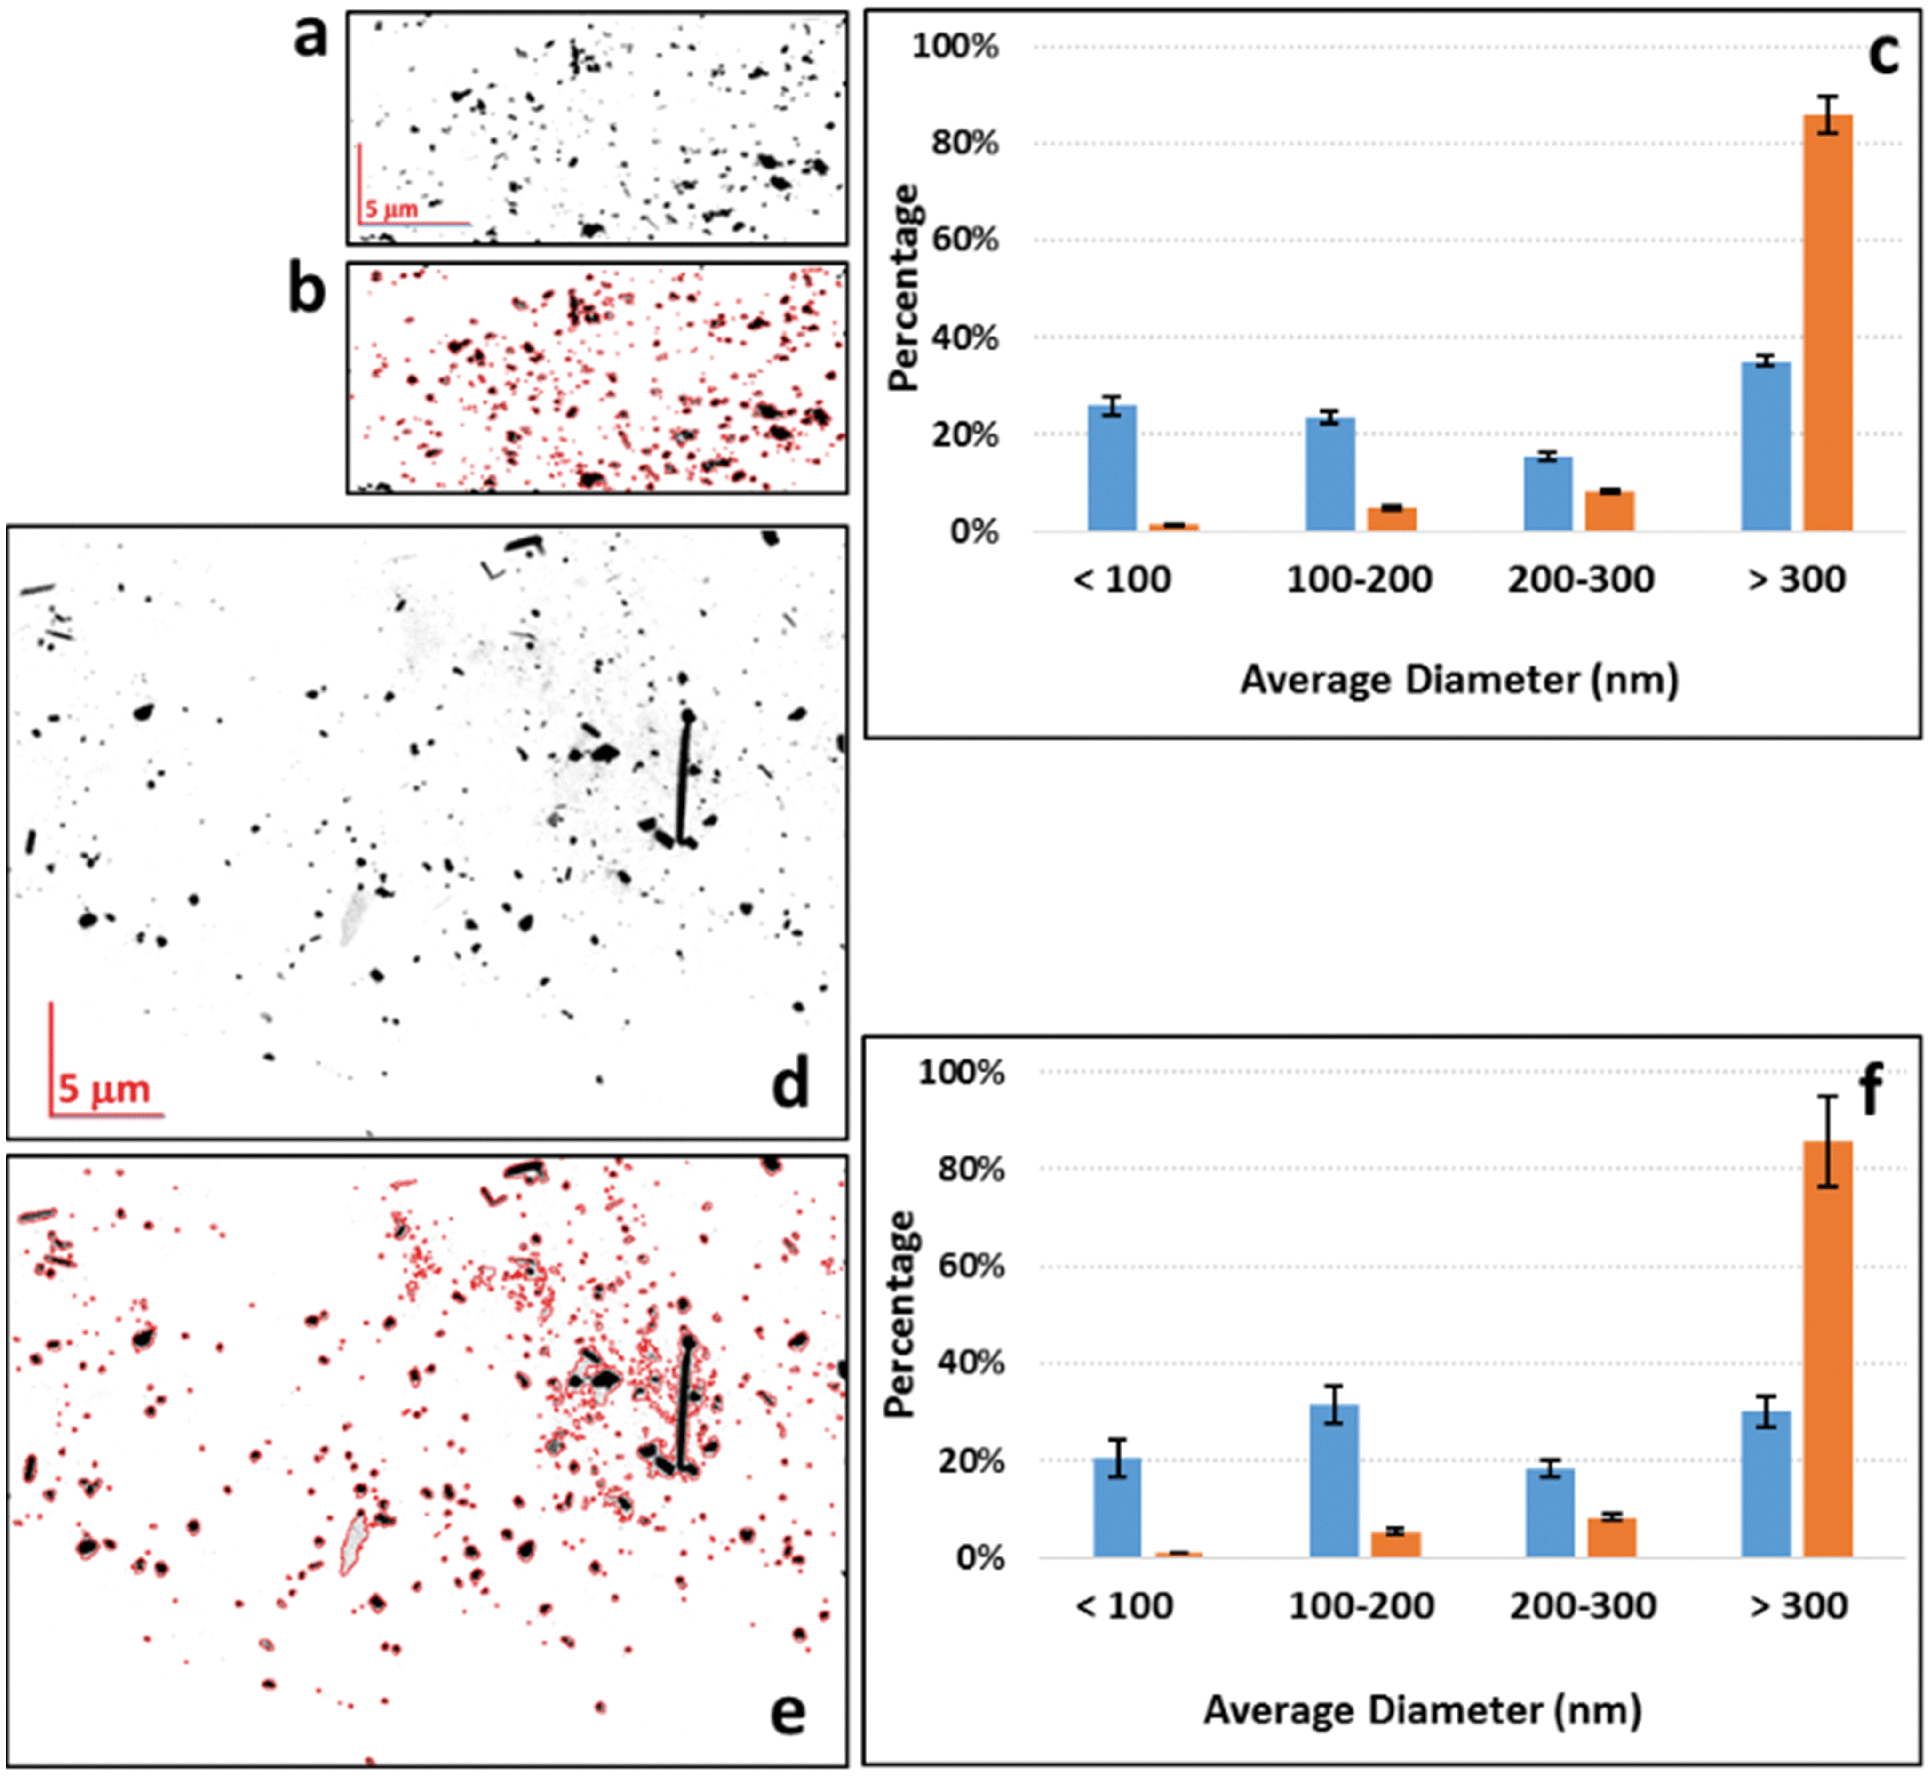 | ||
| Fig. 3 Ti maps obtained by nanoXRF for the sludge (a) and sludge-amended soil (d), particle image analysis of these maps (b and e, respectively), and particle diameter distribution obtained from these maps (c and f, respectively). The percentage of particles in terms of number is shown in blue, and the percentage of the Ti area in orange. | ||
4. TEM-EDX analyses of the sludge, soil and sludge-amended soil
The morphology and composition of the Ti-containing particles in the sludge, soil and sludge-amended soil were then studied by TEM-EDX. In the sludge, particles typical for TiO2 pigments (smooth particles, with diameters of around 100–200 nm) were found (Fig. 4). They were present either as small homoaggregates (Fig. 4E) or forming heteroaggregates with organic matter and other particles (Fig. 4B and C). The EDX analysis confirmed the presence of pure TiO2 (Fig. 4F).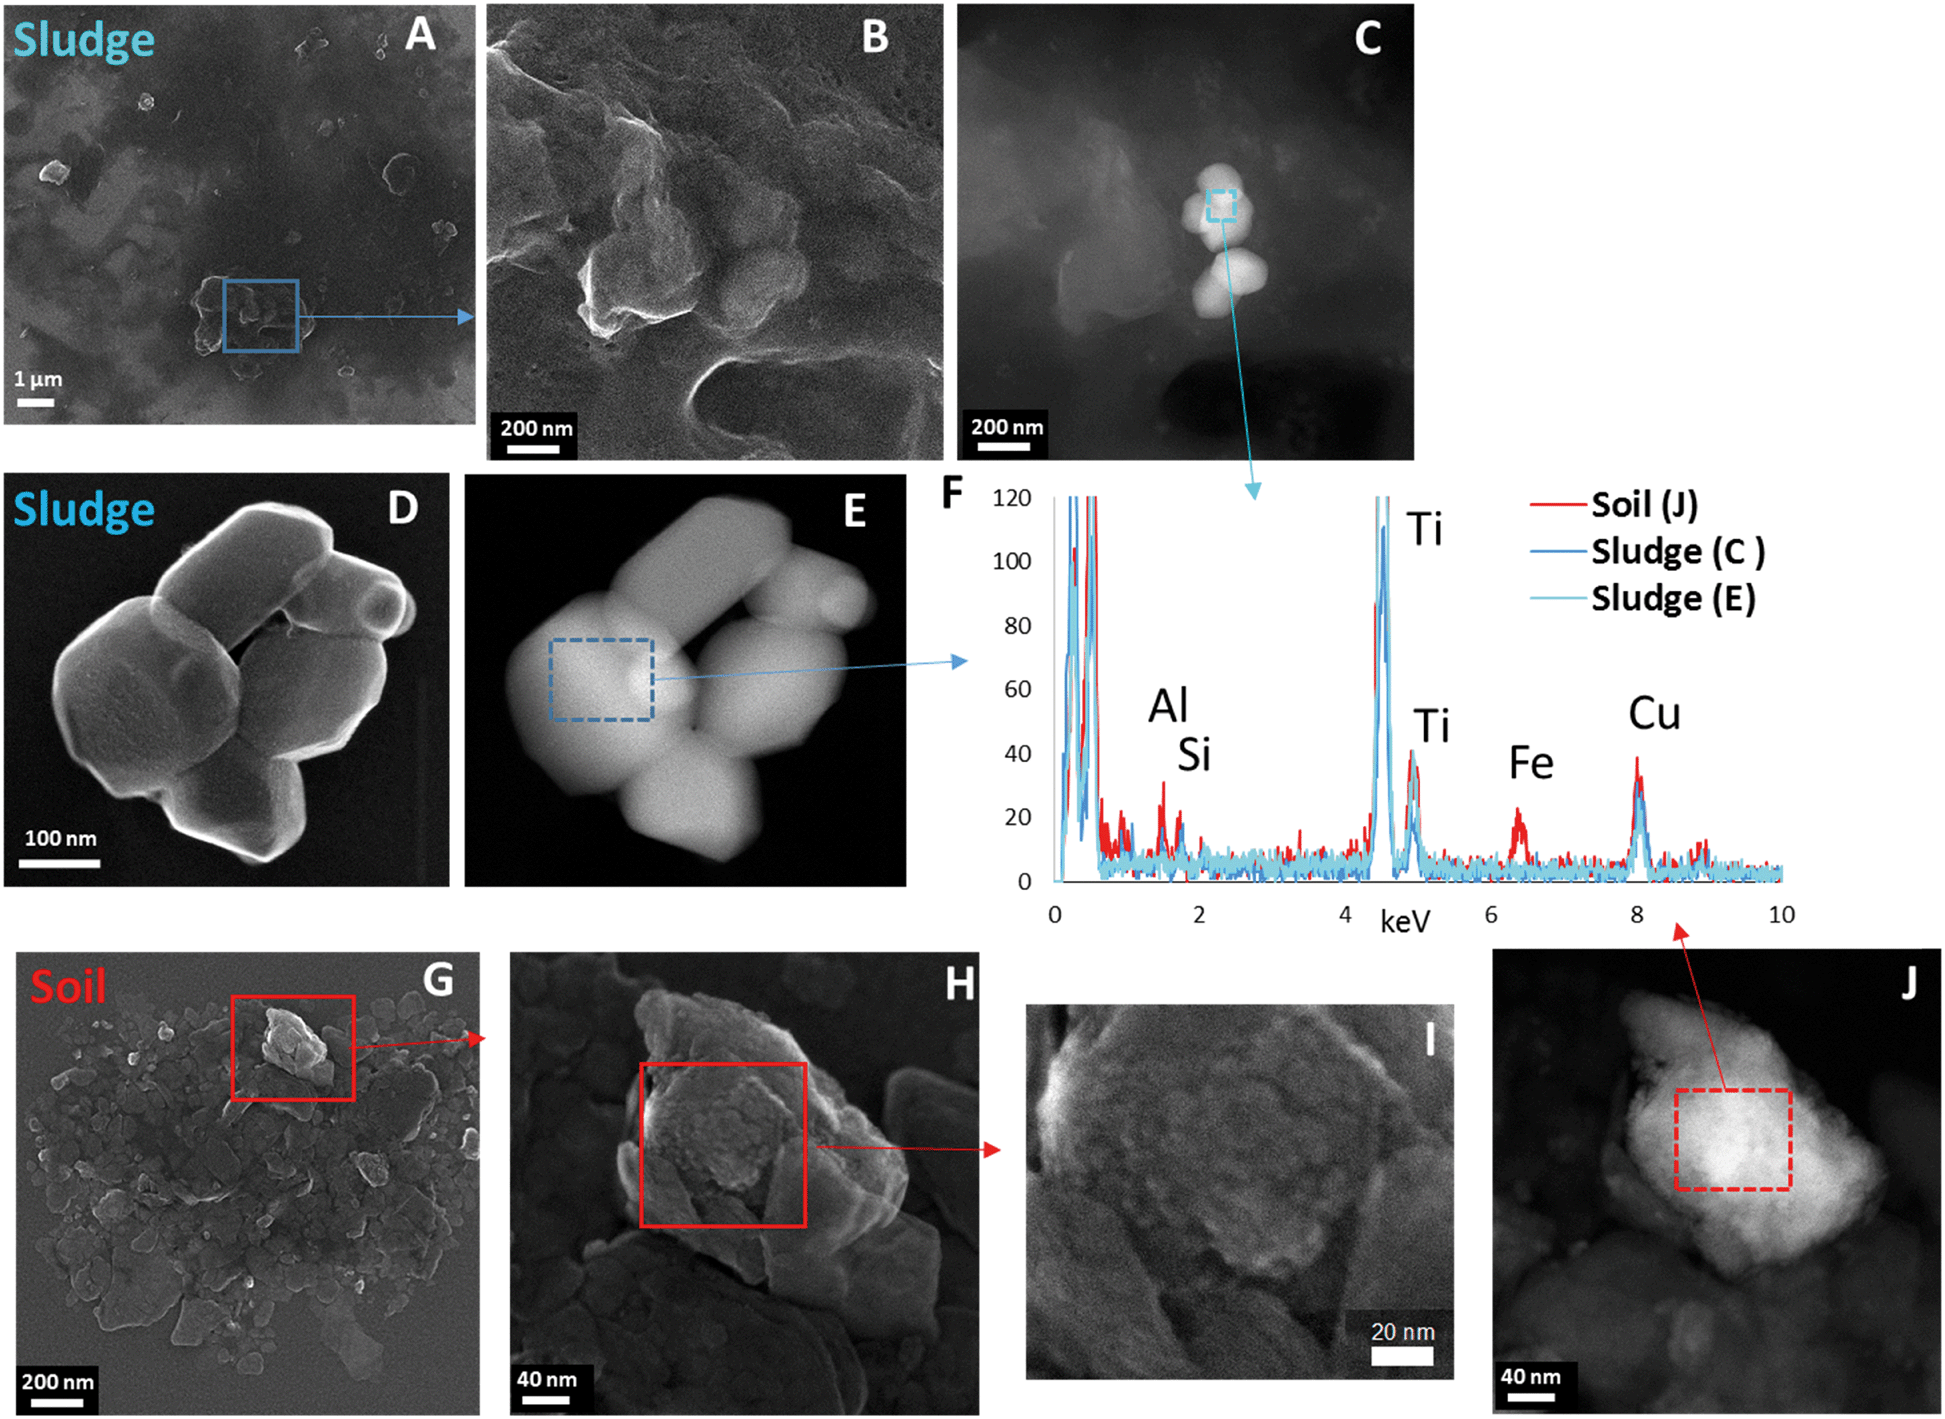 | ||
| Fig. 4 TEM-EDX analyses of the sludge (A–F) and the soil (F–J). A, B, D and G–I are secondary electron images, and C, E and J are high angle annular dark field images. F: EDX spectra of the areas indicated in C, E and J. | ||
In the soil, heteroaggregates containing TiO2 micro- and nanoparticles with a more irregular shape and a rough surface were observed, intimately associated with Fe-bearing phases (Fig. 4F–J) and other minerals containing Al, Si and Mn (not shown). As expected, the sludge + soil mixture contained both types of particles (not shown). No Ba- or Ce-bearing phases were identified, which is not surprising given the limited number of EDX spectra recorded and the fact that μXRF analysis showed that only 5.5% of the Ti-rich regions contained Ba.
5. Rutile and anatase as major Ti species in the sludge and soil
Ti speciation was studied by bulk Ti K-edge XANES spectroscopy to search for possible differences in the nature of Ti species and in their proportions. For the sludge, the spectra could be decomposed into a mixture of anatase and rutile (Fig. 5, Table S2†). The presence of these two species was further confirmed by XRD (Fig. S9†). Rutile and anatase were also present in the soil and sludge-amended soil, as well as amorphous TiO2 (Fig. 5 and S9, Table S2†). The sludge contained 55 ± 1% anatase and 45 ± 2% rutile (average and SD calculated from replicate samples, normalized to 100%). The soil contained 37 ± 2% anatase and 49 ± 7% rutile and 14 ± 6% amorphous TiO2 (same calculation). The sludge-amended soil contained 31 ± 11% anatase, 43 ± 1% rutile and 28 ± 9% amorphous TiO2. This latter percentage is slightly higher than expected based on the percentages found in the soil and sludge, and may arise from some sample heterogeneity. Although our library of Ti standards did not contain Ti-substituted silicates or aluminosilicates, these species are probably marginal. Indeed, they present a specific spectral signature, with an intense second peak in the pre-edge structure, which is also slightly shifted compared to Ti oxides.32 The presence of high temperature Ti oxides, the so-called Magnéli phases,33 could not be tested by XANES spectroscopy, but were ruled out based on XRD analyses (Fig. S9†). The sensitivity of XAS LCF analyses is commonly estimated to be 5 to 10% of the target element.20 Considering that experimental spectra were correctly reproduced with rutile, anatase and amorphous TiO2, other species possibly present should not account for more than 5 to 10% of the total Ti. | ||
| Fig. 5 Bulk Ti K-edge XANES spectra of the sewage sludge, soil, and sludge-amended soil and linear combination fits using rutile and anatase reference compounds (dotted lines). The proportion of rutile and anatase is shown as a bar chart. The values are given in Table S2.† | ||
6. Relationship between the size of particles or aggregates and Ti speciation
To study the relationship between Ti speciation and the size of particles or aggregates as evaluated by μXRF, Ti μXANES spectra were recorded on various spots of the μXRF maps (Fig. 6). This analysis was done for the sludge only. The largest and brightest Ti spots, corresponding to the larger particles or aggregates (from a few to a few tens of μm in diameter), were dominated by either rutile (e.g., points 1 and 3 in Fig. 6, Table S3†) or anatase (e.g., points 2 and 5). The regions corresponding to particles smaller than 1 μm contained generally a mixture of the two polymorphs (e.g., points fXAS2 and fXAS3). Given the size characterization presented above, this second family likely includes a significant proportion of nanosized particles. These results suggest that the rutile-to anatase ratio is independent of the particle size. To confirm this hypothesis, a larger number of μXANES spectra were recorded from the sludge thin sections and the proportions of rutile and anatase were derived from LCF analyses (Fig. S10 and S11 and Table S4†). The proportions of rutile and anatase in the individual particles were compared to the size of the respective particles or aggregates. Due to the limited spatial resolution of μXRF and μXANES, the particles or aggregates were grouped into two size categories (>1 μm and <1 μm) (Fig. 7). Particles or aggregates larger than 1 μm were dominated (>80%) either by rutile or anatase, or contained a mixture of the two (between 20 and 80% of each). Particles or aggregates smaller than 1 μm contained mostly a mixture of both polymorphs. Thus, within the resolution of the instrument (X-ray beam size of 0.7 × 0.3 μm), we found no relationship between the size of Ti-rich particles/aggregates and their Ti speciation. Finally, although amorphous TiO2 was not detected by bulk XANES (see paragraph 5), it was found as a minor species by μXANES in some of the regions analyzed (Table S3†). Based on the detection limit discussed previously, this species is present in the sludge but accounts for less than 5 to 10% of the total Ti.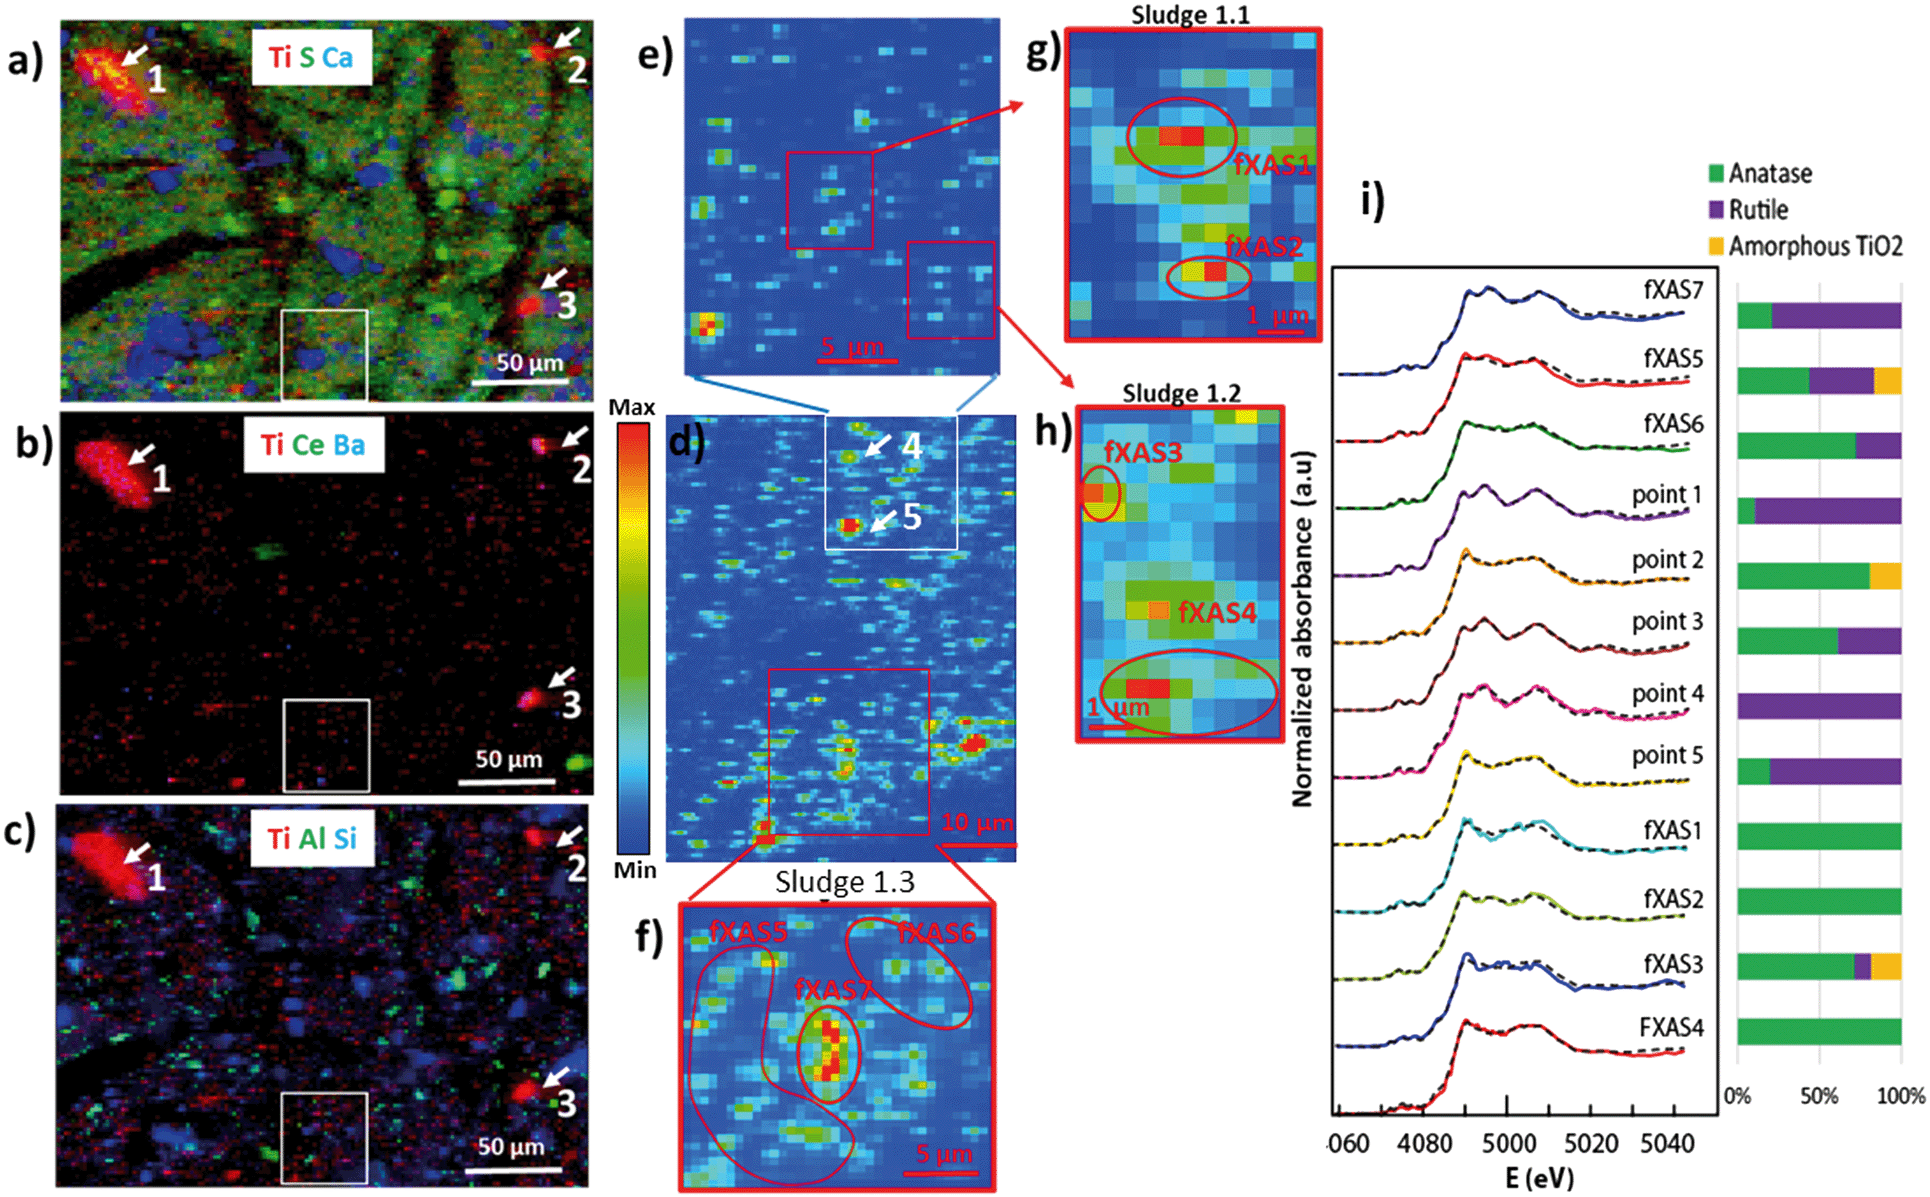 | ||
| Fig. 6 a–c) Tricolor μXRF maps for the sewage sludge showing the distribution of Ti, S, Ca, Ce, Ba, Al and Si. d–h) μXRF heat maps showing the Ti distribution. Map d corresponds to the white inset in maps a–c. Map e corresponds to the white inset in d, and maps g, h and f correspond to the red insets in e and d. The white arrows in a–c indicate points where μXANES spectra were collected. The red circles indicate areas where μXANES spectra were collected in FXAS mapping mode. I) Ti μXANES spectra recorded on the various spots and linear combination fits (dashed lines). The percentages of anatase, rutile and amorphous TiO2 are indicated as bars, and the values are given in Table S3.† | ||
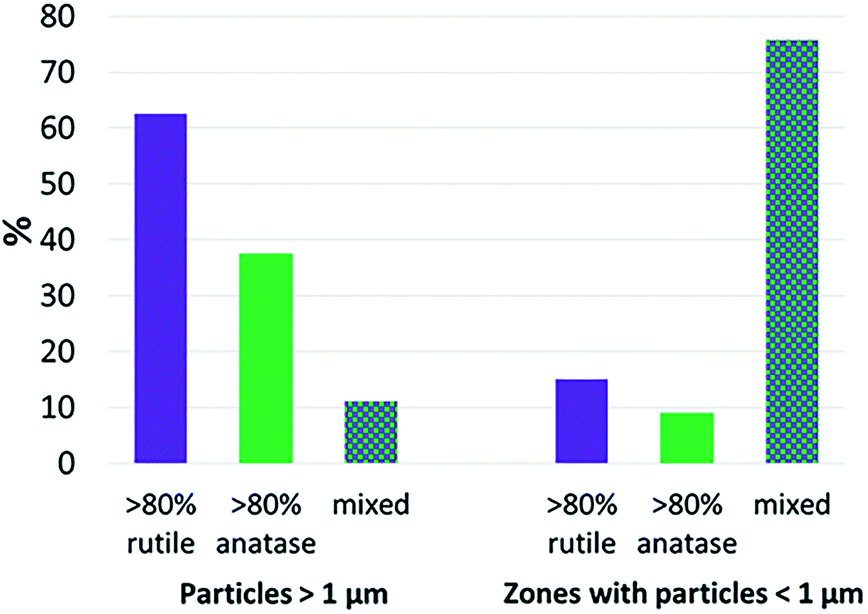 | ||
| Fig. 7 Percentage of particles or aggregates in which rutile is dominant (it accounts for more than 80% of the total Ti), anatase is dominant (>80% of the total Ti), or containing a mixture (proportions of rutile and anatase between 20 and 80%). “>1 μm” corresponds to points 1 to 5, and sludge 1.3fXAS7, sludge SI-3.3fXAS1, and sludge SI-4.1fXAS1 zones (8 spectra in total). “<1 μm” corresponds to the other zones (33 spectra in total). Spectra sludge SI-3.9-fXAS1 and sludge SI-1.1, 3.1, 3.2, 4.2 and 4.3 were not included because they were intermediate between the two categories. | ||
Discussion
In the present study, the soil had a higher Ti content than the sewage sludge. However, the Ti content of soils and sewage sludge are variable and depend on the type of soil7 and on the wastewater origin,30 respectively. The expected flux of TiO2-NPs in soils due to biosolid application (40 to 90 μg kg−1 per year34) is extremely low compared to the high Ti background in soils (0.79 ± 0.11 g kg−1 in the present study). Thus, the identification of anthropogenic TiO2 particles in soil samples obviously requires parameters other than the total Ti content. TiO2 particles in the sewage sludge and soil occurred in variable sizes ranging from <100 to >300 nm. The presence of both micro and nanosized TiO2 in environmental compartments is consistent with previous findings.13,35 Concerning Ti bulk speciation, the sludge contained roughly half anatase and half rutile. Tong et al.13 found a slightly higher proportion of rutile (60%), as well as anatase (30%) and amorphous TiO2 (10%), in sewage sludge from a WWTP in Illinois. The major use of TiO2 in consumer products is as a pigment, designated as E171 in food. This pigment is sold as pure rutile, pure anatase, or as a mixture of the two polymorphs.2,9 TiO2 contained in sewage sludge is a combination of TiO2 released from consumer products and excreted after food ingestion. The present study suggests roughly equal proportions of rutile and anatase in these products. This information is important because rutile and anatase have different toxicities, and it is very difficult to know (i) which polymorph is used in which type of product and (ii) the global proportions of rutile and anatase released into the environment. Screening of biosolids of various origins (municipal, industrial, agricultural) would help to refine this first insight. Amorphous TiO2 species was detected by μXANES in the sludge but it accounted for less than 5 to 10% of the total Ti. Likewise, it was present as a minor species in the sewage sludge studied by Tong et al.13 This species may come from engineered nanocomposites (see Introduction); it may also result from the weathering of Ti-containing minerals.The soil contained 37 ± 2% anatase, 49 ± 7% rutile and 14 ± 6% amorphous TiO2. In soils, the rutile to anatase ratio depends on the bedrock composition, external inputs and weathering conditions. Although TiO2 phases are generally considered as very weakly soluble, they undergo weathering and transformations under extreme conditions such as in lateritic36 or acidic soils with high proportions of organic and/or inorganic acids (ref. 35 and references therein). Such changes may also be favored under the specific physico-chemical conditions of the rhizosphere, as observed for other types of weakly soluble minerals.37,38 Rutile is less soluble than anatase,39 so its proportion should increase with soil weathering. However, data available on soils do not show this trend. Dias et al.40 found both anatase and rutile in strongly weathered soil (Ferralsol), whereas Taboada et al.41 identified ilmenite and rutile in sandy loam in Spain. This can be due to the fact that anatase nanocrystals may precipitate from the weathering of minerals such as kaolinite, as observed in tropical soils,8 or smelter-derived minerals in contaminated soils.35 Data on Ti speciation in agricultural soils and sewage sludge is scarce. Screening of a range of soils would help to further explore the relationship between Ti speciation and soil type. To conclude, although a different speciation of Ti was observed between the sludge and the soil studied here, data in the literature suggest that these differences cannot be generalized to all soils and sewage sludges, since Ti speciation depends on their origin and weathering state. Besides, studying Ti speciation in sludge can provide a rough estimation of the proportion of anatase and rutile actually present in consumer products.
The relationship between the size of the particles or aggregates and Ti speciation was investigated for the sewage sludge. With the resolution of the μXRF used (0.3 × 0.7 μm beam size), there was no relationship between the size of the Ti-rich spots and Ti speciation. In particular, particles smaller than 1 μm were composed of both rutile and anatase polymorphs. A technique with a higher resolution would be necessary to further investigate the relationship between nominal particle size and Ti speciation. TEM coupled with electron diffraction (SAED) would be adequate,12 but such analysis is generally limited to a few particles.
The morphology of the TiO2 particles observed by TEM can help to discriminate natural vs. anthropogenic TiO2. The TiO2 particles observed in the sludge have a regular, faceted shape and a smooth surface, with a diameter generally between 100 and a few hundreds of nm. They are typical of TiO2 pigments (rutile) used in consumer products and observed in landfill leachates42 and sewage sludge.12 On the other hand, the irregular shapes and rough surfaces of TiO2 particles observed in soil samples may be used as a criterion to identify natural TiO2. Irregular anatase crystals were also observed in mine-impacted soil.35 Of course these are general trends, and irregular TiO2-NPs may be present in sewage sludge as well, as observed by Kiser et al.,10 and a large number of individual analyses are required to get conclusive results.
Eventually, a possible criterion to distinguish natural vs. anthropogenic TiO2 may be the structure and composition of heteroaggregates. As shown recently by Schindler & Hochella,35 the nature and arrangement of mineral assemblages in soils are likely to provide insights into their origin and history. In the soil, TiO2 was included in micro- and macroaggregates, intimately associated with a variety of particles containing Fe, Mn, Si and Al, as observed by TEM-EDX. An association with Ba and Ce was observed for a minority of Ti particles by μXRF. Soil aggregates result from abiotic and biotic processes taking place over decades or more,31 and TiO2 included in these structures is very likely of natural origin. In the sludge, TiO2 particles were present both as homo- and as hetero-microaggregates dominated by organic matter. Unlike soil aggregates, these structures are likely the result of rapid aggregation due to surface charge interactions during the water treatment process. In the sludge microaggregates, elemental associations with Fe, Mn, Si, Al, Ba and Ce were less frequent; the association was mostly with organic matter.
Conclusions
The total Ti content, particle size distribution, Ti speciation and Ti speciation as a function of particle size proved inefficient at discriminating natural vs. anthropogenic TiO2 particles in soil. On the other hand, a detailed description of the morphology and status of TiO2 particles within micro and macroaggregates may provide important insights into their origin. Thus, fine observation of these structures, in a systematic way and for a statistically significant number of analyses, should provide insights into the origin of TiO2 particles. The sample preparation may be a crucial factor for the preservation of these aggregates, and the study of undisturbed soils is recommended. The observed differences in particle morphology and mineral assemblages may attenuate over time, due to the weathering of TiO2 minerals and the incorporation of the sludge material within the soil structure, although these processes probably take decades. Further investigations on the weathering of TiO2 particles in simplified systems and on the evolution of TiO2-containing aggregates after addition of sewage sludge would be needed to estimate the time necessary for complete incorporation of anthropogenic TiO2 into soil aggregates.Conflicts of interest
There is no conflict to declare.Acknowledgements
We thank the French program LabEx Serenade (ANR-11-LABX-0064) for providing a post doc fellowship and COST ES1205 (ENTER) for funding this project, and EquipEx NanoID (ANR-10-EQPX-0039) for funding equipment needed for the project. ISTerre is also part of Labex OSUG@2020 (ANR10 LABX56). Juan Reyes-Herrera acknowledges the Mexican National Council for Science and Technology (CONACYT) for the funding of his post-doctoral position (CONACYT CVU#177448). We thank the ESRF committee for the provision of beamtime and the staff of ID21, ID16b and BM25 for their assistance during measurements. The HR-ICP-MS was run by Frederic Candaudap (GET) and Gael Le Roux (EcoLab). We thank Delphine Tisserand, Sarah Bureau and Sylvain Campillo at ISTerre for their technical support, and Fayçal Soufi at Edytem (Chambery, France) for preparing the thin sections. We also thank Brian Sinnet of EAWAG who helped in the sewage sludge production, Hengzhong Zhang for sharing the Ti XANES spectrum of amorphous TiO2, and two anonymous reviewers for their comments and suggestions.References
- F. Piccinno, F. Gottschalk, S. Seeger and B. Nowack, Industrial production quantities and uses of ten engineered nanomaterials in Europe and the world, J. Nanopart. Res., 2012, 14, 1109 CrossRef.
- A. Weir, P. Westerhoff, L. Fabricius, K. Hristovski and N. von Goetz, Titanium Dioxide Nanoparticles in Food and Personal Care Products, Environ. Sci. Technol., 2012, 46, 2242–2250 CrossRef CAS PubMed.
- F. Z. Wang, Z. A. Tan and Y. F. Li, Solution-processable metal oxides/chelates as electrode buffer layers for efficient and stable polymer solar cells, Energy Environ. Sci., 2015, 8, 1059–1091 RSC.
- H. Xiong, M. D. Slater, M. Balasubramanian, C. S. Johnson and T. Rajh, Amorphous TiO2 Nanotube Anode for Rechargeable Sodium Ion Batteries, J. Phys. Chem. Lett., 2011, 2, 2560–2565 CrossRef CAS.
- T. Y. Sun, F. Gottschalk, K. Hungerbuehler and B. Nowack, Comprehensive probabilistic modelling of environmental emissions of engineered nanomaterials, Environ. Pollut., 2014, 185, 69–76 CrossRef CAS PubMed.
- M. Kah, S. Beulke, K. Tiede and T. Hofmann, Nanopesticides: State of Knowledge, Environmental Fate, and Exposure Modeling, Crit. Rev. Environ. Sci. Technol., 2013, 43, 1823–1867 CrossRef CAS.
- A. Kabata-Pendias and H. Pendias, Trace Elements in Soils and Plants, Boca Raton, Florida, 3rd edn, 2001 Search PubMed.
- S. Cornu, Y. Lucas, E. Lebon, J. P. Ambrosi, F. Luizao, J. Rouiller, M. Bonnay and C. Neal, Evidence of titanium mobility in soil profiles, Manaus, central Amazonia, Geoderma, 1999, 91, 281–295 CrossRef CAS.
- S. Bettini, E. Boutet-Robinet, C. Cartier, C. Coméra, E. Gaultier, J. Dupuy, N. Naud, S. Taché, P. Grysan, S. Reguer, N. Thieriet, M. Réfrégiers, D. Thiaudière, J.-P. Cravedi, M. Carrière, J.-N. Audinot, F. H. Pierre, L. Guzylack-Piriou and E. Houdeau, Food-grade TiO2 impairs intestinal and systemic immune homeostasis, initiates preneoplastic lesions and promotes aberrant crypt development in the rat colon, Sci. Rep., 2017, 7, 40373 CrossRef CAS PubMed.
- M. A. Kiser, P. Westerhoff, T. Benn, Y. Wang, J. Pérez-Rivera and K. Hristovski, Titanium Nanomaterial Removal and Release from Wastewater Treatment Plants, Environ. Sci. Technol., 2009, 43, 6757–6763 CrossRef CAS PubMed.
- P. Westerhoff, G. Song, K. Hristovski and M. A. Kiser, Occurrence and removal of titanium at full scale wastewater treatment plants: implications for TiO2 nanomaterials, J. Environ. Monit., 2011, 13, 1195–1203 RSC.
- B. Kim, M. Murayama, B. P. Colman and M. F. Hochella, Characterization and environmental implications of nano- and larger TiO2 particles in sewage sludge, and soils amended with sewage sludge, J. Environ. Monit., 2012, 14, 1129–1137 RSC.
- T. Z. Tong, A. N. Hill, M. A. Alsina, J. S. Wu, K. Y. Shang, J. J. Kelly, K. A. Gray and J. F. Gaillard, Spectroscopic Characterization of TiO2 Polymorphs in Wastewater Treatment and Sediment Samples, Environ. Sci. Technol. Lett., 2015, 2, 12–18 CrossRef CAS.
- M. D. Montaño, G. V. Lowry, F. von der Kammer, J. Blue and J. F. Ranville, Current status and future direction for examining engineered nanoparticles in natural systems, Environ. Chem., 2014, 11, 351–366 CrossRef.
- A. Praetorius, A. Gundlach-Graham, E. Goldberg, W. Fabienke, J. Navratilova, A. Gondikas, R. Kaegi, D. Gunther, T. Hofmann and F. von der Kammer, Single-particle multi-element fingerprinting (spMEF) using inductively-coupled plasma time-of-flight mass spectrometry (ICP-TOFMS) to identify engineered nanoparticles against the elevated natural background in soils, Environ. Sci.: Nano, 2017, 4, 307–314 RSC.
- W. Kim, C. Yeom, H. Lee, H. Sung, E. Jo, I. C. Eom and Y. Kim, Feasibility study on the differentiation between engineered and natural nanoparticles based on the elemental ratios, Korean J. Chem. Eng., 2017, 34, 3208–3213 CrossRef CAS.
- A. E. Pradas del Real, H. Castillo-Michel, R. Kaegi, B. Sinnet, V. Magnin, N. Findling, J. Villanova, M. Carriere, C. Santaella, A. Fernandez-Martinez, C. Levard and G. Sarret, Fate of Ag-NPs in sewage sludge after application on agricultural soils, Environ. Sci. Technol., 2016, 50, 1759–1768 CrossRef CAS PubMed.
- C. Larue, C. Baratange, D. Vantelon, H. Khodja, S. Surblé, A. Elger and M. Carrière, Influence of soil type on TiO2 nanoparticle fate in an agro-ecosystem, Sci. Total Environ., 2018, 630, 609–617 CrossRef CAS PubMed.
- V. Solé, E. Papillon, M. Cotte, P. Walter and J. Susini, PyMCA: A multiplatform code for the analysis of energy-dispersive X-ray f luorescence spectra, Spectrochim. Acta, Part B, 2007, 62, 63–68 CrossRef.
- H. Castillo-Michel, C. Larue, A.-E. Pradas del Real, M. Cotte and G. Sarret, Practical review on the use of synchrotron based micro- and nano- X-ray fluorescence mapping and X-ray absorption spectroscopy to investigate the interactions between plants and engineered nanomaterials, Plant Physiol. Biochem., 2017, 110, 13–32 CrossRef CAS PubMed.
- K. Marstal, F. Berendsen, M. Staring and S. Klein, SimpleElastix: A User-Friendly, Multi-lingual Library for Medical Image Registration, 2016 IEEE Conference on Computer Vision and Pattern Recognition Workshops (CVPRW), 2016, pp. 574–582 Search PubMed.
- B. Ravel and M. Newville, ATHENA and ARTEMIS: Interactive graphical data analysis using IFEFFIT, J. Synchrotron Radiat., 2005, 12, 537–541 CrossRef CAS PubMed.
- C. Larue, H. Castillo-Michel, S. Sobanska, N. Trcera, S. Sorieul, L. Cécillon, L. Ouerdane, S. Legros and G. Sarret, Fate of pristine TiO2 nanoparticles and aged paint-containing TiO2 nanoparticles in lettuce crop after foliar exposure, J. Hazard. Mater., 2014, 273, 17–26 CrossRef CAS PubMed.
- H. Z. Zhang, B. Chen, J. F. Banfield and G. A. Waychunas, Atomic structure of nanometer-sized amorphous TiO2, Phys. Rev. B: Condens. Matter Mater. Phys., 2008, 78, 214106 CrossRef.
- G. Martínez-Criado, J. Villanova, R. Tucoulou, D. Salomon, J.-P. Suuronen, S. Labouré, C. Guilloud, V. Valls, R. Barrett, E. Gagliardini, Y. Dabin, R. Baker, S. Bohic, C. Cohen and J. Morse, ID16B: a hard X-ray nanoprobe beamline at the ESRF for nano-analysis, J. Synchrotron Radiat., 2016, 23, 344–352 CrossRef PubMed.
- C. T. Rueden, J. Schindelin, M. C. Hiner, B. E. DeZonia, A. E. Walter, E. T. Arena and K. W. Eliceiri, ImageJ2: ImageJ for the next generation of scientific image data, BMC Bioinf., 2017, 18, 529 CrossRef PubMed.
- E. Salas-Colera, Á. Muñoz-Noval, C. Heyman, C. O. Ania, J. B. Parra, S. García-Granda, S. Calero, J. Rubio-Zuazo and G. R. Castro, Design and development of a controlled pressure/temperature set-up for in situ studies of solid–gas processes and reactions in a synchrotron X-ray powder diffraction station, J. Synchrotron Radiat., 2015, 22, 42–48 CrossRef CAS PubMed.
- C. Reimann and P. de Caritat, New soil composition data for Europe and Australia: Demonstrating comparability, identifying continental-scale processes and learning lessons for global geochemical mapping, Sci. Total Environ., 2012, 416, 239–252 CrossRef CAS PubMed.
- P. Négrel, A. Ladenberger, C. Reimann, M. Birke and M. Sadeghi, Distribution of Rb, Ga and Cs in agricultural land soils at European continental scale (GEMAS): Implications for weathering conditions and provenance, Chem. Geol., 2018, 479, 188–203 CrossRef.
- B. Vriens, A. Voegelin, S. Hug, R. Kaegi, L. Winkel, A. Buser and M. Berg, Quantification of Element Fluxes in Wastewaters: A Nationwide Survey in Switzerland, Environ. Sci. Technol., 2017, 51, 10943–10953 CrossRef CAS PubMed.
- K. U. Totsche, W. Amelung, M. H. Gerzabek, G. Guggenberger, E. Klumpp, C. Knief, E. Lehndorff, R. Mikutta, S. Peth, A. Prechtel, N. Ray and I. Kogel-Knabner, Microaggregates in soils, J. Plant Nutr. Soil Sci., 2018, 181, 104–136 CrossRef CAS.
- G. A. Waychunas, Synchrotron radiation XANES spectroscopy of Ti in minerals - Effects of Ti bonding distances, Ti valence and site geometry on absorption-edge structure, Am. Mineral., 1987, 72, 89–101 CAS.
- Y. Yang, B. Chen, J. Hower, M. Schindler, C. Winkler, J. Brandt, R. Di Giulio, J. Ge, M. Liu, Y. Fu, L. Zhang, Y. Chen, S. Priya and M. F. Hochella, Discovery and ramifications of incidental Magnéli phase generation and release from industrial coal-burning, Nat. Commun., 2017, 8, 194 CrossRef PubMed.
- F. Gottschalk, T. Sonderer, R. W. Scholz and B. Nowack, Modeled environmental concentrations of engineered nanomaterials (TiO2, ZnO, Ag, CNT, fullerenes) for different regions, Environ. Sci. Technol., 2009, 43, 9216–9222 CrossRef CAS PubMed.
- M. Schindler and M. F. Hochella, Nanomineralogy as a new dimension in understanding elusive geochemical processes in soils: The case of low-solubility-index elements, Geology, 2016, 44, 515–518 CrossRef CAS.
- X. Du, A. W. Rate and M. A. M. Gee, Redistribution and mobilization of titanium, zirconium and thorium in an intensely weathered lateritic profile in Western Australia, Chem. Geol., 2012, 330, 101–115 CrossRef.
- P. Hinsinger, C. Plassard and B. Jaillard, Rhizosphere: A new frontier for soil biogeochemistry, J. Geochem. Explor., 2006, 88(1–3 Special Iss. SI), 210–213 CrossRef CAS.
- R. April and D. Keller, Mineralogy of the rhizosphere in forest soils of the eastern United States, Biogeochemistry, 2005, 9, 1–18 CrossRef.
- M. L. Avramescu, P. E. Rasmussen, M. Chenier and H. D. Gardner, Influence of pH, particle size and crystal form on dissolution behaviour of engineered nanomaterials, Environ. Sci. Pollut. Res., 2017, 24, 1553–1564 CrossRef CAS PubMed.
- N. M. P. Dias, D. Goncalves, W. C. Leite, A. M. Brinatti, S. C. Saab and L. F. Pires, Morphological characterization of soil clay fraction in nanometric scale, Powder Technol., 2013, 241, 36–42 CrossRef CAS.
- T. Taboada, A. M. Cortizas, C. Garcia and E. Garcia-Rodeja, Particle-size fractionation of titanium and zirconium during weathering and pedogenesis of granitic rocks in NW Spain, Geoderma, 2006, 131, 218–236 CrossRef CAS.
- R. Kaegi, A. Englert, A. Gondikas, B. Sinnet, F. von der Kammer and M. Burkhardt, Release of TiO2 – (Nano) particles from construction and demolition landfills, NanoImpact, 2017, 8, 73–79 CrossRef.
Footnote |
| † Electronic supplementary information (ESI) available. See DOI: 10.1039/c8en00386f |
| This journal is © The Royal Society of Chemistry 2018 |