 Open Access Article
Graphene oxide impairs the pollen performance of Nicotiana tabacum and Corylus avellana suggesting potential negative effects on the sexual reproduction of seed plants†
Fabio
Candotto Carniel
 *a,
Davide
Gorelli
b,
Emmanuel
Flahaut
 c,
Lorenzo
Fortuna
 a,
Cecilia
Del Casino
b,
Giampiero
Cai
 b,
Massimo
Nepi
 b,
Maurizio
Prato
 de and
Mauro
Tretiach
 a
a
aDepartment of Life Sciences, University of Trieste, via L. Giorgieri 10, I-34127 Trieste, Italy. E-mail: fcandotto@units.it; Tel: +0039 0405583879
bDepartment of Life Sciences, University of Siena, via P. A. Mattioli 4, I-53100 Siena, Italy
cCIRIMAT, Université de Toulouse, CNRS, INPT, UPS, UMR CNRS-UPS-INP N° 5085, Université Toulouse 3 Paul Sabatier, Bât. CIRIMAT, 118, route de Narbonne, 31062 Toulouse cedex 9, France
dCentre of Excellence and Nanostructured Materials (CENMAT), INSTM, unit of Trieste, Department of Chemical and Pharmaceutical Sciences, University of Trieste, via L. Giorgieri 1, I-34127 Trieste, Italy
eCarbon Nanobiotechnology Laboratory, CIC biomaGUNE, Paseo de Miramón 182, E-20009 Donostia—San Sebastian, Spain
First published on 1st June 2018
Abstract
The production of graphene based materials (GBMs) is steadily increasing but the effects of the possible release of GBMs in the environment are far from being understood. Graphene oxide (GO) is among the most active GBMs and it causes widely varying effects on the vegetative body of seed plants. However, nothing is known yet about its potential effects on the reproductive process. This study addresses the effects of GO on pollen germination and pollen tube elongation in the model species Nicotiana tabacum and in the non-model species Corylus avellana. In vitro germination experiments were conducted without or with GO (control and treated samples, respectively) at concentrations of 25, 50 and 100 μg mL−1. Pollen germination and tube elongation were affected at GO concentrations ≥50 μg mL−1, decreasing by 20% and 19% in N. tabacum and by 68% and 58% in C. avellana, respectively. GO did not affect the viability of N. tabacum pollen, but doubled the frequency of bent tubes. Microscopy observations of pollen tubes exposed to a cell-permeant, dual-excitation ratiometric pH indicator revealed that GO affected the intracellular pH homeostasis. Further germination experiments on C. avellana conducted by inverting the pH conditions of the control and treated (100 μg GO mL−1) samples demonstrated that the main factor influencing the pollen performance is the acidic properties of GO. This might affect the reproductive process of numerous seed plants thus being relevant from an environmental point of view.
Environmental significanceThe introduction of graphene nanomaterials into the environment is raising concerns on environmental safety. Despite the increasing understanding of the toxic effects of graphene oxide (GO) on photoautotrophic organisms, nothing is known yet concerning the effects on the sexual reproduction of seed plants. We found that in vitro exposure to high concentrations of GO impairs the pollen performances of two species, the tobacco plant (Nicotiana tabacum L.) and the common hazel (Corylus avellana L.), due to the acidic properties of GO. For this reason, the pollen of numerous other plants might exhibit a similar sensitivity to GO. These results raise some concerns for the possible implications in different fields, from crop production to ecosystem functionality. |
Introduction
Graphene is “a two-dimensional crystal composed of monolayers of carbon atoms arranged in a honeycombed network with six-membered rings”1 and is the first 2D material made available.2 Graphene based materials (GBMs) have attracted wide interest in the last decade because they display extraordinary physical and chemical properties, such as supreme electrical and thermal conductivities and high surface area, clearly distinguishing them from graphite and carbon nanotubes. Therefore, GBMs are expected to be used more often in emerging applications in sectors such as optoelectronics, nanocomposites, biomedicine, energy generation and storage and high sensitivity sensors.2 The estimated annual production of graphene is around 120 tons3 but is supposed to increase to 1000 tons by 2019.4 Estimates for the GBM market foresee investments of almost $400 million by 2025,5 and industrial patent applications have promptly increased in recent years.4 Hence, an important part of the applications exploiting GBMs will likely end up in devices and objects of common use increasing the GBM demand. In this regard, GBM inclusion in the rubber of bike tires is already a reality (https://www.vittoria.com/graphene-evidence),6 whereas the inclusion in tires for motor vehicles is a patented application.7 Furthermore, new graphene oxide-Ag composites are being developed to fight crop plant diseases, such as the bacterial leaf blight (Xanthomonas oryzae pv. oryzae) affecting rice,8 through aerial applications. The large scale production of GBMs, wearing out of graphene-enriched products, and poor disposal of the derived wastes might result in a significant release and accumulation of GBMs in the environment, as has already happened for other synthetic materials such as plastics.9,10 Thanks to their dimensions from hundreds of nanometers to a few micrometers and to their extreme light-weight, GBM flakes or nanoparticles might be aero-dispersed as particulate matter with a diameter size ≤2.5 μm (PM2.5). Once aero-dispersed, PM2.5 can be transported for long distances, as reported for carbon black nano-particles,11 and eventually settle over the vegetation as wet or dry depositions. These premises raise important concerns about possible negative impacts of GBM release on the biota.So far, widely varying effects (including positive and negative) of GBMs on seed plants have been reported, possibly owing to different experimental conditions (materials, concentrations, exposure time, protocols etc.) and/or species tested.12–15 In general, however, there is agreement on the greater toxicity of graphene oxide (GO) with respect to other GBMs.16 This is likely due to the high number of oxygen functional groups, such as hydroxyl, carboxyl and epoxy, spread over the graphene lattice which render GO more hydrophilic and reactive towards the surrounding environment.17 Expectedly, the effects of GBMs on seed plants were always evaluated on the vegetative body at different developmental stages, from seed germination to the flowering adult plants. However, nothing is known yet about the effects of GBMs on the complex, delicate reproductive process, which strongly relies on the transfer and interaction of the male pollen grains with the female reproductive structures. The few-celled pollen grain plays the crucial role of delivering the sperm cells, through the formation of a pollen tube, to the egg cell(s) inside the ovule. If this task is successful, fertilization can occur, with the formation of a new embryo, and later, of a seed. This process is fundamental for the reproduction of almost all seed plants but it is also important for humankind since the yield of crop species, largely consisting of seeds and fruits, relies in toto on it. Pollen is more sensitive to environmental pollutants compared to most other structures of the vegetative body of seed plants.18,19 For this reason, pollen is considered as an experimental model for assessing the impact of a wide variety of chemicals on plant metabolism.20 It was also used as an indicator of air pollution because the pollen performance, when described in terms of pollen germination and pollen tube elongation, can be affected (depending on species) by gaseous airborne pollutants such as NOx, O3 and SO2.21–23 More recently, it was demonstrated that also airborne particulate matter affects pollen performance: Speranza et al.24,25 found that Ag- and Pd-nanoparticles impair the in vitro pollen germination and the elongation of the pollen tube in the kiwifruit vine, Actinidia deliciosa C. F. Liang & A. R. Ferguson. Interestingly, this effect is derived from the nanoparticles themselves rather than from the ions carried on their surface.24,25 Given these premises, our hypothesis is that the interaction of aero-dispersed GBM flakes with pollen might impair the pollen performances affecting negatively the reproductive process of seed plants. To verify this, the effect of GO, the most reactive GBM tested so far, was verified on the pollen performance of two species, the entomophilous tobacco plant (Nicotiana tabacum L.) and the anemophilous common hazel (Corylus avellana L.), through in vitro germination experiments.
Materials and methods
Graphene oxide preparation and characterization
Graphene oxide (GO) was provided by Grupo Antolin (Burgos, S) within the Graphene Flagship project (http://graphene-flagship.eu/) and it was produced by oxidation of carbon fibers (GANF Helical-Ribbon Carbon Nanofibres, GANF®) in sulfuric acid with sodium nitrate at 0 °C. Dry GO was re-suspended in water and sonicated in an ultrasonic bath prior to the experiments.The surface chemical composition of GO was analyzed by X-ray photoelectron spectroscopy (XPS) using a Thermoelectron K-α apparatus (ThermoFisher Scientific, MA, USA). The photoelectron emission spectra were recorded using Al-Kα radiation (hυ = 1486.6 eV) from a monochromatized source. The X-ray spot diameter on the sample surface was 400 μm. The pass energy was fixed at 30 eV. The spectrometer energy calibration was performed using the Au 4f7/2 (83.9 ± 0.1 eV) and Cu 2p3/2 (932.8 ± 0.1 eV) photoelectron lines. The background signal was removed using the Shirley method.26 Atomic concentrations were determined from photoelectron peak areas using the atomic sensitivity factors reported by Scofield,27 taking into account the transmission function of the analyzer. The morphology of the dried particles and their sizes were characterized using a JEM 1400 (Jeol USA, Inc., MA, USA) Transmission Electronic Microscope (TEM) operated at 120 kV, and the GO samples for the observations were prepared according to Garacci et al.28 The GO average flake thickness was assessed by X-ray powder diffraction (XRD) analysis using a D4 ENDEAVOR diffractometer (Bruker Corp., MA, USA) at a wavelength of Cu Kα1 (λ = 0.15418 nm). The GO structure was assessed by Raman spectroscopy using a Labram-HR800 (Horiba Group, J) equipped with a thermoelectrically cooled CCD, using excitation lasers at 633 (red laser, He/Ne) and 532 nm (green laser, diode-pumped solid-state laser). Five spectra were averaged for each sample and the intensity ratio between the D and the G lines (ID/IG) was measured after baseline correction.
Two additional GOs were purchased from Graphenea (San Sebastián, E) and Sigma-Aldrich (St. Louis, MO, USA); they were provided as water suspensions at concentrations of 4 and 2 mg GO mL−1, respectively. Data regarding these materials can be found in the safety datasheets available on the websites of the producers.
Pollen material
The pollen of Nicotiana tabacum was collected in the summer of 2016 from dehiscent anthers of plants grown in the experimental fields of the Botanical Garden, University of Siena. Mature undehiscent anthers were sampled, transported to the laboratory and kept at 20 °C until dehiscence. The pollen was gently separated from the anthers and collected in Eppendorf tubes. The pollen of Corylus avellana was collected in January 2017 from 15 native trees in the Classical Karst (Trieste, NE Italy) far from pollution sources. Twigs bearing unripe catkins were sampled, immediately transported to the laboratory, and their bases cut under water and kept immersed under laboratory conditions (20 °C, dim light) until flower ripening and stamen dehiscence (c. 48 h). The harvested pollen of both species was sieved through 100 and then 60 μm mesh sizes to remove debris, dehydrated over silica-gel (RH ∼5%) for 48 h and stored at −20 °C until use.Germination of N. tabacum and C. avellana pollen
Prior to use, the pollen of N. tabacum and C. avellana was thawed and then rehydrated in a moist chamber for 2 and 3 h, respectively. Germination experiments were performed by suspending the pollen at a concentration of 1 mg mL−1 in Brewbaker & Kwack's culture medium29 (BK) containing 1.62 mM H3BO3, 1.25 mM Ca(N03)2·4H2O (or CaCl2·2H2O), 2.97 mM KNO3 (or KCl) and 1.65 mM MgSO4·7H2O. Germination of N. tabacum and C. avellana pollen was carried out in BK supplemented with sucrose (BKsuc) to a final concentration of 12% and 15% (w/v), respectively.To assess the effects of GO, the pollen of both species was germinated in BK without GO (control samples), and in BK supplemented with GO suspensions to final concentrations of 25, 50 or 100 μg mL−1 (treated samples). Three to four replicates have been prepared for both the control and treated samples. Germination experiments were performed at a controlled temperature of 25 °C. An additional experiment was performed on the N. tabacum pollen replacing sucrose with polyethylene glycol (PEG) to a final concentration of 13% (BKPEG).
Assessment of pollen performances
Images of the germinating pollen were taken after 1 and 2 h of pollen tube growth for N. tabacum and 3 and 5.5 h for C. avellana using a Zeiss Axiocam MRm camera connected to a Zeiss Axiophot microscope (Zeiss, Oberkochen, D). The pollen performance, i.e. germination percentage and pollen tube length, was measured on the control and treated samples. The germination percentage was calculated by scoring at least 150 randomly selected grains which were considered germinated if the pollen tube was longer than the average diameter of the pollen grains. The pollen tube length was measured for at least 50 randomly selected pollen tubes. Further measurements (n > 60) of the angle made by the pollen tube were taken from the control samples and from the samples treated with GO at 100 μg mL−1.Viability assay
The viability of N. tabacum pollen grains was evaluated in the control and in the treated samples (100 μg mL−1 GO only) using the fluorochromatic reaction test.30 A few drops of fluorescein diacetate solution (2 mg mL−1 FDA in acetone) were added to glass slides, waiting 30–40 seconds to allow acetone evaporation.23 Thereafter, 30 μL of the pollen culture was added to each slide and then covered with coverslips. FDA fluorescence was visualized after 30 min, 1 h and 2 h using a Zeiss Axiophot fluorescence microscope equipped with a Zeiss Axiocam MRn camera; evaluation of viability percentage was done on the captured images by counting at least 150 pollen grains for each sample.Analysis of pollen tube intracellular pH
The intracellular pH variation along the N. tabacum pollen tubes was assessed in the control samples and in the samples treated with GO at 100 μg mL−1 using the fluorescent dye BCECF-AM (acetoxymethyl). A BCECF-AM (2,7-bis-(2-carboxyethyl)-5-(e-6)-carboxyfluorescein) ester probe was used to visualize proton levels (i.e. pH) in the pollen tubes of N. tabacum.31 A final concentration of 5 μM was obtained from a 1 mM stock solution in dimethyl sulfoxide (DMSO); the required volume was directly added to the germination medium containing resuspended pollen grains. The cytosolic pH was immediately measured after addition of the probe to prevent probe absorption of the organelles (vacuoles). The samples were observed using a Zeiss AxioImager fluorescence microscope equipped with structured illumination in the FITC filter (Ex. λ = 488 nm; Em. λ = 515 nm).Pollen performances at different pH in relation to GO treatments
The pH of BKsuc and BKPEG with or without GO at 100 μg mL−1 was measured using a Crison Basic 20 (Crison, Hach Lange, S) pH-meter in continuously stirred media until the variation measured by the probe was less than ±1 mV per minute. The germination performance of the C. avellana pollen was evaluated in the pH range between 3 and 7 by incubating the pollen for 3 h in the BK medium adjusted with 0.1 M NaOH or H2SO4, as appropriate. Subsequently, the pollen germination performance was further investigated in the following media: i) BKsuc (control), ii) BKsuc adjusted with H2SO4 to pH 4.2, iii) BKsuc with GO at 100 μg mL−1 and iv) the latter adjusted with NaOH to pH 6.3. For comparison, the pH of water suspensions (100 μg mL−1) of commercially available GOs, i.e. GO from Graphenea (San Sebastián, E), and Sigma-Aldrich (St. Louis, MO, USA), was also measured.Data analysis
Measurements of pollen performance, tube angles and fluorescence signals from FDA and BCECF-AM were performed using the ImageJ software ver. 1.51J8 (Wayne Rasband, NIH, USA) after calibration of the images with the scalebar command of the Axiovision software (Zeiss, D).In order to exclude bias due to slow growing pollen tubes or to pollen which stopped growing, only the 30% longest tubes of both the control and treated samples were selected for statistical analyses. The length of selected pollen tubes was expressed as the percentage ratio with respect to the mean tube length measured in the control samples. Factorial ANOVA followed by Tukey's HSD post-hoc test were used to evaluate the statistical differences among the control and treated samples in terms of both pollen germination percentage and pollen tube length using optimal germination times (1 and 2 h for N. tabacum; 3 and 5.5. h for C. avellana) and GO concentrations (0, 25, 50 and 100 μg mL−1) as the categorical factors. The same statistical analysis was performed for the pH experiment using germination time and pH as the categorical factors. The effect of GO on the pollen tube angle and on the pollen viability was assessed by running a Mann–Whitney U-test for independent samples. All calculations were performed using Microsoft Office Excel 2003 SP3 (Microsoft corporation, WA, USA) and STATISTICA 8.0 (StatSoft Inc., OK, USA).
Results and discussion
Characterization of GO
In the case of the GO sample provided by Grupo Antolin, the elemental analysis data (Table S1†) obtained either by classical chemical analysis (data as provided by Grupo Antolin) or measured experimentally by XPS at the CIRIMAT facility revealed some interesting information. In particular, the C/O ratio, which is often reported in publications, is very sensitive to the input data (weight concentrations or atomic concentrations). If XPS analysis is focused only on the C and O elements, neglecting other elements such as hydrogen which is essentially impossible to detect by this technique, the C/O ratio is largely over-evaluated (2.3) while the use of the weight concentrations obtained from the classical chemical elemental analysis leads to a C/O ratio close to 1. This is important to know because in most publications the chemical elemental analysis data are absent; so, it is impossible to know which elements are also present in addition to C and O. In this case, it is obvious that the presence of a high atomic % of hydrogen leads to important differences in terms of C/O ratio depending on considering it or not.The GO nanoparticles (Fig. 1C) had a thickness of 3.9 nm, calculated using the Scherrer equation applied to the (002) reflection (Fig. S1†) and assuming an interlayer spacing of 0.8 nm obtained from the position of the same reflection (peak at 11.05° of Fig. S1†). These data suggest that the estimated number of layers was between 4 and 5 per particle. The intensity ratios between the D and the G bands (Fig. S2 a and b†) measured by Raman spectroscopy were 1.03 and 1.17 at 532 and 633 nm, respectively, revealing in both cases a rather disordered material.
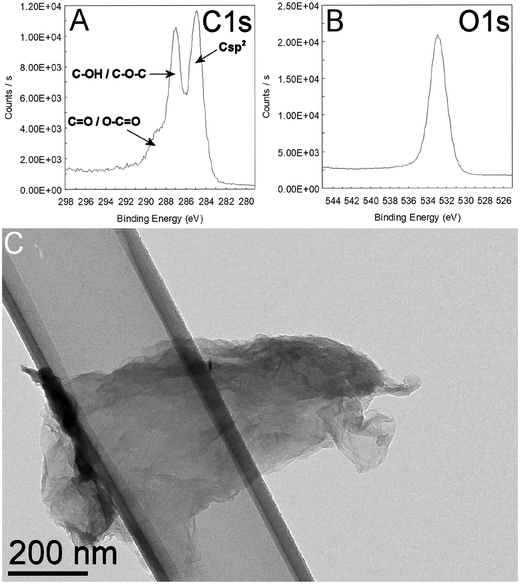 | ||
| Fig. 1 XPS analysis of GO showing details of the C1s (A) and O1s (B) bands. A typical TEM image of the GO material is shown in (C). | ||
Physical interaction between GO and the pollen
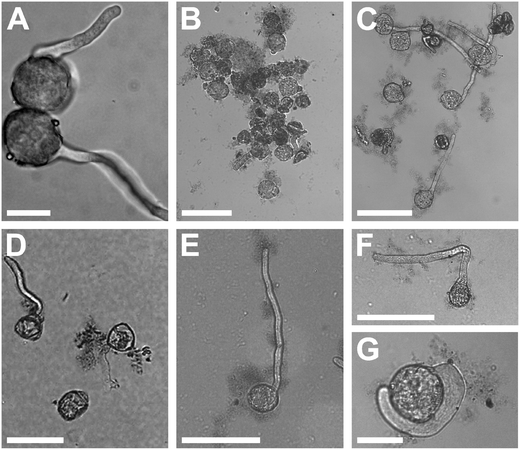
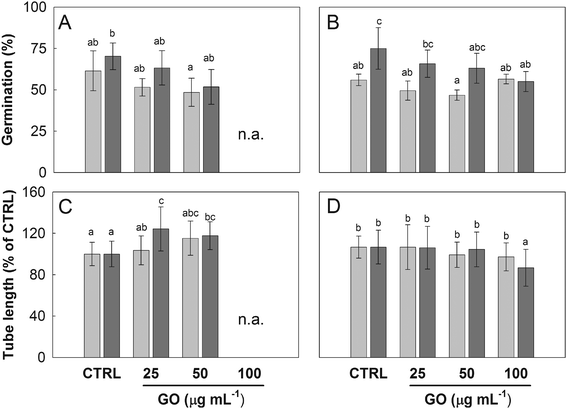
The Nicotiana tabacum pollen germinated in BKsuc with GO formed clusters intermingled with GO flakes especially at the highest concentration (100 μg mL−1; Fig. 2A and B), which made the measurements of pollen performance unreliable (n.a. data in Fig. 3A and C). Interestingly, the replacement of sucrose with PEG reduced the aggregation effect allowing the measurements (Fig. 2B and C and 3B and D). Such pollen-GO clusters were not observed in C. avellana germinated under the same conditions (Fig. 2D). In any case, GO flakes were found adhering to the pollen grains and the pollen tube surfaces in both species (Fig. 2D and E). The pollen grains of N. tabacum are generally coated by a lipoid “pollen coat” or “pollenkitt” which can account for 10–15% of the total pollen mass.32,33 This coat is typical of entomophilous species: it has adhesive properties allowing pollen grains to stick to insects and to the stigmatic surfaces of flowers.34 Moreover, the germinating pollen grains of N. tabacum release lectins and polylectins, which may also cause grain agglutination.33 Both may explain the pollen-GO aggregation and why this did not occur in the anemophilous C. avellana. As reported by Chen et al.,35 PEG has a good affinity to lipoid substances, and therefore it might have partially removed the pollen coat reducing the aggregation between the pollen and GO.Effect of GO on pollen performances and viability
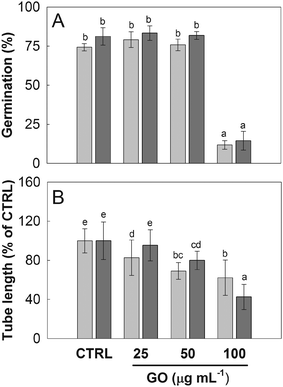
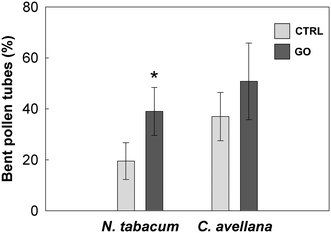
The pollen of N. tabacum and C. avellana germinated in BKsuc (control samples) had normal tube extrusion and elongation (Fig. 2A) with final germinations of 75% and 81% (Fig. 3A and 4A), respectively, suggesting that the pollen materials were healthy at the beginning of the experiments. The pollen performance of both species was significantly affected by GO (see Tables S2 and S3†). The pollen germination and tube length of N. tabacum decreased to 55% and 81% with respect to the control values (Fig. 3B and D; P < 0.05), respectively, after 2 h of germination at 100 μg GO mL−1. The decrease in pollen performance was greater in C. avellana; the germination remained steady until 50 μg GO mL−1, then it decreased to 12% and 14% at 100 μg mL−1 after 3 and 5.5 h, respectively (Fig. 4A). Differently, the pollen tube length decreased progressively with the increase in GO concentration, reaching 62% and 43% of the control value at 100 μg GO mL−1 after 3 and 5.5 h, respectively (Fig. 4B). Furthermore, although the viability of the N. tabacum pollen was not affected at 100 μg GO mL−1 (Fig. 5), the percentage of pollen tubes showing a bent growth doubled with respect to that of the control samples (Fig. 6; P < 0.05). A similar trend was observed in the pollen tubes of C. avellana, but the difference between the control and treated samples was not statistically significant (Fig. 6). The fact that GO had an effect on the pollen performance of both species, although with a different intensity, agrees well with the literature reporting the toxic effects of GO on phylogenetically unrelated model organisms.16 However, the mechanisms of toxicity are still unclear: some authors reported that GO can mechanically damage cells or tissues with its sharp edges36 and reduce metabolic activity and viability when it is internalized into cells.37,38 The great majority, though, agrees that GO causes oxidative stress inducing the formation of reactive oxygen species.39–41 In our case, the observed effects are mostly related to the GO composition in terms of functional groups and their interaction with the surrounding media, as it will be discussed below.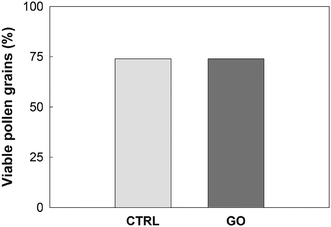 | ||
| Fig. 5 Percentage of N. tabacum viable pollen grains (n = 150) in the control (CTRL) and treated samples with GO at 100 μg mL−1 (GO) after 2 h of germination. | ||
Effect of GO on the pH of germination media
Graphene oxide is characterized by a high number of functional groups containing oxygen, with hydroxyl and epoxy groups spread over the graphene lattice, and carboxyl groups at the flake edges.17 Carboxyl groups are weak acids and together with hydroxyl groups deprotonate in water solutions lowering the pH. Furthermore, GO could still have some residual sulfuric acid (as suggested by the elemental composition in Table S1†), which is used in the modified Hummers' method for the oxidation process of the graphite flakes.42 For these reasons, the pH of the BK media and water suspensions of GO of different origins was investigated (Table 1). At 100 μg GO mL−1, the pH of BKsuc and BKPEG decreased by 2.00 and 0.97 points, respectively (Table 1). Water suspensions of GO, GO washed to remove potential impurities from the Hummer's method, GO from Graphenea and GO from Sigma-Aldrich had pH values below 4.25 (Table 1), confirming (a) the strong acidic property of all tested GOs, and (b) the negligible sulphuric acid contamination, because the washing of GO did not change the final pH value.| pH | |
|---|---|
| BKsuc | 6.36 ± 0.10 |
| BKPEG | 6.91 ± 0.02 |
| BKsuc + GO | 4.35 ± 0.20 |
| BKPEG + GO | 5.94 ± 0.10 |
| dH2O + GO | 4.13 ± 0.05 |
| dH2O + GOw | 4.25 ± 0.10 |
| dH2O + GO§ | 3.34 ± 0.02 |
| dH2O + GO# | 4.01 ± 0.18 |
Effect of pH on pollen performances
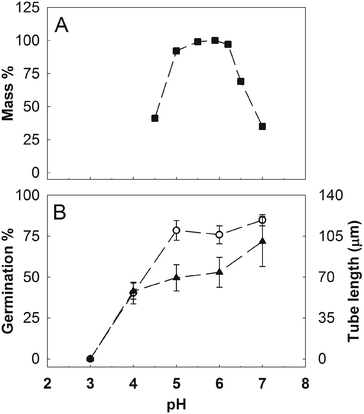
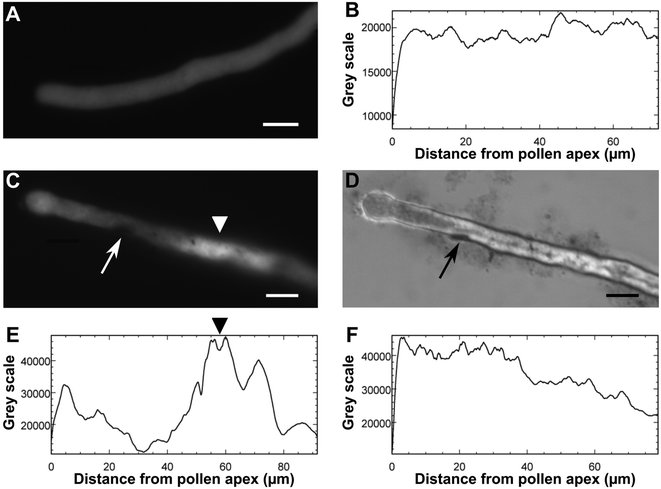
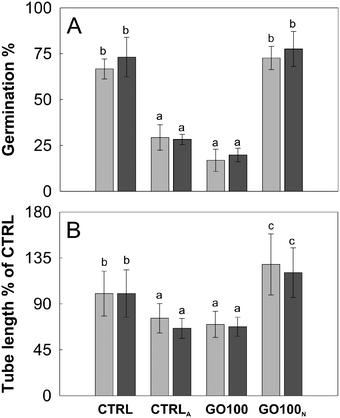
Considering the strong acidification effect of GO on the BKsuc media, we further investigated the effect of pH on the pollen performance of N. tabacum and C. avellana. As reported by Tupí and Říhová,43 the N. tabacum pollen tube growth has its optimum in the pH range of 5–6.5 and decreases at lower pH (Fig. 7A). The Corylus avellana pollen had the best performance at pH 7 with 84% of germinated pollen and an average tube length of 100.4 μm after 3 h of germination (Fig. 7B). Below pH 7, pollen germination slightly decreased to 78% at pH 5–6, fell to 40% at pH 4 and zeroed at pH 3 (Fig. 7B). Differently, the pollen tube length progressively decreased to 73.9 μm at pH 6 and then to 57.9 μm at pH 4 (Fig. 7B). These results help to clarify the contribution of different “toxicity” mechanisms, direct or not, on the performance of N. tabacum and C. avellana pollen germinated in GO-enriched media (Fig. 3). In the first case, PEG decreased the GO-dependent acidification stabilizing the pH to 5.9, which falls in the pH range where the N. tabacum pollen performance is purportedly the best (see Table 1 and Fig. 7A). For this reason, the GO-induced pH change does not explain the decrease in pollen performance detected in N. tabacum, suggesting a different type of interaction between pollen grains and tubes. Inhibition of pollen germination induced by Ag-nanoparticles has already been documented by Speranza et al.,25 who hypothesized a possible physical blockage of the transmembrane ion channels at the site of tube protrusion by the nanoparticles, preventing the formation of the inward ion current preceding pollen germination.44 Alternatively, GO internalization at the site of the tube protrusion could have impaired the metabolic pathways triggering pollen germination. Further experiments on GBM internalization and GO-induced ROS production are currently ongoing to clarify the mechanisms on the basis of this germination inhibition. The reduction of the pollen tube length by GO can instead be explained, thanks to microscopy observations of GO treated samples stained with BCECF-AM, a fluorescent dye used to detect intracellular changes in pH.31 The treated pollen suffered a pH variation along their pollen tubes. Fig. 8C and D show a pollen tube covered by GO flakes with regions emitting fluorescence at an intensity of up to two fold higher than that detected in the control samples (Fig. 8Bvs. E). This certainly affects tube growth and tube directionality because low intracellular pH impairs the cytoskeleton45 which in pollen tubes coordinates the movements of organelles46 and vesicle trafficking needed to deposit new pectin at the tube tip for its growth.47,48 For this reason, localized pH decreases could also explain the higher percentage of bent pollen tubes observed in N. tabacum (Fig. 6).In the case of C. avellana instead, GO lowered the pH of BKsuc to 4.35, i.e. the pH value at which the germination performances of C. avellana are the lowest (see Table 1 and Fig. 7B). To verify if the GO-dependent acidification was the main reason for the observed effects, a further experiment was performed, reversing the pH conditions of the media: those of the controls were acidified to pH 4.2, whereas those with GO were adjusted to pH 6.3. The acidified controls decreased similarly to GO-treated samples after both 3 and 5.5 h (Fig. 9) and, conversely, the adjusted GO-treated samples had a pollen performance similar to that of the pristine controls (Fig. 9). These results confirm that GO-induced acidification of the media is the main toxicity mechanism (for P = 0.000, see Table S4†), causing the impairment of pollen performance in C. avellana.
The pH-decrease induced by high concentrations of GO might impair the pollen performance of a broad number of seed plants. For instance, Cox49 tested the pollen performances of 13 forest species over a pH range from 2.6 to 5.6, simulating the effect of acid rains on the reproductive process of seed plants. He found that in half of the species, the pollen performance was strongly reduced at pH 3.6.
Conclusions and environmental relevance
Aero-dispersed GBM flakes and their environmental fate is still an under-studied field. However, graphene flakes were detected in the air of small-scale graphene manufacturing workplaces (a laboratory and a research institution) in which careful measures to protect operators were adopted.50 This demonstrates the high volatility of GBMs and raises concerns on the possible release of GBMs that will occur inside and around large scale-production facilities or when these materials are used in degradable objects. For these reasons, in this work, we started addressing the potential effects of GO, one of the most studied and potentially toxic GBMs, on the reproductive process of seed plants by in vitro experiments of pollen germination hypothesizing important future releases of GBMs from both point and widespread sources. We showed that GO impaired the pollen performance in N. tabacum and C. avellana at the highest concentration tested and most of this is derived from the acidic properties of the material. This could be relevant from an environmental point of view because strong depositions of GO flakes on the stigmatic surfaces of angiosperms could decrease pH to a level overcoming the buffering capacities of the organ. Pollen landing on an acidified stigma could be affected and consequently have reduced chances to successfully conclude the reproductive process, as already showed by Cox49 in connection with the devastating phenomena of acid rains.51 Furthermore, our experiments brought evidence of another effect of GO, potentially not related to the acidic properties but still important since it reduced the germination performance of N. tabacum by 20%, and doubled the frequency of bent tubes. Still unknown in its nature, this might be related to intracellular ROS development or to a perturbation of Ca2+ availability, since this ion plays a fundamental role in pollen tube growth.44 There are no doubts that more experiments involving other GBMs and seed plants, especially of economic value such as cereals, need to be conducted to clarify the mechanisms inducing this effect and its selectivity towards diverse species. It has to be noted though, that the scenario depicted here could be far more complex. Hypothetically, GO flakes deposited on the receptive surface could also affect the reproductive process in other ways, such as reducing the capacity of the stigma to intercept pollen in anemophilous species or hindering physically or chemically the signalling occurring between the stigma and the pollen grain. Also, sexual reproduction of entomophilous seed plants relies on insects for pollination which could collect GO flakes from flower organs or even eat them if the flakes land over nectar or water drops or over the pollen in the open anthers, entering de facto in other trophic chains. Furthermore, the effect of GO and other airborne metallic nanoparticles could be amplified by synergistic effects such as those reported by Tang et al.52 in the cyanobacterium Microcystis aeruginosa.Conflicts of interest
The authors declare no competing financial interests.Acknowledgements
We gratefully acknowledge financial support from the European Union's Horizon 2020 Research and Innovation Programme under grant agreement No. 696656 Graphene Flagship CORE 1. The authors thank Prof. Johanna Wagner (University of Innsbruck) for training FCC in germinating pollen in vitro, Dr. Alice Montagner for her valuable help in graphene handling and Drs. Susanna Bosi and Zois Syrgiannis (University of Trieste) for their technical advices. We are indebted to Ilaria Corsi (University of Siena) for the discussion and suggestions about planning of the experimental procedures. The personnel of the Botanical Garden of the University of Siena are also acknowledged for cultivating the plants of Nicotiana tabacum. Prof. Ester Vázquez Fernández–Pacheco is thanked for providing washed and non-washed GO materials. P. Lonchambon and G. Chimowa are acknowledged for their help with the physico-chemical characterization of the Antolin GO material.References
- A. K. Geim, Science, 2009, 324, 1530–1534 CrossRef PubMed.
- K. S. Novoselov, V. I. Fal'ko, L. Colombo, P. R. Gellert, G. M. Schwab and K. Kim, Nature, 2012, 490, 192–199 CrossRef PubMed.
- R. Ciriminna, N. Zhang, M. Q. Yang, F. Meneguzzo, Y. J. Xu and M. Pagliaro, Chem. Commun., 2015, 51, 7090–7095 RSC.
- A. Zurutuza and C. Marinelli, Nat. Nanotechnol., 2014, 9, 730–734 CrossRef PubMed.
- K. Ghaffarzadeh, Graphene 2D Materials and Carbon Nanotubes: Markets Technologies and Opportunities 2016–2026, 2016, http://idtechexcom/research/reports/graphene-2d-materials-and-carbon-nanotubes-markets-technologiesand-opportunities-2015-2025-000440asp?viewopt=desc (accessed 02.2010) Search PubMed.
- Vittoria © 2018, Graphene, Join the revolution, https://www.vittoria.com/graphene-evidence/ Accessed the (02.2018) Search PubMed.
- A. Zhamu and B. Z. Jang, US Pat., No. 7999027, U.S. Patent and Trademark Office, Washington, DC, 2011 Search PubMed.
- Y. Liang, D. Yang and J. Cui, New J. Chem., 2017, 41, 13692–13699 RSC.
- M. Cole, P. Lindeque, C. Halsband and T. S. Galloway, Mar. Pollut. Bull., 2011, 62, 2588–2597 CrossRef PubMed.
- C. M. Rillig, Environ. Sci. Technol., 2012, 46, 6453–6454 CrossRef PubMed.
- V. Ramanathan and G. Carmichael, Nat. Geosci., 2008, 1, 221–227 CrossRef.
- P. Begum, R. Ikhtiari and B. Fugetsu, Carbon, 2011, 49, 3907–3919 CrossRef.
- N. A. Anjum, N. Singh, M. K. Singh, Z. A. Shah, A. C. Duarte, E. Pereira and I. Ahmad, J. Nanopart. Res., 2013, 15, 1770 CrossRef.
- P. Begum and B. Fugetsu, J. Hazard. Mater., 2013, 260, 1032–1041 CrossRef PubMed.
- Q. Wang, S. Zhao, Y. Zhao, Q. Rui and D. Wang, RSC Adv., 2014, 4, 60891–60901 RSC.
- A. Montagner, S. Bosi, E. Tenori, M. Bidussi, A. A. Alshatwi, M. Tretiach, M. Prato and Z. Syrgiannis, 2D Mater., 2017, 4, 012001 CrossRef.
- D. R. Dreyer, S. Park, C. W. Bielawski and R. S. Ruoff, Chem. Soc. Rev., 2010, 39, 228–240 RSC.
- S. R. Varshney and C. K. Varshney, Environ. Pollut., Ser. A, 1980, 24, 87–92 CrossRef.
- G. L. Calzoni, F. Antognoni, E. Pari, P. Fonti, A. Gnes and A. Speranza, Environ. Pollut., 2007, 149, 239–245 CrossRef PubMed.
- U. Kristen, Toxicol. In Vitro, 1997, 11, 181–191 CrossRef PubMed.
- W. Flückiger, S. Braun and J. J. Oertli, Environ. Pollut., 1978, 16, 73–80 CrossRef.
- T. Keller and H. Beda, Environ. Pollut., Ser. A, 1984, 33, 237–243 CrossRef.
- E. Gottardini, F. Cristofolini, E. Paoletti, P. Lazzeri and G. Pepponi, J. Atmos. Chem., 2004, 49, 149–159 CrossRef.
- A. Speranza, K. Leopold, M. Maier, A. R. Taddei and V. Scoccianti, Environ. Pollut., 2010, 158, 873–882 CrossRef PubMed.
- A. Speranza, R. Crinelli, V. Scoccianti, A. R. Taddei, M. Iacobucci, P. Bhattacharya and P. C. Ke, Environ. Pollut., 2013, 179, 258–267 CrossRef PubMed.
- D. A. Shirley, Phys. Rev. B: Solid State, 1972, 5, 4709–4714 CrossRef.
- J. H. Scofield, J. Electron Spectrosc. Relat. Phenom., 1976, 8, 129–137 CrossRef.
- M. Garacci, M. Barret, F. Mouchet, C. Sarrieu, P. Lonchambon, E. Flahaut, L. Gauthier, J. Silvestre and E. Pinelli, Carbon, 2017, 113, 139–150 CrossRef.
- J. L. Brewbaker and B. H. Kwack, Am. J. Bot., 1963, 50, 859–865 CrossRef.
- J. Heslop-Harrison, Y. Heslop-Harrison and K. R. Shivanna, Theor. Appl. Genet., 1984, 67, 367–375 CrossRef PubMed.
- H. Qu, X. Jiang, Z. Shi, L. Liu and S. Zhang, J. Plant Res., 2012, 125, 185–195 CrossRef PubMed.
- P. Piffanelli, J. H. E. Ross and D. J. Murphy, Plant J., 1997, 11, 549–652 Search PubMed.
- N. P. Matveeva, E. A. Lazareva, T. P. Klyushnik, S. A. Zozulya and I. P. Ermakov, Russ. J. Plant Physiol., 2007, 54, 619–625 CrossRef.
- E. Pacini and M. Hesse, Flora, 2005, 200, 399–415 CrossRef.
- J. Chen, S. K. Spear, J. G. Huddleston and R. D. Rogers, Green Chem., 2005, 7, 64–82 RSC.
- R. G. Combarros, S. Collado and M. Díaz, J. Hazard. Mater., 2016, 310, 246–252 CrossRef PubMed.
- F. Ahmed and D. F. Rodrigues, J. Hazard. Mater., 2013, 256, 33–39 CrossRef PubMed.
- S. Ouyang, X. Hu and Q. Zhou, ACS Appl. Mater. Interfaces, 2015, 7, 18104–18112 Search PubMed.
- K. M. Garza, K. F. Soto and L. E. Murr, Int. J. Nanomed., 2008, 3, 83–94 CrossRef PubMed.
- S. Liu, T. H. Zeng, M. Hofmann, E. Burcombe, J. Wei, R. Jiang, J. Kong and Y. Chen, ACS Nano, 2011, 5, 6971 CrossRef PubMed.
- W. Zhang, C. Wang, Z. Li, Z. Lu, Y. Li, J. Yin, Y. Zhou, X. Gao, Y. Fang, G. Nie and Y. Zhao, Adv. Mater., 2012, 24, 5391–5397 CrossRef PubMed.
- D. C. Marcano, D. V. Kosynkin, J. M. Berlin, A. Sinitskii, Z. Sun, A. Slesarev, L. B. Alemany, W. Lu and J. M. Tour, ACS Nano, 2010, 4, 4806–4814 CrossRef PubMed.
- J. Tupí and L. Říhová, J. Plant Physiol., 1984, 115, 1–10 CrossRef.
- J. A. Feijó, R. Malhó and G. Obermeyer, Protoplasma, 1995, 187, 155–167 CrossRef.
- A. H. Timme, J. Ultrastruct. Res., 1981, 77, 199–209 CrossRef PubMed.
- G. Cai and M. Cresti, J. Exp. Bot., 2009, 60, 495–508 CrossRef PubMed.
- E. M. Lord and S. D. Russell, Annu. Rev. Cell Dev. Biol., 2002, 18, 81–105 CrossRef PubMed.
- G. Cai, C. Faleri, C. Del Casino, A. M. Emons and M. Cresti, Plant Physiol., 2011, 155, 1169–1190 CrossRef PubMed.
- R. M. Cox, New Phytol., 1983, 95, 269–276 CrossRef.
- J. H. Lee, J. H. Han, J. H. Kim, B. Kim, D. Bello, J. K. Kim and E. M. Faustman, Inhalation Toxicol., 2016, 28, 281–291 CrossRef PubMed.
- N. Van Breemen, P. A. Burrough, E. V. Velthorst, H. F. Van Dobben, T. de Wit, T. D. Ridder and H. F. R. Reijnders, Nature, 1982, 299, 548–550 CrossRef.
- Y. Tang, J. Tian, S. Li, C. Xue, Z. Xue, D. Yin and S. Yu, Sci. Total Environ., 2015, 532, 154–161 CrossRef PubMed.
Footnote |
| † Electronic supplementary information (ESI) available: Fig. S1 and S2 and Tables S1–S3. See DOI: 10.1039/c8en00052b |
| This journal is © The Royal Society of Chemistry 2018 |

