
 Open Access Article
 This Open Access Article is licensed under a Creative Commons Attribution-Non Commercial 3.0 Unported Licence
Different effects of nano-scale and micro-scale zero-valent iron particles on planktonic microorganisms from natural reservoir water†
Nhung H. A.
Nguyen
*ab,
Roman
Špánek
ab,
Vojtěch
Kasalický
c,
David
Ribas
d,
Denisa
Vlková
a,
Hana
Řeháková
a,
Pavel
Kejzlar
a and
Alena
Ševců
 *ab
*ab
aInstitute for Nanomaterials, Advanced Technologies and Innovation, Technical University of Liberec (TUL), Studentská 2, 46117 Liberec, Czech Republic. E-mail: nhung.nguyen@tul.cz; alena.sevcu@tul.cz
bFaculty of Mechatronics, Informatics and Interdisciplinary Studies, Technical University of Liberec (TUL), Studentská 2, 46117 Liberec, Czech Republic
cBiology Centre of the Czech Academy of Sciences, Institute of Hydrobiology, České Budějovice, Czech Republic
dDepartment of Chemical Engineering, Technical University of Catalonia (UPC), ETSEIB, Av. Diagonal, 647, E-08028, Barcelona, Spain
First published on 26th April 2018
Abstract
While nano-scale and micro-scale zero-valent iron (nZVI and mZVI) particles show high potential for remediation of polluted soil aquifers and elimination of cyanobacterial blooms, this has required their release into the environment. This study compares the impact of 100 mg L−1 of nZVI and mZVI on natural planktonic microorganisms from a reservoir, incubated in 1.5 L batches over 21 days. In addition to counting cyanobacterial and algal cell numbers, bacterial community structure was assessed using Ion Torrent sequencing and the number of cultivable bacteria determined using standard cultivation methods. Surprisingly, while mZVI had no significant effect on algal cell number, cyanobacteria numbers increased slightly after 14 days (P < 0.05). Algae were only marginally affected by nZVI after seven days (P < 0.05), while cyanobacteria numbers remained unaffected after 21 days. Total species richness and less common bacteria increased significantly when treated with mZVI (compared to nZVI). The abundance of Limnohabitans (Betaproteobacteria), Roseiflexus (Chloroflexi), hgcl_clade (Actinobacteria) and Comamonadaceae_unclassified (Betaproteobacteria) increased under nZVI treatment, while mZVI enhanced Opitutae_vadinHA64 (Verrucomicrobia) and the OPB35_soil_group (Verrucomicrobia). Interestingly, the number of cultivable bacteria increased significantly after three days in water with nZVI, and further still after seven days. nZVI shaped bacterial community both directly, through release of Fe(II)/Fe(III), and indirectly, through rapid oxygen consumption and establishment of reductive conditions. The strong physico-chemical changes caused by nZVI proved temporary; hence, it can be assumed that, under natural conditions in resilient reservoirs or lakes, microbial plankton would recover within days or weeks.
Environmental significanceNanoscale zerovalent iron (nZVI) has been the subject of great interest over the last decade as it is a highly reactive material, capable of rapidly assimilating toxic pollutants (e.g. chlorinated ethenes) in soil and underground waters. To date, however, most field studies have been performed in contaminated underground environments. As nZVI have been postulated as a possible treatment for harmful cyanobacterial blooms, this study focuses on the effect of nZVI on natural pelagic microplankton in a freshwater reservoir. Moreover, we aim to distinguish between the effect of nano- and micro-ZVI particles on the natural microbial community. |
1. Introduction
Zero-valent iron (ZVI) has a long tradition of environmental application due to its high capacity to clean-up a wide range of pollutants, including chlorinated organic compounds and toxic metal cations.1–3 Initially applied as granules (>50 μm), and more recently as a micro-scale ZVI (mZVI) material,4 ZVI is now more often applied as nano-scale ZVI particles (nZVI).5–9 Due to their high specific surface area, micro- and nano-scale materials are more reactive than granular materials, while their small particle size means they can be used for more diverse applications.10 In addition to the above-mentioned applications, a number of laboratory studies have suggested that nZVI could also prove useful for prevention of cyanobacterial blooms.11,12Unfortunately, the high capability of ZVI for cleaning-up pollutants in groundwater and soils7,13,14 may also have an effect on indigenous microorganisms mediating fundamental ecosystem processes as they are the first to be exposed to the particles. Hence, there is an urgent need for the evaluation of potential risks relating to ecosystem function changes when using ZVI materials.
Two main mechanisms of direct effect on microbial cells have been identified for ZVI: generation of reactive oxygen species (ROS) and the potential to physically damage bacterial or algal cells due to its strong affinity to cell surfaces,15 which can lead to a significant decrease in mobility.16,17 It is well known that ZVI particles have the potential to release Fe(II) into the surrounding environment, converting less reactive hydrogen peroxide (H2O2) into harmful ROS, e.g. hydroxyl radicals (˙OH), via the Fenton reaction.18,19 ROS are normally scavenged by antioxidants and enzymes; however, elevated concentrations in microbial cells can result in oxidative stress and damage to lipids, proteins and DNA. In addition, the physical interaction of nZVI and microbial cells could cause damage to outer membranes or physical inactivation of cells.16,21 Indirect effects of nZVI on microorganisms include a decrease in dissolved oxygen concentration, along with a subsequent decrease in oxidation reduction potential,1,22 which could potentially harm aerobic microorganisms. On the other hand, ZVI oxidation or reduction processes could be beneficial for iron-oxidising bacteria.23
A careful risk assessment of ZVI particles requires different ecotoxicity studies targeting organisms on different ecosystem levels. Consequently, the number of ecotoxicity studies focusing on microorganisms is increasing; however, these have mainly been limited to a single species grown in adequate nutrient media,16,24–30 a situation far from relevant to natural environment conditions. Despite this, such studies are important for better understanding more complex studies on microbial communities under natural conditions.
Generally speaking, all studies on ZVI effects to aquifer and soil bacterial communities describe shifts in community structure.9,15,31–34 The first toxicity study on a whole bacterial community from the River Thames showed no negative effect from ZVI particles (100 mg L−1, nZVI majority of Fe(0), with 27% of boron on the surface, 30–90 nm; and mZVI 99.5% of Fe(0), 1.5–6.8 μm), the number of bacteria even increasing after 40 days.15 Similarly, no deleterious effect of nZVI (100 mg L−1, 24–32% Fe(0) and 33% Fe(0) modified with polyaspartate) was observed on total bacterial abundance in a series of microcosm experiments33 nor prolonged toxicity on dechlorinating microorganism during a 300 day anaerobic column experiment (Nanofer 25, 20% suspension of Fe(0) in water).35 Recently, Němeček et al. (2014) showed that the long-term effect of nZVI (Nanofer 25, 20% suspension of Fe(0) in water) on indigenous prokaryotic microorganisms may be neutral, or even positive, as the reduction in toxic pollutants allows further biodegradation.34 This finding was further supported by repeated in situ application of nZVI (first round Nanofer STAR, second round Nanofer 25S, 1 g L−1 and 2 g L−1 of 20% suspension in water, respectively) to combat contamination by hexavalent chromium Cr(VI) and chlorinated ethenes, which resulted in significant stimulation of iron-reducing, sulphate-reducing and chloro-respiring bacterial growth over the 13-month study.9 Moreover, no evidence for any negative effect on soil microbial activity was observed when comparing nZVI (ball-milled Fe(0) in 0.18% polyacrylic acid) with mZVI (>98.3% Fe in 0.18% polyacrylic acid) toxicity.36 On the other hand, high levels of mZVI (25 g L−1, >90% Fe(0)) were seen to change anaerobic sludge bacterial community composition,37 with Flavobacteriaceae, Comamonadaceae and several unclassified iron-reducing bacteria increasing in abundance, considered positive for degradation of toxic flame retardants.37 Velimirovic et al. reported five types of mZVI as positively stimulating a CAH-degrading mixed bacterial culture at concentrations up to 500 mg L−1, while 1–15 g L−1 resulted in inhibition depending on mZVI size.38 mZVI in general has a lower impact on microbes than nZVI, though comprehensive studies on natural freshwater communities have yet to be published.
Studies on impact of nZVI on algae or cyanobacteria are still scarce and are generally limited to single-species cultures, while on mZVI effect have yet to be undertaken. A cyanobacterial bloom, dominated by Microcystis aeruginosa, was strongly affected by nZVI (Nanofer 25S, >90% Fe(0)) after 24 h exposure (EC50: 50 mg L−1), with the effect significantly higher than on Desmodesmus subspicatus.11 Two different nZVI types, Nanofer 25S and Nanofer STAR (70–90% Fe(0) and 10–30% iron oxides), affected the growth rate of freshwater Pseudokirchneriella subcapitata at concentrations >8 mg L−1 and ≥12 mg L−1, respectively.19 Likewise, ball-milled nZVI (FerMEG12, 15–30% Fe(0) in monoethylene glycol) had a negative effect on P. subcapitata and Chlamydomonas sp. at concentrations <100 mg L−1,30,39 while the monoethylene glycol dispersant alone had no effect.30
The major objective of this study was to examine the effect of nZVI and mZVI particles on planktonic microorganisms. The study was carried out on natural freshwater from a reservoir, sampled in late summer in order to include a fully developed phytoplankton community. ZVI inevitably oxidises into Fe-oxides naturally present in the environment at concentrations ranging from 0.1 to 194.7 mg L−1 in rivers40 and from 20 to 40 g kg−1 in soils.41 Hence, we used a concentration of 100 mg L−1 as this was considered relevant to concentrations in the vicinity of ZVI application, where ZVI suspension quickly dilutes42–44 and as this is the limit for hazard labelling in EU chemical regulations. Centrifuged and filtered reservoir water was used when assessing the size distribution of both ZVI materials in order to reveal possible differences due to sample preparation. We describe the effect of nZVI and mZVI particles on prokaryotic (bacteria, cyanobacteria) and eukaryotic (algae) microorganisms by determining the number of cultivable bacteria and the number of cyanobacterial and algal cells. For the first time, we apply 16S rRNA amplicon sequencing in order to describe the effect of nZVI and mZVI on the development of a natural bacterial community.
2. Material and methods
2.1. ZVI particles
A suspension of nZVI in deionised water was obtained from the Polytechnic University of Catalonia, Spain. The material was produced using a novel wet-ball milling process utilising alumina abrasive and monoethylene glycol (MEG; Scharlab S.L.) as the grinding media. The nZVI particles had a mean diameter of 160 nm, a maximum size of 540 nm (determined by scanning electron microscopy [SEM]), a specific surface area of 29.6 m2 g−1 and contained 74.0% Fe(0), 2.7% carbon and 23.3% of iron oxide.45 The mZVI reactive powder (no: 72052910) was provided by Hepure Technologies (USA) and had a specific surface area of 0.487 m2 g−1, 95% Fe(0), 1.8% carbon, <1% oxygen, 1% silicon, 0.1% phosphorus and 1% sulphur. A 10 g L−1 stock suspension of ZVI in deionised water was freshly prepared before the experiment. Images of the pristine particles are presented in Fig. S1.†2.2. Experimental design and sampling of reservoir water
Water samples were obtained from Harcov reservoir (50.7702097N, 15.0755733E; Czech Republic) one metre from the reservoir bank and from a point 10 cm below the surface on 22 August 2016. The water was immediately transported in sterile containers (20 L) to the laboratory and the experiment started immediately after arrival. The following variants were prepared in triplicate in sterile 1.5 L glass bottles: fresh reservoir water mixed with stock suspension of either nZVI or mZVI at a final concentration of 100 mg L−1 and fresh reservoir water only (control without ZVI). Additionally, sterilised reservoir water and sterilised reservoir water mixed with nZVI were prepared in parallel as reference controls. The bottles, illuminated with two 3 metre light tubes emitting visible light at 670–800 lux (GOSSEN, Germany), were slowly mixed manually for one minute a day and the position of the bottles randomly changed each day. Sub-samples (160 mL) were taken after 0, 1, 3, 7, 14 and 21 days for determination of cultivable bacteria, either as colony forming units (CFU) or number of cyanobacterial and algal cells. Aliquots for DNA extraction and 16S rRNA amplicon sequencing were sampled during days 0, 7 and 21.2.3. Physico-chemical analysis of reservoir water
The reservoir water (1 L) was sampled separately, in triplicate, for analysis of chemical parameters (Table S1†), determined using iron chromatography (IC; ThermoFisher) and inductively coupled plasma spectrometry (ICP-OES) on an OPTIMA 2100 DV (Perkin Elmer) spectrophotometer, and total organic carbon (TOC) using a multi N/C 2100S analyser (Analytik Jena, Germany).Concentration of dissolved Fe at 0 and 21 days was measured using ICP-OES. Water samples with nZVI and mZVI (10 mL) were centrifuged for 30 minutes at 4600 rpm (ROTANTA 460R, Hettich, Germany), the supernatant then being passed through Amicon Ultracel 3K ultra-filtration filters with a 3 kDa molecular weight cut-off (Millipore, USA) to separate Fe ions from the particles.
The pH, ORP and dissolved oxygen concentration was measured directly at the reservoir and during the laboratory experiment using a Multi 3430 multi-parameter portable probe (WTW, Germany).
2.4. Characterisation of ZVI particles in reservoir water
The nZVI and mZVI particles (100 mg L−1) were suspended for 24 h in (1) centrifuged reservoir water prepared by spinning for 30 minutes at 6000 rpm, (2) filtered reservoir water prepared by filtration over a 1.4 μm membrane filter (Whatman, Life Sciences) and (3) deionised water as a control. The nZVI and mZVI particles were characterised using a Zeiss Ultra Plus field-emission SEM (Zeiss, Germany). The samples were fixed onto aluminium stubs using double-sided carbon tape and cleaned with RF plasma (Evactron) for 10 min before SEM analysis. SEM images were acquired at an accelerating voltage of 5 kV at low probe current (about 15 pA) using an InLens secondary electron detector with SmartSEM software. Subsamples were further analysed for size distribution using differential centrifugal sedimentation (DCS) on a DC24000 centrifuge (CPS Instruments, UK) at a maximum operational speed of 2500 rpm for mZVI and 24![[thin space (1/6-em)]](https://www.rsc.org/images/entities/char_2009.gif) 000 rpm for nZVI. In addition, colloidal particles of natural organic compounds were concentrated by centrifugation of filtered (1.4 μm) reservoir water for 45 minutes at 6000 rpm, with maximum operational speed set at 10000 rpm. This protocol was adapted from Barnes et al. (2010).15
000 rpm for nZVI. In addition, colloidal particles of natural organic compounds were concentrated by centrifugation of filtered (1.4 μm) reservoir water for 45 minutes at 6000 rpm, with maximum operational speed set at 10000 rpm. This protocol was adapted from Barnes et al. (2010).15
2.5. DNA extraction
Reservoir water samples (150 mL) treated with nZVI and mZVI and untreated reservoir water (control) were pre-filtered with 20 μm filter papers (Whatman, GE Healthcare Life Science, China) and then filtered through a Hydrophilic Durapore PVDF 0.22 μm membrane (Merck Millipore, Germany) for DNA extraction. Briefly, DNA was extracted from the filter using a FastDNA Spin Kit for Soil (MP Biomedicals, CA, USA) according to the manufacturer's protocol, with the Bead Blaster 24 homogenisation unit (Benchmark Scientific, NJ, USA) employed for cell lysis. Extracted DNA concentration was quantified using a Qubit 2.0 fluorometer (Life Technologies, USA) (further details in Dolinová et al., 2016).462.6. PCR amplification and next-generation sequencing (NGS)
All isolated DNA samples for bacterial and cyanobacterial community analysis were sequenced in duplicate, with two consecutive polymerase chain reactions (PCR) performed per sample to amplify DNA from the V4 region (normal and barcode fusion primers used). In silico analysis of primers was performed in order to cover as much diversity as possible while keeping the amplicon size below 400 bp. Amplification of the V4 region of the eubacterial 16S rRNA gene was performed with primers 515F (5′-TGCCAGCMGCNGCGG-3′)47 and barcode 802R (5′-TACNVGGGTATCTAATCC-3′).48 A MOCK community (collection of 6 bacterial genomes prepared in-house) was subsequently sequenced in order to verify data evaluation (Fig. S2†). PCR cycle conditions were as follows: first PCR 95 °C for 3 min; 10 cycles at 98 °C for 20 s, 50 °C for 15 s and 72 °C for 45 s, with a final extension at 72 °C for 1 min; second PCR 95 °C for 3 min; 35 cycles at 98 °C for 20 s, 50 °C for 15 s and 72 °C for 45 s, with a final extension at 72 °C for 1 min. The concentration of purified PCR products was measured with a Qubit 2.0 fluorometer (Life Technologies, USA). Barcode-tagged amplicons from different samples were then mixed in equimolar concentration. Sequencing of bacterial amplicons was performed on the Ion Torrent platform (Life Technologies, USA), the raw Ion Torrent reads being processed with Mothur software.49 Low quality reads were removed and sequences were assigned to each sample. Chimeric sequences were identified using UCHIME50 and subsequently removed. Sequences exceeding 400 bases were trimmed and sequences shorter than 180 bases removed. Sequences were classified against Silva database v. 123 with a bootstrap value set at 80%. A cut-off value of 97% was used for clustering sequences into operational taxonomic units (OTUs). Sequence data were normalised to group with the least sequences by randomly selecting a selected number of sequences from each sample. Cluster analysis by Bray–Curtis dissimilarity was undertaken using Vegan in the R statistical package.512.7. Abundance of ferroxidase enzyme
Ferroxidase enzyme (EC1.16.3.1) abundance in prokaryotes was conducted using metabolic inference (preferably, but not exclusively, using NGS) on 16S rRNA gene libraries using Paprica software,52 based on the phylogenetic placement approach. Paprica uses pathways/enzymes shared between the members of all clades on a reference tree to determine which pathways/enzymes are likely to be associated with a phylogenetically placed read. Paprica accepts reads pre-processed by Mothur software, allowing removal of low quality reads, short reads and contaminants (e.g. mitochondria, chloroplasts).2.8. Determination of cultivable bacteria
The number of cultivable bacteria was determined in nZVI and mZVI treated reservoir water by counting CFUs in 1 mL of undiluted and 10-fold diluted samples spread on plate count agar (BIO-RAD, France) in sterile Petri dishes, with CFUs counted after seven days incubation at 20 ± 2 °C. Cultivable bacterial abundance is expressed as CFU per mL.2.9. Microscopy analysis of phytoplankton
Determination of cell number and filament measurement was based on Czech standard methodologies (CSN 75 77 17). Disintegration of the algal and cyanobacterial colonies into individual cells was undertaken by addition of potassium hydroxide (KOH; 0.1 M), then sucking and releasing a 10 mL sample twenty times using a syringe. The cells were then counted in a Cyrus I chamber (0.01 mL) using an Olympus BX43 fluorescence microscope (Olympus, Japan) with a blue excitation filter for algae and a green excitation filter for cyanobacteria.2.10. Calculation and statistical analysis
For improved comparison, all data were converted into a fold change, calculated by dividing the numbers of cells at day 1, 3, 7, 14 and 21 (Dn) by the number of cells at day 0 (D0). The differences between treatments and control were compared using ANOVA and Dunnett's test (GraphPad PRISM, USA). Significance levels were set at *P < 0.05, **P < 0.01 and ***P < 0.001.Three diversity metrics were used to compare the impact of ZVI particles on bacterial community composition, as described in Newton and McLellan (2015).53 Species were described using richness, the most abundant taxa/groups within samples were described using the inverse Simpson index and the tail statistic was used to describe the diversity of rare community members. The Mann–Whitney U test was used to examine whether composition of bacterial community exposed to mZVI differed significantly from those exposed to nZVI.
3. Results
3.1. Characterisation of ZVI particles in reservoir water
nZVI and mZVI particles were exposed to two differently prepared reservoir water (centrifugation and filtration) samples with the aim of removing microorganisms and debris that disable characterisation of the particles. Particles exposed to deionised water were considered as a control. Both nZVI and mZVI tended to aggregate in centrifuged reservoir water (Fig. 1A and 2A) and filtered reservoir water (Fig. 1B and 2B), but not in deionised water (Fig. 1C and 2C). mZVI particles had a normal (Gaussian) distribution from 1 to 5 μm, with the maximum ranging from 3.8 to 4 μm in all samples of reservoir and deionised water, as determined by DCS. In contrast, nZVI particles were split into two ‘populations’, with a dominant peak around 110 nm in centrifuged reservoir water and 120 nm in filtered reservoir water. The smaller population always appeared around 600 nm in both variants. In deionised water, the larger population was detected at around 100 nm and the smaller around 380 nm (Fig. 1D; see SEM images of pristine particles in Fig. S1† for comparison). Compared to centrifuged reservoir water, colloidal particles of natural organic compounds in filtered reservoir water were completely missing at fractions <60 nm, while relatively few particles were observed at >60 nm (Fig. S3†).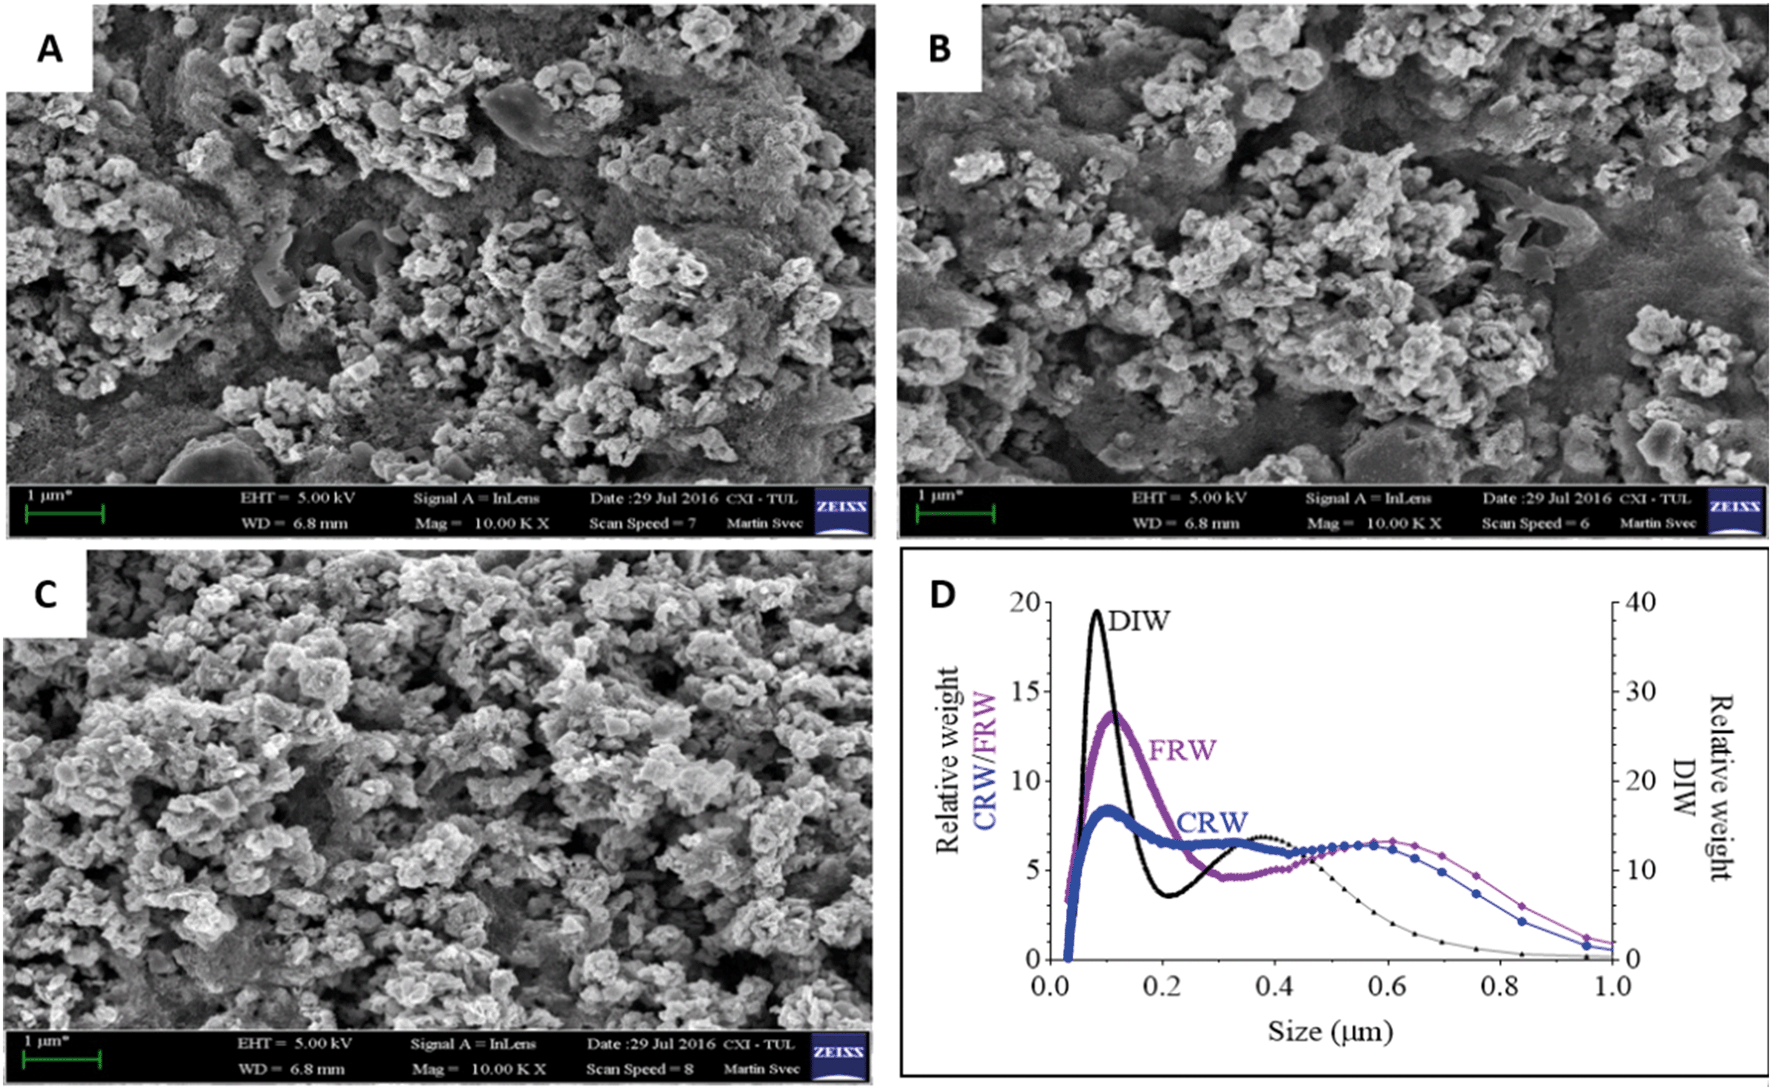 | ||
| Fig. 1 Scanning electron microscopy images of nZVI exposed for 24 h in reservoir water: (A) nZVI in centrifuged reservoir water (CRW); (B) nZVI in filtered reservoir water (FRW); (C) nZVI in deionised water (DIW) used as a control; scale bar = 1 μm; (D) size distribution of nZVI in CRW, FRW and DIW determined by differential centrifugal sedimentation. | ||
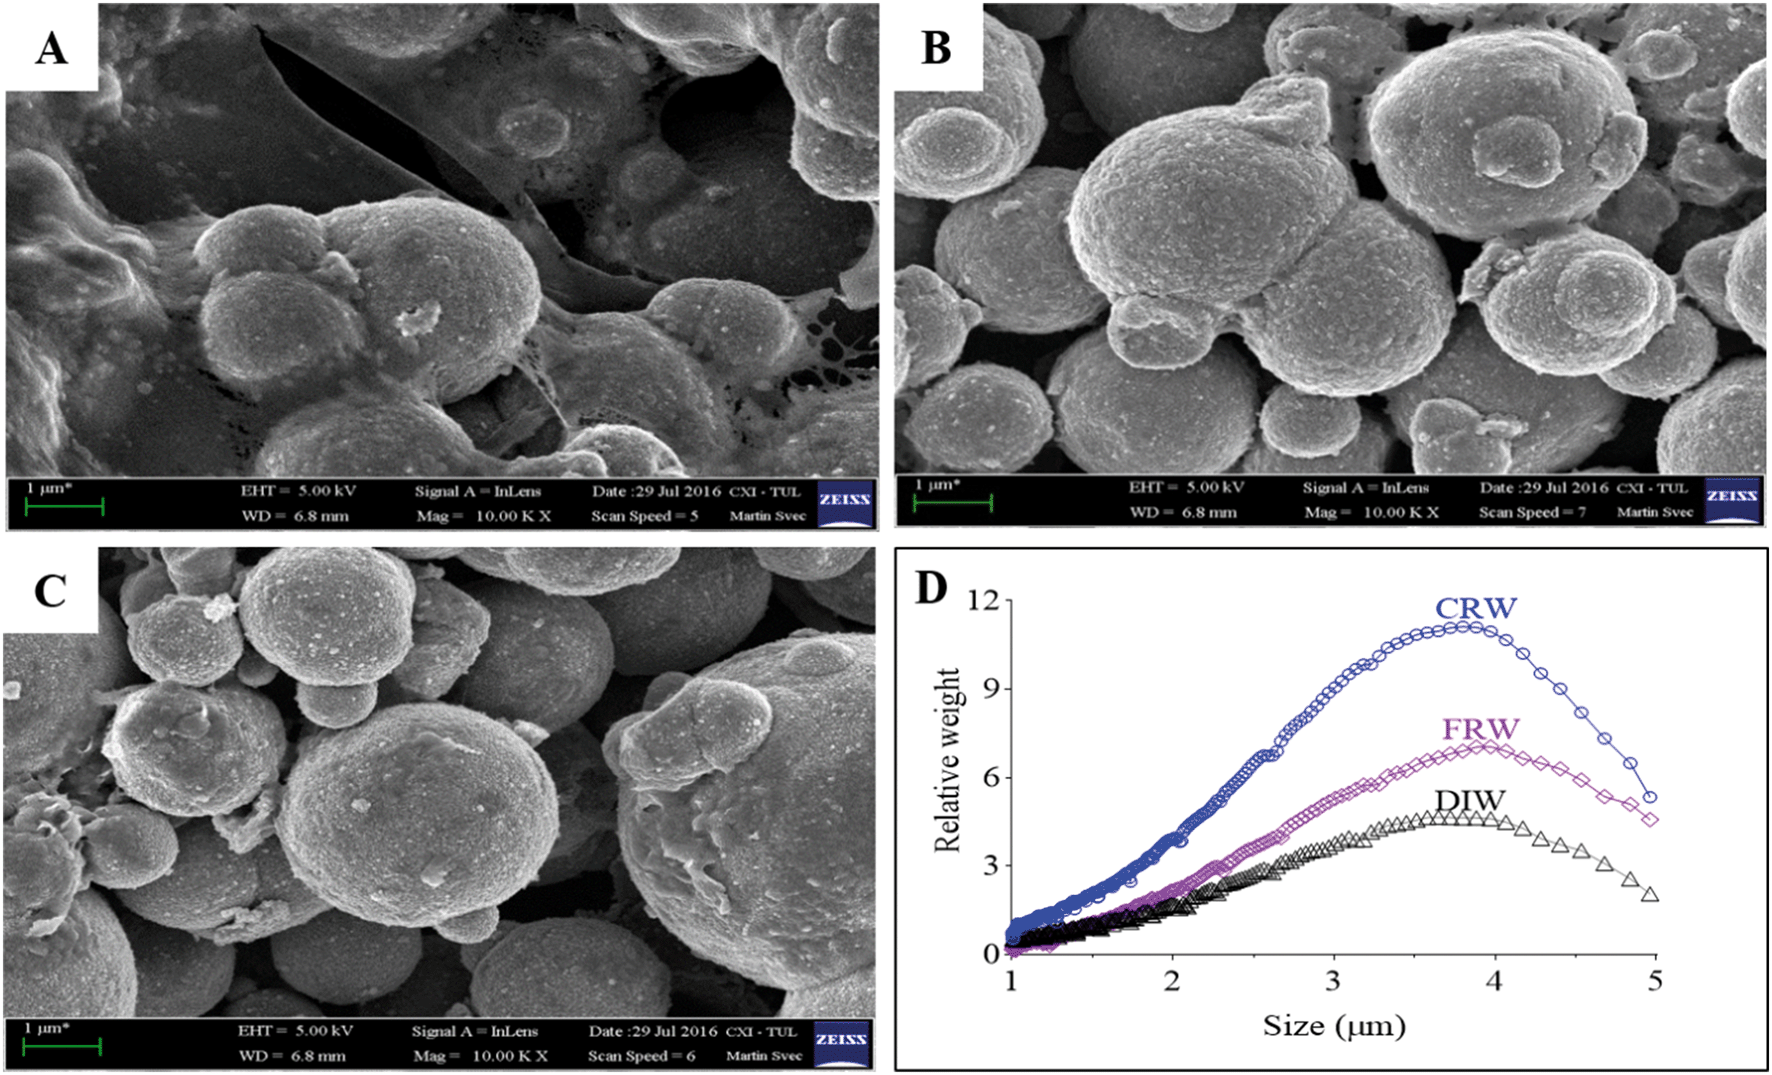 | ||
| Fig. 2 Scanning electron microscopy images of mZVI exposed for 24 h in reservoir water: (A) mZVI in centrifuged reservoir water (CRW); (B) mZVI in filtered reservoir water (FRW); (C) mZVI in deionised water (DIW) used as a control; scale bar = 1 μm; (D) size distribution of mZVI in CRW, FRW and DIW determined by differential centrifugal sedimentation. | ||
3.2. Physical–chemical parameters of reservoir water
Temperature remained more or less constant (22.5 ± 0.2 °C) over the 21 day experiment, with the exception of day 0 (sampling in reservoir; 18 °C; Fig. 3A). While the initial pH was 8.0 in untreated reservoir water (control), addition of ZVI particles caused an immediate significant increase in reservoir water treated with mZVI (pH 8.8; P < 0.001) and nZVI (8.5; P < 0.01). The pH then decreased slightly to 7.6 (reservoir water), 8.2 (nZVI) and 8.3 (mZVI), but remained significantly higher than the control after one day and thereupon remained between 7.2 and 7.6 (with or without ZVI; not significant) until the end of the experiment (Fig. 3B). The ORP of reservoir water was 245 mV at the beginning of the experiment and fluctuated around 300 mV until the end (Fig. 3C). The ORP of reservoir water with nZVI decreased to −136 mV (P < 0.001) and to 70 mV (P < 0.001) with mZVI after one day. ORP gradually increased to 88 mV with nZVI (P < 0.001) and 148 mV with mZVI reservoir water (P < 0.001) after three days, after which there was no significant difference from the control with nZVI while mZVI ORP remained lower (175–200 mV, P < 0.01) over the next 21 days (Fig. 3C). Dissolved oxygen in the control and mZVI sample was around 9 mg L−1 at the beginning of the experiment and decreased slightly to ∼8 mg L−1 over 21 days. In comparison, nZVI caused a decline to 5.3 mg L−1 at day 0, declined further to 2.3 and 2.5 mg L−1 after one day and after three days (P < 0.001), respectively, then increased to 7.8 mg L−1 (P < 0.05) after seven days; this situation lasting until the end of the experiment (Fig. 3D). A reddish-brown colour appeared in bottles containing nZVI from day 2, demonstrating presence of oxidised Fe. The reddish colour was observed in reservoir water with both nZVI and mZVI at the end the experiment (Fig. S4†).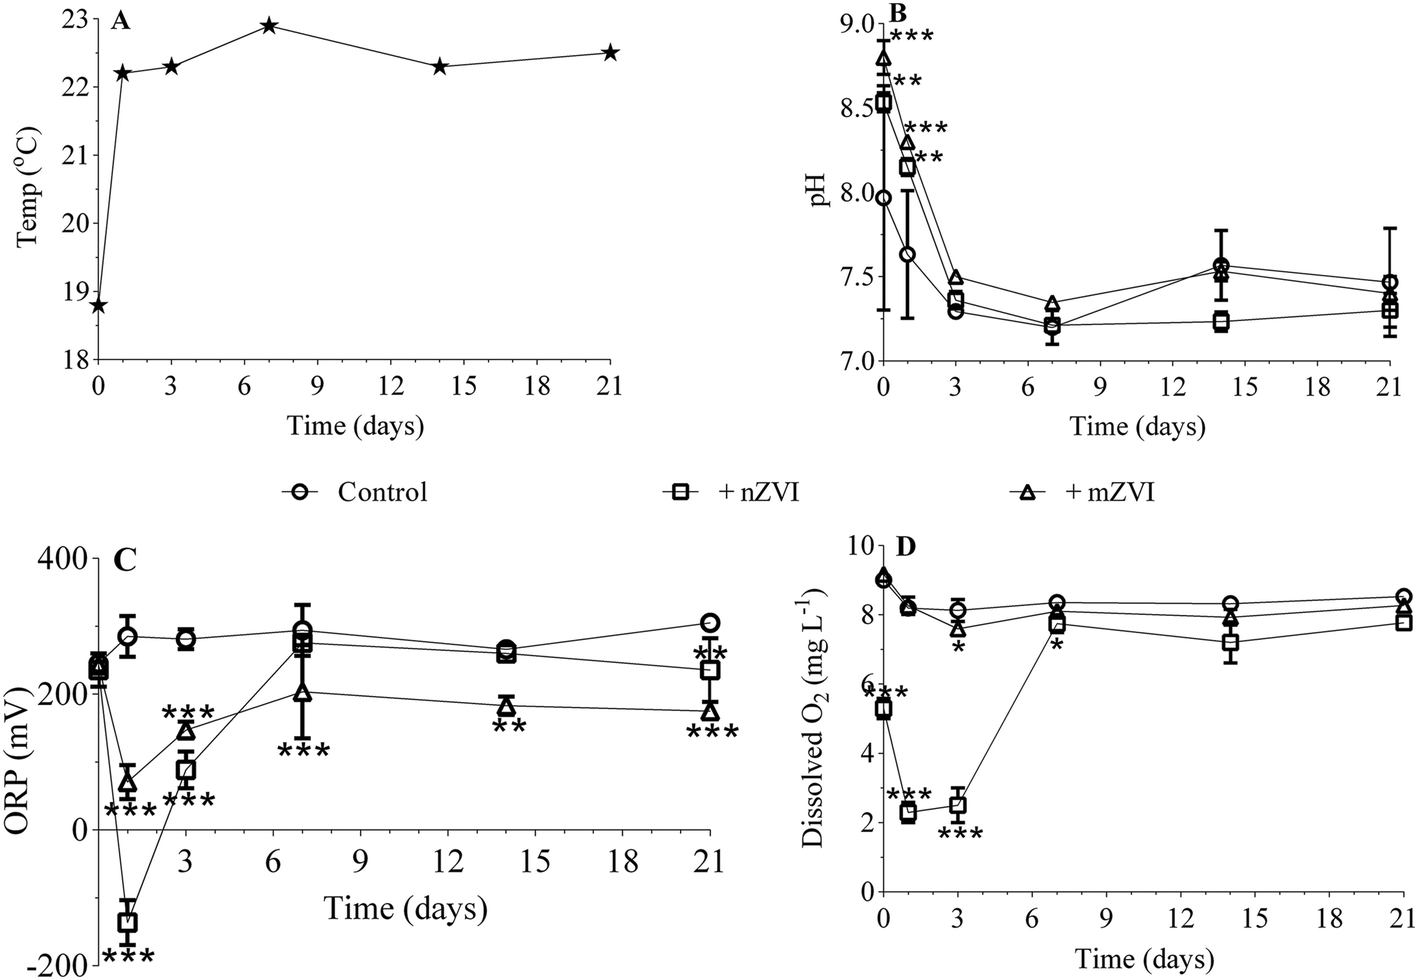 | ||
| Fig. 3 Physio-chemical parameters monitored over the 21 day experiment with mZVI and nZVI in reservoir water. (A) Temperature, (B) pH, (C) oxidative reductive potential and (D) dissolved oxygen. Error bar n = 3. Statistically significant differences (*P < 0.05, **P < 0.01 and ***P < 0.001) compare the treatment to the control. | ||
3.3. Effect of mZVI and nZVI on planktonic microorganisms
Compared to the untreated control samples, the number of cultivable bacteria in the nZVI treatment increased geometrically, with a maximum at day 7 yielding 171 × 103 CFU mL−1 (P < 0.001), but then decreased slowly up to day 21, though still remaining about 3–4 times higher than the control (Fig. 4A, Table S2A†). Both the control and the mZVI treatments displayed a similar number of CFU with no significant difference.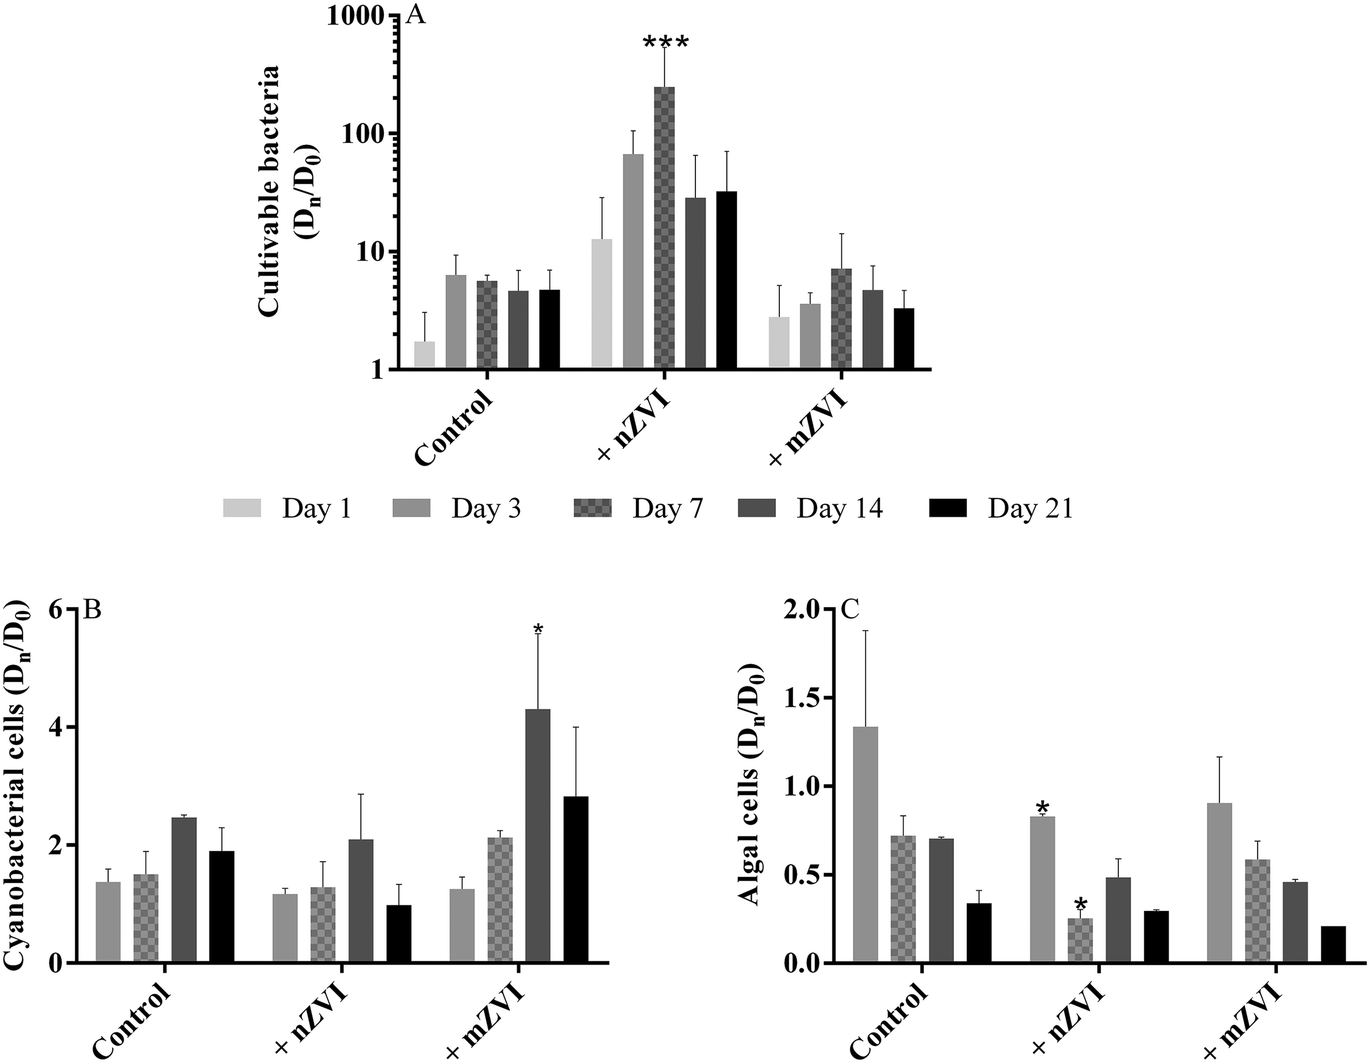 | ||
| Fig. 4 Abundance of planktonic microorganisms (fold change of Dn/D0 over the 21 day experiment using reservoir water with nZVI (+ nZVI), reservoir water with mZVI (+ mZVI), and reservoir water only as a control); (A) cultivable bacteria, (B) cyanobacterial number and (C) green algae number. Note: different scales for the y axis. Error bars n = 3. Statistically significant differences (*P < 0.05, **P < 0.01 and ***P < 0.001) compare the treatment to the control. The actual number of cells is provided in the ESI† (Table S2). | ||
Changes in the number of cyanobacterial cells were recorded in the presence of ZVI particles (Fig. 4B; Table S2B†), with numbers increasing over time with mZVI (significantly higher than the control at day 14; P < 0.05) but remaining comparable to the control with nZVI. The dominant cyanobacterial species at the beginning of the experiment was the colony-forming Microcystis aeruginosa, followed by M. flos-aquae and Woronichinia naegeliana at lower abundance, and the genus Anabaena sp. rarely recorded. M. aeruginosa was still dominant after 7 days, while M. flos-aquae and W. naegeliana became dominant after 14 days, especially in reservoir water with mZVI.
Early in the experiment, small green algae (Chlorophyta) dominated the phytoplankton, especially colony-forming Planktosphaeria sp. followed by Staurastrum sp., Scenedesmus sp., Tetraedron sp., Monoraphidium sp., Oocystis sp. and Botryococcus braunni. Bacillariophyta, Dinophyta and Cryptophyta taxa were only rarely recorded, as were ciliates and flagellates. The number of small green algae in nZVI was reduced compared with the control after three days, with this effect remaining significant for up to seven days (P < 0.05), while abundance of algae in mZVI remained similar to the control throughout the study (Fig. 4C, Table S2C†).
3.4. Bacterial community composition
NGS was used to characterise bacterial communities in the control and in samples with nZVI and mZVI at day 0, 7 and 21. Diversity tests revealed samples with mZVI as having higher species richness than nZVI (P < 0.05), particularly as regards rare community members (tail) (P < 0.05, Table 1). Moreover, significant differences were observed at both the family and genus levels when comparing mZVI and nZVI, being more important towards the end of the experiment (day 21; family: P < 0.05, genus: P < 0.001). Statistically significant changes were also detected between the control and nZVI/mZVI samples at genus level by day 21 (P < 0.05, Table 2).| Richness | Inverse Simpson | Tail | |
|---|---|---|---|
| a Indicates significance at P < 0.05; n.s. not significant. | |||
| Control | 161 (28) | 10 (1) | 20 (4) |
| nZVI | 147 (18) | 11 (3) | 18 (2) |
| mZVI | 184 (34) | 14 (3) | 24 (6) |
| Genus level | |||
|---|---|---|---|
| Day 0 | Day 7 | Day 21 | |
| Control/mZVI | n.s. | n.s. | * |
| Control/nZVI | n.s. | n.s. | * |
| mZVI/nZVI | n.s. | ** | *** |
| Family level | |||
|---|---|---|---|
| Significance levels: *P < 0.05, **P < 0.01 and ***P < 0.001; n.s. not significant. | |||
| Control/mZVI | n.s. | n.s. | n.s. |
| Control/nZVI | n.s. | n.s. | n.s. |
| mZVI/nZVI | n.s. | * | * |
At the beginning of the experiment, untreated epilimnion water displayed a typical freshwater bacterial community, being represented in all treatments by the phyla Proteobacteria (Alpha-, Beta- and Deltaproteobacteria; together 38%), Actinobacteria (23%), Bacteroidetes (19%), Verrucomicrobia (10%), Cyanobacteria (4%) and Chloroflexi (2%) (Fig. 5). At day 7, the relative abundance of Actinobacteria and Alphaproteobacteria had decreased in all treatments, being compensated for by an increase in Verrucomicrobia and Deltaproteobacteria (control and mZVI) or Betaproteobacteria (nZVI). After an additional two weeks (day 21), the abundance of Actinobacteria and Deltaproteobacteria had recovered while Verrucomicrobia stayed enriched and Alphaproteobacteria reduced in the control and mZVI treatments. In nZVI, Betaproteobacteria (still dominating the bacterioplankton) were reduced by an increase in Chloroflexi and Deltaproteobacteria at day 21. Bacteroidetes and Cyanobacteria were not, or only weakly, affected by the treatment over time.
 | ||
| Fig. 5 Phylum and class composition of bacterial populations in the control, mZVI and nZVI treatments. The phylum Proteobacteria is represented by Alfa-, Beta- and Delta-classes. Phyla with less than 2% abundance are shown as unclassified. Samples without ZVI particles are used as a control (Ctrl). Note that each sample was sequenced in duplicate. | ||
At the family level, bacterial community structure was also typical for a freshwater reservoir, consisting of Microbacteriaceae and Sporichthyaceae (both Actinobacteria), Burkholderiaceae and Comamonadaceae (both Betaproteobacteria), Acetobacteraceae, Caulobacteraceae, Pelagibacteriaceae, Rhodospirillaceae (all Alphaproteobacteria), Opitutae (Verrucomicrobia), Flavobacteriaceae and Saprospiraceae (both Bacteroidetes), and Roseiflexaceae (Chloroflexi) (Fig. 6). Cluster analysis supported the existence of three sample groups: i) starting samples, ii) mZVI and control samples and iii) nZVI samples. Starting samples were dominated by members of the Pelagibacteraceae (LD12 cluster; 23%), Sporichthyaceae (hgcl_clade; 20%), Flavobacteriaceae (genus Flavobacterium; 7%), Comamonadaceae (genus Limnohabitans; 3%), Microbacteriaceae (‘Candidatus Limnoluna’; 2%) and Roseiflexaceae (genus Roseiflexus; 1.4%). While trends differed in the presence of nZVI compared to the control, there was no shift in structure in mZVI samples. For example, while the Comamonadaceae and Flavobacteriaceae families were gradually reduced in mZVI and the control, the family-like group Opitutae_vadinHA64 increased continuously up to day 21. In the presence of nZVI, however, Comamonadaceae increased remarkably after seven days, then decreased after 21 days. Opitutae_vadinHA64 decreased continuously while Sporichthyaceae declined and remained at the same low level from day 7 to the end of the experiment (Fig. 6).
 | ||
| Fig. 6 Heatmap indicating the relative abundance of the major bacterial families for days 0, 7 and 21. The relationship of the bacterial composition in each sample is depicted with a cluster dendrogram based on Bray–Curtis dissimilarity among samples and among families. The dominant genus rank is provided in parentheses after the family name (dash ‘-’, when unclassified at genus level). Only those families with a relative abundance >2% are shown. Data are means from duplicate samples. | ||
At the genus level, a comparison of relative abundance in the nZVI and mZVI treatments with the control revealed seven groups with >5% change in total bacterial population (Fig. 7). In general, the addition of nZVI particles resulted in more dynamic population shifts (up to 29%) than the addition of mZVI (<11%). A decline in the LD12 cluster and an increase in Limnohabitans and in the Comamonadaceae_unclassified read tags was observed as a common effect of both materials. Roseiflexus showed a continuous increase over days 0, 7, but not day 21, following mZVI treatment, while the opposite trend was observed in the tribe Opitutae_vadinHA64. The hgcI_clade abundance remained steady until day 7, but was reduced by day 21. The tribe OPB35_soil_group was enriched from its initial abundance in nZVI and mZVI treatments, including the control; however, population growth in nZVI treatment was 5% lower than in control after 7 days. Other genus-like groups also showing 3–5% differences from the control were Azospirillum, Brevundimonas, Desulfomonile, Flavobacterium, the NS11-12_marine_group, Polynucleobacter, Roseomonas and the Bacteria_unclassified group. Flavobacterium, Polynucleobacter and Roseomonas all profited from nZVI treatment over both sampling days, while the NS11-12_marine_group was always depleted. A notable decrease in population size was observed for Desulfomonile and the Bacteria_unclassified group in nZVI at day 7. Desulfomonile was also reduced in mZVI at day 7.
 | ||
| Fig. 7 Impact of ZVI particles on the development of genus-like groups of the most abundant bacteria from the Harcov reservoir. Values were calculated as differences in relative abundance in A) nZVI and the control, or B) mZVI and the control, after 7 and 21 days. The values are means from duplicate measurements. Only those genera or tribes with a relative difference >5% are shown. | ||
3.5. Ferroxidase enzyme
Abundance of enzymes related to iron metabolism in bacteria was calculated using the Paprica52 pipeline, which conducts a metabolic inference from 16S rRNA gene sequence libraries. Specifically, we extracted pathway and time changes in abundance of ferroxidase enzyme (EC1.16.3.1).Compared to the control, the abundance of ferroxidase changed in the presence of nZVI and mZVI over the 21 day experiment (Fig. S5†), with the enzyme gradually increasing in Roseiflexus sp. and the species Roseiflexus castenholizii but decreasing in Fluviicola taffensis (Fig. S6†). Based on our data, there was no indication of ferroxidase enzyme in the genus Sediminibacterium.
4. Discussion
The use of commercially produced ZVI particles for remediation of polluted aquatic habitats has resulted in questions regarding their impact on naturally occurring microbial communities.15,54,55 Microbial communities are important in aquatic habitats as they are responsible for dissolved carbon transfer to higher trophic levels (the microbial food web concept). They have also been described as key players in the self-purification of lakes and reservoirs,56 and as such possess high ecological potential. In contrast to previous studies,33 we opened a black box and identified freshwater heterotrophic bacteria that were affected by nZVI and mZVI particles.4.1. Effect of ZVI on phytoplankton and associated bacteria
We observed different effects of nZVI and mZVI on freshwater reservoir microorganisms (Fig. 4 and 5). Presence of nZVI, for example, significantly stimulated growth of cultivable bacteria but reduced the number of algae on day 3 and day 7, compared to the control (Fig. 4A and C). On the other hand, addition of mZVI resulted in a slight increase in cyanobacteria, which was rather surprising (Fig. 4B and 5). While the use of nZVI has been suggested for prevention of harmful cyanobacterial blooms,11,12 our study revealed no significant effect of nZVI on cyanobacteria.The association of distinct bacterial consortia with specific algae is known as the “phycosphere”. In our study, we found similar bacterial clades as described for the M. aeruginosa phycosphere in plateau lake,57i.e. Brevundimonas, the OM27 clade and Roseomonas. The genus Brevundimonas (Caulobacteraceae) has been described as a keystone species in particle-associated bacterial communities during M. aeruginosa blooms57 and, while information on clade OM27 is limited, Roseomonas sequences have been detected in freshwater bacterial communities associated with cyanobacterial blooms in four Swedish lakes.58
Additionally, we also observed that cyanobacterial colonies of M. aeruginosa (cells 4–5 μm) dominant up to day 7 in mZVI, were then outcompeted by M. flos-aquae and W. naegeliana (cells 2–3 μm). Small-cell colonies were most probably more capable of competition for nutrients, because similar trends were observed in nZVI and control as well. Increasing proportion of disintegrated and partly decayed cyanobacterial cells towards the end of the experiment could be caused by depletion of nutrients, and, moreover algicidal bacteria (e.g. Brevundimonas, Fig. 6) might work against cyanobacteria. Algicidal bacteria that can associate with cyanobacteria have the capability to control their proliferation in fresh water and even to lyse them.59
The reduction of small green algae after seven days in nZVI was most probably due to unfavourable conditions due to decline in ORP and depletion of bioavailable phosphorus,11,12 while the decrease of algal number over the 21 days of the experiment in nZVI, mZVI as well as in control strongly suggests the nutrient limitation. Consequently, bacteria decomposing algal cell walls were favoured by the availability of polysaccharides. We speculate that the increase in relative abundance in the OPB35_soil_group (Verrucomicrobia, Fig. 7) could be linked to the decay of algae due to its capability for active polysaccharide degradation (laminarin and xylose) of the closely-related genus Limnisphaera.60
4.2. Oxygen and ORP drive microbial community composition
Compared with the control and mZVI samples, nZVI reductive reactivity resulted in a significant drop in dissolved oxygen and ORP at the start of the experiment (Fig. 3). Consequently, the strictly aerobic genus Sediminibacterium (Chitinophagaceae)61 population decreased with nZVI, but not in the control or with mZVI (Fig. 6). Moreover, the low dissolved oxygen concentration most probably affected phagotrophic protists, such as heterotrophic flagellates and ciliates. Both these protist groups are efficient grazers on bacteria and, as such, exhibit “top-down” control.62 As grazing on bacteria was found to be negligible under anoxic conditions,63 absence of oxygen probably released bacteria from grazing pressure and shifted the community from small-size grazing-resistant prokaryotes to fast-growing opportunists.64 In support of our hypothesis, the addition of nZVI strongly favoured growth of Limnohabitans (Betaproteobacteria), facultative anaerobes65,66 and fast growing bacteria that often dominate in bacterivore-free (<0.8 μm) treatments.67 In contrast, the freshwater LD12 cluster (Alphaproteobacteria) and Verrucomicrobia, with their slow-growth life strategy, were depleted in the same treatments. The lesser decrease in ORP (though persistent over the 21 days) caused by mZVI resulted in Opitutae_vadinHA64 and OPB35_soil (Verrucomicrobia) being slightly enriched. Opitutae_vadinHA64 have recently been recorded in the epilimnion of freshwater lakes with higher dissolved oxygen concentrations,68 similar to that in the mZVI treatment, and thus we can assume that this cluster prefers aerobic conditions. Unfortunately, Verrucomicrobia are still poorly understood, many publications have noted that different members of this group have different oxygen requirements, some being strict aerobes while others are facultative anaerobes or strict anaerobes.69–724.3. Response of rare bacterial taxa
Rare bacteria have been proposed as drivers of key functions in aquatic systems as they outnumber the dominant group diversity and each represents a specific metabolic combination.73 Their appearance in samples after experimental manipulation suggests that conditions differed from in situ reservoir conditions, where they were almost absent. Our experiment promoted growth of the biofilm-forming taxa Azospirillum (Rhodospirillaceae, Alphaproteobacteria) and Paludibacter (Porphyromonadaceae, Bacteroidetes), both having a negligible relative abundance at day 0 but increasing dramatically over the next three weeks of the experiment (Fig. 6). Azospirillum bacteria are diazotrophs with the capacity for sulphur-chemolithotrophy.74 The strictly anaerobic Paludibacter has previously been reported as the most abundant genus on biofilms forming on particles of 0.02–0.2 mm under static conditions.75 Similarly, the genus Desulfomonile, which bloomed after seven days but then vanished up until day 21 in both treatments (Fig. 6), has previously been reported as a rare taxa from acidic peatlands responding to sulphate incubation.76 Populations of the filamentous bacteria ‘Candidatus Aquirestis’ (LD2/SOL cluster, Bacteroidetes) benefitted from the experimental setup and established strong populations in nZVI and reservoir water after 21 days. These bacteria primarily inhabit the pelagic zone of non-acidic stagnant inland waters and show a strong spring peak, with minor peaks in summer and early autumn.77 To conclude, the emergence of rare bacterial taxa indicates changes in water chemistry and the availability of nutrients. In our study, this appears to have been due to increasing nitrogen limitation, a higher availability of sulphur and iron, and the decay of algae with polysaccharide cell walls.4.4. Oligotrophic bacteria depletion in nZVI
Manipulation experiments may lead to nutrient depletion during transfer from a dissolved to a particulate (biomass) fraction. The freshwater clusters hgcI (Actinobacteria) and LD12 (Alphaproteobacteria) are small slow-growing bacteria with a passive life style favoured by oligotrophic conditions.68 We hypothesise that their relatively high abundance in the reservoir water control and mZVI treatments could serve as indicators of nutrient depletion, while their lower numbers in the nZVI treatment suggest nutrient remineralisation.In soils, Verrucomicrobia generally displays an oligotrophic life strategy.78 Currently, members of the phylum Verrucomicrobia are increasingly being recognised as abundant species in aquatic habitats,68 with prevalence of cluster CL0-14 being negatively correlated with high pH and positively correlated with hydraulic retention time and temperature, as are the oligotrophic clusters LD12 (freshwater SAR11 cluster) and LD28 (Methylopumilus spp.).79 Our manipulations demonstrated a striking decrease in the abundance of the Verrucomicrobia cluster Opitutae_vadinHA64 after nZVI addition, similar to that for the hgcI and LD12 clusters (Fig. 6). The Opitutae_vadinHA64 cluster represents around 80% of all Verrucomicrobia in the Harcov reservoir; hence, it has great potential as an indicator clade of nZVI. However, more information is still needed on its ecophysiology, distribution, phylogeny and diversity.
4.5. ZVI particles enhance growth of bacteria with ferroxidase
Typically for natural freshwaters, dissolved Fe(II) was found at very low concentrations (0.1 to 0.01 mg L−1; Table S3†) in this study. On the other hand, oxidation of Fe(0) releasing soluble Fe(II), which was further converted into insoluble Fe(III), was ongoing throughout the experiment.80 Iron oxidising bacteria may have caused the increase in cultivable bacteria, also supported by the simultaneous increase in ferroxidase enzyme, a key enzyme in Fe(II) oxidation. The most probable source in this case was the nZVI, which can supply extra Fe(II) for bacterial metabolism.To date, all known oxygen-dependent, neutrophilic and lithotrophic iron oxidisers have been recorded within the Proteobacteria23,81 and for Comamonadaceae in groundwaters at neutral pH.82 In this study, however, we confirmed Roseiflexus sp. and Roseiflexus castenhozii as being heavily involved in the increase of ferroxidase, a fact not reported elsewhere (Fig. S5 and S6†). Similar trends were observed in a microcosm study on the River Thames, the authors presuming that the increase in total bacteria was attributable to the Fe oxidation process itself.15 In a previous study, Sediminibacterium was identified as an iron-oxidising bacterium actively promoting the corrosion of cast iron pipes alongside sulphur-oxidising and iron-reducing bacteria.83 In our study, the comparable levels recorded in the control and mZVI treatment suggest that Sediminibacterium were not promoted by the addition of ZVI particles.
4.6. ZVI particle fate in the aquatic environment
The behaviour of nZVI and mZVI is strongly dependent on environmental conditions. In our case, the detection and measurement of ZVI particles was only possible after centrifugation or filtration, following the removal of large debris particles or microorganisms. As with mZVI, nZVI tended to show higher aggregation/agglomeration in centrifuged rather than filtered reservoir water (Fig. 1 and 2), most probably due to a higher content of colloids that remained after centrifugation. Hence, we believe that centrifuged reservoir water is more comparable to natural reservoir water than filtered water. Stronger particle aggregation is often connected with higher pH values16,19 and, indeed, water from the Harcov reservoir was somewhat alkaline (pH 8.0). The pH increased still further up to 8.8 with ZVI as an electron donor (Fig. 3), though the pH decreased to ∼7.4 over the next 21 days in both ZVI treatments. Under the oxic conditions in our study, released Fe(II) quickly oxidised to Fe(III) and most probably formed stable colloids with natural organic matter84 that were not harmful to microorganisms. Moreover, the aggregated ZVI particles rapidly formed a sediment, which could reduce their effect on freely-swimming microorganisms in the water column, allowing them to escape direct contact.20,30 Oxidation of nZVI led to a decline in ORP and dissolved oxygen concentration after one day (Fig. 3), which had a strong influence on shifts in bacterial community, as described above. However, these values increased again as nZVI oxidised and reductive capacity was spent, resulting in values comparable with the control, the process being driven further by the growth and activity of the microorganisms described above.5. Conclusions
In general, nZVI showed a stronger effect on planktonic microorganisms than mZVI, most probably due to its higher reactivity. nZVI significantly stimulated the growth of cultivable bacteria and iron-oxidising bacteria but slightly reduced the growth of algae. Phagotrophic flagellates and ciliates were most probably affected by low dissolved oxygen concentration, such conditions releasing bacteria from grazing pressure and shifting the community from small grazing-resistant prokaryotes to fast-growing opportunists. In support of this hypothesis, nZVI strongly favoured growth of the facultative anaerobe Limnohabitans and other opportunist bacteria that can come to dominate in bacterivore-free treatments, whereas the LD12 cluster and Verrucomicrobia, with slow-growing life strategies, were depleted. Unexpectedly, mZVI resulted in a slight increase in cyanobacterial number, which could be explained by increase in small-cell colonies of M. flos-aquae, and W. naegeliana. Further in situ studies that more realistically mimic reservoir conditions could well reveal more information on the influence of ZVI on natural microbial communities, including parts of the microbial food web not covered here such as heterotrophic flagellates and viruses.Conflicts of interest
There are no conflicts to declare.Acknowledgements
The research reported in this paper was financially supported by the Technology Agency of the Czech Republic within “Nanobiowat” under Project no. TE01020218, and by the Ministry of Education, Youth and Sports under the framework of targeted support for the “National Programme for Sustainability I”, the OPR & DI project (LO 1201) and NanoEnvi, Project no. LM2015073. The work of N. Nguyen was partly supported by MŠMT under SGS Project no. 21176/115 of the Technical University of Liberec. V. Kasalický was supported by Czech Science Foundation Project no. 15-12197S.References
- P. Bardos, B. Bone, M. Černík, D. W. Elliott, S. Jones and C. Merly, Remediation, 2015, 26, 101–108 Search PubMed.
- Y. S. El-Temsah and E. J. Joner, Chemosphere, 2012, 89, 76–82 CrossRef CAS PubMed.
- A. Ševců, Y. S. El-Temsah, J. Filip, E. J. Joner, K. Bobčíková and M. Černík, Environ. Sci. Pollut. Res., 2017, 24, 21191–21202 CrossRef PubMed.
- K. J. Cantrell, D. I. Kaplan and T. W. Wietsma, J. Hazard. Mater., 1995, 42, 201–212 CrossRef CAS.
- R. A. Crane and T. B. Scott, J. Hazard. Mater., 2012, 211–212, 112–125 CrossRef CAS PubMed.
- Wei-xian Zhang and W. X. Zhang, J. Nanopart. Res., 2003, 5, 323–332 CrossRef CAS.
- N. C. Mueller, J. Braun, J. Bruns, M. Černík, P. Rissing, D. Rickerby and B. Nowack, Environ. Sci. Pollut. Res., 2012, 19, 550–558 CrossRef CAS PubMed.
- S. Comba, A. Di Molfetta and R. Sethi, Water, Air, Soil Pollut., 2011, 215, 595–607 CrossRef CAS.
- J. Němeček, P. Pokorný, O. Lhotský, V. Knytl, P. Najmanová, J. Steinová, M. Černík, A. Filipová, J. Filip and T. Cajthaml, Sci. Total Environ., 2015, 563–564, 822–834 Search PubMed.
- F. Fu, D. D. Dionysiou and H. Liu, J. Hazard. Mater., 2014, 267, 194–205 CrossRef CAS PubMed.
- B. Marsalek, D. Jancula, E. Marsalkova, M. Mashlan, K. Safarova, J. Tucek and R. Zboril, Environ. Sci. Technol., 2012, 46, 2316–2323 CrossRef CAS PubMed.
- V. K. Sharma, L. Chen, B. Marsalek, R. Zboril, K. E. O'Shea and D. D. Dionysiou, Water Sci. Technol.: Water Supply, 2016, 17, 107–114 CrossRef.
- R. Köber, H. Hollert, G. Hornbruch, M. Jekel, A. Kamptner, N. Klaas, H. Maes, K.-M. Mangold, E. Martac, A. Matheis, H. Paar, A. Schäffer, H. Schell, A. Schiwy, K. R. Schmidt, T. J. Strutz, S. Thümmler, A. Tiehm and J. Braun, Environ. Earth Sci., 2014, 72, 3339–3352 CrossRef.
- P. Bardos, B. Bone, P. Daly, D. Elliott, S. Jones, G. Lowry and C. Merly, A Risk/Benefit Appraisal for the Application of Nano-Scale Zero Valent Iron ( nZVI ) for the Remediation of Contaminated Sites, WP9 NanoRem, 2014 Search PubMed.
- R. J. Barnes, C. J. van der Gast, O. Riba, L. E. Lehtovirta, J. I. Prosser, P. J. Dobson and I. P. Thompson, J. Hazard. Mater., 2010, 184, 73–80 CrossRef CAS PubMed.
- M. Auffan, W. Achouak, J. Rose, M. A. Roncato, C. Chanéac, D. T. Waite, A. Masion, J. C. Woicik, M. R. Wiesner and J. Y. Bottero, Environ. Sci. Technol., 2008, 42, 6730–6735 CrossRef CAS PubMed.
- C. Lei, L. Zhang, K. Yang, L. Zhu and D. Lin, Environ. Pollut., 2016, 218, 505–512 CrossRef CAS PubMed.
- A. Ševců, Y. S. El-Temsah, E. J. Joner and M. Černík, Microbes Environ., 2011, 26, 271–281 CrossRef.
- A. Keller, K. Garner, R. J. Miller and H. S. Lenihan, PLoS One, 2012, 7, 1–10 Search PubMed.
- M. Diao and M. Yao, Water Res., 2009, 43, 5243–5251 CrossRef CAS PubMed.
- M. L. Saccà, C. Fajardo, G. Costa, C. Lobo, M. Nande and M. Martin, Chemosphere, 2014, 104, 184–189 CrossRef PubMed.
- W. Zhang, C.-B. Wang and H.-L. Lien, Catal. Today, 1998, 40, 387–395 CrossRef CAS.
- S. Hedrich, M. Schlömann and D. B. Johnson, Microbiology, 2011, 157, 1551–1564 CrossRef CAS PubMed.
- M. L. Saccà, C. Fajardo, M. Nande and M. Martín, Microb. Ecol., 2013, 66, 806–812 CrossRef PubMed.
- J. Y. Kim, H. J. Park, C. Lee, K. L. Nelson, D. L. Sedlak and J. Yoon, Appl. Environ. Microbiol., 2010, 76, 7668–7670 CrossRef CAS PubMed.
- C. Fajardo, M. L. Saccà, M. Martinez-Gomariz, G. Costa, M. Nande and M. Martin, Chemosphere, 2013, 93, 1077–1083 CrossRef CAS PubMed.
- C. Jiang, X. Xu, M. Megharaj, R. Naidu and Z. Chen, Sci. Total Environ., 2015, 530–531, 241–246 CrossRef CAS PubMed.
- Y. S. El-Temsah, A. Sevcu, K. Bobcikova, M. Cernik and E. J. Joner, Chemosphere, 2016, 144, 2221–2228 CrossRef CAS PubMed.
- J. Semerád and T. Cajthaml, Appl. Microbiol. Biotechnol., 2016, 100, 9809–9819 CrossRef PubMed.
- R. Hjorth, C. Coutris, N. H. A. Nguyen, A. Sevcu, A. Baun and E. Joner, Chemosphere, 2017, 182, 525–531 CrossRef CAS PubMed.
- C. Fajardo, L. T. Ortíz, M. L. Rodríguez-Membibre, M. Nande, M. C. Lobo and M. Martin, Chemosphere, 2012, 86, 802–808 CrossRef CAS PubMed.
- E. L. Tilston, C. D. Collins, G. R. Mitchell, J. Princivalle and L. J. Shaw, Environ. Pollut., 2013, 173, 38–46 CrossRef CAS PubMed.
- T. L. Kirschling, K. B. Gregory, E. G. Minkley, G. V. Lowry and R. D. Tilton, Environ. Sci. Technol., 2010, 44, 3474–3480 CrossRef CAS PubMed.
- J. Němeček and J. Lhotský, Sci. Total Environ., 2014, 485–486, 739–747 CrossRef PubMed.
- A. Schiwy, H. M. Maes, D. Koske, M. Flecken, K. R. Schmidt, H. Schell, A. Tiehm, A. Kamptner, S. Thümmler, H. Stanjek, M. Heggen, R. E. Dunin-Borkowski, J. Braun, A. Schäffer and H. Hollert, Environ. Pollut., 2016, 216, 1–9 CrossRef PubMed.
- L. G. Cullen, E. L. Tilston, G. R. Mitchell, C. D. Collins and L. J. Shaw, Chemosphere, 2011, 82, 1675–1682 CrossRef CAS PubMed.
- Y.-h. Shih, H. L. Chou, Y. H. Peng and C.-y. Chang, Bioresour. Technol., 2012, 108, 14–20 CrossRef CAS PubMed.
- M. Velimirovic, Q. Simons and L. Bastiaens, Chemosphere, 2015, 134, 338–345 CrossRef CAS PubMed.
- N. H. A. Nguyen, N. R. von Moos, V. I. Slaveykova, K. Mackenzie, R. U. Meckenstock, S. Thűmmler, J. Bosch and A. Ševců, Ecotoxicol. Environ. Saf., 2018, 154, 36–44 CrossRef CAS PubMed.
- G. V. Lowry, E. M. Hotze, E. S. Bernhardt, D. D. Dionysiou, J. A. Pedersen, M. R. Wiesner and B. Xing, J. Environ. Qual., 2010, 39, 1867–1874 CrossRef CAS PubMed.
- C. Colombo, G. Palumbo, J. Z. He, R. Pinton and S. Cesco, J. Soils Sediments, 2014, 14, 538–548 CrossRef CAS.
- J. Soukupova, R. Zboril, I. Medrik, J. Filip, K. Safarova, R. Ledl, M. Mashlan, J. Nosek and M. Cernik, Chem. Eng. J., 2015, 262, 813–822 CrossRef CAS.
- Z. Shi, D. Fan, R. L. Johnson, P. G. Tratnyek, J. T. Nurmi, Y. Wu and K. H. Williams, J. Contam. Hydrol., 2015, 181, 17–35 CrossRef CAS PubMed.
- T. J. Strutz, G. Hornbruch, A. Dahmke and R. Köber, J. Contam. Hydrol., 2016, 191, 54–65 CrossRef CAS PubMed.
- D. Ribas, M. Cernik, V. Martí and J. A. Benito, J. Nanopart. Res., 2016, 18, 181 CrossRef.
- I. Dolinová, M. Czinnerová, L. Dvořák, V. Stejskal, A. Ševců and M. Černík, Chemosphere, 2016, 157, 276–285 CrossRef PubMed.
- S. E. Dowd, T. R. Callaway, R. D. Wolcott, Y. Sun, T. McKeehan, R. G. Hagevoort and T. S. Edrington, BMC Microbiol., 2008, 8, 125 CrossRef PubMed.
- M. J. Claesson, Q. Wang, O. O'Sullivan, R. Greene-Diniz, J. R. Cole, R. P. Ross and P. W. O'Toole, Nucleic Acids Res., 2010, 38, 1–13 CrossRef PubMed.
- P. D. Schloss, S. L. Westcott, T. Ryabin, J. R. Hall, M. Hartmann, E. B. Hollister, R. A. Lesniewski, B. B. Oakley, D. H. Parks, C. J. Robinson, J. W. Sahl, B. Stres, G. G. Thallinger, D. J. Van Horn and C. F. Weber, Appl. Environ. Microbiol., 2009, 75, 7537–7541 CrossRef CAS PubMed.
- R. C. Edgar, B. J. Haas, J. C. Clemente, C. Quince and R. Knight, Bioinformatics, 2011, 27, 2194–2200 CrossRef CAS PubMed.
- A. J. Oksanen, F. G. Blanchet, M. Friendly, R. Kindt, P. Legendre, D. Mcglinn, P. R. Minchin, R. B. O. Hara, G. L. Simpson, P. Solymos, M. H. H. Stevens, E. Szoecs and H. Wagner, The Comprehensive R Archive Network, 2016, 2.4-1, pp. 1–291, https://github.com/vegandevs/vegan Search PubMed.
- J. S. Bowman and H. W. Ducklow, PLoS One, 2015, 10, 1–18 Search PubMed.
- R. J. Newton and S. L. McLellan, Front. Microbiol., 2015, 6, 1–13 CrossRef CAS PubMed.
- A. M. I. Niyas, J. Crit. Rev., 2014, 1, 26–39 Search PubMed.
- E. Lefevre, N. Bossa, M. R. Wiesner and C. K. Gunsch, Sci. Total Environ., 2015, 565, 889–901 CrossRef PubMed.
- M. A. Cooperstein and H. E. Canavan, Biointerphases, 2013, 8, 1–12 CrossRef PubMed.
- C. Yang, Q. Wang, P. N. Simon, J. Liu, L. Liu, X. Dai, X. Zhang, J. Kuang, Y. Igarashi, X. Pan and F. Luo, Front. Microbiol., 2017, 8, 1202 CrossRef PubMed.
- A. Eiler and S. Bertilsson, Environ. Microbiol., 2004, 6, 1228–1243 CrossRef PubMed.
- N. Meyer, A. Bigalke, A. Kaulfuß and G. Pohnert, FEMS Microbiol. Rev., 2017, 41, 880–899 CrossRef PubMed.
- M. Martinez-Garcia, D. M. Brazel, B. K. Swan, C. Arnosti, P. S. G. G. Chain, K. G. Reitenga, G. Xie, N. J. Poulton, M. L. Gomez, D. E. D. D. Masland, B. Thompson, W. K. Bellows, K. Ziervogel, C.-C. C. Lo, S. Ahmed, C. D. Gleasner, C. J. Detter and R. Stepanauskas, PLoS One, 2012, 7, 1–11 Search PubMed.
- Y. Kim, B. Kim, K. Kang and T.-Y. Y. Ahn, Int. J. Syst. Evol. Microbiol., 2016, 66, 4501–4505 CrossRef PubMed.
- K. Simek, J. Pernthaler, M. G. Weinbauer, J. R. Dolan, J. Nedoma, M. Masin and K. Hornak, Appl. Environ. Microbiol., 2001, 67, 2723–2733 CrossRef CAS PubMed.
- A. Oikonomou, M. Pachiadaki and T. Stoeck, FEMS Microbiol. Ecol., 2014, 87, 691–703 CrossRef CAS PubMed.
- J. Pernthaler, Nat. Rev. Microbiol., 2005, 3, 537–546 CrossRef CAS PubMed.
- M. W. Hahn, V. Kasalický, J. Jezbera, U. Brandt and K. Šimek, Int. J. Syst. Evol. Microbiol., 2010, 60, 2946–2950 CrossRef CAS PubMed.
- V. Kasalický, J. Jezbera, K. Šimek and M. W. Hahn, Int. J. Syst. Evol. Microbiol., 2010, 60, 2710–2714 CrossRef PubMed.
- K. Šimek, K. Horňák, J. Jezbera, J. Nedoma, P. Znachor, J. Hejzlar and J. Sed'a, Aquat. Microb. Ecol., 2008, 51, 249–262 CrossRef.
- R. J. Newton, S. E. Jones, A. Eiler, K. D. McMahon and S. Bertilsson, Microbiol. Mol. Biol. Rev., 2011, 75, 14–49 CrossRef CAS PubMed.
- P. J. Cabello-Yeves, R. Ghai, M. Mehrshad, A. Picazo, A. Camacho and F. Rodriguez-Valera, Front. Microbiol., 2017, 8, 1–17 Search PubMed.
- A. De Wever, K. Van Der Gucht, K. Muylaert, S. Cousin and W. Vyverman, Aquat. Microb. Ecol., 2008, 50, 113–122 CrossRef.
- J. Zhang, X. Zhang, Y. Liu, S. Xie and Y. Liu, Ann. Microbiol., 2014, 64, 1405–1411 CrossRef CAS.
- J. F. Humbert, U. Dorigo, P. Cecchi, B. Le Berre, D. Debroas and M. Bouvy, Environ. Microbiol., 2009, 11, 2339–2350 CrossRef CAS PubMed.
- A. Jousset, C. Bienhold, A. Chatzinotas, L. Gallien, A. Gobet, V. Kurm, K. Küsel, M. C. Rillig, D. W. Rivett, J. F. Salles, M. G. A. van der Heijden, N. H. Youssef, X. Zhang, Z. Wei and W. H. G. Hol, ISME J., 2017, 11, 853–862 CrossRef PubMed.
- Y. Kwak and J. H. Shin, Mar. Genomics, 2016, 25, 21–24 CrossRef PubMed.
- H. Fang, Y. Chen, L. Huang and G. He, Sci. Rep., 2017, 7, 1–14 CrossRef CAS PubMed.
- B. Hausmann, K.-H. Knorr, K. Schreck, S. G. Tringe, T. Glavina Del Rio, A. Loy and M. Pester, ISME J., 2016, 10, 2365–2375 CrossRef CAS PubMed.
- M. Schauer, C. Kamenik and M. W. Hahn, Appl. Environ. Microbiol., 2005, 71, 5900–5907 CrossRef CAS PubMed.
- G. T. Bergmann, S. T. Bates, K. G. Eilers, C. L. Lauber, J. G. Caporaso, W. A. Walters, R. Knight and N. Fierer, Soil Biol. Biochem., 2011, 43, 1450–1455 CrossRef CAS PubMed.
- M. M. Salcher, S. M. Neuenschwander, T. Posch and J. Pernthaler, ISME J., 2015, 9, 2442–2453 CrossRef CAS PubMed.
- A. J. Feitz, S. H. Joo, J. Guan, Q. Sun, D. L. Sedlak and T. D. Waite, Colloids Surf., A, 2005, 265, 88–94 CrossRef CAS.
- D. Emerson, E. J. Fleming and J. M. McBeth, Annu. Rev. Microbiol., 2010, 64, 561–583 CrossRef CAS PubMed.
- M. Blöthe and E. E. Roden, Appl. Environ. Microbiol., 2009, 75, 468–473 CrossRef PubMed.
- H. Wang, C. Hu, X. Hu, M. Yang and J. Qu, Water Res., 2012, 46, 1070–1078 CrossRef CAS PubMed.
- P. Liao, W. Li, Y. Jiang, J. Wu, S. Yuan, J. D. Fortner and D. E. Giammar, Environ. Sci. Technol., 2017, 51, 12235–12245 CrossRef CAS PubMed.
Footnote |
| † Electronic supplementary information (ESI) available. See DOI: 10.1039/c7en01120b |
| This journal is © The Royal Society of Chemistry 2018 |