
 Open Access Article
 This Open Access Article is licensed under a Creative Commons Attribution-Non Commercial 3.0 Unported Licence
Differences in bulk and microscale yttrium speciation in coal combustion fly ash†
Ross K.
Taggart
a,
Nelson A.
Rivera
 a,
Clément
Levard
b,
Jean-Paul
Ambrosi
b,
Daniel
Borschneck
b,
James C.
Hower
c and
Heileen
Hsu-Kim
*a
a,
Clément
Levard
b,
Jean-Paul
Ambrosi
b,
Daniel
Borschneck
b,
James C.
Hower
c and
Heileen
Hsu-Kim
*a
aDepartment of Civil and Environmental Engineering, Duke University, Durham, NC 27708, USA. E-mail: hsukim@duke.edu; Tel: +1-919-660-5109
bAix Marseille Univ, CNRS, IRD, INRA, Coll France, CEREGE, Aix-en-Provence, France
cCenter for Applied Energy Research, University of Kentucky, Lexington, KY 40511, USA
First published on 28th September 2018
Abstract
Coal combustion ash is a promising alternative source of rare earth elements (REE; herein defined as the 14 stable lanthanides, yttrium, and scandium). Efforts to extract REE from coal ash will depend heavily on the location and speciation of these elements in the ash. This study sought to identify the major chemical forms of yttrium (Y), as a representative REE in coal fly ash samples selected from major coal sources in the United States. Y speciation was evaluated using both bulk scale analyses (sequential extractions, Y K-edge X-ray absorption near-edge spectroscopy – XANES) and complementary analyses at the micron scale (micro-focus X-ray fluorescence and micro-XANES). Sequential selective extractions revealed that the REE were primarily in the residual (unextracted fraction) of coal fly ash samples. Extraction patterns for yttrium resembled those of the lanthanides, indicating that these elements were collectively dispersed throughout the aluminosilicate glass in fly ash. Bulk XANES analysis indicated that Y coordination states resembled a combination of Y-oxides, Y-carbonate, and Y-doped glass, regardless of ash origin. However, in the microprobe analysis, we observed “hotspots” of Y (∼10–50 μm) in some samples that included different Y forms (e.g., Y-phosphate) not observed in bulk measurements. Overall, this study demonstrated that yttrium (and potentially other REEs) are entrained in the glass phase of fly ash and that microscale investigations of individual high-REE regions in fly ash samples do not necessarily capture the dominant speciation.
Environmental significanceCoal combustion residues are large volume waste materials that have generated much attention for their disposal impacts to the environment. These impacts could be mitigated by instead extending the value chain of the waste and utilizing the ash as a source for rare earth elements (REEs). REEs such as yttrium are key constituents in many modern technologies, yet the global supply market for REEs is unstable. This work investigated differences between bulk- and micro-scale yttrium speciation in coal fly ash as a means to understand the chemical forms of REE in fly ash. This information is crucial to the development of efficient REE extraction processes for newly generated and legacy coal fly ash. |
1. Introduction
Rare earth elements (REE), herein including the 14 stable lanthanides, yttrium, and scandium, are critical materials in the defense, electronics, energy, optics, and automotive industries.1–4 Coal fly ash is one potential alternative source for REE, with some ashes exceeding 0.1% total REE content by weight.5–14 For many coal fly ashes produced in areas including the U.S., China, the U.K., Poland, Russia, and South Africa, REE are moderately enriched relative to upper continental crust (UCC) values.6,7,10,15–17 Given the vast quantities of coal fly ash produced each year, this waste stream represents a significant mass of REE if they can be efficiently extracted. The degree of REE enrichment in fly ash corresponds to the geological origin of the coal feedstock. In the U.S., ashes derived from central Appalachian and Illinois Basin (i.e. eastern U.S.) coals have significantly higher REE contents than those derived from Powder River Basin (i.e. western U.S.) coals.7,16–18 However, the mass of acid-extractable REE is often similar for eastern and western U.S. coal ashes due to the high leachability of REE in Powder River Basin coal ashes.7,19,20 Appalachian- and Illinois Basin-derived ashes require more aggressive methods to decompose the aluminosilicate glasses (such as alkaline extractions) for effective leaching of the REE into solution.20 The disparate REE recoveries from different ash samples highlight the need to better understand rare earth speciation and modes of occurrence in fly ashes.21–23 Information on the dominant REE-bearing phases of fly ash and the general and localized speciation of the REE can help inform REE extraction techniques for recovery purposes.9,24Previous studies have shown several modes of occurrence for the REE that include forms evenly distributed throughout the glassy matrix of the fly ash as well as discreet mineral phases within the ash matrix.23,25–28 For example, one study utilized electron microprobe wavelength dispersive elemental mapping to show that cerium (measured as a proxy for all REE) was dispersed throughout the glassy matrix of the fly ash particles.26 More recent microscopy studies indicated that some REE trace phases from the coal such as monazite crystals may persist in the ash but are fragmented due to thermal shock.25 REE nanoparticles may also contribute to REE enrichment in coal ash in the absence of discrete REE mineral phases.12 Analysis by SHRIMP-RG ion microprobe (15 μm spot size) found that Fe- and Ca-enriched aluminosilicate glass phases of fly ash were enriched in REE relative to the bulk ash while the quartz was consistently depleted.29 The high-Al glass phase mirrored the bulk REE distribution. A recent X-ray absorption near-edge spectroscopy (XANES) study used Ce as a proxy for REE and identified Ce both dispersed in the glass phase and as micro-scale hotspots, consistent with previous studies.23 Collectively these findings indicate that REEs partition into the aluminosilicate glass, the most abundant component of fly ash.30 However, because microscopy-based studies entail spot measurements within a highly heterogeneous ash matrix, it is unclear if these analyses are representative of the total element speciation in the sample.
The objective of this research was to examine and compare the speciation of REE in coal combustion fly ashes, with a focus on yttrium, through a combination of bulk and micro-scale approaches. In this study, sequential extractions were used to determine the fraction of REE and other elements associated with the major operationally-defined phases of fly ash: water soluble, exchangeable/acid soluble, reducible, and oxidizable. Yttrium K-edge XANES was also used to complement the determination of REE-bearing fractions via sequential extraction by investigating the speciation of REE in fly ash. Yttrium was used as a proxy for REEs due to the frequent co-localization of REEs in minerals, coals, and coal ashes.29,31 Previous studies have similarly used Ce as a proxy for REEs.23,26 Yttrium was chosen because it is one of four REEs (Ce, La, Nd, and Y) with high enough concentrations in fly ash for X-ray absorption spectroscopy (XAS) and it is categorized as a “critical” REE due to high demand.6 Furthermore, the Y K-edge (17![[thin space (1/6-em)]](https://www.rsc.org/images/entities/char_2009.gif) 038 eV) lacks the spectral interferences which hinder Ce LIII-edge measurements. Another study using Y K-edge XANES found that the local coordination of Y in calcite resembles that of Ho, suggesting that Y is a valid proxy at least for heavy REEs (HREE; lanthanides Tb to Lu and Y due to its similar atomic radius).32 We expected bulk XAS to show that yttrium was associated with the glassy aluminosilicate phase in fly ash rather than as a distinct yttrium mineral. We hypothesized that there would be greater variation in yttrium speciation observed using micro-XANES because individual high yttrium mineral particles could exist in the fly ash sample without influencing the bulk spectra. By exploring both the distribution and speciation of yttrium and other REE in fly ash using the above techniques, we sought to identify characteristics that could eventually lead to improvements in REE recovery processes.
038 eV) lacks the spectral interferences which hinder Ce LIII-edge measurements. Another study using Y K-edge XANES found that the local coordination of Y in calcite resembles that of Ho, suggesting that Y is a valid proxy at least for heavy REEs (HREE; lanthanides Tb to Lu and Y due to its similar atomic radius).32 We expected bulk XAS to show that yttrium was associated with the glassy aluminosilicate phase in fly ash rather than as a distinct yttrium mineral. We hypothesized that there would be greater variation in yttrium speciation observed using micro-XANES because individual high yttrium mineral particles could exist in the fly ash sample without influencing the bulk spectra. By exploring both the distribution and speciation of yttrium and other REE in fly ash using the above techniques, we sought to identify characteristics that could eventually lead to improvements in REE recovery processes.
2. Materials and methods
2.1. Materials
| Sample ID | Sample no. | Plant ID (location) | CCP type | Elemental composition (%) | Y (mg kg−1) | Rare earth elements | |||||
|---|---|---|---|---|---|---|---|---|---|---|---|
| Si as SiO2 | Al as Al2O3 | Fe as Fe2O3 | Ca as CaO | Total (mg kg−1) | Critical (%) | HNO3-extractable (%) | |||||
| App-FA1 | 93938 | I (Kentucky) | Fly ash, boiler 1 storage silo | 54.1 | 28.4 | 10.9 | 1.28 | 99.3 | 703 ± 0.3 | 35.3 ± 0.1 | 16.7 ± 0.6 |
| App-FA2 | 93963 | H (Kentucky) | Fly ash, boiler 2 | 52.1 | 26.5 | 14.1 | 2.05 | 103.8 | 655 | 38.3 | 19.5 |
| App-FA3 | 93932 | W (South Carolina) | Fly ash | 54.2 | 28.4 | 7.6 | 4.01 | 107.6 | 669 ± 5.1 | 36.7 ± 0.2 | 43.7 ± 2.2 |
| App-PA | 93965 | C (Kentucky) | Pond ash | 57.4 | 28.7 | 5.72 | 1.32 | 75.5 | 531 | 36.2 | 23.2 |
| IL-FA1 | 93895 | H (Kentucky) | Fly ash, boiler 3, ESP row 2 | 45.7 | 21.2 | 26.4 | 1.87 | 82.7 | 554 | 38.1 | 26.7 |
| IL-FA3 | 93964 | H (Kentucky) | Fly ash, boiler 3 | 48.5 | 23.1 | 22.2 | 1.89 | 81.8 | 524 | 38.5 | 12.7 |
| PRB-FA1 | 93966 | DE (Texas) | Fly ash | 38.3 | 22.5 | 5.21 | 22.9 | 50.7 | 406 ± 7.1 | 35.0 ± 0.1 | 52.4 ± 6.1 |
| PRB-FA2 | 93973 | SC (Georgia) | Fly ash | 39.2 | 20.7 | 5.98 | 22.4 | 50.5 | 384 | 36.1 | 53.3 |
| RSA-FA1 | 93969 | MA (South Africa) | Fly ash, classified | 53.7 | 31.5 | 3.68 | 4.98 | 69.0 | 622 | 30.4 | 20.4 |
All samples in Table 1 were examined for bulk Y speciation by XANES and for micron-scale elemental analysis via micro-focus X-ray fluorescence (μXRF). A subset of these were further analyzed for Y speciation at the micron scale by μXANES. For the sequential extractions, three samples (APP-FA1, IL-FA-1, and PRB-FA1) were selected based on their high total REE content and were also chosen to represent each of the three major U.S. coal basins. A summary of analyses performed for each sample is shown in Table S1.†
2.2. Sequential selective extractions
The sequential extraction procedure was adapted from the Revised BCR method, a standard procedure proposed by the Community Bureau of Reference for the analysis of sediments.36–39 Each fly ash sample was exposed to a series of leaching solutions: distilled water (F1), 0.11 M CH3COOH (F2), 0.5 M NH3OH·HCl adjusted to pH 2 using HNO3 (F3) and 30% H2O2 followed by 1.0 M CH3COONH4 adjusted to pH 2 using HNO3 (F4). Ash samples (5 g) were placed in 500 mL round-bottomed polypropylene vessels with 200 mL of extractant solution. The containers were sealed with Parafilm and mixed end-over-end overnight (∼16 h). After centrifuging for 1 h at 3000 × g, the extractant solution was carefully decanted and replaced with 100 mL of distilled water. The samples were then mixed end-over-end for 1 h, centrifuged for 1 h at 3000 × g, and decanted. Extractant solutions were diluted into 2% HNO3, 0.5% HCl solution for major and trace element concentration analysis. After each extraction step, a small aliquot of the ash (∼100 mg) was collected and dried for later analysis by XRD. The remaining solids were then exposed to the next extractant reagent and the leaching/centrifugation process was repeated. Recoveries were calculated relative to HF/HNO3 digestions performed separately and reported in our previous study.7For one sample (APP-FA1), the sequential extraction procedure was repeated except that 1 M oxalic acid (still adjusted to pH 2 using HNO3) instead of acetic acid was used in the F2 step. Oxalic acid was chosen due to its high affinity for aluminum and ability to dissolve aluminosilicates, which comprise the bulk of fly ash particles. We hypothesized that oxalic acid would dissolve more of the glass phase, thereby making a higher percentage of the REE accessible. We also hypothesized that this would lead to a corresponding difference in the XRD patterns between the acetic acid and oxalic acid treatments.
For XRD analysis of solids collected between each extraction step, the samples were dried, ground by mortar and pestle, and dispersed with ethanol on zero-background silicon discs which were then mounted to sample holders. The original untreated fly ash samples were ground and then packed into back-loading XRD sample holders. XRD spectra of the original and extracted fly ash samples were collected on a Panalytical X'Pert Pro MPD instrument equipped with an X'Celerator detector and Co-Kα radiation source (λ = 1.79 Å). Samples were scanned over a 2θ range of 5° to 75° with a step size of 0.033°. The background signal from the amorphous phases of the fly ash was subtracted to normalize all diffractograms. Spectra were analyzed using X'Pert Highscore Plus v2.2b and the ICDDPDF-2 database (2003).
2.3. Bulk XANES and μXANES analysis
Fly ash samples and reference compounds for yttrium XANES analysis were prepared by first grinding with mortar and pestle. The powdered samples were then packed into aluminum samples holders and covered with Kapton tape. The Y reference compounds were diluted with boron nitride before the initial grinding step.Three of the fly ash samples (App-FA1, IL-FA1, PRB-FA1) were further examined after extraction with oxalic acid or acetic acid to help understand results of the sequential extraction data. These samples are the same set selected for the sequential extraction experiments, but the extractions for XANES analysis were performed separately. The ash samples were extracted overnight with 1 mol L−1 oxalic acid or 1 mol L−1 acetic acid, rinsed with MilliQ water, allowed to dry, and loaded into sample holders as described previously.
Bulk yttrium speciation was analyzed by Y K-edge XANES collected in fluorescence mode on Beam Line 11-2 at the Stanford Synchrotron Radiation Lightsource (SSRL) utilizing a Si(220) phi = 0 crystal and a harmonic rejection mirror set to 20 keV. Yttrium energy calibration was performed with a Y metallic foil and the derivative of the first inflection point calibrated to 17038 eV. A germanium 100-element detector was used to collect fluorescence data along with an Al foil and a Sr filter to reduce the fluorescence signal of the other elements and scatter peak, respectively. Yttrium reference materials were analyzed in transmission mode (Fig. 4). All samples were held in a liquid nitrogen cryostat (77 K) during the collection of spectra.
For microprobe analysis, the samples were prepared in thin sections (30 μm thickness) by Spectrum Petrographics. Both μXRF and μXANES spectra were obtained at Beam Line 2-3 at the SSRL using a Si(111) phi = 0 crystal and a vortex silicon drift detector. The μXRF measurements were performed at an X-ray energy of 17100 eV with a nominal spot size of 5 μm by 5 μm. Yttrium hotspots were identified in fly ash thin sections via μXRF and the Y speciation of selected spots were analyzed by K-edge μXANES. Elemental fluorescence maps were analyzed using Sam's MicroAnalysis Toolkit (SMAK).40 The same yttrium reference compounds utilized for bulk Y-XANES were also analyzed by Y-μXANES (Fig. 4).
Each XANES and μXANES spectra was produced by averaging two separate scans (prior to normalization). Averaging, normalization, and linear combination fitting were performed using the software Athena.41 The linear combination fitting range was 17008 eV (30 eV below the Y K-edge) to 17158 eV (120 eV above the Y K-edge). Fits were selected to minimize both the R-factor (Table S2†) and the number of reference materials. Each sample spectrum was initially modeled to identify a combination of two reference spectra that could best fit the data. For each model fit, a third reference was added to the model only if both of the following conditions were met: (i) adding the third reference decreased the R-factor by 20% or more, (ii) the additional reference contributed ≥10% to the total fit weight.
3. Results
3.1. Leaching potential by sequential selective extractions
The sequential extractions revealed three major trends in the extractability of elements in power plant fly ash generated from the coals of three different U.S. coal basins (Fig. 1). First, the Powder River Basin ash (Fig. 1B) had much higher total recoveries (the sum of the F1, F2, F3, and F4 fractions) than the Illinois or Appalachian Basin ashes. This was true for most elements measured but was particularly evident for the lanthanides and Y; about two-thirds of each element in this series were recovered from the Powder River Basin ash compared to <15% for the Appalachian and Illinois Basin ashes. This result supports our previous findings that REEs in Powder River Basin ashes are significantly more extractable than those in eastern U.S. ashes.7 Furthermore, it demonstrates that this trend holds true for the targeted steps of the sequential extractions, not just heated digestions with concentrated acids. Except for the initial water leach, which only recovered trace amounts of the REE from all ash samples, all three subsequent extraction steps were markedly more effective for the Powder River Basin ash. Sc recoveries for the sum of F1–F4 fractions were consistently low relative to the lanthanides and Y for all three fly ash samples, regardless of coal origin.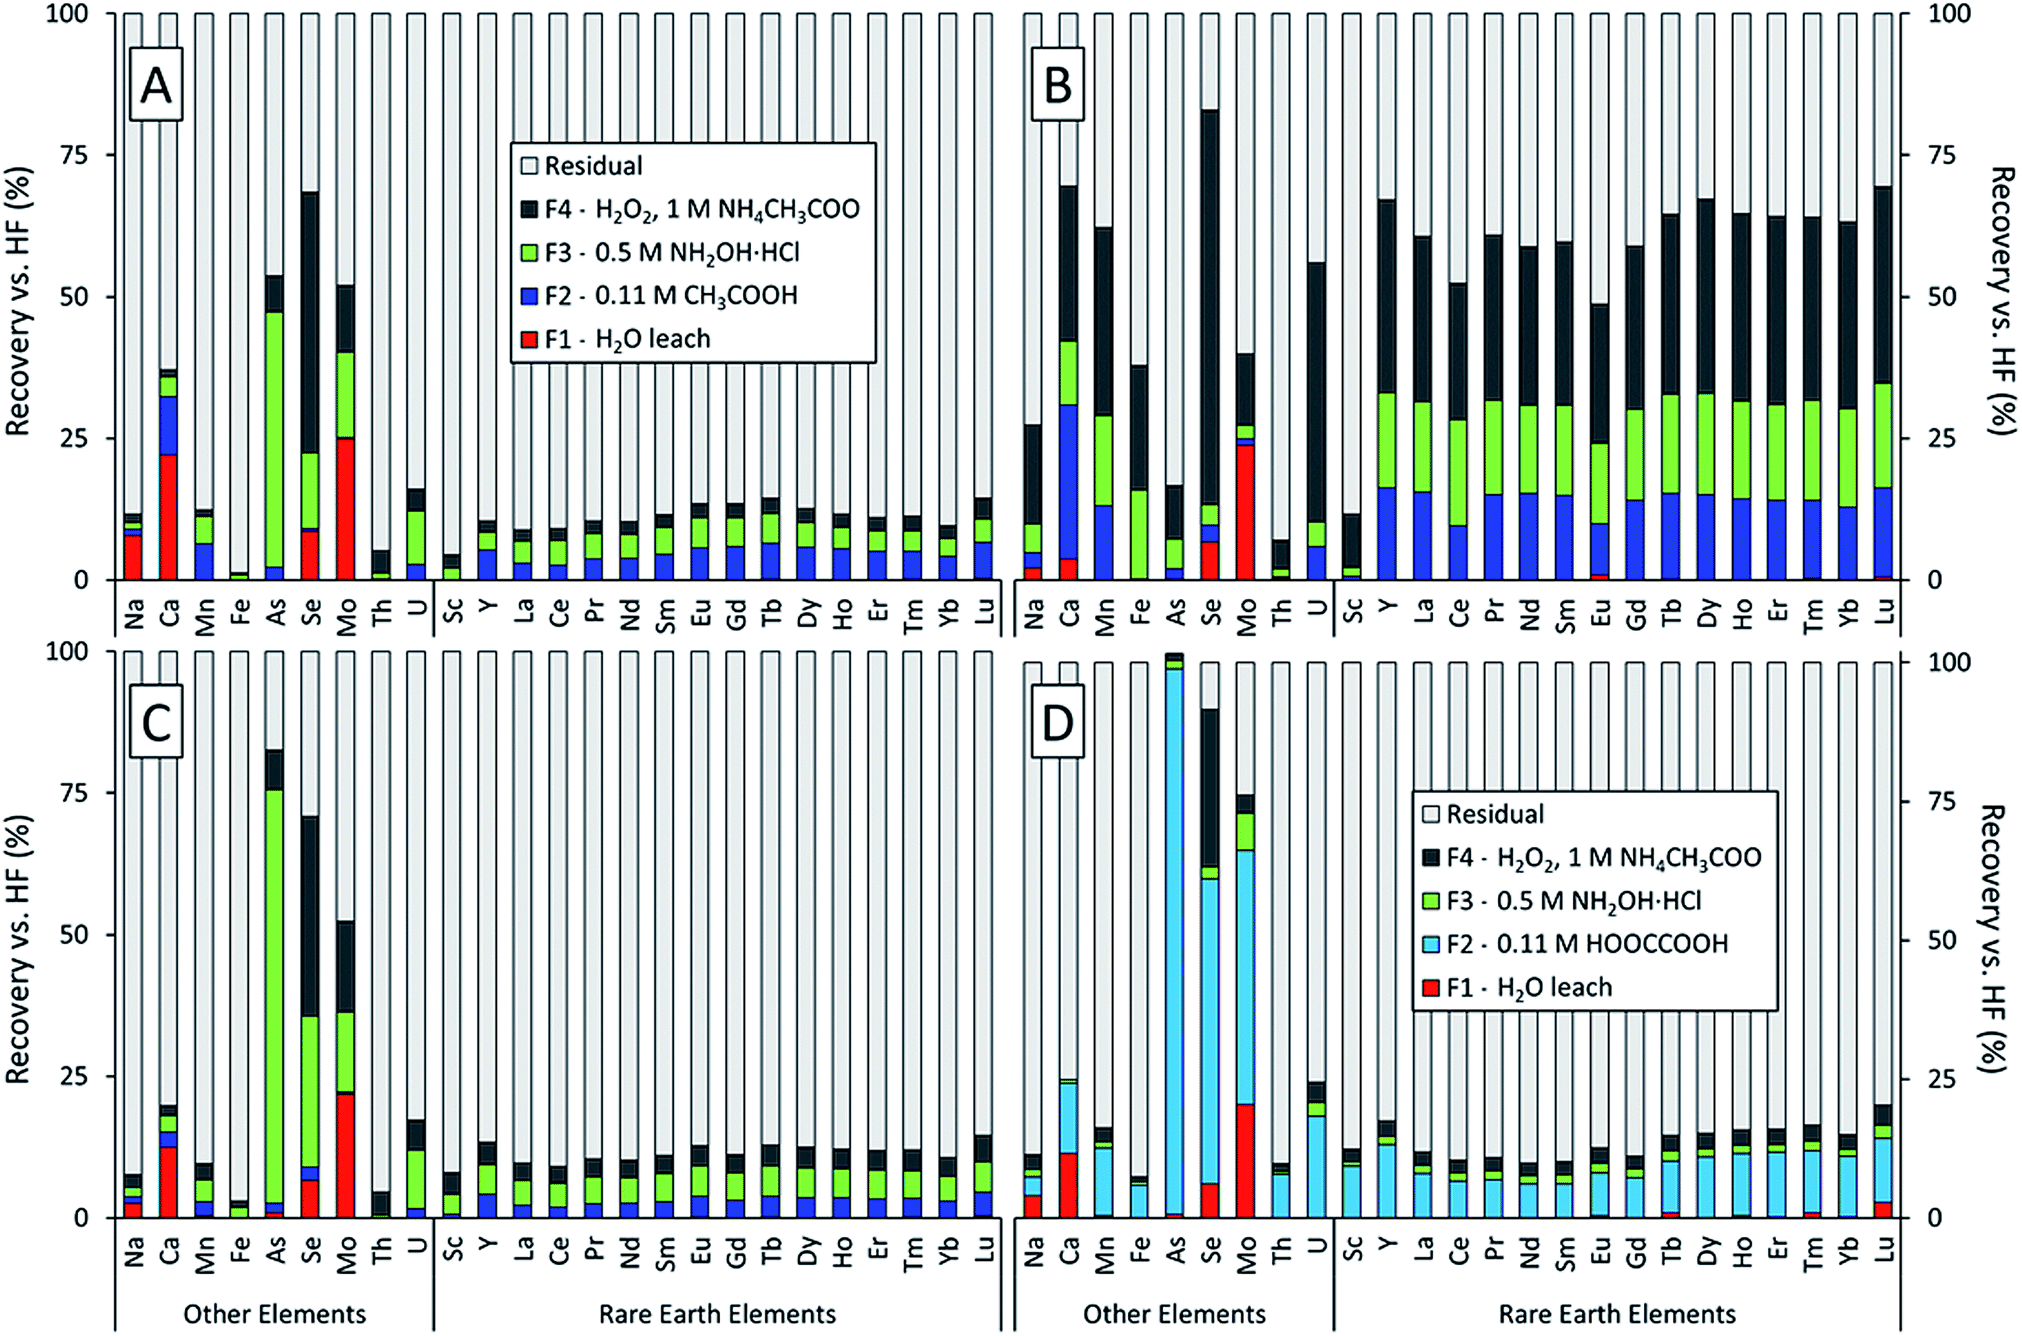 | ||
| Fig. 1 Sequential extraction results as percent recovery for three fly ash samples: (A) IL-FA1, (B) PRB-FA1, and (C), (D) APP-FA1. The target fractions were: water soluble (F1), acid soluble (F2), reducible (F3), and oxidizable (F4). The leaching solutions were distilled water (F1), 0.11 M CH3COOH or 0.11 M HOOCCOOH (F2), pH 2 NH2OH·HCl (F3), and H2O2/CH3COONH4 (F4). | ||
Second, despite their differing geological origin, all three ash samples shared the same set of highly mobile elements. Arsenic, molybdenum, and selenium had the highest recoveries among all measured elements for the Illinois and Appalachian basin ashes (Fig. 1A and C). These elements are also known to be volatile during the combustion process.22,42–47 Selenium also had the highest recovery for the Powder River Basin ash (Fig. 1B). Although Mo recovery was lower than expected for the Powder River ash, it had the highest recovery of all elements in the initial water leach at over 20% for all ash samples. Arsenic was the only highly mobile element not recovered by the water leach but had the highest total recovery for both Appalachian ash treatments. Paradoxically, total recovery for arsenic was among the lowest in the Powder River Basin ash.
Third, using oxalic acid instead of acetic acid in the F2 extraction for APP-FA1 (Fig. 1D) changed the distribution of elemental recoveries between the leachable fractions but did not appreciably increase the total recovery of REEs (sum of F1–F4 fractions). We initially hypothesized that oxalic acid would produce higher REE recoveries because it forms strong complexes with Al3+ and can dissolve amorphous aluminosilicates such as the glass in fly ash. Previous research has determined that extractions should target the abundant glass phase where REE are hosted.7,9,28,29 While the use of oxalic acid instead of acetic acid in the acid soluble (F2) step significantly increased total REE recoveries in this fraction, less REE recovery was observed in the subsequent reducible (F3) fraction. This result suggests that oxalic acid liberated REE forms that were soluble in the F3 step. However, the majority of REE remained in the residual regardless of whether acetic acid or oxalic acid was used in the F2 extraction step.
Quartz, mullite, and iron oxides were the primary crystalline phases identified by XRD (Fig. 2 and 3), consistent with previous studies.21,23,28 Quartz was easily identified in all three ash samples. Mullite was also found in all three ashes, but at low concentration in the Powder River Basin ash sample. Iron minerals identified in IL-FA1 and App-FA1 included maghemite and hematite. PRB-FA1 (Fig. 3) had noticeably different mineralogy than the Appalachian and Illinois Basin ashes. The presence of minor periclase (MgO) and anhydrite (CaSO4) peaks is consistent with the higher Ca and Mg content of Powder River Basin ashes. Several prominent peaks (∼11° 2θ and ∼19° 2θ) could not be matched to plausible compounds.
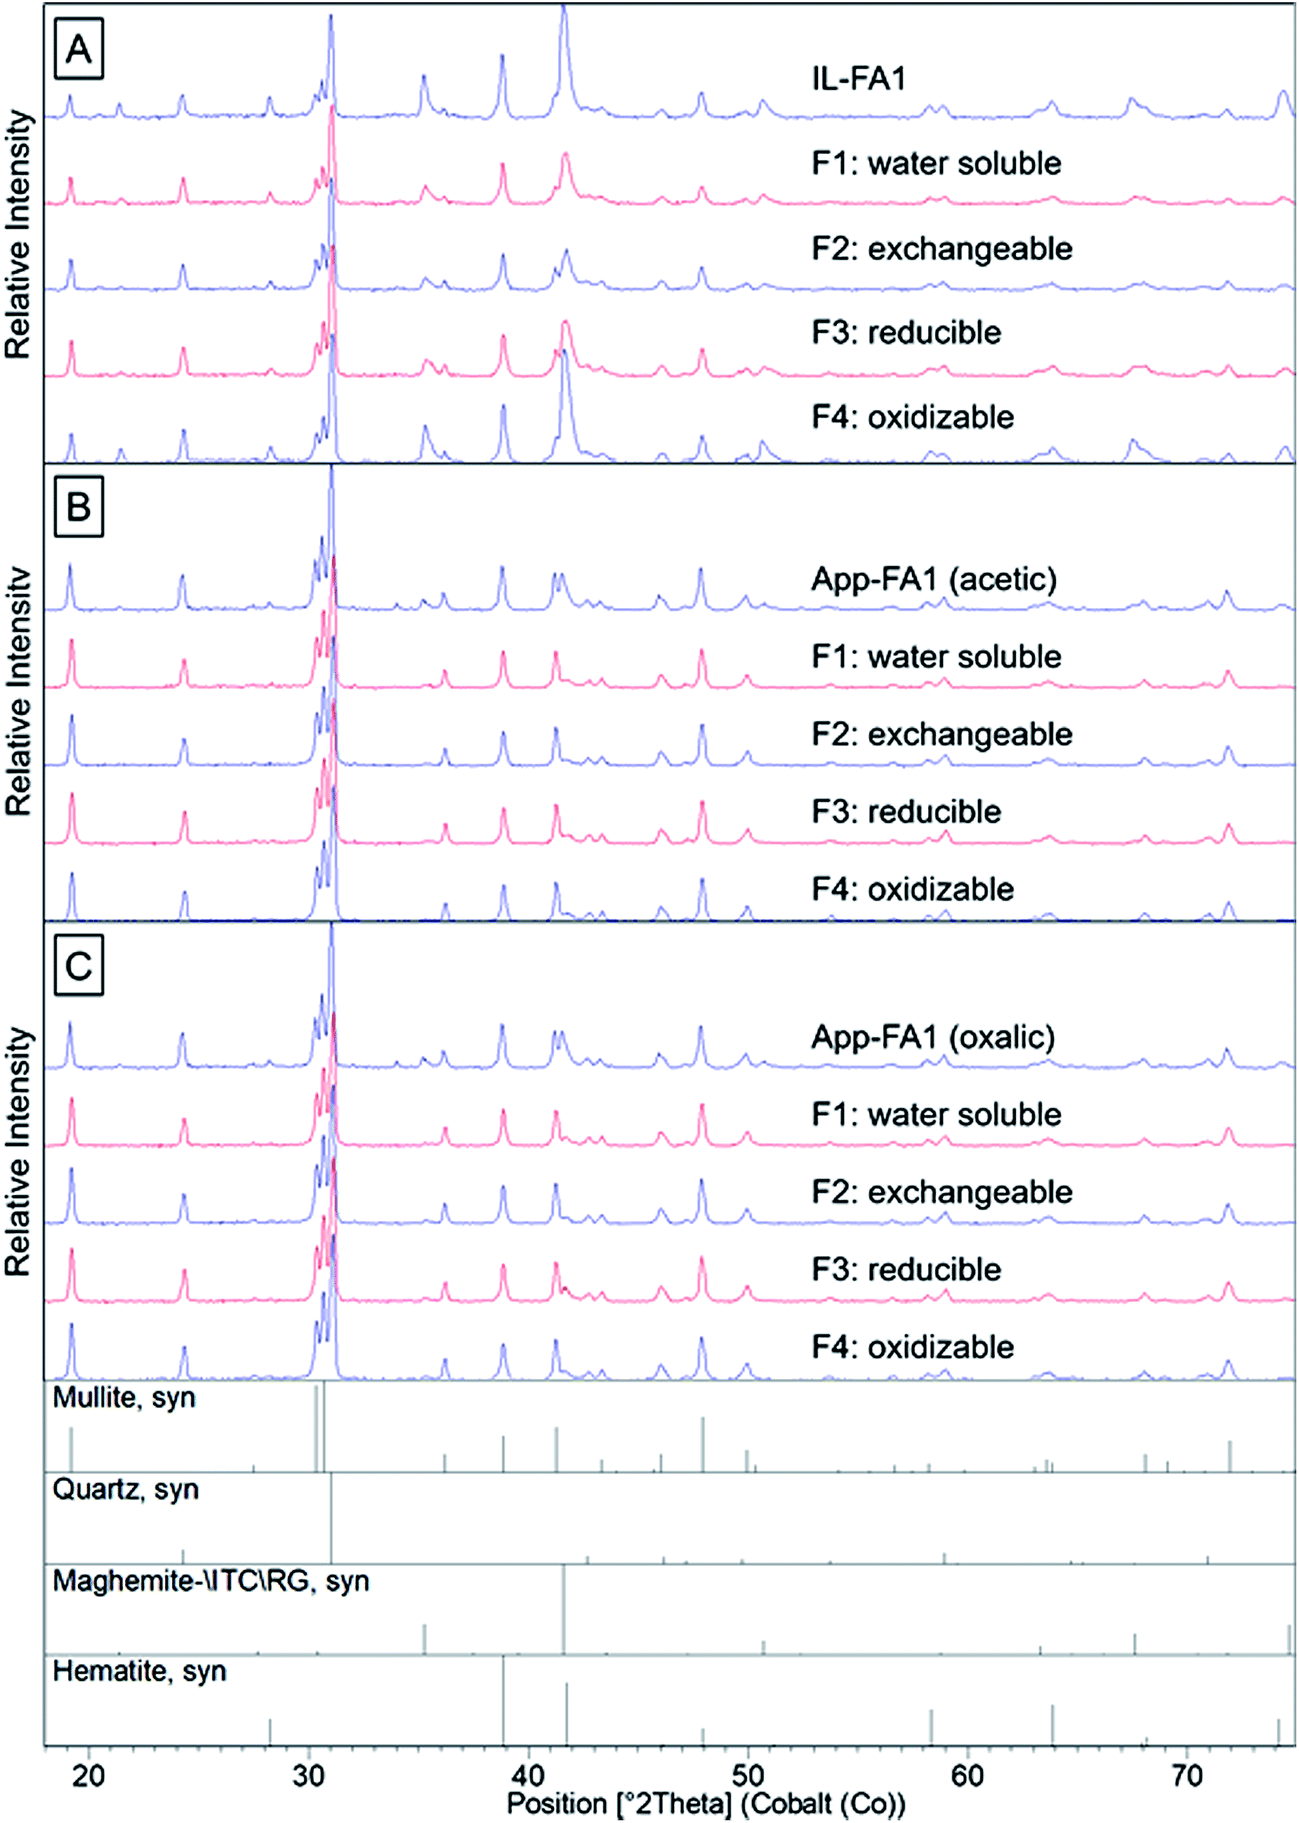 | ||
| Fig. 2 X-ray diffraction spectra for the original ash sample and the solid phase after each sequential selective extraction step for: (A) IL-FA1, (B) App-FA1 extracted with acetic acid in F2, and (C) App-FA1 extracted with oxalic acid in F2. The target fractions were: water soluble (F1), acid soluble/exchangeable (F2), reducible (F3), and oxidizable (F4). The leaching solutions were distilled water (F1), 0.11 M CH3COOH or 0.11 M HOOCCOOH (F2), pH 2 NH2OH·HCl (F3), and H2O2/CH3COONH4 (F4). | ||
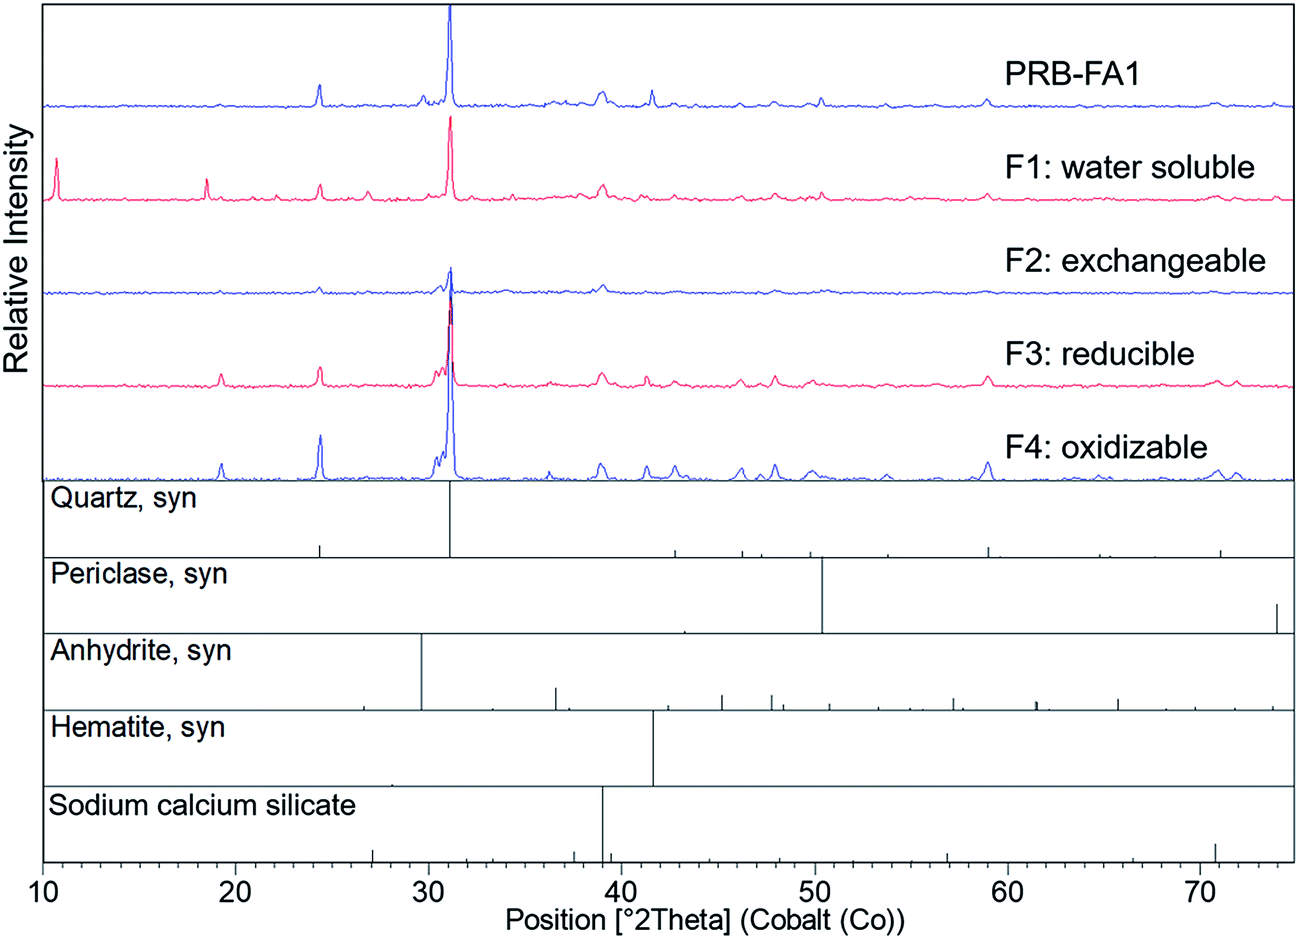 | ||
| Fig. 3 X-ray diffraction spectra for PRB-FA1 and the solid phase after each sequential selective extraction step. The target fractions were: water soluble (F1), acid soluble/exchangeable (F2), reducible (F3), and oxidizable (F4). The leaching solutions were distilled water (F1), 0.11 M CH3COOH (F2), pH 2 NH2OH·HCl (F3), and H2O2/CH3COONH4 (F4). | ||
The sequential extraction of the fly ash samples mostly did not change the XRD spectra for the solids. An exception was the Fe-oxide peak located at ∼42° 2θ in IL-FA1. The relative intensity of this peak decreased to a minimum after acetic acid extraction (F2) and then increased in relative intensity after the F3 and F4 extractions. The same Fe peak in App-FA1 also disappeared following the acetic and oxalic acid extractions (F2) but this peak never reappeared after F3 and F4 steps.
3.2. Bulk yttrium speciation for untreated and extracted ash
The spectra of seven different reference compounds were used to evaluate the speciation of yttrium in the ash samples. The spectral features for the Y-doped glass, monazite, and Y2(CO3)3·3H2O compounds were similar to each other in comparison to the distinct spectra of the other four reference materials (Fig. 4). Nevertheless, among these three materials (Y-doped glass, monazite, and Y2(CO3)3·3H2O), subtle differences included the right-shifted white-line peak position for the Y-doped glass spectrum and the lack of a peak shoulder at 17068 eV for the Y2(CO3)3·3H2O spectrum. As such, we used all seven reference spectra when fitting the sample spectra.
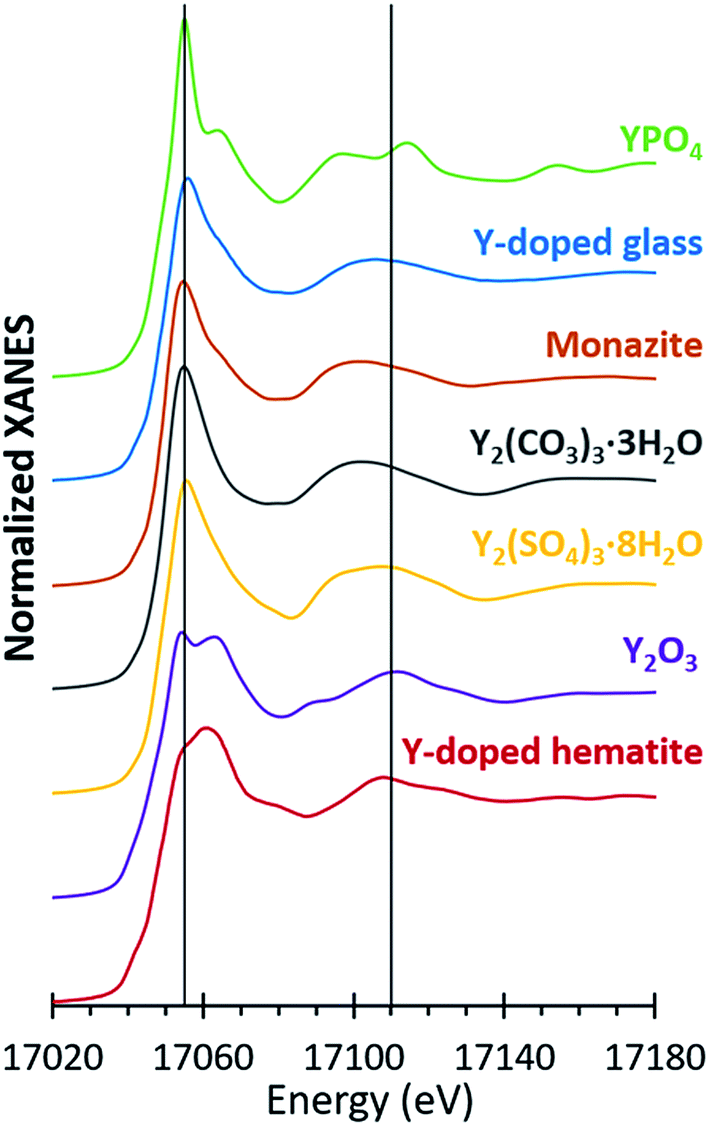 | ||
| Fig. 4 Yttrium K-edge spectra for yttrium reference compounds used in XANES linear combination fitting. Bulk XANES spectra were collected on beam line 11-2 at the Stanford Synchrotron Radiation Lightsource (SSRL). Micro-focus XANES spectra were collected on beam line 2-3 at the SSRL. For the Y-doped glass and hematite references (synthesized in lab) and the monazite reference (geological sample), only bulk spectra were collected. | ||
Linear combination fitting of the sample XANES spectra resulted in model fits with R-factors ranging from 0.000357 to 0.000797 for all nine ash samples (Table S2†). The weighted fits of reference spectra added to between 98.6% and 99.5% for the samples. Although the sample set included nine different ashes from four different coal basins, the spectral fits comprised similar reference materials (Fig. 5). All bulk ash fits were comprised primarily of Y2O3 (18% to 51%) and Y-doped glass (22% to 76%). Monazite was the next most represented reference, making up between 22% and 31% of the fits for five samples. The only other standards included in the bulk fits were YPO4 for App-FA2 (18%) and Y2(CO3)3 in IL-FA1 (30%) and App-PA (32%). For all Appalachian Basin and Illinois Basin samples, the Y2(CO3)3 reference spectra could be replaced by the monazite reference spectra without significantly altering the quality of the fit, indicating that the monazite and Y2(CO3)3 components may represent the same species. Y2(SO4)3, and the Y-doped hematite were not represented in any of the best fits for the untreated bulk fly ash samples.
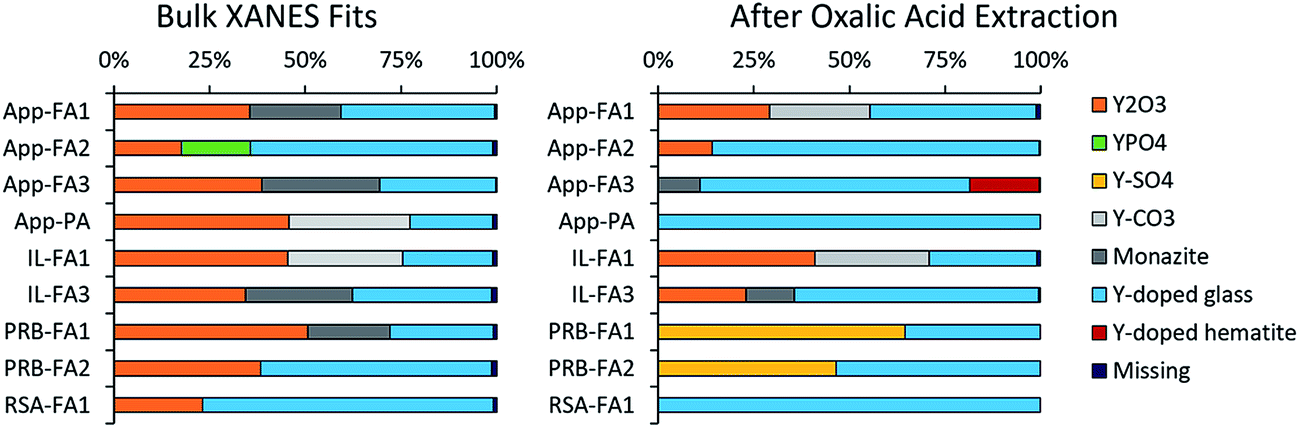 | ||
| Fig. 5 Linear combination fit weights for Y K-edge XANES spectra of bulk fly ash samples (unextracted and after oxalic acid extraction). For the oxalic acid extraction, ash samples were leached overnight in 0.11 M oxalic acid, rinsed with MilliQ water, and dried prior to XANES sample preparation. | ||
After extracting the ash samples overnight with 1 M oxalic acid (Fig. 5 and Table S3†), most of the bulk XANES fits were dominated by Y-doped glass rather than Y2O3. App-FA1 and IL-FA1 were fit by the same standards as previously, which is consistent with the low REE recovery by oxalic acid during sequential extractions (Fig. 1D). However, the other Appalachian Basin fits were dominated by Y-doped glass (71–85%) with minor contributions from Y2O3. The standards comprising the Illinois Basin sample fits were unchanged after oxalic acid extraction, but the fit for IL-FA3 contained more Y-doped glass instead of Y2O3 and monazite. The Powder River Basin fits were profoundly changed by oxalic acid extraction: before they were mostly Y2O3 and Y-doped glass; afterwards, the Y2O3 was replaced by 47–65% Y2(SO4)3. The fit of the South African fly ash (RSA-FA1) remained mostly Y-doped glass but gained 20% Y2(SO4)3 contribution.
Separate samples of App-FA1, IL-FA1, and PRB-FA1 were subjected to acetic acid extraction and bulk XANES analysis (Fig. S5† and Table S3†). For all three samples, Y-doped glass (59% to 76%) dominated the fits after acetic acid extraction with 23–40% Y-doped hematite.
3.3. Microscale Y speciation
Microprobe elemental analysis of Y revealed a selection of ashes (App-FA-1, App-FA3, IL-FA1, PRB-FA1, and PRB-FA-2) for which we could collect μXANES data for Y-enriched spots in the samples. Linear combination fitting of the μXANES data yielded R-factors between 0.00081 and 0.0080 (Tables S4 and S5†). The summed weights of Y references in the fits were between 95.9% and 103.5%.For Appalachian Basin ashes, we observed Y hotspots with spectral features that resembled YPO4. Points 1 and 2 of App-FA1 (shown in Fig. 6) were fit by 50–74% YPO4, while the bulk XANES fit contained no YPO4. The Y hotspot in Map 4 for App-FA3 closely matched the YPO4 spectrum, suggesting that this point was a discrete Y-phosphate particle (Fig. 7). In contrast, the Y-enriched areas of Map 6 from the same sample resembled the bulk XANES fits for Appalachian Basin ashes (Y2O3 and Y-doped glass) and the Y abundance was more distributed across Map 6 compared to the concentrated spot in Map 4.
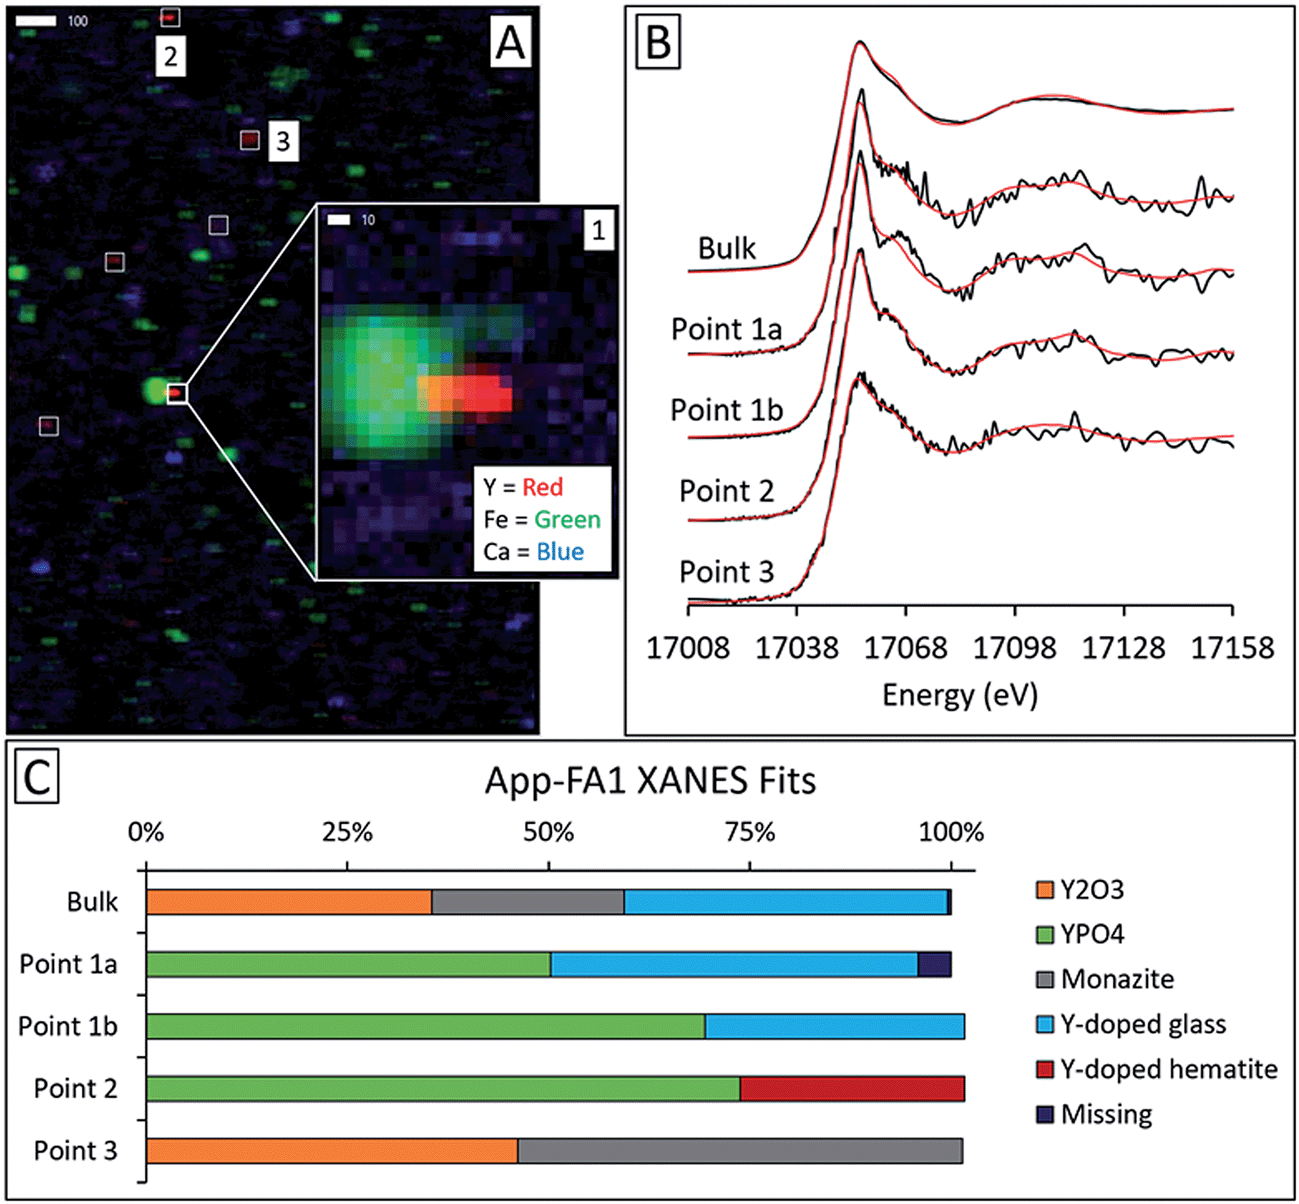 | ||
| Fig. 6 Synchrotron X-ray spectroscopy analysis of Appalachian silo ash App-FA1, including: (A) element maps collected by μXRF (17100 eV; scale bars are in μm) showing Y, Fe, and Ca locations, (B) Y K-edge bulk and micro-focus XANES spectra with linear combination fits indicated in red, and (C) fit weights. The fitting region was 17008 eV to 17158 eV. Points 1a and 1b were two separate scans of the same yttrium hotspot. | ||
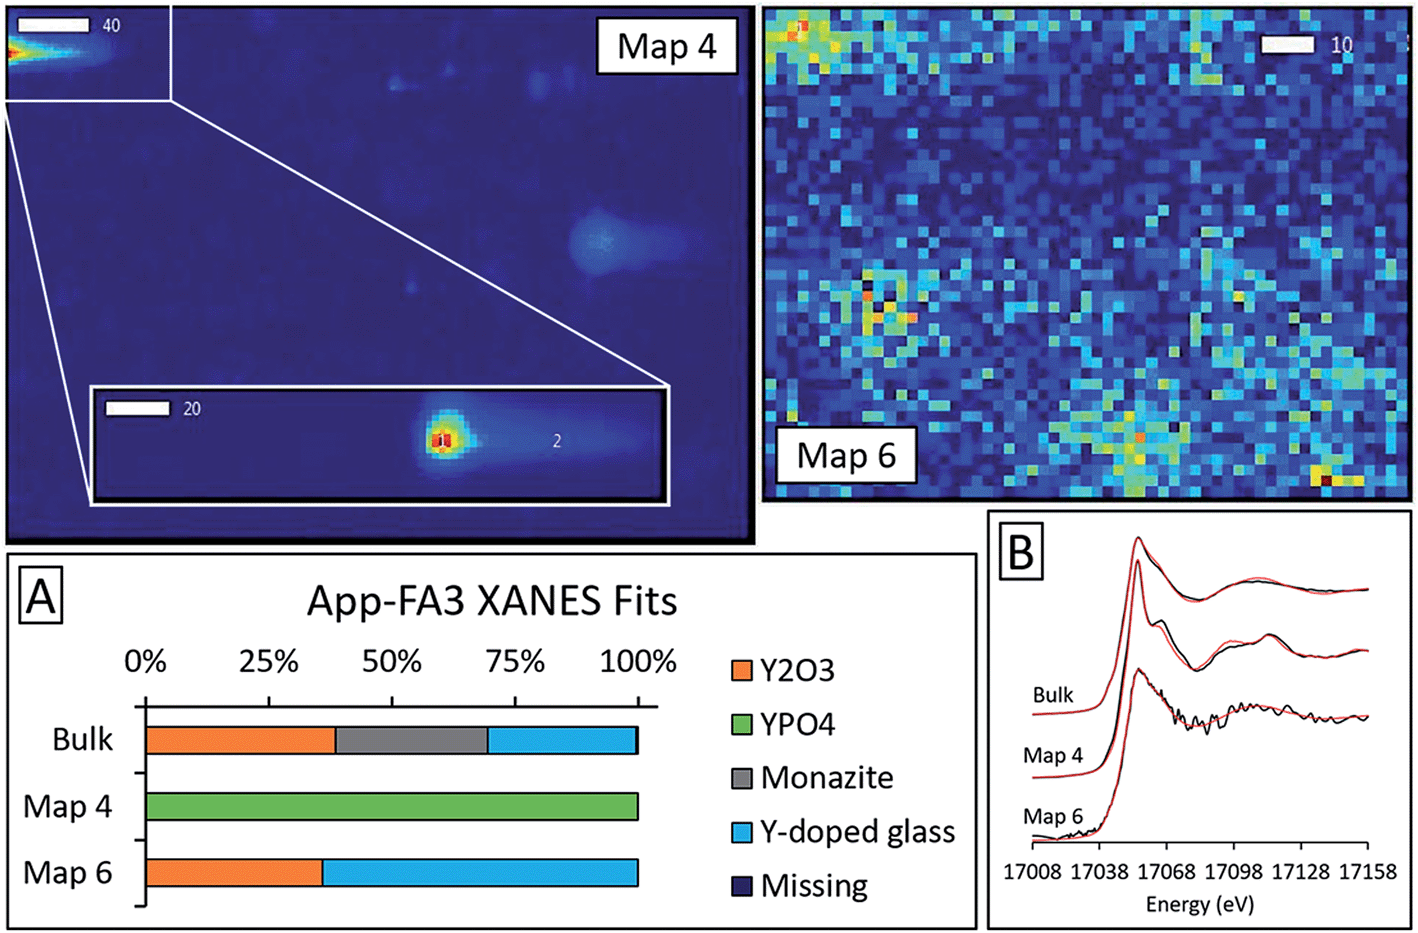 | ||
| Fig. 7 Synchrotron X-ray spectroscopy analysis of Appalachian fly ash App-FA3, including: (A) Y K-edge bulk and micro-focus XANES spectra with linear combination fits indicated in red and (B) fit weights. The fitting region was 17008 eV to 17158 eV. Map 4 and Map 6 show relative yttrium μXRF intensities for the regions containing the points analyzed with XANES (scale bars are in μm). | ||
Although the bulk XANES fits for IL-FA1 resembled those of the Appalachian Basin ashes, most of the Y hotspot fits were very different (Fig. 8). All μXANES fits included Y2O3 (36–63%) and a combination of Y2(CO3)3, and/or YPO4. All but one of the points analyzed included Y2(CO3)3 at 35–49%. Fits for two points contained YPO4 contributions (32% and 59%) like the Appalachian ashes. A second set of fits for IL-FA1 μXANES points (Fig. S6†) was less uniform, with 79–100% Y-doped glass in four points, 15–65% Y-doped hematite in three points, and 20–38% Y2O3 in two points. One fit contained 34% YPO4 spectra and another 63% monazite spectra.
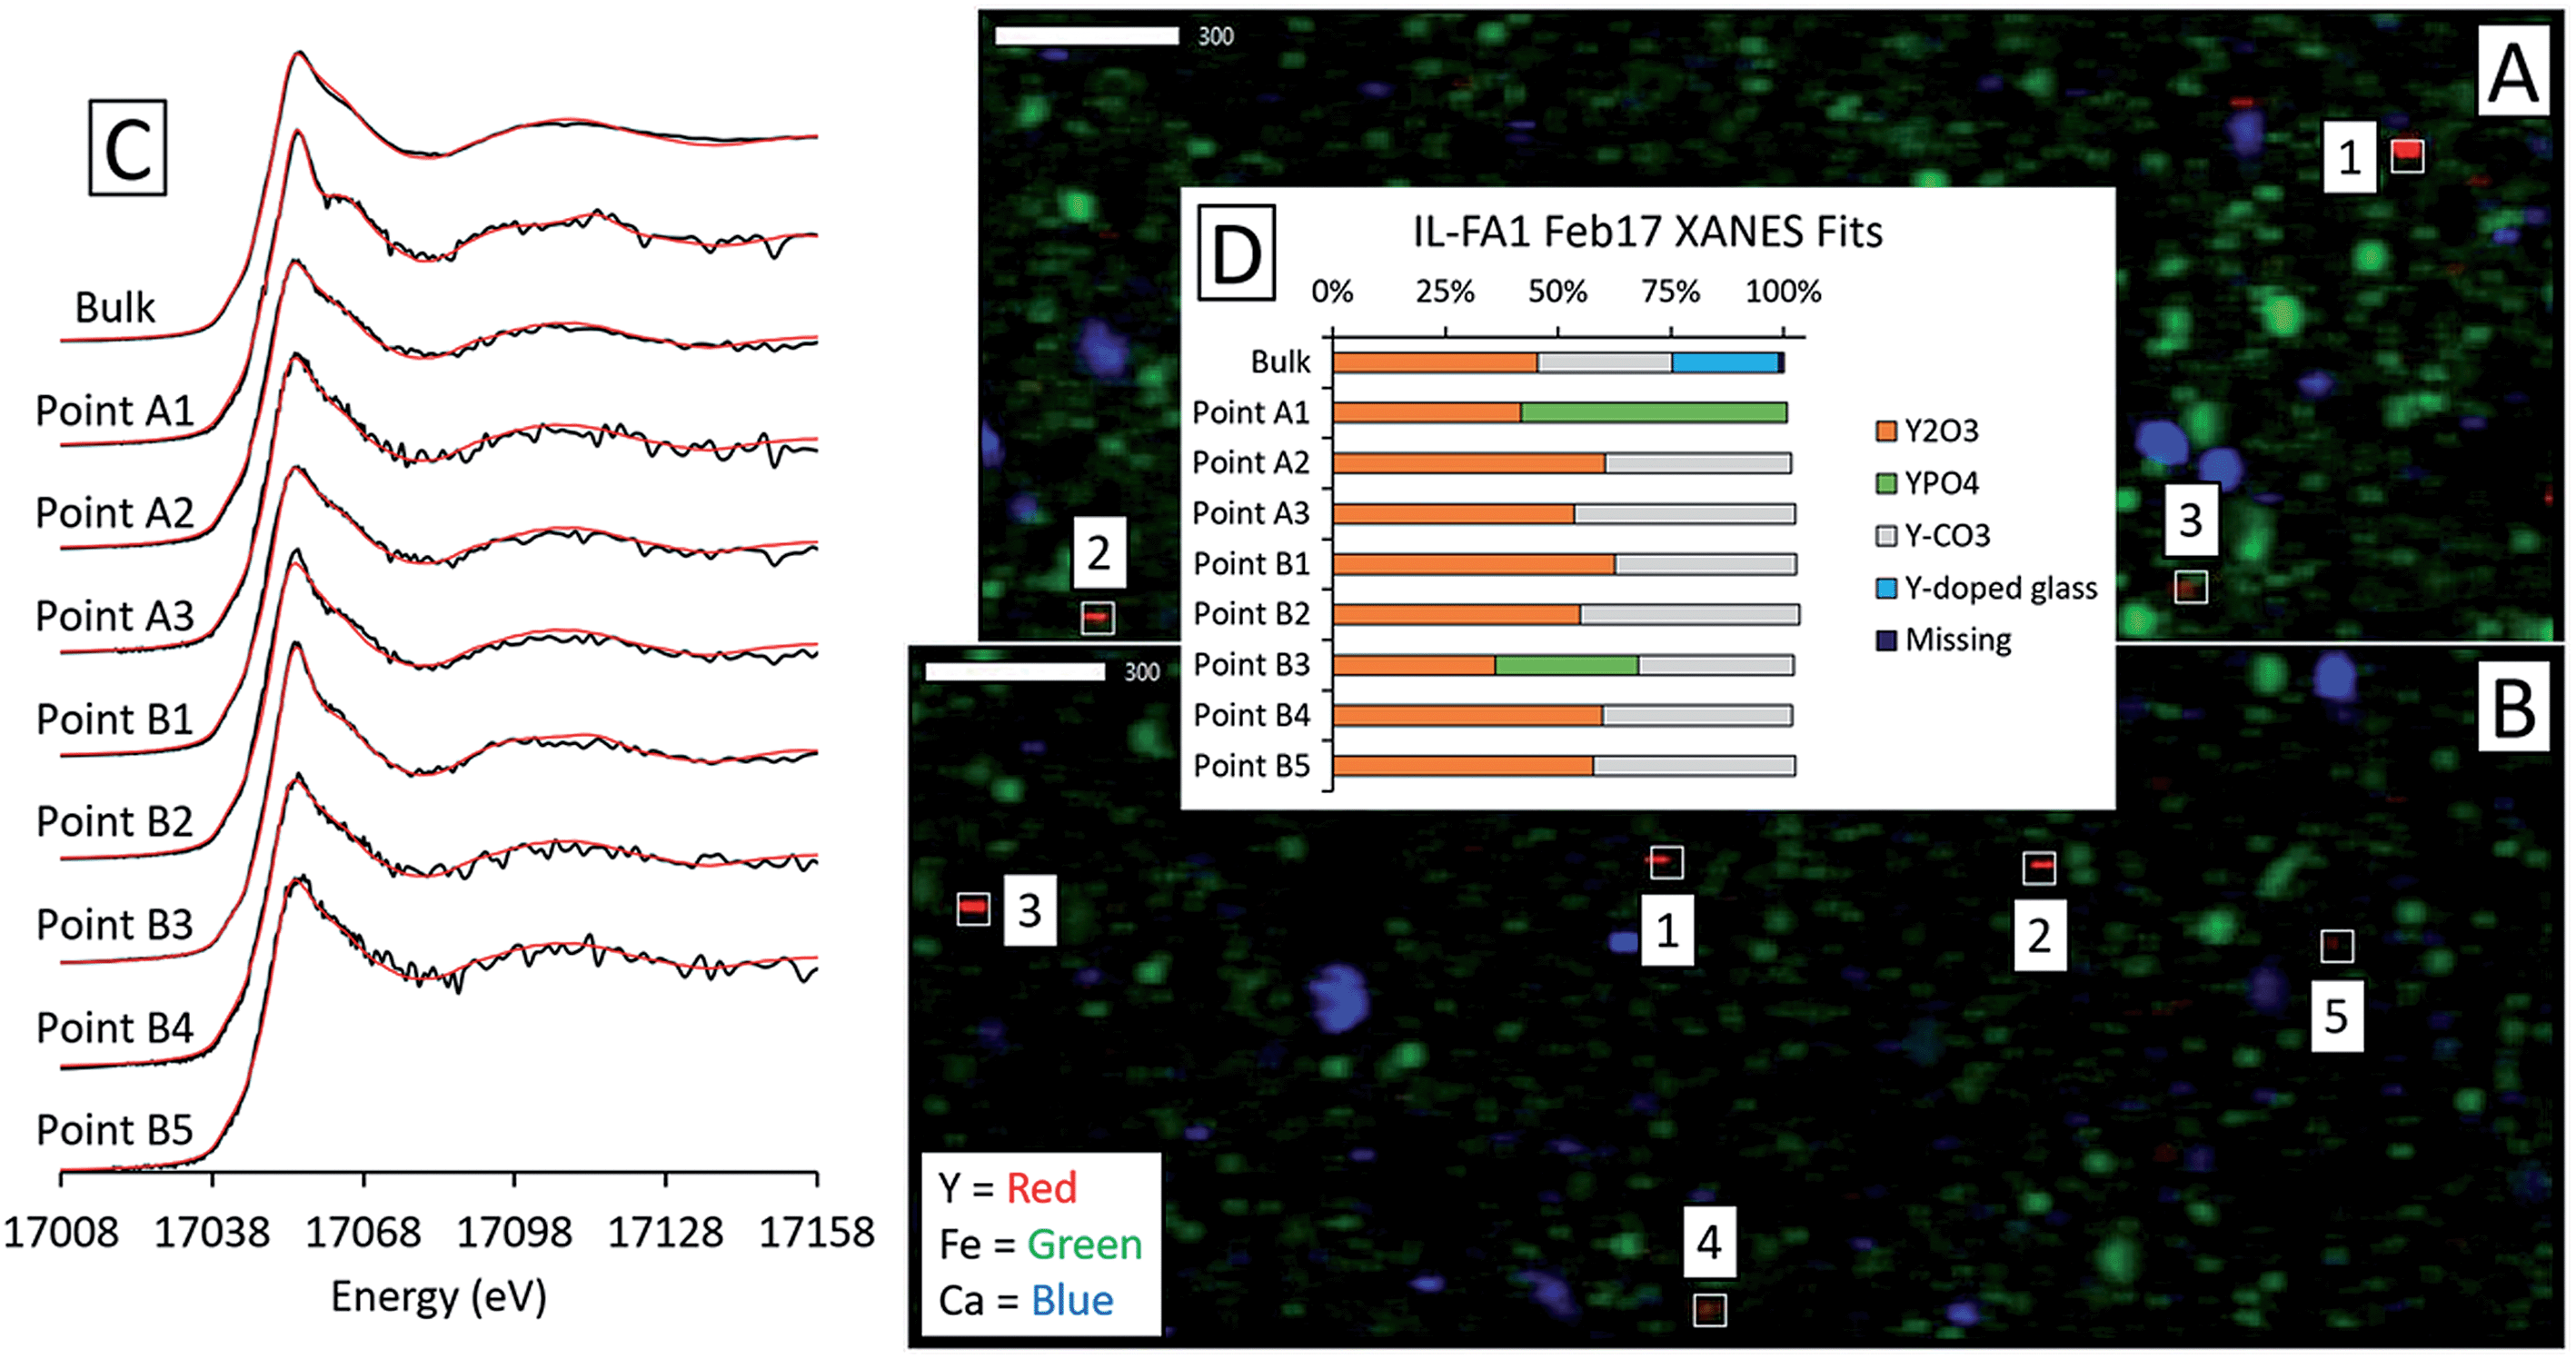 | ||
| Fig. 8 Synchrotron X-ray spectroscopy analysis of Illinois Basin coal fly ash IL-FA1, including: (A), (B) element maps for two regions of the IL-FA1 thin section collected by μXRF (17100 eV; scale bars are in μm) showing Y, Fe, and Ca locations, (C) Y K-edge bulk and micro-focus XANES spectra with linear combination fits indicated in red and (D) fit weights. The fitting region was 17008 eV to 17158 eV for two regions of the IL-FA1 thin section. | ||
For the Powder River Basin ashes, there was greater variation in fits between individual high-Y points (Fig. 9 and S6†). All but one of the high-Y PRB-FA1 points contained less Y2O3 and Y-doped glass than the bulk fit. The common features shared by the PRB-FA1 μXANES fits were major Y-doped hematite (44–66%) and YPO4 (20–57%) contributions in all but one point. The last point appeared to be comprised of glass (73%) and Y2O3 (27%). For PRB-FA2, both the bulk and micro-focus fits contained Y2O3 (43–54%). However, where the bulk fit contained 53% glass, three Y-hotspots contained 48–59% monazite and the last contained 52% Y2(CO3)3. As with the bulk ash fits, the monazite and Y2(CO3)3 components of the fits may represent the same species due to the similarity of the reference spectra.
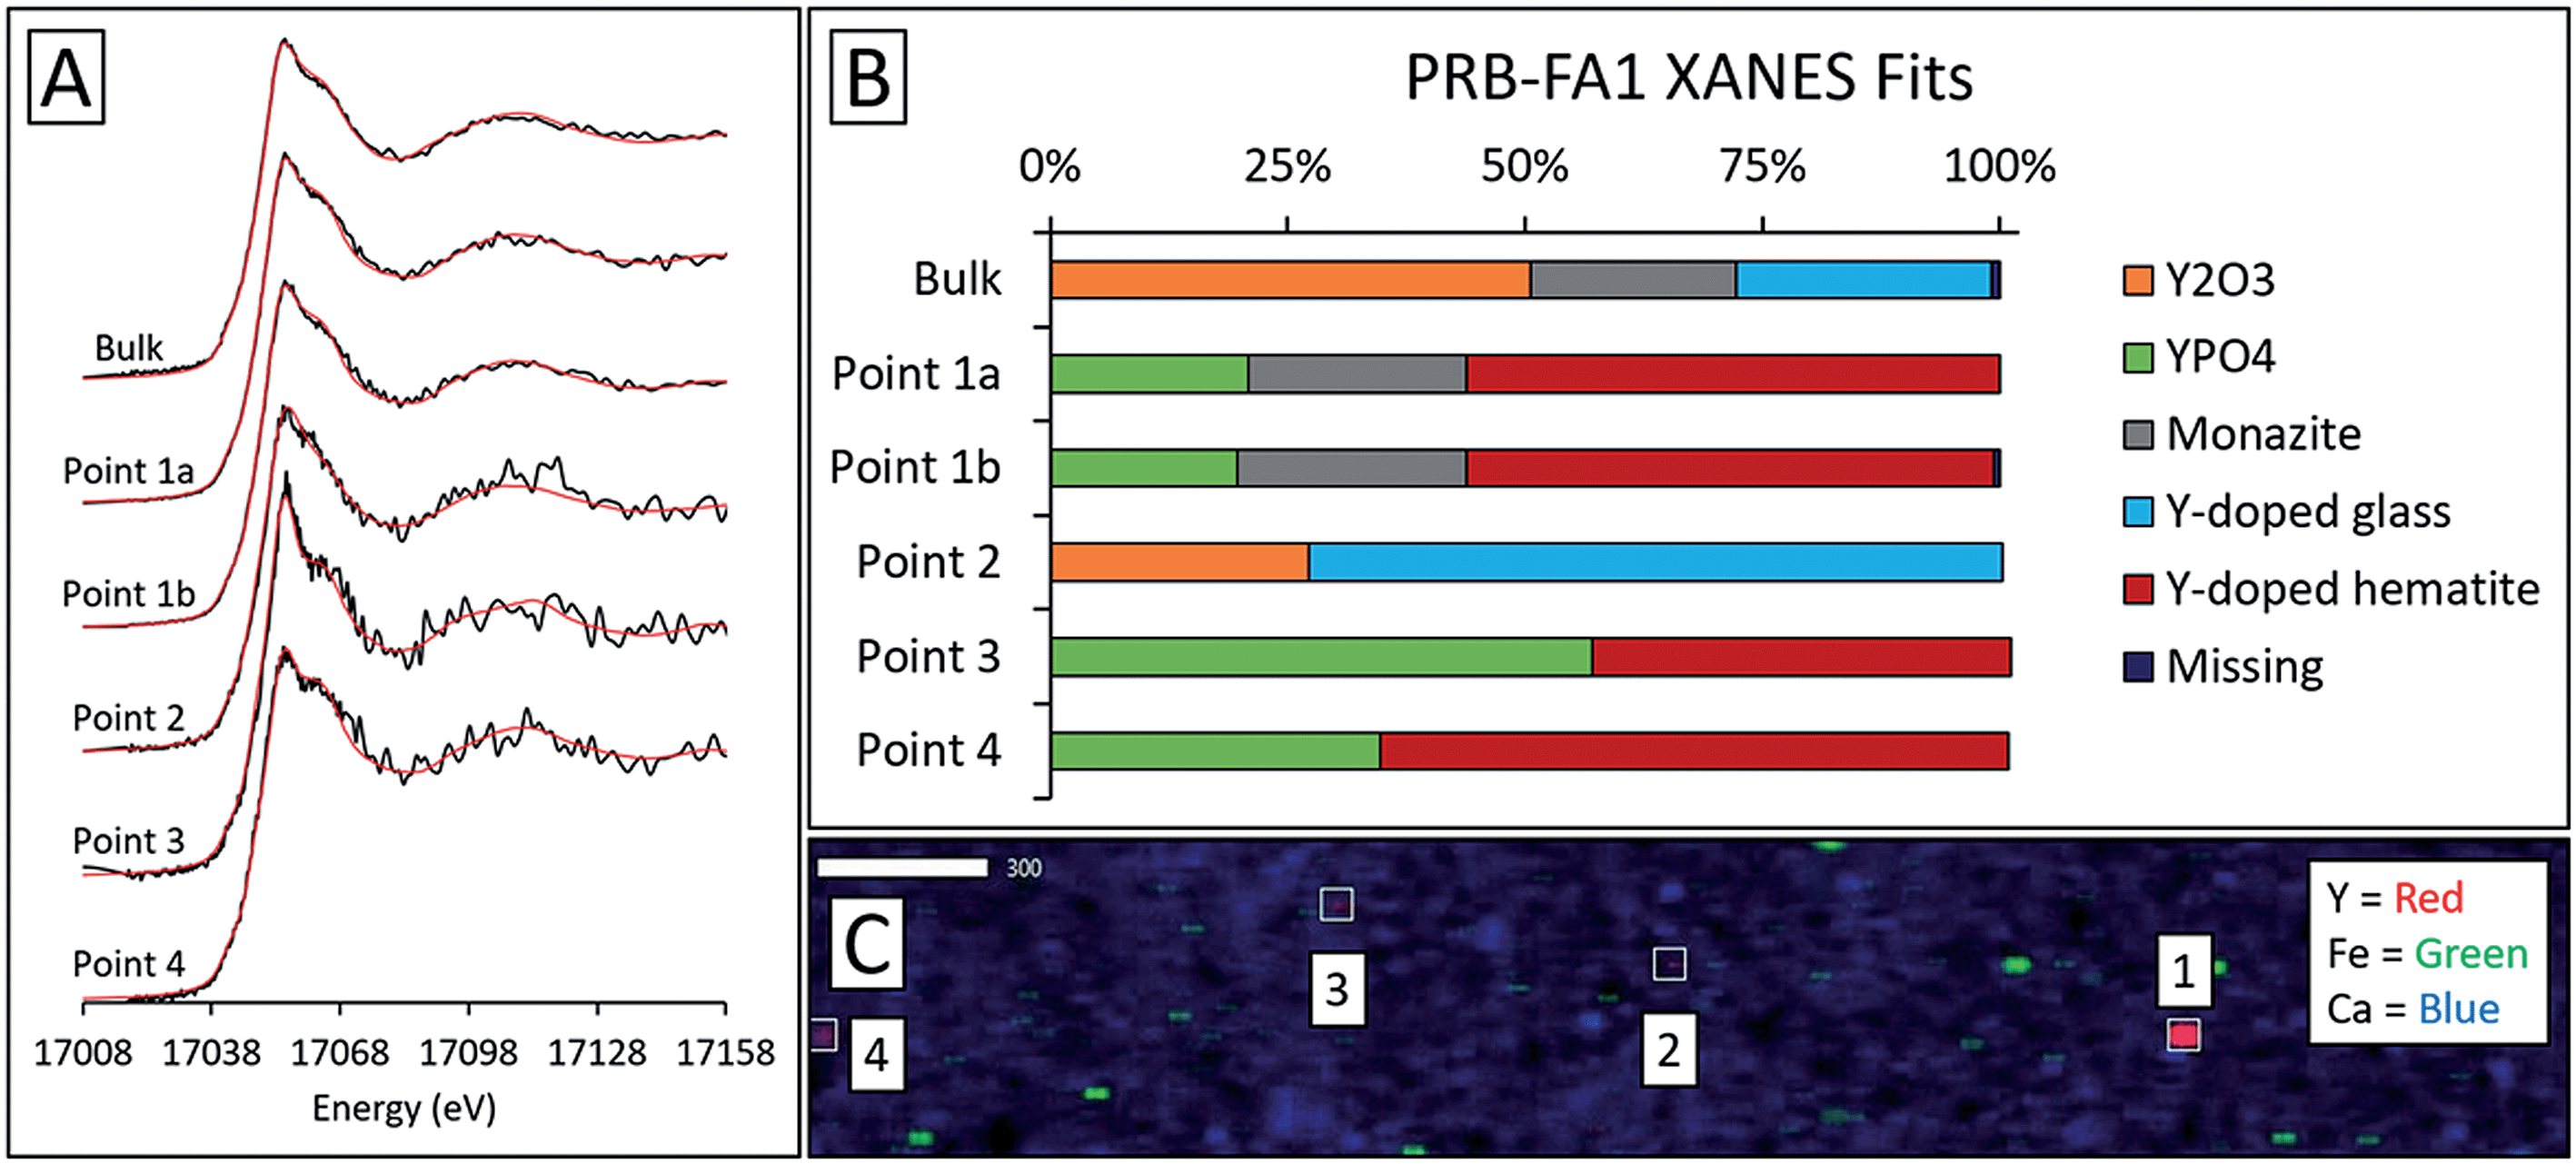 | ||
| Fig. 9 Synchrotron X-ray spectroscopy analysis of Powder River Basin fly ash PRB-FA1, including: (A) Y K-edge bulk and micro-focus XANES spectra with linear combination fits indicated in red and (B) fit weights, and (C) μXRF elemental map showing Y, Fe, and Ca locations (17100 eV; scale bars are in μm). The fitting region was 17008 eV to 17158 eV. Points 1a and 1b were two separate scans of the same yttrium hotspot. | ||
4. Discussion
4.1. Leaching potential of REE and other elements
Sequential extraction procedures have been applied to fly ash in the past to determine trace element mobility,48–52 but never with a focus on REE. Low total REE recoveries were observed for IL-FA1 and App-FA1, with 80–90% of REE falling in the residual (unextracted) fraction. This result is consistent with our hypothesis that REE are encapsulated in the aluminosilicate glass of the fly ash and therefore not leached extensively during selective sequential extractions.28 Except for the oxalic acid extraction, total Sc recoveries were lower than those of the other REEs.Volatile elements (e.g. As, Se, Mo) tend to sorb to fly ash particles collected at the later (and cooler) stages of the flue gas control process.22,42–47 Therefore, these elements were much more extractable.30,53
The distribution of individual REE recoveries in each fraction differed noticeably between samples and was changed by using oxalic acid for F2. For PRB-FA1, the recovery of the lanthanides and Y occurred primarily in F4 (30.5 ± 3.4%), with the remainder split between F3 (16.9 ± 1.2%) and F2 (14.0 ± 2.1%). For IL-FA1, this distribution was the opposite, with recoveries decreasing slightly from F2 (4.8 ± 1.2%) to F3 (4.2 ± 0.7%) to F4 (2.4 ± 0.4%). App-FA1 had a similar extraction profile to IL-FA1, with low recoveries of REEs and high recoveries for volatile elements (As, Se, Mo), suggesting that the REEs were hosted in phases not easily leached by the sequential extraction solutions. Aggressive leaching or ash pretreatment such as alkaline digestion is required to extract further REE from Appalachian- and Illinois Basin-derived ashes.7,19,20
In the exchangeable/acid soluble extraction step (F2), App-FA1 was extracted with acetic acid and a replicate was extracted with oxalic acid of the same molarity. The primary effect of the oxalic acid extraction was to concentrate the recovery of REE and most other elements in the acid-soluble fraction (F2) at the expense of the reducible (F3) fraction. This was most evident in As, which was extracted mostly in F3 (73%) when using acetic acid and overwhelmingly in F2 (98%) when using oxalic acid. Recoveries from the reducible (F3) fraction were much lower following oxalic acid extraction. The only element with significant F3 or F4 recovery was Se with 28.3% recovery in F4; however, this was also true when using acetic acid. Overall recoveries for the volatile elements were significantly higher using oxalic acid: 102% vs. 83% As recovery, 91% vs. 71% Se recovery, and 76% vs. 52% Mo recovery. Overall REE recoveries were also slightly higher using oxalic acid. The metal chelating potential of oxalate (a dicarboxylate) compared to acetate (a monocarboxylate) may have enhanced the recovery of leachable elements.
Our extraction protocol included an initial distilled water leach (F1) that could be interpreted as simple environmental leaching conditions (especially relative to the subsequent extraction steps). This F1 extraction fraction is relevant because one of the largest potential ash sources for REE reclamation are legacy ash ponds which have been exposed to environmental weathering for years, sometimes decades. The only elements consistently mobilized by distilled water were Mo, Se, Ca, and Na. Aqueous REE recoveries were negligible. Molybdenum was the element with the highest aqueous recovery across all samples: 24.9% for IL-FA1, 23.8% for PRB-FA1, 21.9% for App-FA1 using acetic acid, and 20.5% for App-FA1 using oxalic acid. Aqueous Se recovery was similar for all samples, ranging from 6.2% to 8.5%. The higher aqueous leaching potential of these elements is well-known and expected given their adsorption to the surface of the ash particles.24,30,53–55
Calcium was the next most mobile element for the non-Powder River samples, with 22.1% recovery in IL-FA1, 12.5% for App-FA1 extracted with acetic acid, and 11.7% for App-FA1 extracted with oxalic acid. Although PRB-FA1 has significantly higher Ca content than Illinois or Appalachian basin ashes, the aqueous recovery for Ca was much lower at only 3.7%.
Overall uranium (U) recoveries were greater than REE recoveries except for PRB-FA1, suggesting that U is associated with particle surfaces.24,56 Thorium recoveries were always less than REE recoveries. The high mobility of U with respect to REE may present a problem for leaching and concentrating REE from fly ash, as REE separation processes often are not selective for REEs over U. It is important to understand the relative extractability of Th and U to avoid concentrating them to hazardous levels during REE recovery.
4.2. Impact of ash composition and coal basin
As expected, total recoveries for most elements were significantly higher for PRB-FA1, which we attribute to the greater solubility of Powder River Basin coal ashes. Average REE recovery was 61.6 ± 5.5%, much higher than for IL-FA1 (11.5 ± 1.8%), App-FA1 with acetic acid (11.6 ± 1.5%), or App-FA1 with oxalic acid (13.9 ± 3.2). The co-location of Ca and REE observed in Powder River Basin ashes may contribute to the higher REE recoveries observed.23 Several elements had lower recoveries than expected, including As, which was extracted the least from PRB-FA1, and Th, which was similar in recovery to the other ash samples. Arsenic was expected to be primarily surface-bound and easily leached, as observed for other volatile elements such as Se and Mo. The low As recovery from PRB-FA1 may indicate that the higher Ca content of this ash resulted in the formation of a different, less soluble As species (e.g., calcium arsenates) that did not occur with the low-Ca Illinois or Appalachian basin ashes.The crystalline mineral composition of the ash samples did not change much between extraction steps (Fig. S1–S4†). However, the relative intensities of the peaks did change with each extraction step. For instance, the prominent maghemite and hematite peaks of the Illinois Basin ash located at ∼39° 2θ and ∼42° 2θ decreased in amplitude following the F1 and F2 extraction steps and then increased after the F3 and F4 extraction steps (Fig. 2). A potential reason for this trend is that some Fe-oxide phases were extracted during the F1 and F2 steps, but then subsequent extracting reagents resulted in conversion of other Fe phases into these oxide forms that were detectable by XRD. The similarity of the spectra for the two App-FA1 extractions (Fig. S3 and S4†) was surprising given the effect oxalic acid had on leaching and our initial hypothesis that oxalic acid would be effective at attacking the amorphous aluminosilicates that comprise the background signal.
Differences in the major oxide composition of the ash samples manifested in the XRD results. The amplitudes of Fe-oxide peaks for the App-FA1 spectra were only half that of the same peaks in the IL-FA1 spectra. This difference can be attributed to the much higher Fe-oxide fraction of Illinois Basin ashes relative to Appalachian Basin ashes.7 The absence of prominent mullite and Fe-oxide peaks in the PRB-FA1 spectra is consistent with the composition of Powder River Basin ashes, which have lower Al- and Fe-oxide content than eastern U.S. coal ashes. Although the Al-oxide content of IL-FA1 (21.2%) and PRB-FA1 (22.5%) were similar, only IL-FA1 had identifiable mullite peaks. The low mullite concentration in PRB-FA1 suggests that the Al in Powder River Basin ashes is found primarily in amorphous glass phases rather than the mullite found in Appalachian and Illinois Basin ashes.
4.3. Differences between individual REE
In the sequential extractions, total recovery of heavy REE (HREE; Tb to Lu in the lanthanide series and Y due to its atomic radius), was higher than for light REE (LREE; La through Gd). This is consistent with previous studies reporting distribution differences between LREE and HREE.23 The disparity was most evident in PRB-FA1 (57.1 ± 4.7% LREE recovery vs. 65.5 ± 2.1% HREE recovery) and when using oxalic acid (11.0 ± 1.0% LREE recovery vs. 16.4 ± 1.8% HREE recovery). Elevated HREE recovery using oxalic acid is an intriguing result because it indicates that the more valuable HREE can be preferentially extracted. However, HREE abundances are far lower than those of LREE, so even increased HREE extraction efficiency may not result in meaningfully higher recoveries by mass. Furthermore, most REE in App-FA1 and IL-FA1 were associated with the residual fraction. Overall, the uniform extraction profiles of across the lanthanide series and Y suggest that they are collocated.Recoveries for Sc by the sequential extractions were unexpectedly low relative to other REE recoveries. This difference was most pronounced for PRB-FA1, with only 11.6% total Sc recovered compared to 61.6 ± 5.5% of the other REE. The divergent extraction behaviors of Sc and the other REE indicate that they have differing modes of occurrence in PRB-FA1 and should not be categorized together in this case. Using oxalic acid, most Sc recovery occurred in F2 (i.e. by oxalic acid), while acetic acid recovered <0.7% of Sc. These results suggest that recoverable Sc resides in a phase leachable by oxalic acid but not acetic acid, such as Fe or Mn oxide. However, for App-FA1 and IL-FA1, both Sc and the other REEs remained mostly unrecovered, suggesting that they are associated with the glass phase.
4.4. Bulk and micro-scale yttrium speciation
Bulk Y-XANES fits were consistent across ash samples and suggest that bulk Y coordination resembles Y oxides or aluminosilicates regardless of coal source, consistent with incorporation of REE-bearing particles into the glass during combustion. The similarity of bulk Y-XANES fits for App-FA1 and IL-FA1 before and after oxalic acid extraction can be attributed to low Y recovery by oxalic acid during sequential extraction. However, bulk fits for the Powder River Basin samples changed dramatically after oxalic acid leaching, which is consistent with their much higher yttrium and REE recoveries during sequential extractions.Micro-focus XANES revealed that Y hotspots differed from the bulk mode of Y occurrence. These hotspots were 10–20 μm in diameter, within the typical size range of fly ash particles. However, the synchrotron micro-focus technique used in this study had a spot size of 2 μm × 2 μm, meaning that it was capable of distinguishing regions within individual ash particles.
Fits of Y hotspots also varied between samples, suggesting that the geological origin of the feed coal heavily influences microscale Y speciation in the ash. The striking similarity of microscale fits for IL-FA1 (Fig. 8) suggests that these points are the same Y species, while the greater variability between Y hotspots in PRB-FA1 may indicate multiple different microscale Y species. For PRB-FA1, the predominance of Y-doped hematite in the fits was unexpected given the lower Fe-oxide content of Powder River Basin ashes relative to eastern U.S. coal ashes. High YPO4 weights in App-FA1, App-FA3, and PRB-FA1 fits suggest that these points are composed at least partially of xenotime (yttrium orthophosphate). Several of the Y hotspots in the Illinois Basin ash also resembled YPO4, suggesting that yttrium phosphate minerals may be present in samples from all three coal basins. This is consistent with previous studies showing REE phosphate minerals in coals and coal ashes.18,23,28,57,58 The stark contrast between YPO4-like points (e.g. App-FA3 Map 4) and those resembling the bulk fits (App-FA3 Map 6) highlights the importance of scale when considering Y speciation.
While the μXANES spectra were often best fit with 2 or 3 reference materials, one could question the existence of 2-3 distinct Y phases in a small area (∼2 × 2 μm2) or in a single fly ash grain. Recent studies using higher resolution techniques (e.g. electron microscopy) have shown REE-bearing particles (0.01–1 μm diameter) within or on the surface of fly ash grains.25,59,60 Thus, multiple phases of Y in a single grain cannot be ruled out. Another explanation for our μXANES model fits is that the Y coordination state within each grain does not perfectly resemble the local coordination in our selection of reference materials.
Overall, the yttrium bulk XANES and μXANES analyses demonstrated that REE speciation in fly ash is heterogeneous and that with microscopy-based analyses, one can find areas of greater Y concentration (“hotspots”) with distinct phases of Y that differ from the bulk average. However, our analysis of these Y-hotspots comprised only 1.1% to 2.6% of the total Y μXRF signal and <0.2% of total area. Thus, previous work using microscopy-based methods might not be evaluating representative forms of REE. For extraction/recovery purposes, bulk Y speciation is more informative.
5. Conclusions
REE in the coal ash samples remained mostly in the residual fraction during sequential extractions, indicating that these elements are associated with sparingly soluble phases in the ash matrix. The use of oxalic acid rather than acetic acid for extracting the exchangeable fraction of coal fly ash was found to recover REE that would ordinarily be associated with the reducible (F3) fraction. This did not significantly increase overall REE recoveries, however. Elements with high leaching potential (As, Se, Mo) were recovered at much higher efficiencies using oxalic acid. Substantial extraction of REEs from the Powder River Basin ash was observed throughout the exchangeable, reducible, and oxidizable fractions. In contrast, low REE recoveries were observed in the Appalachian- and Illinois Basin-derived ashes, indicating that the majority of REE are found in phases inaccessible to leaching.Bulk- and micro-scale XANES focusing on yttrium demonstrated that Y speciation of individual Y hotspots can drastically differ from the major form of Y observed at the bulk scale. The speciation of these hotspots also differed between samples but often shared features within the same sample. These findings indicate that micro-scale investigations of Y speciation in fly ash may not be representative of all Y forms in the sample. They also point to multiple modes of Y occurrence in fly ash, with minor high-Y points that do not necessarily reflect the dominant Y species. Therefore, for resource recovery applications, extraction methods should target the bulk forms of REE in fly ash, which appear to be associated with the aluminosilicate glass. Except for Powder River Basin ashes, aggressive leaching or alkaline digestion methods are required to recover REE from the glass phase.
Conflicts of interest
There are no conflicts to declare.Acknowledgements
This work was supported by the U.S. National Science Foundation (#CBET-1510965 and CBET-1510861), the NSF Partnership for International Research and Education (#OISE-1243433), and the U.S. Department of Energy (DE-FE0026952). RKT was partly supported by a Graduate Scholarship in Solid Waste Research from the Environmental Research and Education Foundation.References
- S. Massari and M. Ruberti, Rare earth elements as critical raw materials: focus on international markets and future strategies, Resour. Policy, 2013, 38, 36–43 CrossRef.
- E. Alonso, A. M. Sherman, T. J. Wallington, M. P. Everson, F. R. Field, R. Roth and R. E. Kirchain, Evaluating Rare Earth Element Availability: A Case with Revolutionary Demand from Clean Technologies, Environ. Sci. Technol., 2012, 46, 3406–3414 CrossRef CAS PubMed.
- U.S. Geological Survey, Rare Earth Elements – Critical Resources for High Technology, 2002 Search PubMed.
- D. Bauer, D. Diamond, J. Li, D. Sandalow, P. Telleen and B. Wanner, Critical Materials Strategy, U.S. Department of Energy, 2010 Search PubMed.
- V. V. Seredin, Rare earth element-bearing coals from the Russian Far East deposits, Int. J. Coal Geol., 1996, 30, 101–129 CrossRef CAS.
- V. V. Seredin and S. Dai, Coal deposits as potential alternative sources for lanthanides and yttrium, Int. J. Coal Geol., 2012, 94, 67–93 CrossRef CAS.
- R. K. Taggart, J. C. Hower, G. S. Dwyer and H. Hsu-Kim, Trends in the Rare Earth Element Content of U.S.-Based Coal Combustion Fly Ashes, Environ. Sci. Technol., 2016, 50, 5919–5926 CrossRef CAS PubMed.
- V. V. Seredin and R. B. Finkelman, Metalliferous coals: a review of the main genetic and geochemical types, Int. J. Coal Geol., 2008, 76, 253–289 CrossRef CAS.
- S. Dai and R. B. Finkelman, Coal as a promising source of critical elements: progress and future prospects, Int. J. Coal Geol., 2017, 186, 155–164 CrossRef.
- R. S. Blissett, N. Smalley and N. A. Rowson, An investigation into six coal fly ashes from the United Kingdom and Poland to evaluate rare earth element content, Fuel, 2014, 119, 236–239 CrossRef CAS.
- J. C. Hower, L. F. Ruppert and C. F. Eble, Lanthanide, yttrium, and zirconium anomalies in the Fire Clay coal bed, Eastern Kentucky, Int. J. Coal Geol., 1999, 39, 141–153 CrossRef CAS.
- J. C. Hower, J. G. Groppo, K. R. Henke, U. M. Graham, M. M. Hood, P. Joshi and D. V. Preda, Ponded and Landfilled Fly Ash as a Source of Rare Earth Elements from a Kentucky Power Plant, Coal Combustion and Gasification Products, 2017, 9, 1–21 CrossRef.
- V. V. Seredin, S. Dai, Y. Sun and I. Y. Chekryzhov, Coal deposits as promising sources of rare metals for alternative power and energy-efficient technologies, Appl. Geochem., 2013, 31, 1–11 CrossRef CAS.
- D. B. Mayfield and A. S. Lewis, Environmental review of coal ash as a resource for rare earth and strategic elements, in Proceedings of the 2013 World of Coal Ash (WOCA) Conference, Lexington, KY, USA, 2013, pp. 22–25 Search PubMed.
- J. C. Hower, S. Dai, V. V. Seredin, L. Zhao, I. J. Kostova, L. F. O. Silva, S. M. Mardon and G. Gurdal, A Note on the Occurrence of Yttrium and Rare Earth Elements in Coal Combustion Products, Coal Combustion and Gasification Products, 2013, 5, 39–47 Search PubMed.
- J. Hower, E. Granite, D. Mayfield, A. Lewis and R. Finkelman, Notes on Contributions to the Science of Rare Earth Element Enrichment in Coal and Coal Combustion Byproducts, Minerals, 2016, 6, 32 CrossRef.
- J. C. Hower, C. F. Eble, S. Dai and H. E. Belkin, Distribution of rare earth elements in eastern Kentucky coals: indicators of multiple modes of enrichment?, Int. J. Coal Geol., 2016, 160–161, 73–81 CrossRef CAS.
- W. Zhang, M. Rezaee, A. Bhagavatula, Y. Li, J. Groppo and R. Honaker, A Review of the Occurrence and Promising Recovery Methods of Rare Earth Elements from Coal and Coal By-Products, Int. J. Coal Prep. Util., 2015, 35, 295–330 CrossRef CAS.
- J. F. King, R. K. Taggart, R. C. Smith, J. C. Hower and H. Hsu-Kim, Aqueous acid and alkaline extraction of rare earth elements from coal combustion ash, Int. J. Coal Geol., 2018, 195, 75–83 CrossRef CAS.
- R. K. Taggart, J. C. Hower and H. Hsu-Kim, Effects of Roasting Additives and Leaching Parameters on Extraction of Rare Earth Elements from Coal Fly Ash, Int. J. Coal Geol., 2018, 196, 106–114 CrossRef CAS.
- W. Franus, M. M. Wiatros-Motyka and M. Wdowin, Coal fly ash as a resource for rare earth elements, Environ. Sci. Pollut. Res., 2015, 22, 9464–9474 CrossRef CAS PubMed.
- J. Liu, S. Dai, X. He, J. C. Hower and T. Sakulpitakphon, Size-Dependent Variations in Fly Ash Trace Element Chemistry: Examples from a Kentucky Power Plant and with Emphasis on Rare Earth Elements, Energy Fuels, 2017, 31, 438–447 CrossRef CAS.
- M. Y. Stuckman, C. L. Lopano and E. J. Granite, Distribution and speciation of rare earth elements in coal combustion by-products via synchrotron microscopy and spectroscopy, Int. J. Coal Geol., 2018, 195, 125–138 CrossRef CAS.
- L. D. Hansen and G. L. Fisher, Elemental distribution in coal fly ash particles, Environ. Sci. Technol., 1980, 14, 1111–1117 CrossRef CAS.
- M. M. Hood, R. K. Taggart, R. C. Smith, H. Hsu-Kim, K. R. Henke, U. M. Graham, J. G. Groppo, J. M. Unrine and J. C. Hower, Rare Earth Element Distribution in Fly Ash Derived from the Fire Clay Coal, Kentucky, Coal Combustion and Gasification Products, 2017, 9, 22–23 CrossRef.
- J. C. Hower, J. G. Groppo, P. Joshi, S. Dai, D. P. Moecher and M. N. Johnston, Location of Cerium in Coal-Combustion Fly Ashes: Implications for Recovery of Lanthanides, Coal Combustion and Gasification Products, 2013, 5, 73–78 CrossRef.
- J. C. Hower, M. M. Hood, R. K. Taggart and H. Hsu-Kim, Chemistry and petrology of paired feed coal and combustion ash from anthracite-burning stoker boilers, Fuel, 2017, 199, 438–446 CrossRef CAS.
- R. Lin, B. H. Howard, E. A. Roth, T. L. Bank, E. J. Granite and Y. Soong, Enrichment of rare earth elements from coal and coal by-products by physical separations, Fuel, 2017, 200, 506–520 CrossRef CAS.
- A. Kolker, C. Scott, J. C. Hower, J. A. Vazquez, C. L. Lopano and S. Dai, Distribution of rare earth elements in coal combustion fly ash, determined by SHRIMP-RG ion microprobe, Int. J. Coal Geol., 2017, 184, 1–10 CrossRef CAS.
- X. Querol, J. L. Fernandez-Turiel and A. Lopez-Soler, Fuel, 1995, 71, 331 CrossRef.
- S. Dai, L. Zhao, J. C. Hower, M. N. Johnston, W. Song, P. Wang and S. Zhang, Petrology, Mineralogy, and Chemistry of Size-Fractioned Fly Ash from the Jungar Power Plant, Inner Mongolia, China, with Emphasis on the Distribution of Rare Earth Elements, Energy Fuels, 2014, 28, 1502–1514 CrossRef CAS.
- K. Tanaka, Y. Takahashi and H. Shimizu, Determination of the host phase of rare earth elements in natural carbonate using X-ray absorption near-edge structure, Geochem. J., 2009, 43, 143–149 CrossRef CAS.
- N. Rivera, N. Kaur, D. Hesterberg, C. R. Ward, R. E. Austin and O. W. Duckworth, Chemical Composition, Speciation, and Elemental Associations in Coal Fly Ash Samples Related to the Kingston Ash Spill, Energy Fuels, 2015, 29, 954–967 CrossRef CAS.
- U. Schwertmann and R. M. Cornell, in Iron Oxides in the Laboratory, Wiley-VCH Verlag GmbH, 2007, pp. 121–134, DOI:10.1002/9783527613229.ch10.
- R. S. Sapieszko and E. Matijević, Preparation of well-defined colloidal particles by thermal decomposition of metal chelates. I. Iron oxides, J. Colloid Interface Sci., 1980, 74, 405–422 CrossRef CAS.
- P. Quevauviller, G. Rauret, H. Muntau, A. M. Ure, R. Rubio, J. F. López-Sánchez, H. D. Fiedler and B. Griepink, Evaluation of a sequential extraction procedure for the determination of extractable trace metal contents in sediments, Fresenius' J. Anal. Chem., 1994, 349, 808–814 CrossRef CAS.
- A. Sahuquillo, J. F. López-Sánchez, R. Rubio, G. Rauret, R. P. Thomas, C. M. Davidson and A. M. Ure, Use of a certified reference material for extractable trace metals to assess sources of uncertainty in the BCR three-stage sequential extraction procedure, Anal. Chim. Acta, 1999, 382, 317–327 CrossRef CAS.
- K. F. Mossop and C. M. Davidson, Comparison of original and modified BCR sequential extraction procedures for the fractionation of copper, iron, lead, manganese and zinc in soils and sediments, Anal. Chim. Acta, 2003, 478, 111–118 CrossRef CAS.
- C. M. Davidson, A. L. Duncan, D. Littlejohn, A. M. Ure and L. M. Garden, A critical evaluation of the three-stage BCR sequential extraction procedure to assess the potential mobility and toxicity of heavy metals in industrially-contaminated land, Anal. Chim. Acta, 1998, 363, 45–55 CrossRef CAS.
- S. M. Webb, The MicroAnalysis Toolkit: X-ray fluorescence image processing software, in AIP Conference Proceedings, 2011, vol. 1365, ch. 1, pp. 196–199 Search PubMed.
- B. Ravel and M. Newville, ATHENA, ARTEMIS, HEPHAESTUS: data analysis for X-ray absorption spectroscopy using IFEFFIT, J. Synchrotron Radiat., 2005, 12, 537–541 CrossRef CAS PubMed.
- L. B. Clarke and L. L. Sloss, Trace elements, IEACR/49,IEA Coal Research, London, 1992 Search PubMed.
- J. C. Hower, J. D. Robertson, G. A. Thomas, A. S. Wong, W. H. Schram, U. M. Graham, R. F. Rathbone and T. L. Robl, Characterization of fly ash from Kentucky power plants, Fuel, 1996, 75, 403–411 CrossRef CAS.
- J. C. Hower, T. Sakulpitakphon, A. S. Trimble, G. A. Thomas and W. H. Schram, Major and minor element distribution in fly ash from a coal-fired utility boiler in Kentucky, Energy Sources, 2006, 28, 79–95 CrossRef CAS.
- S. M. Mardon and J. C. Hower, Impact of coal properties on coal combustion by-product quality: examples from a Kentucky power plant, Int. J. Coal Geol., 2004, 59, 153–169 CrossRef CAS.
- J. A. Ratafia-Brown, Overview of trace element partitioning in flames and furnaces of utility coal-fired boilers, Fuel Process. Technol., 1994, 39, 139–157 CrossRef CAS.
- T. Sakulpitakphon, J. C. Hower, A. S. Trimble, W. H. Schram and G. A. Thomas, Arsenic and Mercury Partitioning in Fly Ash at a Kentucky Power Plant, Energy Fuels, 2003, 17, 1028–1033 CrossRef CAS.
- P. Norris, C.-W. Chen and W.-P. Pan, A technique for sequential leaching of coal and fly ash resulting in good recovery of trace elements, Anal. Chim. Acta, 2010, 663, 39–42 CrossRef CAS PubMed.
- A. Smeda and W. Zyrnicki, Application of sequential extraction and the ICP-AES method for study of the partitioning of metals in fly ashes, Microchem. J., 2002, 72, 9–16 CrossRef CAS.
- S. Landsberger, J. F. Cerbus and S. Larson, Elemental characterization of coal ash and its leachates using sequential extraction techniques, J. Radioanal. Nucl. Chem., 1995, 192, 265–274 CrossRef.
- C.-Y. Chang, C.-F. Wang, D. T. Mui and H.-L. Chiang, Application of methods (sequential extraction procedures and high-pressure digestion method) to fly ash particles to determine the element constituents: a case study for BCR 176, J. Hazard. Mater., 2009, 163, 578–587 CrossRef CAS PubMed.
- M. D. Petit and M. I. Rucandio, Sequential extractions for determination of cadmium distribution in coal fly ash, soil and sediment samples, Anal. Chim. Acta, 1999, 401, 283–291 CrossRef CAS.
- M. Izquierdo and X. Querol, Leaching behaviour of elements from coal combustion fly ash: an overview, Int. J. Coal Geol., 2012, 94, 54–66 CrossRef CAS.
- F. Goodarzi and F. E. Huggins, Monitoring the species of arsenic, chromium and nickel in milled coal, bottom ash and fly ash from a pulverized coal-fired power plant in western Canada, J. Environ. Monit., 2001, 3, 1–6 RSC.
- G. Jegadeesan, S. R. Al-Abed and P. Pinto, Influence of trace metal distribution on its leachability from coal fly ash, Fuel, 2008, 87, 1887–1893 CrossRef CAS.
- D. G. Coles, R. C. Ragaini and J. M. Ondov, Behavior of natural radionuclides in western coal-fired power plants, Environ. Sci. Technol., 1978, 12, 442–446 CrossRef CAS.
- W. Zhang, X. Yang and R. Q. Honaker, Association characteristic study and preliminary recovery investigation of rare earth elements from Fire Clay seam coal middlings, Fuel, 2018, 215, 551–560 CrossRef CAS.
- D. Smolka-Danielowska, Rare earth elements in fly ashes created during the coal burning process in certain coal-fired power plants operating in Poland – Upper Silesian Industrial Region, J. Environ. Radioact., 2010, 101, 965–968 CrossRef CAS PubMed.
- J. C. Hower, D. Qian, N. J. Briot, K. R. Henke, M. M. Hood, R. K. Taggart and H. Hsu-Kim, Rare earth element associations in the Kentucky State University stoker ash, Int. J. Coal Geol., 2018, 189, 75–82 CrossRef CAS.
- J. C. Hower, J. G. Groppo, K. R. Henke, U. M. Graham, M. M. Hood, P. Joshi and D. V. Preda, Ponded and landfilled fly ash as a source of rare earth elements from a Kentucky power plant, Coal Combustion and Gasification Products, 2017, 9, 1–21 CrossRef.
Footnote |
| † Electronic supplementary information (ESI) available. See DOI: 10.1039/c8em00264a |
| This journal is © The Royal Society of Chemistry 2018 |