
 Open Access Article
 This Open Access Article is licensed under a Creative Commons Attribution-Non Commercial 3.0 Unported Licence
Inter-individual, inter-city, and temporal trends of per- and polyfluoroalkyl substances in human milk from Swedish mothers between 1972 and 2016†
Elisabeth
Nyberg
 *a,
Raed
Awad
b,
Anders
Bignert
a,
Caroline
Ek
a,
Gerd
Sallsten
c and
Jonathan P.
Benskin
*b
*a,
Raed
Awad
b,
Anders
Bignert
a,
Caroline
Ek
a,
Gerd
Sallsten
c and
Jonathan P.
Benskin
*b
aDepartment of Environmental Research and Monitoring, Swedish Museum of Natural History, Stockholm, SE-114 18, Sweden. E-mail: Elisabeth.Nyberg@nrm.se
bDepartment of Environmental Science and Analytical Chemistry (ACES), Stockholm University, Stockholm, SE-106 91, Sweden. E-mail: Jon.Benskin@aces.su.se
cDepartment of Occupational and Environmental Medicine, Sahlgrenska University Hospital and Academy, University of Gothenburg, Gothenburg, SE-0530, Sweden
First published on 22nd June 2018
Abstract
Inter-individual, inter-city, and temporal trends of 19 per- and polyfluoroalkyl substances (PFASs) were investigated in human milk collected in Stockholm (1972–2016) and Gothenburg (2007–2015), Sweden. The concentrations of perfluorohexane sulfonate (PFHxS), perfluorononanoate (PFNA), perfluorodecanoate (PFDA), perfluoroundecanoate (PFUnDA), and perfluorotridecanoate (PFTrDA) in human milk from Stockholm increased significantly over the entire monitoring periods, whereas branched (Br) and linear (L) isomers of perfluorooctane sulfonamide (FOSA) decreased. In human milk from Gothenburg, significant downward trends were detected for perfluorododecanoate (PFDoDA), PFHxS and Br-perfluorooctane sulfonate (Br-PFOS) over the last decade. This declining trend was also observed for perfluorohexanoate (PFHxA), PFHxS, perfluorooctanoate (PFOA) and Br-PFOS in Stockholm over the same time period. No significant differences were observed in concentrations or relative PFAS profiles between Stockholm and Gothenburg. However, a comparison of the PFAS profile in Stockholm milk revealed distinct profiles for the time periods 1972–1996, 2000–2012, and 2013–2016, reflecting a shift in exposure over time. The lower bound estimated daily intake (EDI) for ∑PFAS concentrations in infants ranged from 7.1–40 ng per kg body weight per day (ng/kg bw/d) in Stockholm and from 5.2–25 ng/kg bw/d in Gothenburg over the studied time period, consistent with other European countries. Overall these data indicate that exposure to some legacy PFASs via breastmilk is declining, presumably as a result of regulation and phase-out initiatives. However, increasing concentrations for other PFASs and a shift in the overall PFAS profile in recent years may pose an ongoing health risk to infants.
Environmental significancePer- and polyfluoroalkyl substances (PFASs) are anthropogenic substances which contaminate human blood globally. In breastfed infants, human milk is among the most important sources of PFAS exposure. Characterizing PFAS levels and time trends in breast milk is therefore important for assessing risks to infants. In the present work, we analyzed 19 PFASs (plus branched isomers) in human breastmilk from Stockholm (1972–2016) and Gothenburg (2007–2015) and examined inter-individual and inter-city differences, along with temporal trends using change-point detection. Overall, concentrations, profiles, and inter-individual variability were similar in milk from Stockholm and Gothenburg. Concentrations of long chain perfluorinated carboxylic acids and perfluorohexane sulfonate increased in human milk from Stockholm over the entire monitoring period, while for others PFASs, such as perfluorooctane sulfonate, concentrations have decreased significantly over the last 10 years. These changes probably reflect increased manufacturing/use for some PFASs, and international phase-out initiatives and regulation for others. Transformation of PFAA-precursors and/or differences in half-lives may also play a role in influencing the observed trends for some PFASs. Given infants' sensitive developmental stage, the occurrence of PFASs in breastmilk is a concern, in particular for those substances displaying increasing time trends over the last decade. |
Introduction
Per- and polyfluoroalkyl substances (PFASs) are a class of over 3000 anthropogenic substances that have been manufactured for over six decades.1 Owing to their stability and amphipathic properties, PFASs have been used in a wide range of commercial processes and consumer products.2 Concern over the use of these substances stems mostly from the occurrence of perfluoroalkyl acids (PFAAs; a sub-class of PFAS) in the global environment, including water,3,4 soils,5 sediment,6 wildlife7 and humans.8 PFAAs have been linked to a wide range of adverse health effects, including neuro- and immune toxicity, endocrine disruption, and cancer (see review by DeWitt9). Long chain PFAAs are extremely biopersistent, with human blood elimination half-lives on the order of several years.10Acknowledgement of the risks associated with long chain PFAAs has led to a number of regulatory and industry phase-out initiatives over the past 17 years. In the year 2000 one of the major global PFAS manufacturers, 3M, began phasing out production of perfluoroctanoate (PFOA) and perfluorooctane sulfonyl fluoride (POSF)-derived products, including perfluorooctane sulfonate (PFOS).11 North American PFAS manufacturers subsequently volunteered to phase out long-chain PFAAs by 2015,12,13 and in 2007, PFOS and POSF were added to Annex B of the International Stockholm Convention on Persistent Organic Pollutants. Nevertheless, production of POSF-related products continues in some countries under production and use exemptions14 and recent studies have reported environmental contamination from the increasing use of alternative fluorinated substances.15,16
Routes of human exposure to PFASs for the general population include food, house dust, air, and drinking water. In infants, occurrence of PFASs is attributed to placental transfer while in the womb, and breastfeeding post-partum.17 It is estimated that 94% of PFOS intake and 83% of PFOA intake in 6 month-olds is attributable to lactational exposure.18 Model simulations and empirical data have demonstrated that daily intake through breastfeeding and the resulting internal PFAS levels can be higher in nursing infants than in mothers.19,20 Several studies have also shown that maternal PFAS levels decrease during breastfeeding and that PFAS levels in children are correlated to breastfeeding duration, with as much as 2-fold higher mean PFAA concentrations for breastfed infants compared to non-breastfed.21 Clearly, the effect of PFAS exposure on the health of both mother and baby is of concern. Several studies have reported links between PFAA exposure and perturbation in lipid metabolism22–24 and glucose tolerance24 during pregnancy. Exposure to some PFAAs during early life stages has also been linked to adverse health effects such as reduced birth weight and immune toxicity.25–27
Previously, Sundström et al.28 reported statistically significant declines in PFOS and PFOA concentrations from 2001–2008 in pooled human milk from Stockholm, Sweden. These trends paralleled time trends observed in human serum from other parts of the world.18,29–32 However, Sundstöm et al.28 only measured 3 substances – PFOS, PFOA, and PFHxS; numerous other PFASs may exist in breast milk, thereby posing additional risk to infants. Time trends for some PFASs continue to increase in human serum in some parts of the world, including Sweden.33,34 Thus, the main objective of the present work was to improve characterization of PFAS contamination in Swedish breastmilk by generating time trends from 1972 to 2016 for an additional 16 PFASs (i.e. a total of 19 PFASs + branched isomers). The second objective was to compare PFAS time trends and inter-individual differences in milk from Stockholm to another city, Gothenburg, in order to assess possible differences in exposure between cities (e.g. due to geographical and/or socioeconomic variation). Finally, PFAS concentrations were used to determine estimated daily intakes (EDIs) for infants which were compared to threshold levels designed to be ‘safe’ for infant exposure.
Experimental
Sampling
Human milk samples from Stockholm and Gothenburg were mainly collected through the Mothers' Milk Centre at Stockholm South General Hospital and the Institution for Work and Environmental Medicine at Gothenburg University, respectively. Samples were collected between 2 weeks to 3 months after delivery from healthy native Swedish mothers, who were predominately non-smokers and primiparous (Table 1). There were a total of 20 pooled samples analyzed from Stockholm (1972–2016), containing 9–116 individual samples per pool, and 11 pooled samples from Gothenburg (2007–2015), containing 5–11 individuals per pool. Due to the limited availability of stored samples, the number of subjects in each pool varied considerably. In addition, samples collected in 2012 (16 from Gothenburg and 20 from Stockholm) and in 2016 (10 from Stockholm) were analyzed individually (Table 1). Samples were initially stored at −18 °C in plastic bags and bottles. Upon being shipped to the Environmental Specimen Bank at the Swedish Museum of Natural History in Stockholm, samples were thawed, transferred to pre-washed glass bottles with lids covered with aluminum foil, and stored at −20 °C prior to analysis.| Sampling site, year | N | Mean age (years) | Primiparous (%) | |
|---|---|---|---|---|
| a Pooled samples. b Not available. c Only available for 1 out of 10 mothers. d Only available for 4 out of 9 mothers. e Individual samples. | ||||
| Stockholm | 1972 | 75a | 27–28 | NAb |
| 1976 | 78a | 27–28 | NAb | |
| 1980 | 116a | 27–28 | NAb | |
| 1984/85 | 102a | 27–28 | 60 | |
| 1988 | 20a | 30 | 65 | |
| 1992 | 20a | 29 | 65 | |
| 1996 | 20a | 31 | 75 | |
| 2000 | 20a | 30 | 75 | |
| 2004 | 20a | 30 | 80 | |
| 2008 | 18a | 28 | 100 | |
| 2009 | 10a; 10a | 31; 31 | 100; 100 | |
| 2010 | 10a; 9a | 29c; 30d | 100; 100 | |
| 2011 | 11a; 11a | 30; 30 | 100; 100 | |
| 2012 | 20e | 31 | 100 | |
| 2013 | 10a; 10a | 26; 26 | 100; 100 | |
| 2014 | 10a; 11a | 30; 30 | 100; 100 | |
| 2016 | 10e | 29 | 100 | |
| Gothenburg | 2007 | 5a; 5a | 30; 30 | 80; 60 |
| 2008 | 8a; 8a | NAb | NAb | |
| 2010 | 11a; 7a | 31; 30 | 55; 100 | |
| 2011 | 9a | 30 | 55 | |
| 2012 | 16e | 30 | 81 | |
| 2013 | 8a | 30 | 75 | |
| 2014 | 6a | 30 | 67 | |
| 2015 | 5a; 5a | 29; 30 | 80; 40 | |
Standards and reagents
Linear isomer standards of perfluoropentanoate (PFPeA), perfluorohexanoate (PFHxA), perfluoroheptanoate (PFHpA), PFOA, perfluorononanoate (PFNA), perfluorodecanoate (PFDA), perfluorundecanoate (PFUnDA), perfluorododecanoate (PFDoDA), perfluorotridecanoate (PFTrDA), perfluorotetradecanoate (PFTeDA), 3-perfluoroheptyl propanoic acid (FHpPA), perfluorobutane sulfonate (PFBS), perfluorohexane sulfonate (PFHxS), PFOS, perfluorodecane sulfonate (PFDS), perfluorooctanesulfonamide (FOSA), N-methyl perfluorooctane sulfonamidoacetic acid (MeFOSAA), and N-ethyl perfluorooctane sulfonamidoacetic acid (EtFOSAA) were obtained from Wellington Labs (Guelph, ON, Canada). All isotopically labeled standards were obtained from Wellington Labs (a full list is provided in Table S1, ESI†). Formic acid, ammonium sulfate, and ammonium acetate were obtained from Merck. Potassium hydroxide was purchased from VWR, methyl tert-butyl ether (HPLC grade) was purchased from RATHBURN (Walkerburn, Scotland) and acetonitrile was obtained from Honeywell. Standard Reference Material (SRM) 1954: Organic Contaminants in Fortified Human Milk, was obtained from the National Institute of Standards and Technology (NIST).Chemical analysis
Breast milk aliquots (2 mL each) were extracted according to a previously published method.28 Briefly, after acidifying with formic acid, each sample was spiked with isotopically labeled internal standards. Samples were then vortexed, fortified with 600 μL of saturated ammonium sulfate, and then vortexed again. Following addition of acetonitrile (7 mL), samples were placed on a mechanical shaker for 30 minutes, after which they were centrifuged. The top organic layer was transferred into a polypropylene tube and evaporated at 40 °C. The extract was then diluted with 300 μL of pure water and vortexed before adding 500 μL of 1 M potassium hydroxide. The tube was vortexed and then supplemented with 7 mL of methyl tert-butyl ether, then placed in a mechanical shaker for 20 minutes followed by centrifugation. The organic layer was subsequently transferred into a clean polypropylene tube. The extracts were evaporated at 40 °C and then fortified with 200 μL of buffer (1![[thin space (1/6-em)]](https://www.rsc.org/images/entities/char_2009.gif) :2:1 ammonium acetate:acetonitrile:water). After vortexing and centrifugation, the lower layer was transferred to microvial for instrumental analysis.
:2:1 ammonium acetate:acetonitrile:water). After vortexing and centrifugation, the lower layer was transferred to microvial for instrumental analysis.
Instrumental analysis (Table S1, ESI†) was carried out using an ultra performance liquid chromatograph (UPLC) coupled to a Xevo TQ-S triple quadrupole mass spectrometer (Waters) operated in negative ion electrospray ionization, selected reaction monitoring mode. Extracts were chromatographed on a BEH C18 analytical column (2.1 × 50 mm, 1.7 μm particle size, waters) operated at a flow rate of 0.4 mL min−1, using a mobile phase composition of 90% water/10% acetonitrile containing 2 mM ammonium acetate (solvent A) and 100% acetonitrile containing 2 mM ammonium acetate (solvent B). The gradient profile is provided in Table S2, ESI.† A total of two precursor/product ion transitions were monitored per analyte; one for quantification and the other for qualification (Table S1, ESI†).
Quantitative determination of target compounds was carried out by isotope dilution or an internal standard approach using a linear calibration curve with 1/x weighting. Branched isomers were determined semi-quantitatively using the calibration curve for the linear isomer. The concentration of perfluoropentadecanoate (PFPeDA) was also estimated semi-quantitatively using the calibration curve for PFTeDA. With the exception of PFOA and PFOS, primary ions were always used for quantification. For PFOA, the m/z 413/169 ion was used for quantification because of an interference in m/z 413/369. For PFOS, concentrations are reported as the average of m/z 499/80 and 499/99 ions for both branched and linear isomers, as described in Riddell et al.35 Sum PFOS was then obtained by summing the concentrations of branched and linear PFOS.
Quality control
Laboratory background contamination was monitored by including procedural blanks (2 mL Milli-Q water, n = 4) during the processing of real samples. Method accuracy and precision were assessed using replicate quality control samples, consisting of SRM 1954 (n = 3) and bovine milk analyzed with a low- (0.48–2.03 ng mL−1; n = 4), or high- (1.44–6.10 ng mL−1; n = 4) spike of PFASs (Table S3, ESI†). Finally, concentrations of PFOS, PFOA, and PFHxS from 1972–2008 reported in Sundström et al.28 were compared to data generated in the present work (Fig. S1, ESI†).Data handling
For lower bounds (LB) estimates of sum (∑19) PFAS concentrations, values <LOQ were replaced with ‘0’. For upper bounds (UB) estimates, concentrations <LOQ were replaced with ‘0’ in cases where a substance was not detected in any sample; in all other cases values <LOQ were replaced with LOQ/21/2. Temporal trend analysis was performed by log-linear regression for the entire monitoring period and for the most recent ten years using the yearly arithmetic mean values. In cases where a non-linear trend was more representative of the development over time, a 3-point running mean smoother was checked for statistical significance compared to the regression line using ANOVA.36 In addition, non-linear trends were investigated using change-point detection, a method that iteratively searches for two log-linear lines with different slopes that explain significantly more of the total variance than a single regression line fitted for the whole monitoring period.37 Potential outliers were detected using a method described by Hoaglin and Welsch.38 However, potential outliers are still included in the statistical calculations. The statistical treatment used for trend detection is explained in more detail in Nyberg (2016).39 PFASs for which data for more than 70% of the years were below LOQ (i.e. PFPeA, PFPeDA, FHpPA, PFDS, MeFOSAA and EtFOSAA) were excluded from the trend analysis. Principal Component Analysis (PCA) was applied to PFAS profiles (i.e. concentration data converted to a percentage of the ∑PFAS concentration) to study difference in PFAS patterns between Stockholm and Gothenburg (for samples collected 2007–2016) and also over time (1972–2016) in Stockholm. This method is described in more detail in Glynn et al.40 Hotelling's T2 tests were performed to check for significant differences in PFAS patterns between the periods 1972–1996, 2000–2012 and 2013–2016. The test was repeated and thus the significance level of α = 0.05 was Bonferroni adjusted. An F-test was used to test if the variances differed significantly between the samples with individual measurements from Stockholm and Gothenburg in 2012. Only PFASs with >50% of data above LOQ were included in both the F-test and the PCA on differences in PFAS pattern between Stockholm and Gothenburg. For the PCA examining differences in PFAS patterns in Stockholm over time, >70% of data above LOQ was set as the threshold for inclusion in the analysis. To analyze the impact of confounding factors (e.g. age and parity) on measured concentrations multiple regressions were used. Values below LOQ were divided by the square root of 2 prior to inclusion in the statistical calculations.Results and discussion
Quality control
Blank concentrations were typically below method detection limits for most targets (Tables S5–S7, ESI†). The exceptions were for PFOA, PFNA, and FOSA, where low concentrations (<12 pg mL−1) were consistently observed, which was attributed to the Milli-Q water used to prepare them (and which was not added to real samples). Consequently, blank concentrations were not subtracted from concentrations in real samples. One blank also contained high concentrations of PFHxS, PFOS, PFPeA, PFHxA, PFOA, and PFNA (again arising from the Milli-Q water used to prepare it), but this was deemed anomalous since concentrations in real samples from the same batch, as well as blanks, samples, and QCs from subsequent batches, were all well below these levels.For most substances, method accuracy and precision were good at both fortifications levels, with mean (±standard error of the mean (SEM)) percent recoveries ranging from 73 ± 1.7% to 129 ± 3.5% and 73 ± 3.9% to 132 ± 4.4% at low- and high-spiking levels, respectively. PFHpA, PFBS, and FHpPA displayed lower recoveries at both fortification levels (9–63%), likely due to an absence of exactly-matched, isotopically-labelled internal standards. Nevertheless, precision remained excellent for these substances and they were detectable at the low fortification level. PFHpA, PFBS, and FHpPA were therefore included in further data processing, albeit with the caveat that concentrations reported here may be underestimated for these targets.
External validation of the method was achieved through (a) comparison of PFAS concentrations measured in SRM 1954 (n = 3) to those reported by Keller et al.41 (Table S4, ESI†) and (b) through comparison of PFHxS, PFOS, and PFOA concentrations from 1972–2008 (Stockholm) generated here to concentrations reported previously for these targets in Sundström et al.28 (Fig. S1, ESI†). In general, concentrations reported in the present work were similar or at the lower end of the range reported by Keller et al.41 (2010). The exceptions were for PFHxA, which was higher and displayed wider variability than concentrations reported in Keller et al.,41 and PFOA, which was considerably lower in the present work. Given the very low concentrations (i.e. typically ∼tens of pg mL−1) in milk, overall method accuracy and precision was good. Notably, we have reported PFPeA, PFTeDA, PFPeDA, PFHpPA, PFDS, MeFOSAA, and EtFOSAA concentrations in SRM 1954 for the first time (Table S4, ESI†). Finally, a comparison of PFHxS, PFOS, and PFOA concentrations observed here against those in Sundström et al. revealed good correlations (r2 = 0.72–0.80) with concentrations of PFOS and PFOA distributing approximately evenly above and below the line of y = x (Fig. S1†). PFHxS concentrations were mostly situated above this line, indicating slightly lower concentrations in the present work versus Sundström et al. (Fig. S1†). Percent differences (i.e. |Sundström-present study|/Sundström) of 18, 19, and 31% for PFOA, PFOS, and PFHxS, respectively, confirmed that the differences were minor between studies. Overall these data demonstrate good method performance and study intercomparability.
PFAS profiles
∑19PFAS concentrations in pooled samples from Stockholm (1972–2016) ranged from 110–470 pg mL−1 for LB estimates (Fig. 1) and from 130–490 pg mL−1 for UB estimates. In Gothenburg (2007–2015) ∑19PFAS concentrations ranged from 110–220 pg mL−1 (LB) and from 130–230 pg mL−1 (UB). A PCA of PFAS profiles in Stockholm and Gothenburg from 2007–2015 revealed no significant difference in patterns (Fig. 2B), implying the predominant source of PFAS exposure in mothers from both cities is similar.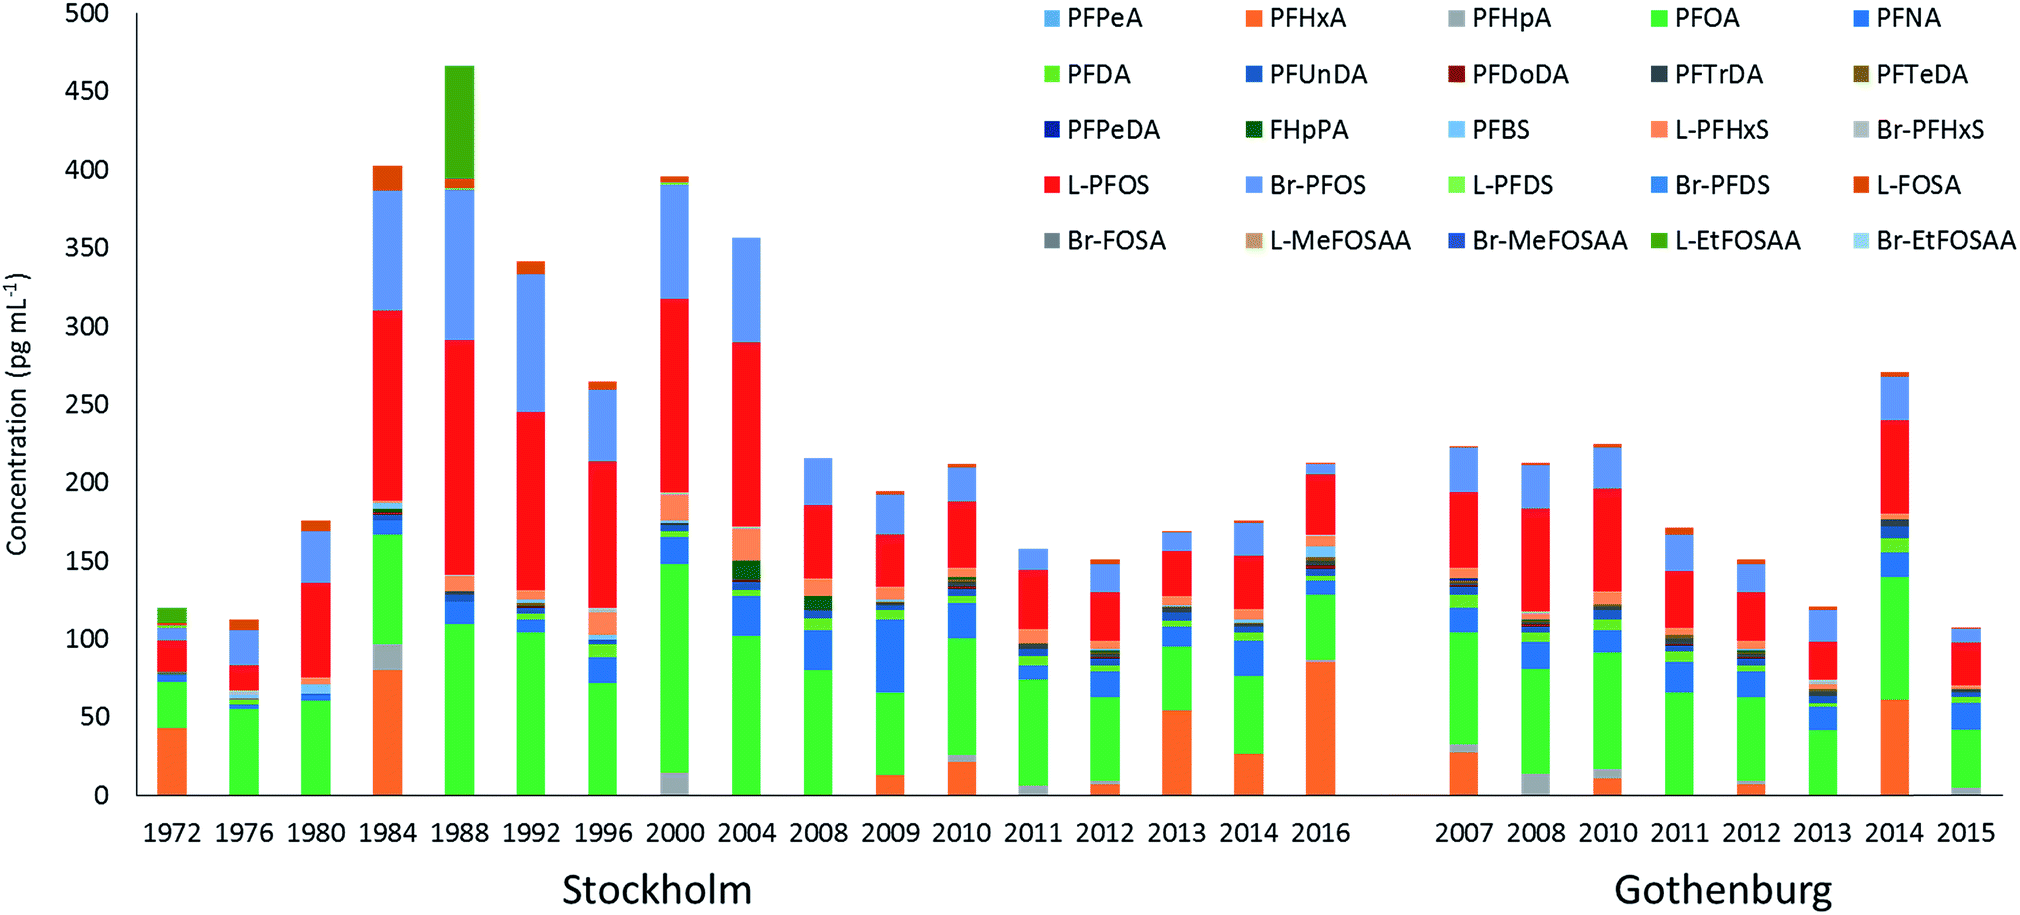 | ||
| Fig. 1 Lower bounds estimates of the mean PFAS concentrations in milk sampled from Stockholm (1972–2016) and Gothenburg (2007–2015). Each year represents the average of n = 1–3 pools, with the exception of 2012 which are the mean of individual samples (n = 20 for Stockholm and n = 16 for Gothenburg). | ||
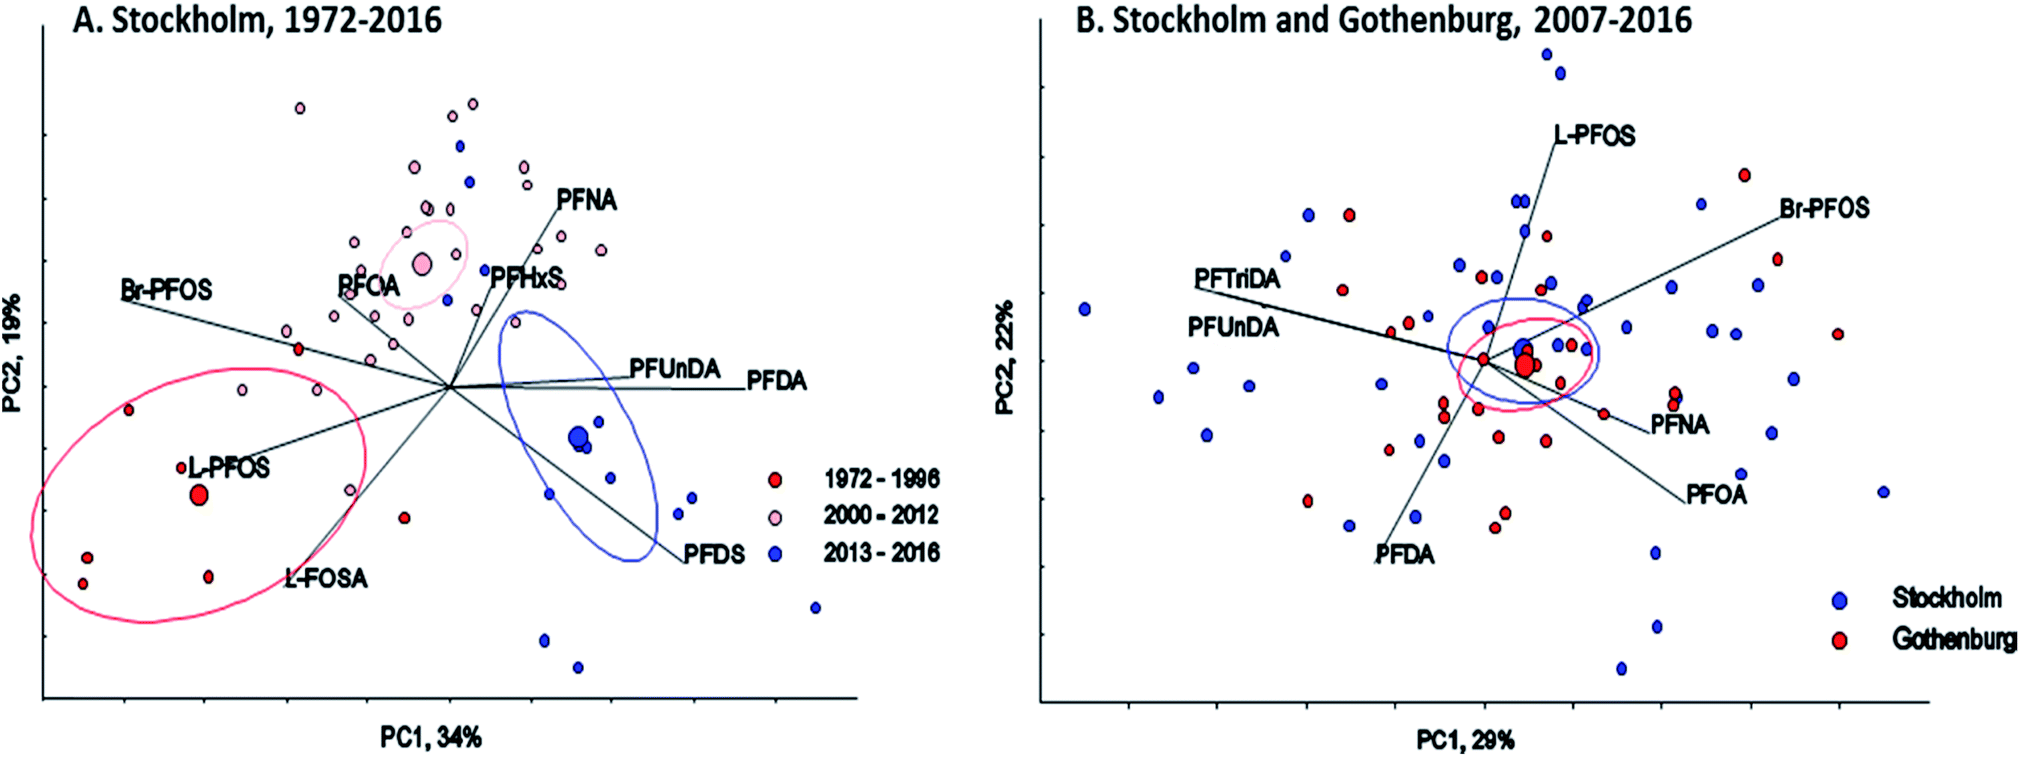 | ||
| Fig. 2 PCA (Principal Component Analysis), biplot and Hotellings 95% confidence ellipses for center of gravity for each group. (A) PFASs (L-FOSA, PFDA, PFDS, PFHxS, PFNA, PFOA, Br-PFOS, L-PFOS, PFUnDA) in human milk from Stockholm 1972–2016 and (B) PFASs (PFOA, Br-PFOS, L-PFOS, PFNA, PFDA, PFUnDA, PFTrDA) in human milk from Stockholm and Gothenburg (2007–2016). | ||
The highest ∑19PFAS concentration observed among all samples was for the year 1988 from Stockholm (Fig. 1). Across all years and in both cities, PFOS (sum isomers) and PFOA were consistently the dominant PFASs. The only exception was for PFHxA, which was intermittently detected at concentrations of up to 80 pg mL−1 in 1984 and at concentrations up to 130 pg mL−1 in an individual from 2016. Concentrations of PFOS reported here were within or below the range of average concentrations (46–260 pg mL−1; arithmetic means) reported in a worldwide review42 for 2006–2010. Another review,43 which included studies from 2008–2015, reported somewhat lower levels (arithmetic means) of PFOS in human milk, more in accordance with concentrations in the present study. PFOA concentrations in this study was also in line with concentrations reported previously (about 40–150 pg mL−1).43
PFAS concentrations in individuals sampled in 2012 from Stockholm and Gothenburg are provided in Fig. 3. ∑19PFAS concentrations ranged from 83–290 pg mL−1 (LB) and 110–310 pg mL−1 (UB) for Stockholm (n = 20) and 61–290 pg mL−1 (LB) and 90–320 pg mL−1 (UB) for Gothenburg (n = 16). As was the case in pooled samples, the profiles in individuals were dominated by PFOS (sum isomers) and PFOA at concentrations of 53 ± 27 and 53 ± 24 pg mL−1 (arithmetic mean of individuals from both cities ± standard deviation), respectively. Notably, FHpPA was observed in 8 samples from Stockholm at concentrations up to 42 pg mL−1 and 1 sample from Gothenburg at a concentration of 15 pg mL−1. This target was not observed in blanks. To our knowledge FHpPA has not previously been reported in human milk. This substance (also known as 7:3 fluorotelomer acid), is a stable transformation production of 8:2 fluorotelomer alcohol (FTOH), which is incorporated into a wide range of consumer products. FHpPA was previously reported at concentrations up to 3.9 ng mL−1 in serum from ski wax technicians.44 The short-chain PFOS replacement PFBS also appeared in individuals from Gothenburg at a higher frequency (7/16 samples) compared to Stockholm (1/20 samples). Among PFASs detectable in over 50% of samples, coefficients of variation (CVs) for individual PFASs were not statistically different, with the exception of FOSA (F-test; p = 0.0087), which displayed greater variability in Gothenburg. In both cities, the highest CVs were observed for PFTeDA, while the lowest CVs were observed for PFOA, PFUnDA and PFNA.
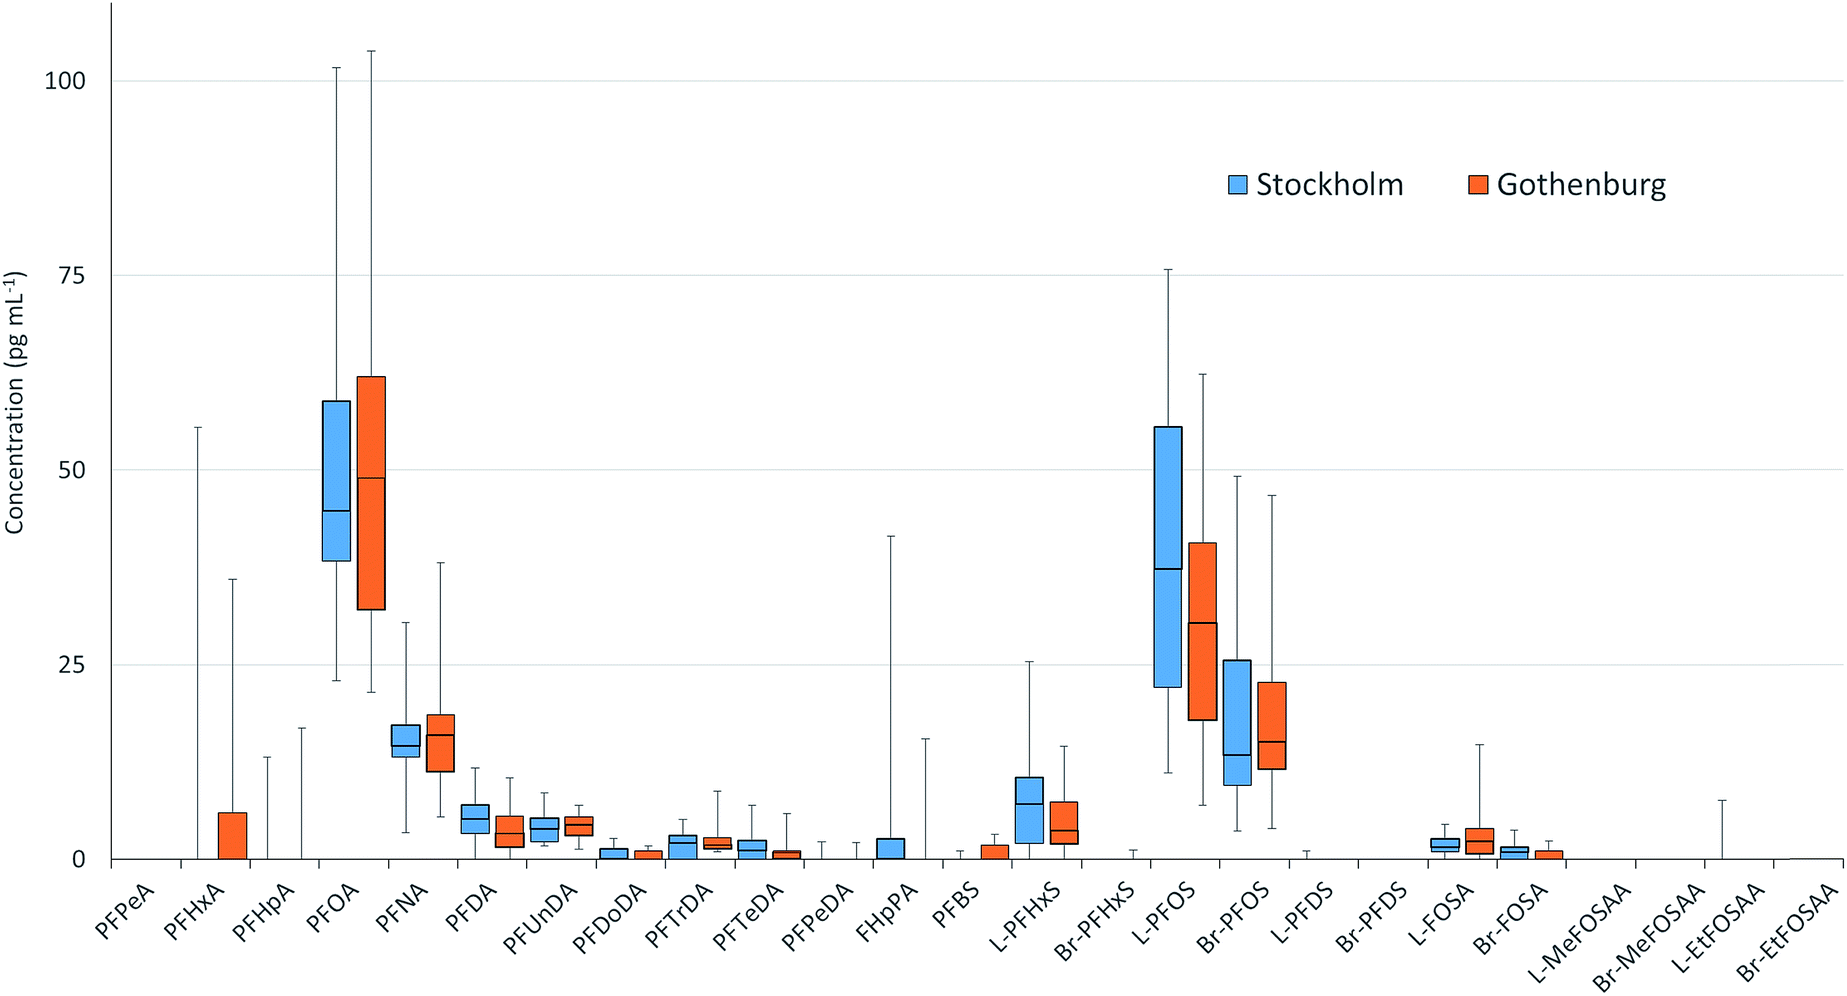 | ||
| Fig. 3 PFAS concentrations in milk sampled from individual mothers from Stockholm (n = 20) and Gothenburg (n = 16) in 2012. Boxes display 1st and 3rd quartiles bisected by the median while whiskers represent the range for the entire dataset. Concentrations were not significantly different between cities however FOSA displayed a significantly higher CV in Gothenburg compared to Stockholm. | ||
Temporal trends
The concentrations of PFHxS, PFNA, PFDA, PFUnDA, and PFTrDA increased significantly (3.3–3.7% per year) between 1972 and 2016 in Stockholm (Table 2, Fig. 4) whereas a significant downward trend was observed for Br- and L-FOSA (−3.2 and −4.8% per year respectively, Table 2, Fig. 4 and S3, ESI†). Concentrations of PFHxS, Br-PFOS and PFDoDA, decreased significantly between 2007 and 2015 in the milk samples from Gothenburg (Fig. S2 and S3, ESI†). Significant upward–downward change-point trends (Table 3) were detected in Stockholm for Br- and L-PFOS (1988), PFOA (2000), PFHxS (2004) and PFNA (2010), while upward–upward trends were observed for PFUnDA (1984) and downward–upward trends were observed for PFTeDA (2004), PFBS and PFHxA (2011) (Table 2, Fig. 4 and S3, ESI†). No trend or change-point was observed for PFHpA and PFDoDA, but for 10 and 11 years (respectively) out of 17 all samples were below LOQ. PFNA and PFDA showed similar increasing trends in pooled blood serum samples from nursing women living in Uppsala.40 In that study, serum PFHxS increased over the entire monitoring period (including the most recent years). In contrast, PFHxS in milk from the present work showed a significant decreasing trend from 2004 and onward. In 2012 some of Uppsala's drinking water supply was found to be contaminated with PFASs, most likely originating from fire-fighting foams used at a military airport just outside Uppsala. PFHxS was one of the substances found in high levels in the drinking water; consequently, ongoing PFHxS contamination could explain the absence of a decrease in concentrations in that area.45 In contrast, decreasing trends (1995–2010) for FOSA, PFOA and PFOS concentrations were reported in human serum from Uppsala40 consistent with our observations in milk and with the phase-out by 3M.| Substance | Sampling site | N samples | N years | Period (years) | Trend % (95% C.I.) | P | YRQ | LDT % | Last year pg mL−1 (95% C.I.) |
|---|---|---|---|---|---|---|---|---|---|
| FOSA | Stockholm | 50 | 17 | 72–16 | −4.2(−7.5, −0.86) | 0.018 | 24 | 59 | 2.2(1.4, 3.4) |
| Stockholm | 9 | 07–16 | 2.2(−16, 24) | 0.795 | 17 | 29 | |||
| Gothenburg | 27 | 8 | 07–15 | 2.4(−14, 22) | 0.753 | 17 | 27 | 2.1 (1.3, 3.4) | |
| Br-FOSA | Stockholm | 50 | 17 | 72–16 | −3.2(−5.4, −0.89) | 0.010 | 19 | 34 | 0.59(0.44, 0.80) |
| Stockholm | 9 | 07–16 | −2.5(−15, 11) | 0.660 | 14 | 18 | |||
| Gothenburg | 27 | 8 | 07–15 | −1.3(−11, 9.8) | 0.776 | 12 | 15 | 0.67(0.41, 1.1) | |
| L-FOSA | Stockholm | 50 | 17 | 72–16 | −4.8(−7.7, −1.8) | 0.004 | 22 | 50 | 1.4(0.90, 2.0) |
| Stockholm | 9 | 07–16 | 2.8(−18, 29) | 0.772 | 19 | 35 | |||
| Gothenburg | 27 | 8 | 07–15 | 4.0(−16, 29) | 0.674 | 19 | 35 | 1.4(0.66, 3.0) | |
| PFBS | Stockholm | 50 | 17 | 72–16 | −0.69(−3.6, 2.3) | 0.626 | 22 | 47 | 4.4(3.1, 6.2) |
| Stockholm | 9 | 07–16 | 25(−0.80, 57) | 0.056 | 19 | 36 | |||
| Gothenburg | 27 | 8 | 07–15 | 0.78(−6.2, 8.3) | 0.800 | 10 | 9.6 | 0.71(0.56, 0.90) | |
| PFDA | Stockholm | 50 | 17 | 72–16 | 3.3(1.9, 4.8) | <0.001 | 14 | 18 | 6.1(5.0, 7.5) |
| Stockholm | 9 | 07–16 | −0.82(−10, 9.5) | 0.845 | 12 | 13 | |||
| Gothenburg | 27 | 8 | 07–15 | −7.1(−21, 8.9) | 0.302 | 16 | 24 | 5.7(3.1, 10) | |
| PFDoDA | Stockholm | 50 | 17 | 72–16 | 0.80(−0.52, 2.1) | 0.218 | 13 | 17 | 1.3(1.0, 1.6) |
| Stockholm | 9 | 07–16 | 7.5(−9.2, 27) | 0.337 | 16 | 24 | |||
| Gothenburg | 27 | 8 | 07–15 | −8.6(−14, 3.1) | 0.010 | 9 | 7.8 | 0.71(0.56, 0.90) | |
| PFHpA | Stockholm | 50 | 17 | 72–16 | −0.20(−1.2, 0.80) | 0.678 | 11 | 12 | 7.1(5.9, 8.5) |
| Stockholm | 9 | 07–16 | −0.97(−5.1, 3.3) | 0.590 | 8 | 5.2 | |||
| Gothenburg | 27 | 8 | 07–15 | −4.8(−11, 1.9) | 0.129 | 10 | 9.0 | 7.8(6.3, 9.6) | |
| PFHxA | Stockholm | 50 | 17 | 72–16 | 0.56(−2.0, 3.2) | 0.647 | 20 | 38 | 57(39, 85) |
| Stockholm | 9 | 07–16 | 23(4.1, 45) | 0.023 | 16 | 24 | |||
| Gothenburg | 27 | 8 | 07–15 | −0.16(−18, 22) | 0.985 | 18 | 31 | 29(14, 62) | |
| PFHxS | Stockholm | 50 | 17 | 72–16 | 3.6(1.1, 6.1) | 0.007 | 19 | 35 | 7.3(5.3, 10) |
| Stockholm | 9 | 07–16 | −5.3(−10, −0.05) | 0.049 | 8 | 6.6 | |||
| Gothenburg | 27 | 8 | 07–15 | −9.3(−16, 1.8) | 0.024 | 11 | 11 | 3.4(2.7, 4.2) | |
| PFNA | Stockholm | 50 | 17 | 72–16 | 3.6(1.6, 5.7) | 0.002 | 17 | 28 | 15(12, 19) |
| Stockholm | 9 | 07–16 | −12(−25, 3.2) | 0.100 | 15 | 23 | |||
| Gothenburg | 27 | 8 | 07–15 | −0.12(−3.0, 2.8) | 0.926 | 7 | 3.7 | 17(15, 19) | |
| PFOA | Stockholm | 50 | 17 | 72–16 | −0.09(−1.6, 1.4) | 0.903 | 14 | 20 | 46(40, 54) |
| Stockholm | 9 | 07–16 | −7.3(−13, 1.3) | 0.025 | 9 | 7.9 | |||
| Gothenburg | 27 | 8 | 07–15 | −5.6(−13, −2.4) | 0.131 | 11 | 11 | 55(40, 77) | |
| PFOS | Stockholm | 50 | 17 | 72–16 | −0.80(−3.4, 0.93) | 0.529 | 20 | 41 | 45(39, 51) |
| Stockholm | 9 | 07–16 | −4.5(−9.6, 0.095) | 0.088 | 9 | 6.8 | |||
| Gothenburg | 27 | 8 | 07–15 | −6.8(−16, 4.0) | 0.167 | 13 | 15 | 50(33, 77) | |
| Br-PFOS | Stockholm | 50 | 17 | 72–16 | −0.93(−3.9, 2.2) | 0.526 | 22 | 49 | 11(8.6, 13) |
| Stockholm | 9 | 07–16 | −11(−17, −5.2) | 0.004 | 9 | 8.2 | |||
| Gothenburg | 27 | 8 | 07–15 | −11(−20, −0.70) | 0.040 | 12 | 15 | 9.3(6.2, 14) | |
| L-PFOS | Stockholm | 50 | 17 | 72–16 | −0.70(−3.3, 1.9) | 0.578 | 20 | 40 | 34(29, 39) |
| Stockholm | 9 | 07–16 | −3.6(−9.0, 2.0) | 0.160 | 9 | 7.1 | |||
| Gothenburg | 27 | 8 | 07–15 | −5.8(−17, 6.6) | 0.282 | 14 | 18 | 41(26, 64) | |
| PFTeDA | Stockholm | 50 | 17 | 72–16 | 1.0(−0.70, 2.8) | 0.225 | 16 | 23 | 1.5(1.2, 1.9) |
| Stockholm | 9 | 07–16 | 11(−3.3, 28) | 0.110 | 14 | 20 | |||
| Gothenburg | 27 | 8 | 07–15 | −2.4(−15, 13) | 0.697 | 15 | 21 | 0.75(0.42, 1.3) | |
| PFTrDA | Stockholm | 50 | 17 | 72–16 | 3.5(2.0, 5.0) | <0.001 | 14 | 18 | 2.1(1.6, 2.7) |
| Stockholm | 9 | 07–16 | 10(−2.6, 24) | 0.104 | 13 | 16 | |||
| Gothenburg | 27 | 8 | 07–15 | 4.4(−9.9, 21) | 0.500 | 15 | 22 | 2.4(1.5, 4.1) | |
| PFUnDA | Stockholm | 50 | 17 | 72–16 | 3.6(2.1, 5.2) | <0.001 | 14 | 20 | 4.4(3.8, 5.0) |
| Stockholm | 9 | 07–16 | 1.3(−4.8, 7.7) | 0.636 | 9 | 7.7 | |||
| Gothenburg | 27 | 8 | 07–15 | 0.27(−8.4, 9.7) | 0.934 | 11 | 12 | 5.2(3.6, 7.5) |
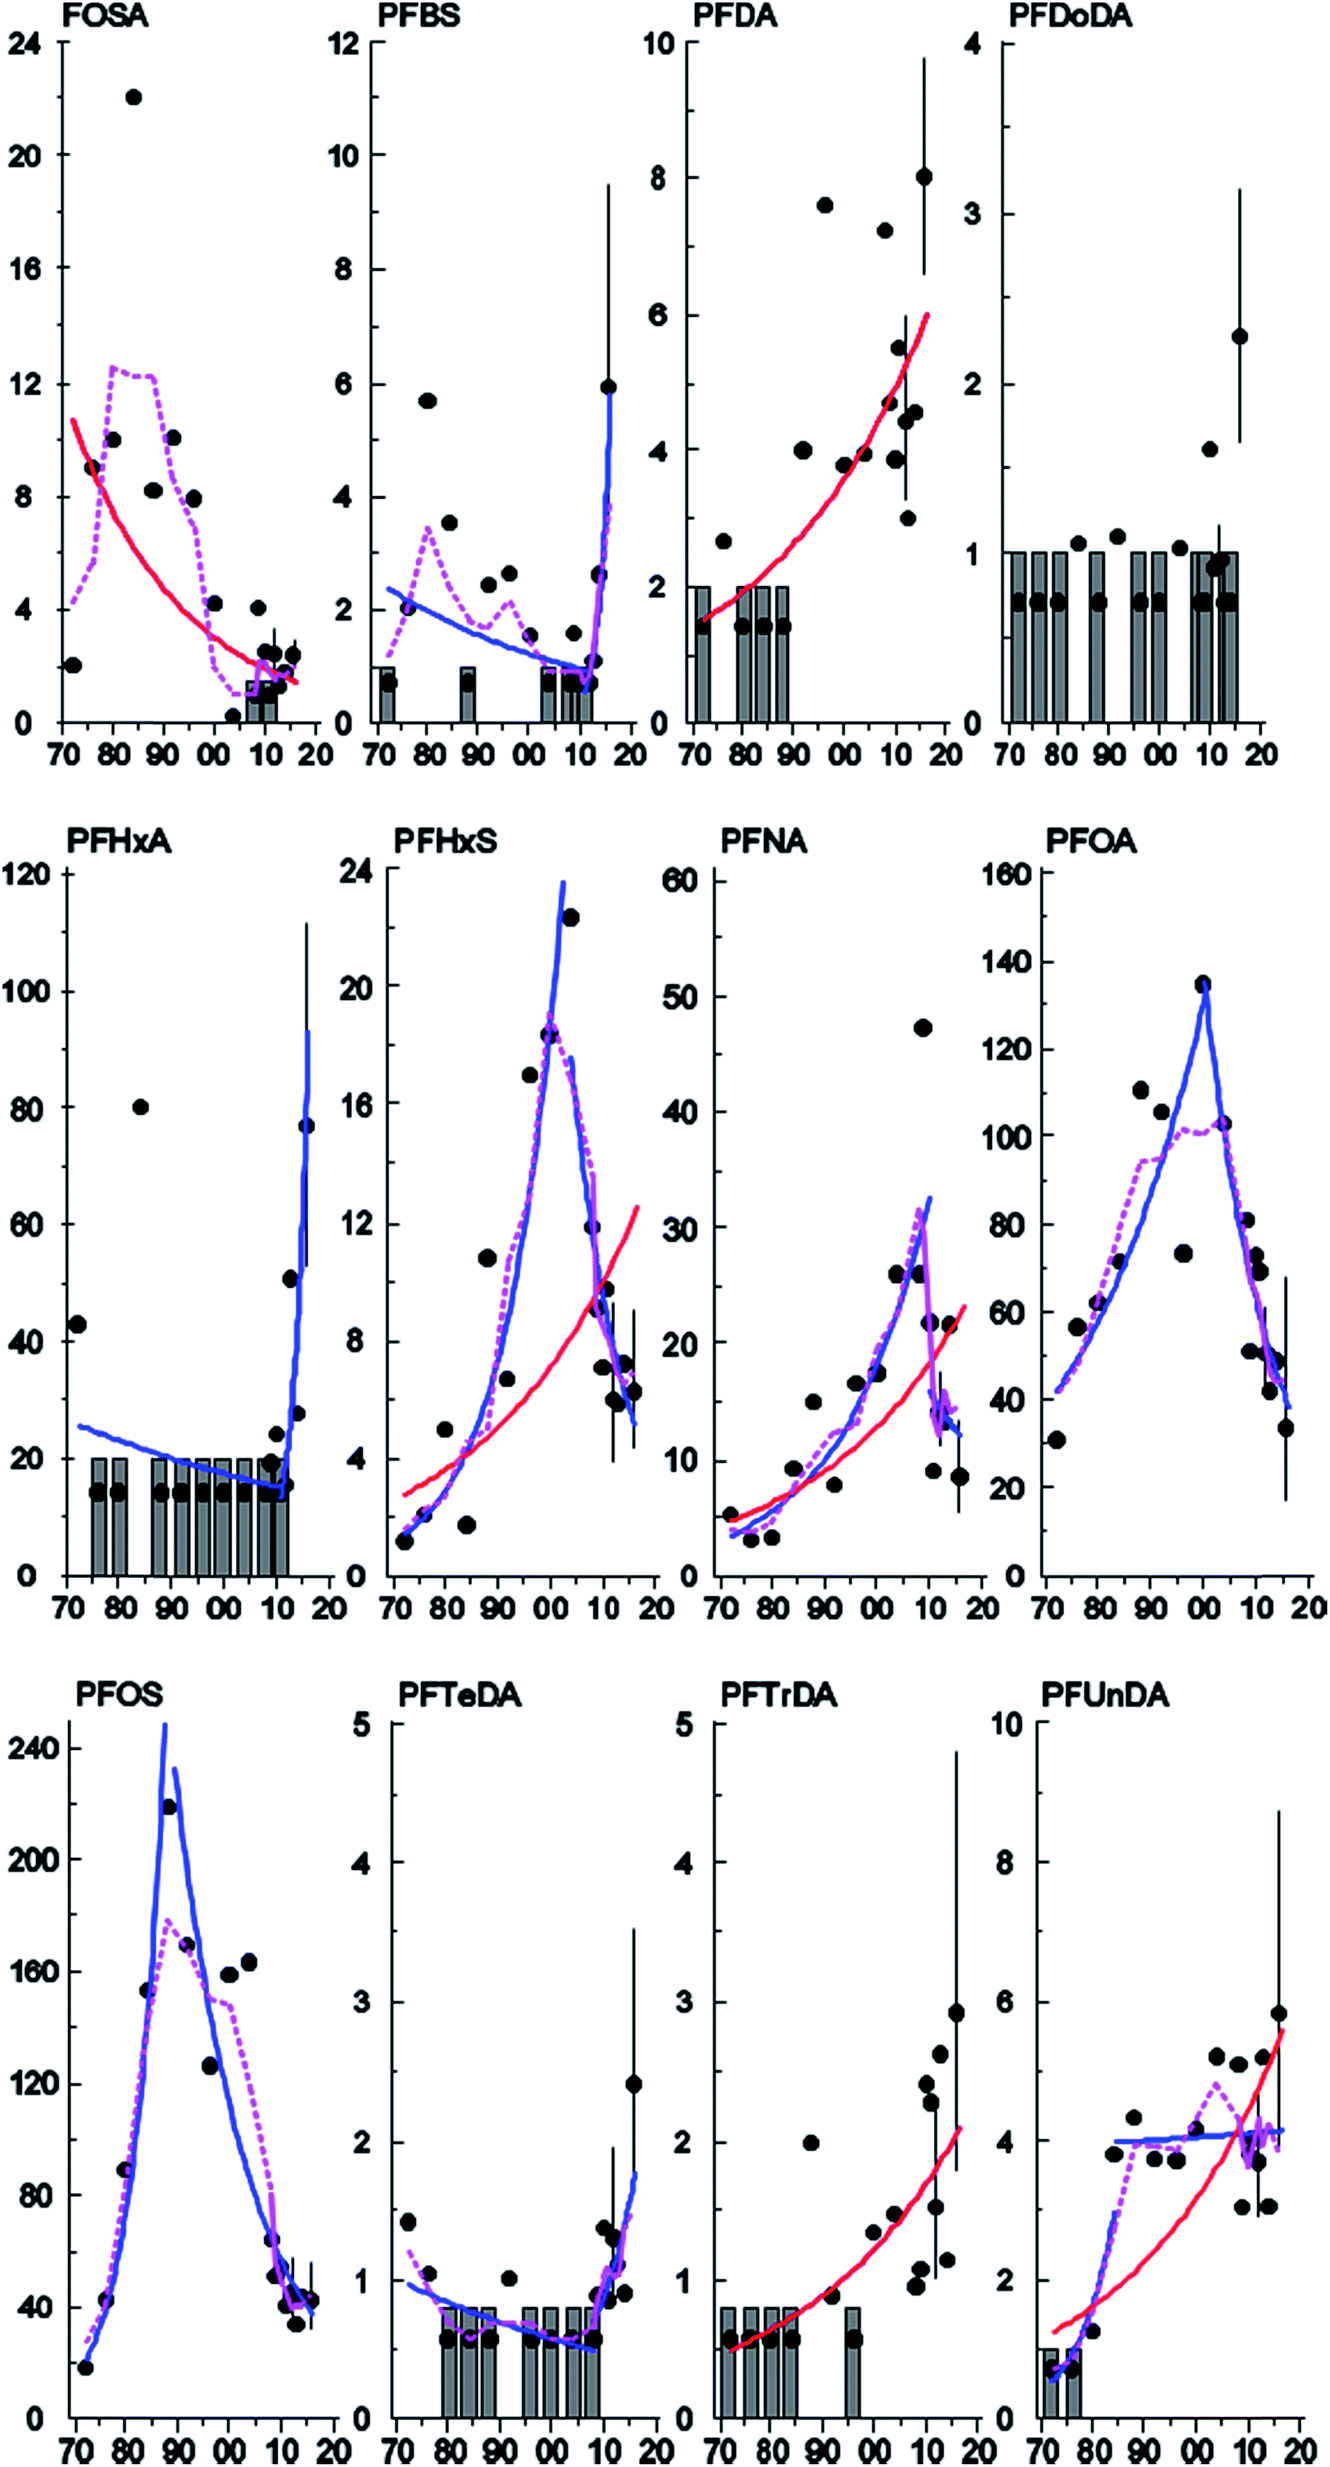 | ||
| Fig. 4 Temporal trends of FOSA (sum isomers), PFBS, PFDA, PFDoDA, PFHxA, PFHxS, PFNA, PFOA, PFOS (sum isomers), PFTeDA, PFTrDA and PFUnDA (pg mL−1; y-axis) in human milk from Stockholm (1972–2016; x-axis). Curves represent significant (p < 0.05) linear (red), non-linear (dashed purple) and change-point (blue) trends. Grey bars represent years where all values were <LOQ. Error bars (95% C.I.) are shown for years where there are individual samples. | ||
| PFASs | P(CP) | Year(CP) | b(1) | P(1) | b(2) | P(2) | LOQ/NY |
|---|---|---|---|---|---|---|---|
| FOSA | 0.077 | 1984 | 2/17 | ||||
| Br-FOSA | <0.001 | 1984 | 21.30 | 0.052 | −6.22 | <0.001 | 6/17 |
| L-FOSA | 0.022 | 1984 | 19.48 | 0.063 | −8.28 | <0.001 | 3/17 |
| PFBS | 0.037 | 2011 | −2.32 | 0.137 | 58.7 | 0.006 | 6/17 |
| PFDA | 0.171 | 1992 | 4/17 | ||||
| PFDoDA | 0.125 | 2011 | 10/17 | ||||
| PFHpA | 0.657 | 1988 | 11/17 | ||||
| PFHxA | 0.018 | 2011 | −1.36 | 0.251 | 46.7 | 0.048 | 9/17 |
| PFHxS | <0.001 | 2004 | 9.74 | <0.001 | −9.55 | 0.002 | 0/17 |
| PFNA | 0.008 | 2010 | 6.04 | <0.001 | −4.58 | 0.608 | 0/17 |
| PFOA | <0.001 | 2000 | 4.14 | 0.007 | −7.46 | <0.001 | 0/17 |
| PFOS | <0.001 | 1988 | 17.0 | 0.002 | −6.63 | <0.001 | 0/17 |
| Br-PFOS | <0.001 | 1988 | 19.4 | 0.007 | −7.35 | <0.001 | 0/17 |
| L-PFOS | <0.001 | 1988 | 16.9 | 0.002 | −6.34 | <0.001 | 0/17 |
| PFTeDA | 0.006 | 2008 | −1.81 | 0.054 | 12.55 | 0.039 | 7/17 |
| PFTrDA | 0.462 | 1992 | 5/17 | ||||
| PFUnDA | <0.001 | 1984 | 15.1 | 0.084 | 0.130 | 0.792 | 2/17 |
There was a clear shift in PFAS pattern (PFOA, PFNA, PFDA, PFUnDA, PFHxS, Br-PFOS, L-PFOS, PFDS, L-FOSA) over the study period (1972–2016) in Stockholm (Fig. 2A). Before 1996 the PFAS pattern was dominated by Br-PFOS, L-PFOS and L-FOSA; since then the concentrations of these substances have decreased, while concentrations of PFUnDA, PFDA and PFDS, have increased (samples from 2013–2016). This change in pattern may be due to the large historical production of PFOS and PFOS precursors before 2000, which was followed by ongoing contemporary production of long-chain PFCAs and PFCA precursors. Differences in the environmental fate and/or elimination half-lives of individual PFASs may also influence trends observed in humans. The centers of gravity for the three time periods were all significantly different (repeated Hotellings T2 test, p< the Bonferroni adjusted α value of 0.0167). The shift in PFAS pattern over time in milk from Stockholm is consistent with a shift in pattern reported previously in blood samples from Uppsala40 over a slightly different time period.
Estimated daily intakes and potential health risks
The upper- and lower-bound PFAS concentrations measured in maternal breast milk were used to determine the estimated daily intake (EDI) of individual and ∑PFASs via breast milk (Tables S8 and S9, ESI†). For these calculations an infant body weight of 7 kg and a milk consumption rate of 600 mL per day were used, as described in Kärrman et al.46 Lower bounds estimates ranged from 7.1–40 ng per kg body weight per day (ng/kg bw/d) in Stockholm and from 5.3–25 ng/kg bw/d in Gothenburg, while upper bounds estimates ranged from 9.7–42 in Stockholm and 7.7–27 ng/kg bw/d in Gothenburg. In comparison, Winkens et al.47 estimated a ∑PFAS EDI of 29 ng/kg bw/d for milk sampled from Sweden in 200446 and 43 ng/kg bw/d for milk sampled from Spain in 2008,48 while Tao et al.49 estimated an EDI of up to 87 ng/kg bw/d for milk collected in the U.S. in 2004.Whether or not these EDIs represent a significant health risk for infants is a source of debate. Winkens et al.47 pointed out that the tolerable daily intake (TDI) for PFOS and PFOA set by EFSA (150 and 1500 ng/kg bw/d, respectively) are up to two orders of magnitude higher than the minimal risk levels (MRL) set by the Agency for Toxic Substances & Disease Registry (30 and 20 ng/kg bw/d, respectively). Notably, none of the EDIs determined here for PFOS or PFOA exceeded these levels, even using upper bounds estimates. However, the aforementioned TDIs and MRLs only consider single substances; safe levels for most of the PFASs measured in the present work have yet to be defined and few data are available on the risks associated with cumulative exposure to multiple PFASs. Of note, both the Swedish Drinking Water Guideline and the US EPA Drinking Water Health Advisory Levels define thresholds based on ∑PFAS concentrations.50,51 With this in mind, our lower bounds ∑PFAS EDIs exceeded the 20 ng/kg bw/d MRL for PFOA in 6 individual samples (2012, 2016) and 7 pools (1984–2004 and 2010) from Stockholm and 2 individuals (2012) and 3 pooled samples (2007, 2010, and 2014) from Gothenburg. Using upper bounds estimates, the PFOA MRL was exceeded in 10 individuals from Stockholm (2012, 2016) and three individuals from Gothenburg (2012).
Confounding factors
In studies where PFAS concentrations are affected by confounding factors (e.g. age or parity) it is possible to adjust the concentrations for these confounders to lower the variation within the samples. A multiple regression analysis showed no significant correlations between age (parity was not included in the multiple regression since all mothers from Stockholm in 2012 were primiparous) and concentration for any of the PFAS analyzed in Stockholm 2012. Correspondingly the PFAS concentrations in samples from Gothenburg in 2012 did not show any significant correlations with either age or parity, with the exception of Br-PFOS which was significantly negatively correlated with age (p < 0.019). The adjustment of Br-PFOS concentrations with age improved the coefficient of variation (CV) from 77% to 54% (Fig. S4, ESI†). This is in contrast to the pattern seen for most fat soluble POPs, in which concentrations in milk tend to increase with age.52 To reduce the influence of confounding factors the sample definition in the sampling program is narrow, the mothers are of similar age and most of them are primiparous. Thus, the range of the age (Stockholm and Gothenburg) and parity (Gothenburg) were small, which reduces the likelihood of finding significant correlations with concentration.Conclusions
While the concentrations of several PFASs have declined in human milk in recent years, others continue to increase, presumably due to ongoing commercial use. These divergent time trends have resulted in a shift in the PFAS profile in human milk over the last 5 years compared to 2000–2012 and pre-2000. As few data are available on the effects of cumulative PFAS exposure, the impact of this ‘new’ profile on the risks to infant health remain unclear. With this in mind, hazard assessments involving simultaneous exposure to multiple PFASs in relative proportions consistent with those observed in human milk would improve overall risk characterizations, and predictions of the potential health impact of shifting PFAS profiles over time.Conflicts of interest
There are no conflicts to declare.Acknowledgements
The Swedish National Monitoring Program for Human Health is financed by the Swedish Environmental Protection Agency. Henrik Dahlgren at the Swedish Museum of Natural History is thanked for sample coordination and sample pre-preparation.References
- Swedish Chemicals Agency (KemI), Report 7/15, Occurrence and use of highly fluorinated substances and alternatives, 2015, accessed 4/13/2018 from, https://www.kemi.se/global/rapporter/2015/report-7-15-occurrence-and-use-of-highly-fluorinated-substances-and-alternatives.pdf Search PubMed.
- E. Kissa, Fluorinated Surfactants and Repellants, Marcel Dekker, NY, USA, 2001, vol. 97, p. 615 Search PubMed.
- N. Yamashita, K. Kannan, S. Taniyasu, Y. Horii, G. Petrick and T. Gamo, A global survey of perfluorinated acids in oceans, Mar. Pollut. Bull., 2005, 51, 658–668 CrossRef PubMed.
- J. P. Benskin, D. C. Muir, B. F. Scott, C. Spencer, A. O. De Silva, H. Kylin, J. W. Martin, A. Morris, R. Lohmann, G. Tomy, B. Rosenberg, S. Taniyasu and N. Yamashita, Perfluoroalkyl acids in the Atlantic and Canadian Arctic Oceans, Environ. Sci. Technol., 2012, 46, 5815–5823 CrossRef PubMed.
- K. Rankin, S. A. Mabury, T. M. Jenkins and J. W. Washington, A North American and global survey of perfluoroalkyl substances in surface soils: Distribution patterns and mode of occurrence, Chemosphere, 2016, 161, 333–341 CrossRef PubMed.
- Z. Zhao, Z. Xie, J. Tang, G. Zhang and R. Ebinghaus, Spatial distribution of perfluoroalkyl acids in surface sediments of the German Bight, North Sea, Sci. Total Environ., 2015, 511, 145–152 CrossRef PubMed.
- M. Houde, J. W. Martin, R. J. Letcher, K. R. Solomon and D. C. Muir, Biological monitoring of polyfluoroalkyl substances: A review, Environ. Sci. Technol., 2006, 40, 3463–3473 CrossRef PubMed.
- K. Kannan, S. Corsolini, J. Falandysz, G. Fillmann, K. S. Kumar, B. G. Loganathan, M. A. Mohd, J. Olivero, N. Van Wouwe, J. H. Yang and K. M. Aldoust, Perfluorooctanesulfonate and related fluorochemicals in human blood from several countries, Environ. Sci. Technol., 2004, 38, 4489–4495 CrossRef PubMed.
- Toxicological Effects of Perfluoroalkyl and Polyfluoroalkyl Substances, ed. J. C. DeWitt, Humana Press, Cham, 2015, ISBN 978-3-319-15517-3 Search PubMed.
- G. W. Olsen, J. M. Burris, D. J. Ehresman, J. W. Froehlich, A. M. Seacat, J. L. Butenhoff and L. R. Zobel, Half-life of serum elimination of perfluorooctanesulfonate, perfluorohexanesulfonate, and perfluorooctanoate in retired fluorochemical production workers, Environ. Health Perspect., 2007, 115, 1298–1305 CrossRef PubMed.
- R. C. Buck, J. Franklin, U. Berger, J. M. Conder, I. T. Cousins, P. de Voogt, A. A. Jensen, K. Kannan, S. A. Mabury and S. P. van Leeuwen, Perfluoroalkyl and polyfluoroalkyl substances in the environment: terminology, classification, and origins, Integr. Environ. Assess. Manage., 2011, 7, 513–541 CrossRef PubMed.
- Environment and Climate Change Canada, PFCAs and their precursors in perfluorinated products: Environmental agreement overview, 2017, accessed 4/13/2018 from, https://www.ec.gc.ca/epe-epa/default.asp?lang=En%26n=AE06B51E-1 Search PubMed.
- United States Environmental Protection Agency, Fact Sheet: 2010/2015 PFOA Stewardship Program, 2006, accessed 4/10/2018 from, https://www.epa.gov/assessing-and-managing-chemicals-under-tsca/fact-sheet-20102015-pfoa-stewardship-program Search PubMed.
- J. Lofstedt Gilljam, J. Leonel, I. T. Cousins and J. P. Benskin, Is Ongoing Sulfluramid Use in South America a Significant Source of Perfluorooctanesulfonate (PFOS)? Production Inventories, Environmental Fate, and Local Occurrence, Environ. Sci. Technol., 2016, 50, 653–659 CrossRef PubMed.
- W. A. Gebbink, L. van Asseldonk and S. P. J. van Leeuwen, Presence of Emerging Per- and Polyfluoroalkyl Substances (PFASs) in River and Drinking Water near a Fluorochemical Production Plant in the Netherlands, Environ. Sci. Technol., 2017, 51, 11057–11065 CrossRef PubMed.
- M. Sun, E. Arevalo, M. Strynar, A. Lindstrom, M. Richardson, B. Kearns, P. C. Smith and D. R. U. Knappe, Legacy and Emerging Perfluoroalkyl Substances Are Important Drinking Water Contaminants in the Cape Fear River Watershed of North Carolina, Environ. Sci. Technol. Lett., 2016, 3, 415–419 CrossRef.
- K. Croes, A. Colles, G. Koppen, E. Govarts, L. Bruckers, E. Van de Mieroop, V. Nelen, A. Covaci, A. C. Dirtu, C. Thomsen, L. S. Haug, G. Becher, M. Mampaey, G. Schoeters, N. Van Larebeke and W. Baeyens, Persistent organic pollutants (POPs) in human milk: a biomonitoring study in rural areas of Flanders (Belgium), Chemosphere, 2012, 89, 988–994 CrossRef PubMed.
- L. S. Haug, C. Thomsen and G. Becher, Time trends and the influence of age and gender on serum concentrations of perfluorinated compounds in archived human samples, Environ. Sci. Technol., 2009, 43, 2131–2136 CrossRef PubMed.
- H. Fromme, C. Mosch, M. Morovitz, I. Alba-Alejandre, S. Boehmer, M. Kiranoglu, F. Faber, I. Hannibal, O. Genzel-Boroviczeny, B. Koletzko and W. Volkel, Pre- and postnatal exposure to perfluorinated compounds (PFCs), Environ. Sci. Technol., 2010, 44, 7123–7129 CrossRef PubMed.
- M. A. Verner, G. Ngueta, E. T. Jensen, H. Fromme, W. Volkel, U. C. Nygaard, B. Granum and M. P. Longnecker, A Simple Pharmacokinetic Model of Prenatal and Postnatal Exposure to Perfluoroalkyl Substances (PFASs), Environ. Sci. Technol., 2016, 50, 978–986 CrossRef PubMed.
- I. Gyllenhammar, J. P. Benskin, O. Sandblom, U. Berger, L. Ahrens, S. Lignell, K. Wiberg and A. Glynn, Perfluoroalkyl Acids (PFAAs) in Serum from 2–4-Month-Old Infants: Influence of Maternal Serum Concentration, Gestational Age, Breast-Feeding, and Contaminated Drinking Water, Environ. Sci. Technol., 2018, 52, 7101–7110 CrossRef PubMed.
- A. P. Starling, S. M. Engel, K. W. Whitworth, D. B. Richardson, A. M. Stuebe, J. L. Daniels, L. S. Haug, M. Eggesbo, G. Becher, A. Sabaredzovic, C. Thomsen, R. E. Wilson, G. S. Travlos, J. A. Hoppin, D. D. Baird and M. P. Longnecker, Perfluoroalkyl substances and lipid concentrations in plasma during pregnancy among women in the Norwegian Mother and Child Cohort Study, Environ. Int., 2014, 62, 104–112 CrossRef PubMed.
- M. Skuladottir, A. Ramel, D. Rytter, L. S. Haug, A. Sabaredzovic, B. H. Bech, T. B. Henriksen, S. F. Olsen and T. I. Halldorsson, Examining confounding by diet in the association between perfluoroalkyl acids and serum cholesterol in pregnancy, Environ. Res., 2015, 143, 33–38 CrossRef PubMed.
- N. Matilla-Santander, D. Valvi, M. J. Lopez-Espinosa, C. B. Manzano-Salgado, F. Ballester, J. Ibarluzea, L. Santa-Marina, T. Schettgen, M. Guxens, J. Sunyer and M. Vrijheid, Exposure to Perfluoroalkyl Substances and Metabolic Outcomes in Pregnant Women: Evidence from the Spanish INMA Birth Cohorts, Environ. Health Perspect., 2017, 125, 117004 CrossRef PubMed.
- C. C. Bach, B. H. Bech, N. Brix, E. A. Nohr, J. P. Bonde and T. B. Henriksen, Perfluoroalkyl and polyfluoroalkyl substances and human fetal growth: a systematic review, Crit. Rev. Toxicol., 2015, 45, 53–67 CrossRef PubMed.
- P. I. Johnson, P. Sutton, D. S. Atchley, E. Koustas, J. Lam, S. Sen, K. A. Robinson, D. A. Axelrad and T. J. Woodruff, The Navigation Guide – evidence-based medicine meets environmental health: systematic review of human evidence for PFOA effects on fetal growth, Environ. Health Perspect., 2014, 122, 1028–1039 Search PubMed.
- National Toxicology Program, NTP monograph on immunotoxicity associated with exposure to perfluorooctanoic acid (PFOA) or perfluorooctane sulfonate (PFOS), 2016, accessed 4/10/2018 from, https://ntp.niehs.nih.gov/ntp/ohat/pfoa_pfos/pfoa_pfosmonograph_508.pdf Search PubMed.
- M. Sundström, D. J. Ehresman, A. Bignert, J. L. Butenhoff, G. W. Olsen, S. C. Chang and A. Bergman, A temporal trend study (1972–2008) of perfluorooctanesulfonate, perfluorohexanesulfonate, and perfluorooctanoate in pooled human milk samples from Stockholm, Sweden, Environ. Int., 2011, 37, 178–183 CrossRef PubMed.
- A. M. Calafat, L. Y. Wong, Z. Kuklenyik, J. A. Reidy and L. L. Needham, Polyfluoroalkyl chemicals in the U.S. population: data from the National Health and Nutrition Examination Survey (NHANES) 2003–2004 and comparisons with NHANES 1999–2000, Environ. Health Perspect., 2007, 115, 1596–1602 CrossRef PubMed.
- A. Kärrman, I. Ericson, B. van Bavel, P. O. Darnerud, M. Aune, A. Glynn, S. Lignell and G. Lindstrom, Exposure of perfluorinated chemicals through lactation: levels of matched human milk and serum and a temporal trend, 1996–2004, in Sweden, Environ. Health Perspect., 2007, 115, 226–230 CrossRef PubMed.
- G. W. Olsen, H. Y. Huang, K. J. Helzlsouer, K. J. Hansen, J. L. Butenhoff and J. H. Mandel, Historical comparison of perfluorooctanesulfonate, perfluorooctanoate, and other fluorochemicals in human blood, Environ. Health Perspect., 2005, 113, 539–545 CrossRef PubMed.
- G. W. Olsen, D. C. Mair, T. R. Church, M. E. Ellefson, W. K. Reagen, T. M. Boyd, R. M. Herron, Z. Medhdizadehkashi, J. B. Nobiletti, J. A. Rios, J. L. Butenhoff and L. R. Zobel, Decline in perfluorooctanesulfonate and other polyfluoroalkyl chemicals in American Red Cross adult blood donors, 2000–2006, Environ. Sci. Technol., 2008, 42, 4989–4995 CrossRef PubMed.
- I. Gyllenhammar, J. P. Benskin, S. Lignell, A. S. Kärsrud, O. Sandblom and A. Glynn, Report to the Swedish EPA: Temporal trends of poly- and perfluoroalkyl substances (PFASs) in serum from children at 4, 8, and 12 years of age, in Uppsala 2008–2015, Swedish Environmental Protection Agency, 2016, accessed 4/10/2018 from, https://www.diva-portal.org/smash/get/diva2:967629/FULLTEXT01.pdf Search PubMed.
- A. Glynn, J. P. Benskin, I. Gyllenhammar, M. Aune, T. Cantillana and O. Sandblom, Report to the Swedish EPA: Temporal trends of perfluoroalkyl substances (PFAS) in individual serum samples from first-time mothers in Uppsala 1996–2016, Swedish Environmental Protection Agency, 2017, accessed 4/10/2018 from, http://www.imm.ki.se/datavard/rapporter/Sakrapport/20PFAS/201996/202016.pdf Search PubMed.
- N. Riddell, G. Arsenault, J. P. Benskin, B. Chittim, J. W. Martin, A. McAlees and R. McCrindle, Branched perfluorooctane sulfonate isomer quantification and characterization in blood serum samples by HPLC/ESI-MS(/MS), Environ. Sci. Technol., 2009, 43, 7902–7908 CrossRef PubMed.
- M. D. Nicholson, R. J. Fryer and J. R. Larsen, Temporal trend monitoring: robust method for analyzing contaminant trend monitoring data, ICES Tech. Mar. Environ. Sci., 1998, 20, 1–22 Search PubMed.
- E. Sturludottir, H. Gunnlaugsdottir, O. K. Nielsen and G. Stefansson, Detection of a changepoint, a mean-shift accompanied with a trend change, in short time-series with autocorrelation, Commun. Stat. Simul. Comput., 2017, 46, 5808–5818 CrossRef.
- D. C. Hoaglin and R. E. Welsch, The Hat Matrix in Regression and ANOVA, Am. Stat., 1978, 32, 17–22 Search PubMed.
- E. Nyberg, Improved Assessment in Environmental Monitoring of POPs – Using monitoring data from the aquatic ecosystem and human milk, Ph.D. thesis, Environmental Chemistry at Stockholm University, 2016.
- A. Glynn, U. Berger, A. Bignert, S. Ullah, M. Aune, S. Lignell and P. O. Darnerud, Perfluorinated alkyl acids in blood serum from primiparous women in Sweden: serial sampling during pregnancy and nursing, and temporal trends 1996–2010, Environ. Sci. Technol., 2012, 46, 9071–9079 CrossRef PubMed.
- J. M. Keller, A. M. Calafat, K. Kato, M. E. Ellefson, W. K. Reagen, M. Strynar, S. O'Connell, C. M. Butt, S. A. Mabury, J. Small, D. C. Muir, S. D. Leigh and M. M. Schantz, Determination of perfluorinated alkyl acid concentrations in human serum and milk standard reference materials, Anal. Bioanal. Chem., 2010, 397, 439–451 CrossRef PubMed.
- J. Fång, E. Nyberg, U. Winnberg, A. Bignert and Å. Bergman, Spatial and temporal trends of the Stockholm Convention POPs in mothers' milk – a global review, Environ. Sci. Pollut. Res., 2015, 22, 8989–9041 CrossRef PubMed.
- H. Kang, K. Choi, H. S. Lee, D. H. Kim, N. Y. Park, S. Kim and Y. Kho, Elevated levels of short carbon-chain PFCAs in breast milk among Korean women: Current status and potential challenges, Environ. Res., 2016, 148, 351–359 CrossRef PubMed.
- H. Nilsson, A. Karrman, A. Rotander, B. van Bavel, G. Lindstrom and H. Westberg, Biotransformation of fluorotelomer compound to perfluorocarboxylates in humans, Environ. Int., 2013, 51, 8–12 CrossRef PubMed.
- I. Gyllenhammar, U. Berger, M. Sundstrom, P. McCleaf, K. Euren, S. Eriksson, S. Ahlgren, S. Lignell, M. Aune, N. Kotova and A. Glynn, Influence of contaminated drinking water on perfluoroalkyl acid levels in human serum-A case study from Uppsala, Sweden, Environ. Res., 2015, 140, 673–683 CrossRef PubMed.
- A. Kärrman, J. L. Domingo, X. Llebaria, M. Nadal, E. Bigas and B. van Bavel, Biomonitoring perfluorinated compounds in Catalonia, Spain: concentrations and trends in human liver and milk samples, Environ. Sci. Pollut. Res. Int., 2009, 17, 750–758 CrossRef PubMed.
- K. Winkens, R. Vestergren, U. Berger and I. T. Cousins, Early life exposure to per- and polyfluoroalkyl substances (PFASs): A critical review, Emerging Contaminants, 2017, 3, 55–68 CrossRef.
- M. Llorca, M. Farre, Y. Pico, M. L. Teijon, J. G. Alvarez and D. Barcelo, Infant exposure of perfluorinated compounds: levels in breast milk and commercial baby food, Environ. Int., 2010, 36, 584–592 CrossRef PubMed.
- L. Tao, K. Kannan, C. M. Wong, K. F. Arcaro and J. L. Butenhoff, Perfluorinated compounds in human milk from Massachusetts, U.S.A., Environ. Sci. Technol., 2008, 42, 3096–3101 CrossRef PubMed.
- Swedish National Food Agency, Riskhantering – PFAS i dricksvatten och fisk, last update 2017-11-28, 2016, accessed 4/10/2018 from, https://www.livsmedelsverket.se/livsmedel-och-innehall/oonskade-amnen/miljogifter/pfas-poly-och-perfluorerade-alkylsubstanser/riskhantering-pfaa-i-dricksvatten/ Search PubMed.
- US EPA, Fact Sheet PFOA & PFOS Drinking Water Health Advisories, November 2016, EPA 800-F-16-003, 2016, pp. 1–5, accessed 4/10/2018 from, https://www.epa.gov/ground-water-and-drinking-water/drinking-water-health-advisories-pfoa-and-pfos Search PubMed.
- J. M. Albers, I. A. Kreis, A. K. Liem and P. van Zoonen, Factors that influence the level of contamination of human milk with poly-chlorinated organic compounds, Arch. Environ. Contam. Toxicol., 1996, 30, 285–291 CrossRef PubMed.
Footnote |
| † Electronic supplementary information (ESI) available. See DOI: 10.1039/c8em00174j |
| This journal is © The Royal Society of Chemistry 2018 |