Do environmental dynamics matter in fate models? Exploring scenario dynamics for a terrestrial and an aquatic system†
Received
4th November 2017
, Accepted 14th December 2017
First published on 14th December 2017
Abstract
Nowadays, there is growing interest in inserting more ecological realism into risk assessment of chemicals. On the exposure evaluation side, this can be done by studying the complexity of exposure in the ecosystem, niche partitioning, e.g. variation of the exposure scenario. Current regulatory predictive approaches, to ensure simplicity and predictive ability, generally keep the scenario as static as possible. This could lead to under or overprediction of chemical exposure depending on the chemical and scenario simulated. To account for more realistic exposure conditions, varying temporally and spatially, additional scenario complexity should be included in currently used models to improve their predictive ability. This study presents two case studies (a terrestrial and an aquatic one) in which some polychlorinated biphenyls (PCBs) were simulated with the SoilPlusVeg and ChimERA models to show the importance of scenario variation in time (biotic and abiotic compartments). The results outlined the importance of accounting for planetary boundary layer variation and vegetation dynamics to accurately predict air concentration changes and the timing of chemical dispersion from the source in terrestrial systems. For the aquatic exercise, the results indicated the need to account for organic carbon forms (particulate and dissolved organic carbon) and vegetation biomass dynamics. In both cases the range of variation was up to two orders of magnitude depending on the congener and scenario, reinforcing the need for incorporating such knowledge into exposure assessment.
Environmental significance
The general problem addressed in this work is the need for incorporating more environmental dynamics and realism into models and scenarios for exposure assessment. Models employed in exposure assessment, especially in a regulatory context, generally simplify environmental scenarios to keep variability down and provide average predictions. Such values may not really be predictive in many situations, as recently accounted for in an EU Scientific opinion. Here, we focused on the temporal variability of primary producer biomass and environmental parameters in two case studies and showed how such changes can lead to exposure variations up to 1–2 orders of magnitude, highlighting the importance of accounting for dynamics in certain situations.
|
1. Introduction
Multimedia fate models play an important role in the prediction of ecosystem exposure to chemicals in environmental risk assessment (ERA) procedures. Unlike experimental monitoring which represents an “a posteriori” approach, providing data about a contamination that already happened and generally representing single points in time and space, multimedia fate models represent an “a priori” approach which can be useful in predicting chemical fate and concentration trends in different environmental compartments before their use or emission. In the last three decades, different multimedia fate models were developed including different compartments and processes.1 Many of these models described in the literature are steady state models,2–6i.e., they predict a single concentration (independent of space and time) in each medium, representing the long-term state of a system that stabilizes. Moreover, single values for different input parameters (e.g., water volume and fluxes, soil texture, OC content, etc.) are required and spatial and temporal averages are therefore adopted. In contrast, unsteady state models7,8 which basically include at least a dynamic emission can provide the prediction of media concentration at different times during the simulated period; however, they generally furnish a simplified description and parameterization of the compartment and keep many compartment parameters constant over time. Due to the large number of chemicals to be regulated and the high complexity of ecosystems to protect, also current regulatory approaches (such as EUSES5 for industrial chemicals and FOCUS9 for pesticides) are very simple and standardized tools10,11 and generally employ fixed values for many environmental parameters. Many authors and institutions are investigating the complexity of exposure in the ecosystem, niche partitioning and other concepts which underline the need for increasing the complexity of the exposure scenario.12–14 The importance of time-variable exposure in risk assessment has been the subject of discussion since the early 1990s. For example, in ref. 15, it was already observed that fluctuating exposure to esfenvalerate could be more relevant, in terms of effects on survival, growth, and reproduction of bluegill (Lepomis macrochirus), with respect to constant exposure. From a modelling perspective, for example, several approaches were developed to predict effects on aquatic organisms resulting from time-varying exposure to pesticides.16,17 More recently, in ref. 18, the need to characterize time-variable exposure by investigating the peak magnitude, area, duration, intervals between peaks and frequency, and long-term background concentration was stressed. Moreover, a recent scientific opinion12 and related publications (e.g., ref. 13) clearly stated the strong need to increase realism in predictions also by accounting for spatio-temporal dynamics and to link the resulting exposure profiles to adequate effect modelling approaches. In other terms, to account for different exposure conditions, varying temporally and spatially, more scenario complexity should be included in currently used models to improve their predictive ability. Recently, some efforts were made to introduce more dynamics and ecological realism into models and scenarios for exposure assessment, for example (1) including the Planet Boundary Layer (PBL) height and meteorological parameter variability in air–soil models,19–21 (2) accounting for a terrestrial vegetation compartment, dynamic in terms of biomass22 and ecological parameters,23,24 and (3) incorporating primary producers and particulate/dissolved organic carbon (POC/DOC) and their dynamics into aquatic models.25–29 All these new approaches highlighted how accounting for these dynamics can help in improving exposure predictions for humans and ecosystems, especially when environmental heterogeneity determines relevant fluctuations of exposure concentrations. In this work, two recently developed fully dynamic models for terrestrial (SoilPlusVeg)24 and aquatic (ChimERA fate)28 environments were used, adopting dynamic and realistic scenarios, to run a number of illustrative simulations to explore the influence of environmental and biomass dynamics on exposure predictions in terrestrial and aquatic systems. More specifically, we aimed to (1) estimate the source strength (i.e., the gross volatilization flux from a polluted soil sample, expressed as kg per year per ha) for a contaminated site using a dynamic scenario, and (2) investigate how realistic temporal changes in biomass abundance (in both terrestrial and aquatic environments) and POC/DOC water concentrations can affect diel (for air) and seasonal (for water) variability in exposure concentrations. Additionally, we were able to quantify the amplitude of such variability and relate it to chemical hydrophobicity.
2. Materials and methods
2.1 Modelling approaches
2.1.1 Soil–litter–vegetation–air model: SoilPlusVeg.
SoilPlusVeg is a dynamic, site-specific, fugacity-based model developed to investigate the fate of organic, non-polar chemicals in the soil/litter/vegetation/air system. The originating model8 consisted of two atmospheric compartments, namely “lower air” (LA, representing the planetary boundary layer, PBL) and “upper air” (UA, representing the atmospheric residual layer), interacting dynamically with litter and soil compartments. More recently, terrestrial vegetation, with root, stem, and leaf compartments, was included in the model.24Fig. 1 shows a schematic representation of the SoilPlusVeg unit. The model calculates mass balances for chemical (in all compartments), water and organic matter (in soil). Other key features of the model are: (1) height and wind speed of atmospheric compartments can vary in time (hourly) to reflect diel and seasonal atmospheric variability,21,30 (2) litter and soil compartments can be divided into layers, to allow a more accurate description of chemical movement in them, (3) a temporal profile of dissolved organic carbon (DOC) concentrations in soil water can be specified, (4) the vegetation compartment can be used to simulate mono- or multi-specific forests as well as shrubs and herbaceous plants and is completely dynamic in terms of biomass and ecological parameters (i.e., Specific Leaf Area, SLA, and Leaf Area Index, LAI, and leaf density and length), and (5) chemicals can reach leaves through dry gaseous and particle deposition, wet particle deposition and rain dissolution of dissolved chemicals and/or be taken up from soil via roots. Generally, when vegetation is considered in models that include PBL dynamics, it is kept constant for the whole growing season31–33 or both vegetation and the PBL height are assumed not to change with time.33,34 Models that include ecological parameters (LAI and SLA) are scarce and, if considered, these parameters are assumed to be constant over time to represent the value of the leaf/canopy maturity phase.4,35–40 Being a fugacity model, compartment capacities are expressed in terms of Z-values, while transport and transformation processes are computed by means of D-values.2 The chemical mass-balance in each compartment is expressed by a 1st-order ordinary differential equation (ODE) and the resulting ODE system is solved using a 5th-order accurate, diagonally implicit Runge–Kutta method with adaptive time stepping.41 More details concerning model formulation can be found in the original papers.8,24 Model performance in predicting temporally resolved air and leaf concentrations was evaluated for different case studies21,24 and the results are summarized in Text ESI 1.†
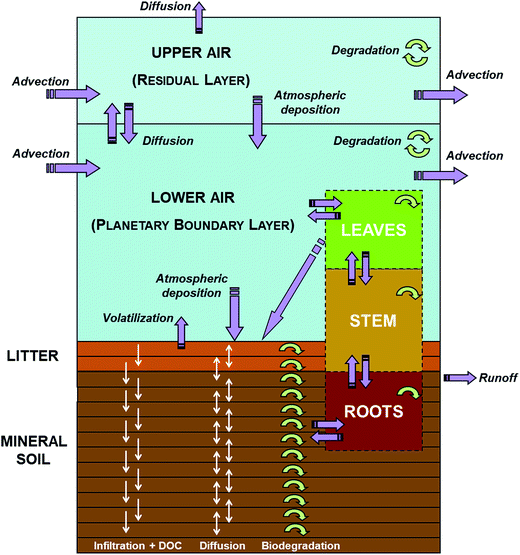 |
| | Fig. 1 Schematic representation of the SoilPlusVeg model unit, with the air, litter, mineral soil, leaf, stem, and root compartments. Purple arrows indicate chemical fluxes among compartments or accessing/leaving the system, while circular green arrows indicate degradation processes (modified with permission from ref. 24). | |
2.1.2 Aquatic model for shallow water environments: ChimERA fate.
In the present work, the dynamic, spatially resolved model ChimERA fate28,29 was adopted for the simulations in the aquatic environment. Fig. 2 presents the model unit, with the water, sediment, macrophyte and phytoplankton compartments and detritus and dissolved organic matter (DOM) sub-compartments. The model, based on the fugacity concept,2 was developed to investigate the fate of organic non-polar chemicals in shallow-water bodies. Being a dynamic model, time-varying profiles (up to hourly resolution) for the main input parameters, such as water temperature, primary producer biomass, detritus and DOM concentration, and hydrodynamics, can be specified. Model output includes hourly chemical concentrations in all compartments and sub-compartments and chemical fluxes between them. The key features of the model are as follows: (1) primary producers (i.e., macrophyte and phytoplankton compartments) exchange chemicals with the water and are thereby capable of influencing bioavailable concentrations (i.e., freely dissolved concentrations, including the chemical fraction which is not sorbed to dead or living material and is readily available for uptake by organisms); (2) particulate and dissolved organic matter are modelled as water sub-compartments (i.e., in equi-fugacity with water) and are also capable of affecting bioavailability; (3) the sediment compartment can be divided into layers, to allow a more accurate description of the chemical movement with depth and to account for the spatial variability in the exposure of benthic populations; and (4) the model domain is flexible, i.e., more model units can be combined to simulate complex environmental systems (e.g., networks of streams and ponds) or different zones of a single water body (e.g., littoral and pelagic in a lake). Although other existing models account for macrophytes,26,42,43 phytoplankton25 and dissolved organic matter26 in their fate calculations, ChimERA fate incorporates all these phases in a spatially resolved water-sediment environment and allows a completely dynamic parameterization (i.e., spatio-temporally resolved water fluxes, biomass density, POC/DOC concentrations, etc.). This means that the influence of heterogeneities in environmental parameters and organic phase abundance/characteristics on exposure can be assessed. Details concerning model formulation and applications for macrophyte- and phytoplankton-dominated environments are reported elsewhere.28,29 In Text ESI 1,† some efforts carried out to assess the ChimERA fate model performance in predicting concentrations in water, sediment, macrophytes, and phytoplankton for different chemicals and case studies28,29 are summarized.
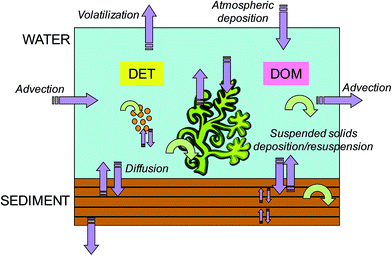 |
| | Fig. 2 Schematic representation of the ChimERA fate model unit, with the water, sediment, macrophyte and phytoplankton compartments and detritus (DET) and dissolved organic matter (DOM) sub-compartments. Purple arrows indicate chemical fluxes among compartments or accessing/leaving the system, while circular green arrows indicate degradation processes (modified with permission from ref. 28). | |
2.2 Chemicals
Six indicator polychlorinated biphenyl (PCB) congeners [28, 52, 101, 138, 153, and 180] measured in ref. 44 in the air of Brescia (see 2.3.1) and characterized by increasing hydrophobicity (log![[thin space (1/6-em)]](https://www.rsc.org/images/entities/char_2009.gif) KOW from 5.6 to 7.36; Table ESI 1†) were selected for the simulations in the terrestrial case studies. Although such chemicals represent a small group of semi-volatile compounds and do not cover a particularly wide range of properties or environmental half-lives, they were also selected for the simulations in the aquatic case study, (1) to focus on the effect of aquatic vegetation and organic phases at increasing logKOW on a coherent group of chemicals, as also done in a companion study for phytoplankton-dominated systems,29 (2) since the effect of vegetation and organic phases is well visible on such chemicals, as demonstrated in several previous studies,25–29 and (3) to explore the effect of vegetation in comparative terms with respect to the terrestrial case study.
KOW from 5.6 to 7.36; Table ESI 1†) were selected for the simulations in the terrestrial case studies. Although such chemicals represent a small group of semi-volatile compounds and do not cover a particularly wide range of properties or environmental half-lives, they were also selected for the simulations in the aquatic case study, (1) to focus on the effect of aquatic vegetation and organic phases at increasing logKOW on a coherent group of chemicals, as also done in a companion study for phytoplankton-dominated systems,29 (2) since the effect of vegetation and organic phases is well visible on such chemicals, as demonstrated in several previous studies,25–29 and (3) to explore the effect of vegetation in comparative terms with respect to the terrestrial case study.
2.3 Case studies and model parameterization
2.3.1 Terrestrial scenario.
Brescia is a highly industrialized city with about 200000 inhabitants located in Northern Italy (Lombardy Region), which suffers from the impact of its large-scale industrial development on the surrounding environment. Here, an industrial chemical plant (Caffaro S.p.a.) produced PCBs for about 50 years (1930–1984) and ∼200 ha of soils located south of the factory were found to be heavily contaminated by PCBs, in concentrations that often exceed the regulatory threshold for residential areas (60 ng g−1 d.w.).45–47 For this reason, in 2003, this area of the city was declared as a National Priority Site for remediation (SIN Brescia Caffaro) by the Italian Ministry of Environment. About half of the SIN soil (∼100 ha (ref. 47)) is represented by agricultural areas which were irrigated with water collected from ditches that received contaminated water from the factory (Fig. ESI 1†). These soils, which have not been remediated yet, represent an important secondary source of PCBs which can volatilize to the air compartment. Recently, an attempt to evaluate current secondary emissions of PCBs from the contaminated site and to differentiate them from primary sources (e.g., industries, municipal waste incinerators, etc.) was made47 combining a modelling approach with an exploratory multivariate data analysis technique. Although simulation results confirmed that the contaminated area (both the industrial site and the surrounding agricultural areas) is still an important secondary source of PCBs for the air of Brescia and the surrounding regions, the emission source strength of this city has not been evaluated yet. Therefore, in the present work the SoilPlusVeg model was employed to run two types of simulations (“I” and “II”). Simulations “I” were run neglecting the vegetation compartment, (1) to evaluate the potential influence of the soils immediately surrounding the chemical factory on current air contamination and estimate the source strength for the investigated congeners from this area, and (2) to assess the short-term (i.e., diel) variability of PCB air concentrations. The estimated source strengths (kg per year per ha) were compared with those calculated for the same congeners at other urban locations such as Zurich, Chicago and Banja Luka.48 A 10 cm, loamy sand soil characterized by 1.5% organic carbon (OC) and an average DOC concentration in soil water of 5 mg L−1 was simulated. The air compartments were parameterized as reported in ref. 21, while surface meteorological parameters (temperature, rainfall and solar radiation) for the city of Brescia (year 2007) were provided by the Regional Protection Agency.49 A congener-specific background air concentration equal to the minimum concentration measured at about 1 km from the factory in ref. 44 (site “E”) was assumed (Table ESI 2†), while the PM10 background concentration was set to 50 μg m−3, close to the annual PM10 average level often measured at urban sites in Northern Italy.50 Multi-year simulations were performed and a constant chemical discharge to soil (mol h−1) was assumed over the whole simulation period, to obtain a realistic picture of the historical contamination of the Brescia Caffaro site; the discharged amount was calibrated to reproduce measured air concentrations near the factory (site “B” in ref. 44) after steady-state conditions in soil had been reached (Table ESI 2†). Therefore, soil acted as a source of contaminants for the air compartment. Source strengths (kg per year per ha) were calculated as the sum of hourly gross volatilization fluxes from soil during the first year after the steady-state was reached. The model domain was set to 30 ha to simulate the area immediately surrounding the factory (see the red line in Fig. ESI 1†), including the most contaminated soils.51 Simulations “II” were run for the same PCBs and applying the same scenario but assuming that all domain area was covered by vegetation to investigate the potential role of vegetation in mitigating air concentrations and in influencing the amplitude of diel oscillation in air concentrations. The vegetation compartment was parameterized as reported in ref. 24 to simulate a mixed broadleaf woods characterized by dynamic biomass and ecological parameters (LAI, SLA, leaf density, leaf length, and wax content) changing during the growing season.
2.3.2 Aquatic scenario.
For the investigations in the aquatic environment with the ChimERA fate model, a generic, simplified macrophyte-dominated shallow water body was simulated. Such a system was composed of a 450 m2, 50 cm deep water compartment, overlying a 1 cm deep sediment layer characterized by 1% OC. A fixed water residence time of 20 days, corresponding to a constant inflow and outflow water flux of 0.47 m3 h−1, was adopted. As in ref. 28, realistic information concerning the temporal profiles (on a yearly cycle) of macrophyte biomass, POC and DOC concentrations (Fig. ESI 2a†) and water temperature (Fig. ESI 2b†) was derived from the literature.52–54 More specifically, POC values were obtained from the monthly averages of suspended solid concentrations measured in a Portuguese eutrophic pond52 and considering an OC fraction of 0.05, while DOC was derived assuming a POC/DOC constant ratio of 0.21 (average of the ratios reported in ref. 54); water temperature was also taken from ref. 52 (Portuguese eutrophic pond), while the values for macrophyte biomass density were taken from ref. 53. Since monthly averages were only available for such parameters, the hourly resolved input required for the ChimERA fate model was derived by linear interpolation. Two-year simulations were run for all the PCB congeners also selected for the terrestrial case study (see 2.2 and 2.3.1), assuming for all chemicals, for comparative purposes, a constant chemical discharge to water rate of 1 × 10⁻¹⁰ mol h−1. The same set of simulations was also run neglecting the presence of macrophytes, to isolate and quantify their effect on exposure with respect to POC and DOC. The aim of such a modelling exercise was to investigate (1) the amplitude of the seasonal variability in bioavailable concentrations, related to the presence and abundance of organic phases and to chemical properties, (2) the influence of primary producer biomass on the fate of simulated chemicals, and (3) the role of POC and DOC in affecting bioavailability.
3. Results and discussion
3.1 Terrestrial scenario
3.1.1 PCB source strength and air concentrations.
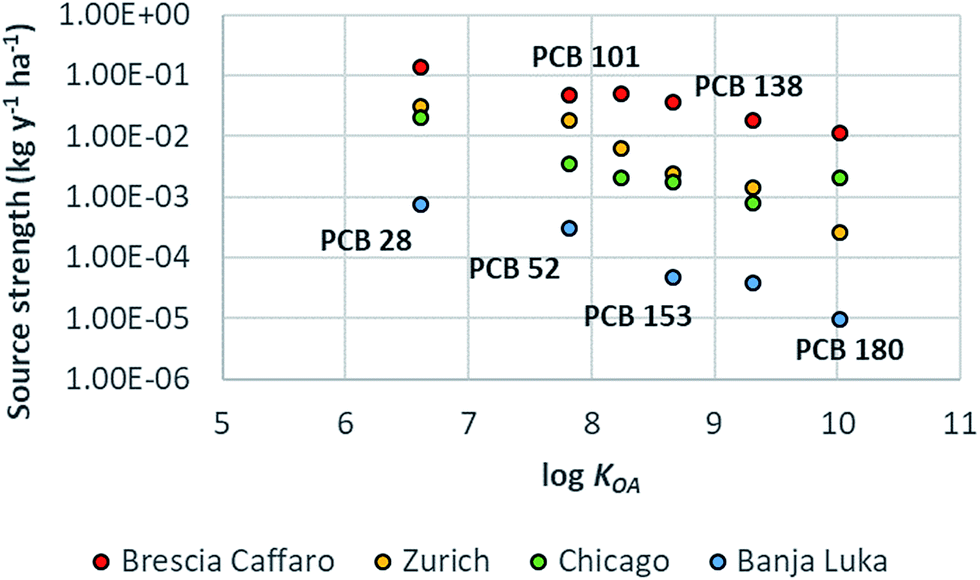
PCBs reached the steady-state after 10 to 38 years according to the congener. The estimated source strengths ranged from 0.01 kg per year per ha to 0.14 kg per year per ha. The highest emission was for PCB 28; emissions for PCB 52, 101 and 153 were very similar and lower by a factor of ∼3 with respect to PCB 28, while emissions for PCB 138 and PCB 180 were even lower (by a factor of ∼7 and ∼12, respectively). The emission source strength for the modelled congeners was not linearly correlated with the degree of congener chlorination, but it was the result of both their concentration in the soil compartment and their tendency to volatilize (Henry's Law constant, HLC) in response to an air temperature change as shown in Fig. ESI 3.† For example, (1) although PCB 28 and PCB 52 showed comparable predicted concentrations in soil, the emission strength for the more volatile congener (PCB 28) was higher (PCB 28 HLC is higher by a factor of ∼7 than that of PCB 52); (2) although the concentrations of the less volatile congener (PCB 180) in soil were the highest, its emission source strength was the lowest (PCB 180 HLC is lower by a factor of ∼45 than that of PCB 28). The overall predicted soil concentrations (∑PCBs = 59 mg kg−1 d.w.) that justified the measured air concentrations were in line with the soil concentrations measured around the factory (average ∑PCBs 67 mg kg−1 d.w., median 1.6 mg kg−1 d.w., and range 0.3–1319 mg kg−1 d.w.; data based on 18 congeners51); the fingerprint of the predicted concentrations was characterized by a higher contribution of more chlorinated congeners, as confirmed by measured data,47 indicating a contamination by highly chlorinated PCB mixtures and/or weathering processes. Although the SIN soil is characterized by high concentrations of PCB 209, the source strength estimation for this congener was not possible because of the lack of measured air concentrations.44 The estimated source strengths (kg per year per ha) were compared with those calculated for the same congeners at other urban locations such as Zurich, Chicago and Banja Luka in ref. 48, employing an approach that combines multimedia mass balance modelling and measured data (Fig. 3). Modelled emissions of PCBs in Brescia were on average about one order of magnitude higher than those in Zurich (factor of 3–45) and Chicago (factor of 6–26), while differed by more than two orders of magnitude (factor of 160–1186) from those of Banja Luka. This discrepancy increased with chemical hydrophobicity (more specifically, with logKOA) (Table ESI 1†), except for PCB 180 in Chicago city because, as explained in ref. 48, that sampling campaign was performed in 1994 in an industrial area characterized by the emission of highly chlorinated congeners from combustion processes. In urban areas, there are ongoing primary and secondary emission sources of PCBs (e.g. joint sealants, paints, incinerators, etc.) that may contribute to increase PCB air concentrations with respect to background locations.19,55–57 The city of Brescia is additionally characterized by the presence of a contaminated site which represents an important additional pool of PCBs available for the volatilization to air. This justifies the extremely high emission source strengths estimated for Brescia, which even exceeded those estimated for Chicago in 1994, when combustion emissions were higher.
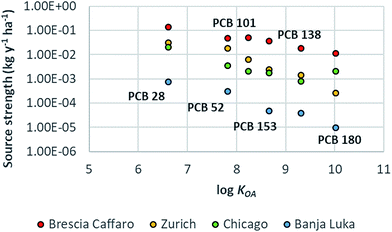 |
| | Fig. 3 Plot of logKOA and emission source strength (kg per year per ha) for PCB congeners 28, 52, 101, 138, 153, and 180 estimated for the Brescia Caffaro case study investigated in this work and other urban locations.48 PCB 101 is not shown for Banka Luka due to its low estimated emission rate. | |
3.1.2 Diel variations of PCB air concentrations.
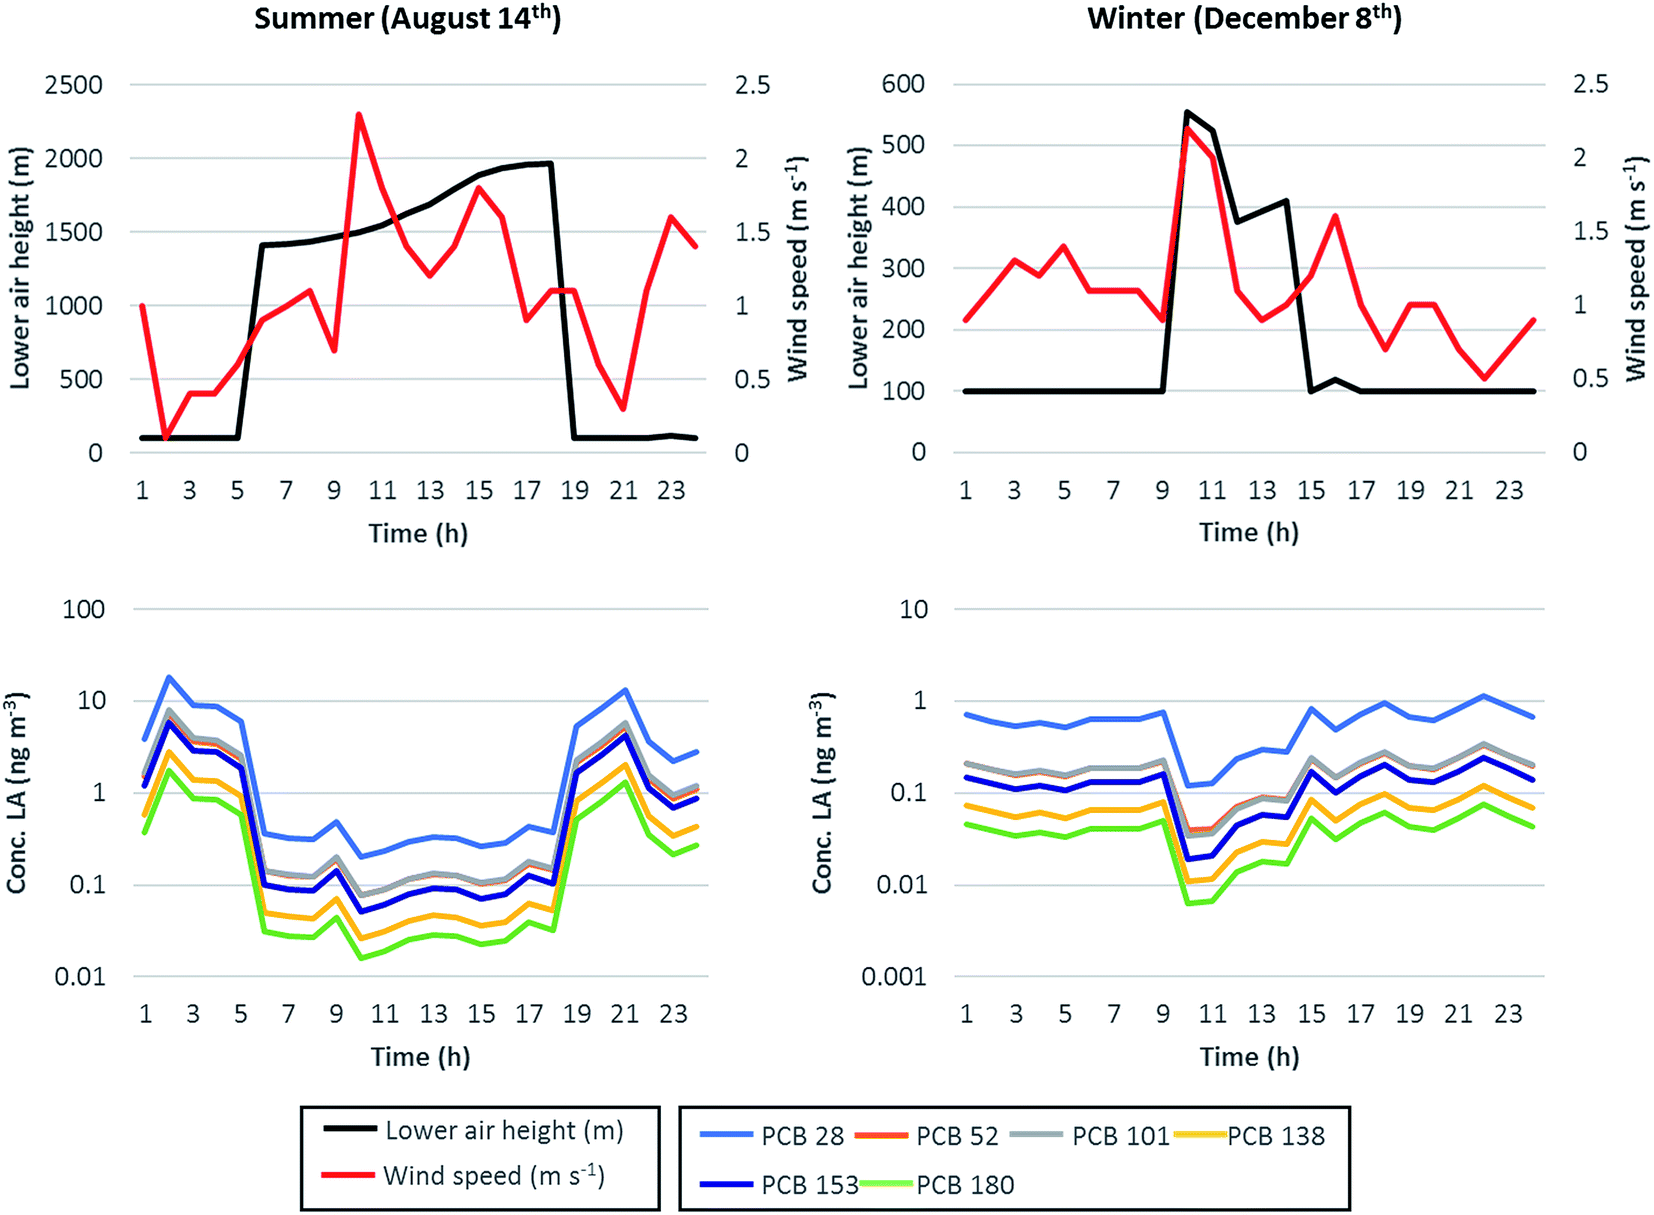
Short-term variations in contaminant air concentrations generally result from the combination of the PBL diel cycle and variability in the wind speed (determining the residence time of air over a given spatial domain), OH-radical abundance (influencing degradation), temperature, and strength of primary and secondary sources.19–21,58,59 To show the influence of some of these variables on the air concentrations of the modelled PCB congeners, two days (August 14th and December 8th) were isolated from the simulation period since considered as representative of the typical PBL height diel cycle in summer and winter, respectively.30 Such days were identified as typical of summer and winter conditions on the grounds of (1) the maximum PBL height reached during the day (summer average 2039 m, winter average 487 m) and (2) the duration of the night-time boundary layer. The PBL height depends on the strength of both convective mixing of air masses generated by the solar heating of the Earth surface and by the mechanical mixing due to the interaction between wind and surface roughness.60,61 In sunny days and when mechanical mixing is not dominant (i.e., low wind speed conditions), PBL exhibits a typical diel cycle characterized by low nocturnal levels and elevated daytime heights; such a cycle becomes more pronounced in summer, when the increased daytime solar heating enhances the convective mixing of air masses and can raise the PBL height up to 2000 m or more. This behaviour is well depicted in Fig. 4 (upper charts), where the PBL (i.e., lower air compartment) height (m) for the two selected days, together with the hourly records of the wind speed (m s−1), was reported; PBL height diel variation was up to a factor of 20 in summer and up to a factor of 5.5 in winter. Chemical sources to air were a dominant temperature-driven volatilization flux from the highly polluted soil and a less relevant constant, congener-specific, inflow advective concentration, accessing the model domain with inflow air (see 2.3.1). Volatilization fluxes during the two selected days, plotted against air temperature in Fig. ESI 4,† showed similar profiles for all chemicals, with maximum volatilization during daytime and a max/min volatilization ratio of 2 in summer and around 1.7 in winter; during both days, the increased daytime volatilization flux was compensated by the increased PBL levels during the light hours, which determined much higher air volumes available for chemical dilution and, therefore, lower chemical concentrations; in contrast, night-time concentrations were higher for all congeners despite the reduced volatilization fluxes (lower charts in Fig. 4). During both days and for all the simulated chemicals, maximum concentrations were observed when the PBL height and wind speed were minimum (i.e., 100 m and 0.1 m s−1 at 2 a.m. on August 14th; 100 m and 0.5 m s−1 at 11 p.m. on December 8th); in contrast, minimum concentrations occurred when high PBL levels combined with higher wind speeds (i.e., 1501 m and 2.3 m s−1 at 10 a.m. on August 14th; 555 m and 2.2 m s−1 at 10 p.m. on December 8th). On August 14th, the maximum diel variation (max/min concentration ratio) ranged from a factor of 90 for PCB 28 to a factor of 130 for PCB 180, while on December 8th diel variation was less pronounced (mainly due to the lower oscillation in the PBL height) and the max/min concentration ratio ranged from 10 for PCB 28 to 19 for PCB 180. On the summer day, the amplitude of diel variation was positively related to chemical logKOW (R2 = 0.86, p = 0.0076, and n = 6 for August 14th) and logKOA (R2 = 0.73, p = 0.031, and n = 6), while such relationships were less evident or not consistent in winter (R2 = 0.63, p = 0.061, and n = 6 for logKOW and R2 = 0.46, p = 0.14, and n = 6 for logKOA), probably due to the higher influence of the wind speed (with respect to the combination between the PBL cycle and temperature-driven volatilization) on determining chemical concentrations. The short-term variability presented in this work was in line with that predicted for two polycyclic aromatic hydrocarbons (phenanthrene and dibenz(a,h)anthracene) at a semi-urban site near Milan, Northern Italy30 and for phenanthrene in Zurich,21 but was higher by one order of magnitude with respect to the diel variability observed in PCB, PBDE and PAH concentrations reported in other studies, which was up to a factor of 10.19,20,62,63 However, it must be remarked that (1) the diel variations computed in this work derive from hourly predictions and represent the maximum amplitude of diel variability (i.e., maximum/minimum concentration ratios calculated for each simulation day), while diel variations reported in the literature derive from sampling campaigns carried out with a maximum temporal resolution of 3–4 hours, i.e., they represent temporal averages, and (2) the high diel variations computed in this work may also be scenario-specific, since a very low background concentration, with respect to the volatilization flux from soil, was input (Tables ESI 2 and 4†). To enhance the comparison with the literature, average night-time to average day-time concentration ratios for each day of the simulation period were also calculated (Fig. ESI 5†), and the results suggested that night-time concentrations were on average higher than day-time ones by a factor of ∼2. This was generally in line, for example, with the same ratios reported for the city of Zurich in ref. 48.
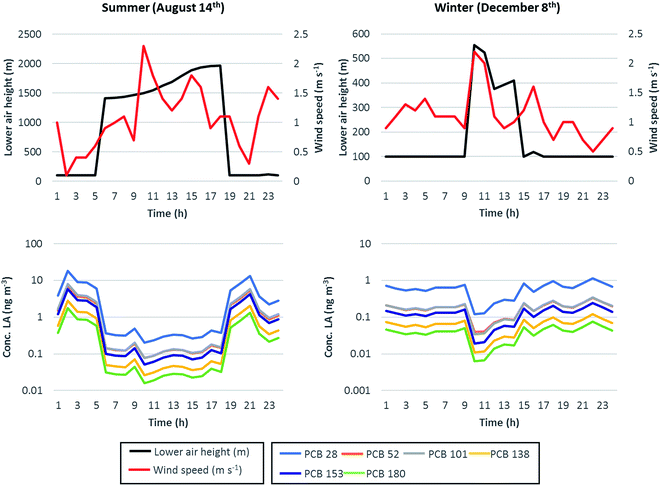 |
| | Fig. 4 Relationship between the lower air height (m, primary y-axis) and wind speed (m s−1, secondary y-axis) (upper charts), and bulk air concentrations for the simulated PCB congeners (lower charts, y-axis in the log-scale). Left charts refer to the typical summer day selected from the simulation period (August 14th, 2007), while the right charts refer to the typical winter day (December 8th, 2007). | |
3.1.3 Role of vegetation in influencing exposure.
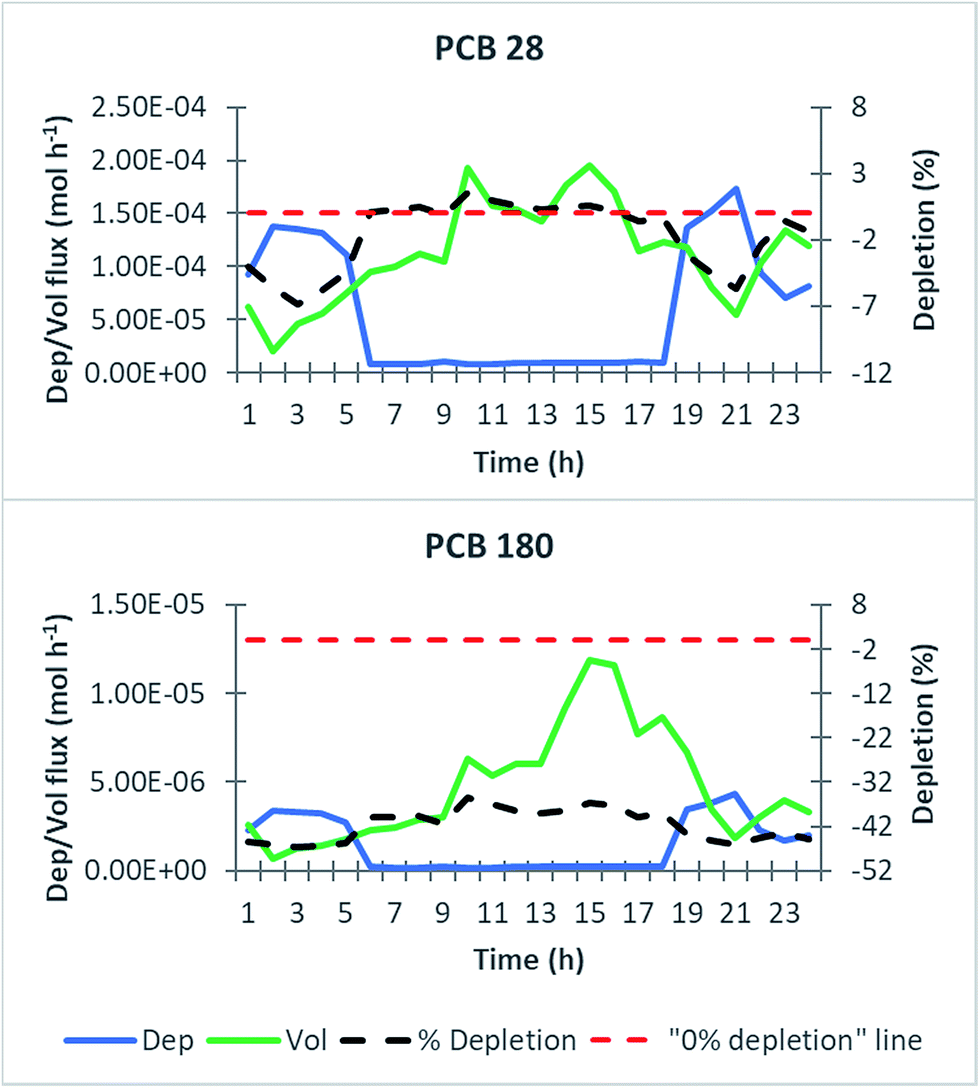
The simulated forested area had an important role in mitigating air concentrations, showing a maximum depletion of 31–56% according to the simulated congener. The impact of vegetation on the concentrations (ng m−3) of all chemicals and on the whole-year scale is depicted in Fig. ESI 6.† For example, on 24th June air concentrations were reduced from 16.62 to 11.42 ng m−3 and from 1.48 to 0.66 ng m−3 for PCB 28 and PCB 180, respectively. These results are in line with ref. 64 (35–54%) for a mixed deciduous forest. In the adopted scenario, the wind speed was not reduced to account for the presence of vegetation, and therefore the influence of the simulated woods on air concentrations could be underestimated. Air concentration reductions were strongly positively correlated with congener logKOA (R2 = 0.95, p = 0.00082, and n = 6); this is in line with the well-known Forest Filter Effect (FFE) or Depletion Factor (DF) theories,64,65i.e., the ability of plant leaves in removing organic chemical from air increases with logKOA and is more pronounced for compounds with 7 < logKOA < 11; at higher logKOA values, a competition with air particulate matter can be established reducing leaf efficiency in reducing air concentrations. The logKOA of the simulated chemicals ranged between 6.6 and 9.4 and particulate matter air concentration was not high enough to hinder contaminant accumulation by leaves even for more hydrophobic congeners (e.g., the capacity (ZV) of leaves for PCB 180 was ∼4 orders of magnitude higher with respect to the capacity of particulate matter). Air concentration reduction was observed during ∼47% to ∼96% of the overall hours of the growing seasons (6384) depending on the congeners, while the remaining hours were characterized by an increase in air concentrations due to release from leaves. This depends on the “dual behaviour” of leaves, which can not only take up but also release organic contaminants in response to meteorological parameters (temperature, PBL height, and wind speed) and chemical emission changes,24 efficiently “dispensing” contaminants to air. Fig. ESI 7† shows the distribution of the hours of the growing season according to the removal/releasing attitude of leaves. To show the influence of meteorological parameters, the air compartment structure and chemical emission on deposition/volatilization fluxes to/from leaves of PCB 28 and PCB 180 for one day, August 14th as already investigated in 3.1.2 was chosen. As appears from Fig. 5, during both some daytime and night-time hours of the day, volatilization flux exceeded deposition flux. These hours were characterized by (1) higher temperatures (e.g. 9:00–19:00) which favoured volatilization, (2) a higher PBL level (e.g. 9:00–19:00) and (3) lower emission from soil to air (e.g. 22:00–24:00), which caused chemical gradient inversion. While for PCB 28 higher volatilization flux from leaves reflected in an increase in air concentrations (“positive” depletion factor), for PCB 180 volatilization was not high enough to increase air concentrations (“negative” depletion factor).
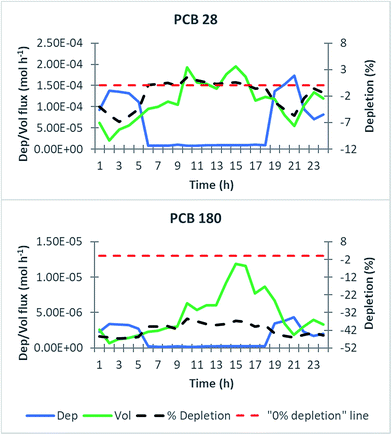 |
| | Fig. 5 Relationship between deposition/volatilization fluxes to/from leaves (mol h−1, left y-axis) and depletion of air concentrations (%, right y-axis) for two selected PCBs (congeners 28 and 180) on August 14th, 2007. The red, dashed line represents the point which separates depletion from non-depletion: in other terms, when such a level is exceeded by the black dashed line, an increase in air concentrations occurs, otherwise depletion occurs. For PBL height and wind speed trends during the selected day see Fig. 4, while for the temperature trend refer to Fig. ESI 4.† | |
As discussed in 3.1.2, the diel variation in air concentrations (calculated as max/min concentration ratios) for the modelled PCB congeners can exceed two orders of magnitude. The average diel variation of air concentrations predicted neglecting the vegetation was slightly positively related to chemical logKOW (R2 = 0.77, p = 0.020, and n = 6) and logKOA (R2 = 0.62, p = 0.064, and n = 6), while such relationships were never evident for the forested system simulations (R2 = 0.40, p = 0.18, and n = 6 for logKOW and R2 = 0.23, p = 0.33, and n = 6 for logKOA). However, a strong relationship between the depletion of average diel variation of air concentrations and logKOA was observed (R2 = 0.89, p = 0.0044, and n = 6); this relationship was weaker with logKOW (R2 = 0.81 p = 0.015, and n = 6). The variability of air concentrations was reduced by up to 15% by the presence of vegetation confirming the “buffer” role of plant leaves which can behave not only as “filters” of air contaminants but also as “dispensers” when volatilization exceeds deposition flux in some periods of the day.24 The diurnal variability of less chlorinated and more volatile congeners was less influenced by the presence of vegetation due to their faster air–leaf and leaf–air exchange.
3.2 Aquatic scenario
3.2.1 Seasonality in bioavailable concentrations.
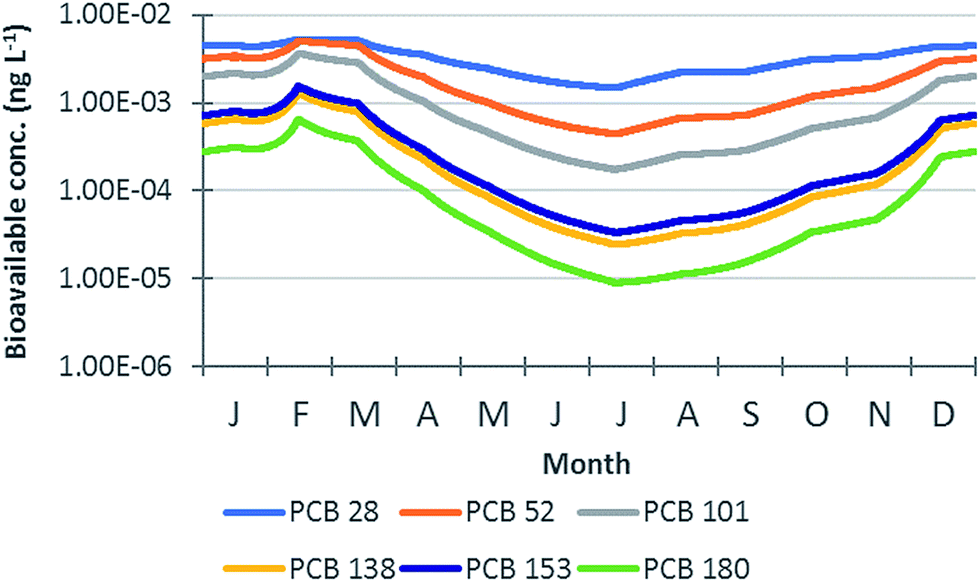
In Fig. 6, the bioavailable concentrations predicted on an hourly basis for the investigated PCB congeners by the ChimERA fate model (2nd simulation year) are reported (with the y-axis in the log-scale). The highest bioavailable concentrations of all chemicals were predicted between February and March, when POC and DOC concentrations reached their minimum values and macrophyte biomass was also low (Fig. ESI 2a†). In contrast, minimum bioavailable concentrations were observed in July, when DOC concentration reached its highest level and macrophyte biomass and POC were also abundant (Fig. ESI 2a†). The link between the predicted seasonality in bioavailable concentrations and primary producer and POC/DOC cycles suggested a key role of such organic phases in driving the fate of chemicals in the simulated system. Such a role was quantified for each modelled PCB by investigating chemical fluxes during the simulation period. More specifically, the relative importance (%) of the different loss processes (i.e., degradation, volatilization, outflow with water, particles and DOM, particle deposition onto macrophyte and sediment surfaces, uptake by macrophytes, and diffusion from water to sediment) with respect to the overall losses from the water compartment was calculated on an hourly basis; afterwards, yearly averages and standard deviations were calculated. The results, reported in Fig. ESI 8,† indicated that, for all chemicals, particle-mediated deposition onto macrophyte and sediment surfaces was the most efficient removal path (on average, from 46% for PCB 28 to 66% for PCB 180 for deposition on macrophytes, and from 16% for PCB 28 to 33% for PCB 180 for deposition on sediment). Moreover, for the less hydrophobic congeners (PCB 28, 52, and 101), volatilization and take up by macrophytes were also relevant, especially when POC concentrations were not particularly high (e.g., in February; Fig. ESI 2†). These observations were fully in line with those made in previous studies28,29 and further highlighted the dominant role of particle-mediated deposition in driving the fate of hydrophobic chemicals (and, more specifically, with logKOW > 5.5) in shallow water bodies.26,66 This process can be of great importance in vegetated aquatic environments, given the enhanced deposition and retention of particulate matter.67,68 The amplitude of the exposure seasonal variation (i.e., ratio between the maximum and minimum bioavailable concentrations predicted during the 2nd year of simulation) ranged from 3.6 for PCB 28 to 73 for PCB 180 and increased linearly with chemical logKOW (R2 = 0.97, p = 0.00095, and n = 6), because of the higher tendency of more hydrophobic chemicals to be taken up by primary producers or to partition onto POC/DOC.
 |
| | Fig. 6 Bioavailable concentration (ng L−1) temporal profiles predicted for the investigated PCB congeners by the ChimERA fate model during the 2nd year of simulation. The y-axis is in the log-scale. | |
3.2.2 Role of macrophytes in influencing exposure variability.
The comparison between the simulation results obtained neglecting macrophytes and those presented in 3.2.1 allowed assessing the depletion potential of such an environmental compartment for the bioavailable concentrations of the simulated PCB congeners. For all chemicals and during the whole simulation period, the presence of macrophytes resulted in the depletion of water concentrations (Fig. ESI 9†): average depletion was 27% for PCB 28 (range 3–59%) and increased linearly with logKOW (R2 = 0.89, p = 0.0049, and n = 6) up to 77% for PCB 180 (range 28–97%). The depleted amount was not constant over the simulation period and was maximum when the macrophyte density was the highest (i.e., June to August; Fig. ESI 2 and 9†). As already pointed out in 3.2.1, the most important process driving chemical removal from water was particle-mediated deposition onto macrophyte leaves, since macrophytes significantly increased the surface available for suspended solid sedimentation (average LAI ∼ 5) with respect to the non-vegetated domain. The same, crucial role of macrophyte leaves as collectors for particle-bound chemicals was highlighted not only by modelling exercises (e.g.ref. 26, 28 and 66), but also, for example, in mesocosm experiments such as those described in ref. 69, where the highly hydrophobic pyrethroid lambda-cyhalothrin was applied to ditch enclosures characterized by different vegetation densities.
3.2.3 Influence of POC/DOC on bioavailability.
The temporal profiles of the bulk water concentrations (ng L−1) predicted for the modelled PCB congeners during the 2nd simulation year are reported in Fig. ESI 10.† Seasonality in bulk concentrations was less pronounced with respect to that of bioavailable concentrations (Fig. 5): variability was by a factor of 2 for PCB 28 and increased linearly with logKOW (R2 = 0.9915, p = 3 × 10⁻⁵, n = 6) up to a factor of 9 for PCB 180. This reduction in seasonal variability is observed since bulk concentrations include the chemical fractions bound to suspended particles and DOM: more specifically, during summer, when bioavailable concentrations are minimum due to deposition onto macrophyte leaves/sediment, macrophyte uptake, and partitioning to the abundant POC and DOC, bulk concentrations are higher than bioavailable concentrations since they include the POC/DOC-bound chemical fractions. The ratio between bulk and dissolved concentrations ranged from a factor of 3 for PCB 28 to a factor of 63 for PCB 180, while the distribution of the different modelled chemicals between the three phases composing the water compartment in ChimERA fate (water dissolved, suspended particles and DOM) is reported in Fig. ESI 11.† Common practices of water sample analysis generally include a filtration step, in which suspended solids are removed (via 0.7 or 0.45 μm porosity filters) and analysed separately, to derive particle-phase chemical concentrations. The remaining fraction of water is generally analysed via solid-phase extraction techniques, and results are often referred to as exposure concentrations. However, such measurements may include a portion of the chemical bound to DOM,70 unless partitioning-based extraction techniques with specific phases or devices are used to explicitly measure freely dissolved concentrations (e.g., ref. 71–74). The set of simulations run with ChimERA fate allowed quantifying the potential gap between bioavailable (i.e., freely dissolved) concentrations and those including the DOM-bound fraction (here referred to as “water” concentrations), typically obtained from environmental analysis. The ratio calculated between “water” concentrations and bioavailable concentrations for the six modelled PCB congeners during the 2nd year of simulation (Fig. ESI 12†) indicated that traditional measurements can overestimate exposure by up to a factor of 1.6 for PCB 28, 2.8 for PCB 52, 4.6 for PCB 101, 15 for PCB 138, 12 for PCB 153, and 34 for PCB 180. These results suggest a strong need for (1) accurate measurements of exposure concentrations in the presence of dissolved organic substances, by means of appropriate extraction techniques, (2) measurements of, at least, DOM/DOC concentrations in water, which could allow extrapolation to freely dissolved concentrations, and (3) the inclusion of a dynamic DOM compartment/sub-compartment in environmental fate models for exposure assessment. Such topics were also recently shown as being among the most important challenges for exposure assessment.12,13
4. Conclusions
The simulations run with SoilPlusVeg for the Brescia Caffaro case study highlighted the potential role of such a model in assessing (1) the emission source strength of selected chemicals from contaminated sites (in the presence of measurements of air concentrations) and emission variations with time (e.g., over a seasonal cycle), (2) the occurrence and amplitude of short-term variability in air concentrations, and (3) the role of foliar biomass in taking up/releasing chemicals from/to air and reducing the amplitude of diel variability. Maximum diel variation ranging from a factor of 90 to 130 (depending on the congener) was predicted in summer, while lower diel changes in the PBL height led to less pronounced diel variations in winter. The amplitude of the diel variations was reduced by the presence of vegetation by up to 15% due to the dual behaviour of plant leaves acting not only as “filters” but also as “dispensers” of organic contaminants, buffering air concentrations. SoilPlusVeg can thus provide insights into (1) short-term concentration variations that sampling campaigns are generally not able to capture, also due to the long sampling times required to collect detectable amounts (especially for semi-volatile organic chemicals), and (2) short-term exchanges between air and a fully dynamic (in terms of LAI, SLA, density, etc.) vegetation compartment. For these reasons, such a model could be valuable not only for exposure predictions, but also for planning efficient monitoring campaigns and mitigation measures.
The results of the application of the ChimERA fate model to the aquatic scenario stressed the importance of including, in models for exposure predictions in aquatic environments, (1) primary producers, given their crucial role in influencing chemical fate via uptake and enhanced deposition of suspended solids (as also highlighted in previous studies, e.g., ref. 25–29), and (2) temporal dynamics of POC and DOC, which determine bioavailable concentrations in water. Such aspects are generally neglected in multimedia fate models adopted for regulatory purposes.5,9 The highest and lowest bioavailable concentrations for all simulated PCBs were predicted when POC/DOC concentrations and macrophyte biomass were at their minimum (February–March) and maximum (July) levels, respectively. During the simulation period macrophytes reduced water concentrations by 27% to 77% (average depletion), with the highest values (97%) reached for PCB 180 when macrophyte biomass was the highest (i.e., June to August). The ratio between bulk and bioavailable water concentrations ranged from a factor of 3 to 63, indicating that traditional measurements can overestimate bioavailable water concentrations by up to a factor of 34. The ChimERA fate model application presented here also suggested its potential role in identifying critical exposure moments (e.g., a peak discharge under low POC/DOC abundance conditions, potentially causing very high exposure levels) and in planning informative and efficient monitoring activities. The modelling approaches and case studies presented in this work thus represent an example of how more dynamics and realism in exposure models and scenarios can provide important information on human and ecosystem exposure to pollutants in air and water. The increased complexity of SoilPlusVeg and ChimERA fate with respect to models currently used for regulatory purposes, for example, implies a higher amount of input data required: for example, temporal patterns of terrestrial/aquatic biomass with the highest possible resolution would be desirable; such data are often lacking since they are expensive and/or difficult to obtain. To overcome this issue, dynamic scenarios of phytoplankton, autochthonous detritus and dissolved organic matter, varying spatially and temporally, were developed and can be used in models.29 Several aspects of the models presented in this work underwent evaluation efforts to assess their predictive ability for different chemicals and case studies; moreover, sensitivity analyses were run to identify the key factors in driving concentrations in the different compartments.21,24,29 More thorough model evaluation and sensitivity and uncertainty analyses will be the subject of future work, as well as the full coupling of the ChimERA fate model with the terrestrial model to assess the potential for phytodepuration of surface waters surrounding a contaminated site, such as the Brescia Caffaro SIN.
Conflicts of interest
There are no conflicts to declare.
Acknowledgements
The authors would like to acknowledge the Italian Ente Regionale per i Servizi all'Agricoltura e alle Foreste (ERSAF) of the Lombardy Region, Italy, Decreto ERSAF n. III/5426 del 09.12.2013 and the Department of Science and High Technology of the University of Insubria for funding part of the salary of Elisa Terzaghi.
References
-
The multi-media fate model: a vital tool for predicting the fate of chemicals, ed. C. E. Cowan, D. Mackay, T. C. J. Feijtel, D. van de Meent, A. Di Guardo, J. Davies and N. Mackay, SETAC Press, Pensacola, Fla, 1995 Search PubMed.
- D. Mackay, A. Di Guardo, S. Paterson and C. E. Cowan, Evaluating the environmental fate of a variety of types of chemicals using the EQC model, Environ. Toxicol. Chem., 1996, 15, 1627–1637 CrossRef.
- D. Mackay, A. Di Guardo, S. Paterson, G. Kicsi, C. E. Cowan and D. M. Kane, Assessment of chemical fate in the environment using evaluative, regional and local-scale models: Illustrative application to chlorobenzene and linear alkylbenzene sulfonates, Environ. Toxicol. Chem., 1996, 15, 1638–1648 CrossRef CAS.
- D. A. Priemer and M. L. Diamond, Application of the multimedia urban model to compare the fate of SOCs in an urban and forested watershed, Environ. Sci. Technol., 2002, 36, 1004–1013 CrossRef CAS PubMed.
-
EC, European Union System for the Evaluation of Substances 2.0 (EUSES 2.0), National Institute of Public Health and the Environment (RIVM), Bilthoven (the Netherlands), Background report No.: 601900005/2004, 2004, http://www.pbl.nl/sites/default/files/cms/publicaties/601900005.pdf Search PubMed.
- A. Hollander, M. Schoorl and D. van de Meent, SimpleBox 4.0: Improving the model while keeping it simple, Chemosphere, 2016, 148, 99–107 CrossRef CAS PubMed.
- J. Kim, D. Mackay and D. E. Powell, Roles of steady-state and dynamic models for regulation of hydrophobic chemicals in aquatic systems: A case study of decamethylcyclopentasiloxane (D5) and PCB-180 in three diverse ecosystems, Chemosphere, 2017, 175, 253–268 CrossRef CAS PubMed.
- D. Ghirardello, M. Morselli, M. Semplice and A. Di Guardo, A dynamic model of the fate of organic chemicals in a multilayered air/soil system: Development and illustrative application, Environ. Sci. Technol., 2010, 44, 9010–9017 CrossRef CAS PubMed.
- FOCUS (FOrum for Co-ordination of pesticide fate models and their USe), FOCUS Surface Water Scenarios in the EU Evaluation Process Under 91/414/EEC; Rev. 2. FOCUS Working Group on Surface Water Scenarios (EC Document Reference SANCO/4802/2001), 2001.
-
EPA (U.S. Environmental Protection Agency), Guidelines for Ecological Risk Assessment, U.S. Environmental Protection Agency, Risk Assessment Forum, Washington (DC), 1998, Apr. EPA/630/R-95/002F, http://www.epa.gov/raf/publications/pdfs/ECOTXTBX.PDF Search PubMed.
-
EC (European Commission), Technical Guidance Document on Risk Assessment; Part II, European Chemical Bureau, Joint Research Centre, Ispra (Italy), 2003, EUR 20418 EN/2, http://echa.europa.eu/documents/10162/16960216/tgdpart2_2ed_en.pdf Search PubMed.
-
EC (European Commission), Addressing the new challenges for risk assessment, European Commission and Directorate General for Health & Consumers, Luxembourg, 2013, http://https://publications.europa.eu/en/publication-detail/-/publication/0132ea87-0420-4258-9ebf-ac49c9e4dcb0/language-en Search PubMed.
- A. Di Guardo and J. L. M. Hermens, Challenges for exposure prediction in ecological risk assessment, Integr. Environ. Assess. Manage., 2013, 9, e4–e14 CrossRef PubMed.
-
C. J. van Leeuwen and T. G. Vermeire, Risk assessment of chemicals: an introduction, Springer, Dordrecht, 2nd edn, 2007 Search PubMed.
- J. F. Fairchild, T. W. La Point, J. L. Zajicek, M. K. Nelson, F. J. Dwyer and P. A. Lovely, Population-, community- and ecosystem-level responses of aquatic mesocosms to pulsed doses of a pyrethroid insecticide, Environ. Toxicol. Chem., 1992, 11, 115–129 CrossRef CAS.
- K. H. Reinert, J. M. Giddings and L. Judd, Effects analysis of time-varying or repeated exposures in aquatic ecological risk assessment of agrochemicals, Environ. Toxicol. Chem., 2002, 21, 1977–1992 CrossRef CAS PubMed.
- R. Ashauer, A. Boxall and C. Brown, Predicting effects on aquatic organisms from fluctuating or pulsed exposure to pesticides, Environ. Toxicol. Chem., 2006, 25, 1899–1912 CrossRef CAS PubMed.
-
Linking aquatic exposure and effects: risk assessment of pesticides, ed. T. C. M. Brock, A. Alix, C. D. Brown, E. Capri, B. F. F. Gottesbüren, F. Heimbach, C. M. Lythgo, R. Schulz and M. Streloke, CRC Press, Boca Raton (FL), 2009 Search PubMed.
- B. Gasic, C. Moeckel, M. MacLeod, J. Brunner, M. Scheringer, K. C. Jones and K. Hungerbühler, Measuring and modeling short-term variability of PCBs in air and characterization of urban source strength in Zurich, Switzerland, Environ. Sci. Technol., 2009, 43, 769–776 CrossRef CAS PubMed.
- C. Moeckel, B. Gasic, M. MacLeod, M. Scheringer, K. C. Jones and K. Hungerbühler, Estimation of the source strength of polybrominated diphenyl ethers based on their diel variability in air in Zurich, Switzerland, Environ. Sci. Technol., 2010, 44, 4225–4231 CrossRef CAS PubMed.
- M. Morselli, D. Ghirardello, M. Semplice and A. Di Guardo, Modeling short-term variability of semivolatile organic chemicals in air at a local scale: An integrated modeling approach, Environ. Pollut., 2011, 159, 1406–1412 CrossRef CAS PubMed.
- F. Wania and M. S. McLachlan, Estimating the influence of forests on the overall fate of semivolatile organic compounds using a multimedia fate model, Environ. Sci. Technol., 2001, 35, 582–590 CrossRef CAS PubMed.
- E. Terzaghi, G. Zacchello, M. Scacchi, G. Raspa, K. C. Jones, B. Cerabolini and A. Di Guardo, Towards more ecologically realistic scenarios of plant uptake modelling for chemicals: PAHs in a small forest, Sci. Total Environ., 2015, 505, 329–337 CrossRef CAS PubMed.
- E. Terzaghi, M. Morselli, M. Semplice, B. E. L. Cerabolini, K. C. Jones, M. Freppaz and A. Di Guardo, SoilPlusVeg: An integrated air-plant-litter-soil model to predict organic chemical fate and recycling in forests, Sci. Total Environ., 2017, 595, 169–177 CrossRef CAS PubMed.
- J. Dachs, S. J. Eisenreich, J. E. Baker, F.-C. Ko and J. D. Jeremiason, Coupling of phytoplankton uptake and air–water exchange of persistent organic pollutants, Environ. Sci. Technol., 1999, 33, 3653–3660 CrossRef CAS.
- J. M. Armitage, A. Franco, S. Gomez and I. T. Cousins, Modeling the potential influence of particle deposition on the accumulation of organic contaminants by submerged aquatic vegetation, Environ. Sci. Technol., 2008, 42, 4052–4059 CrossRef CAS PubMed.
- L. Nizzetto, R. Gioia, J. Li, K. Borgå, F. Pomati, R. Bettinetti, J. Dachs and K. C. Jones, Biological pump control of the fate and distribution of hydrophobic organic pollutants in water and plankton, Environ. Sci. Technol., 2012, 46, 3204–3211 CrossRef CAS PubMed.
- M. Morselli, M. Semplice, F. De Laender, P. J. Van den Brink and A. Di Guardo, Importance of environmental and biomass dynamics in predicting chemical exposure in ecological risk assessment, Sci. Total Environ., 2015, 526, 338–345 CrossRef CAS PubMed.
- A. Di Guardo, M. Morselli, G. Morabito, M. Semplice, P. J. Van den Brink and F. De Laender, European environmental scenarios of chemical bioavailability in freshwater systems, Sci. Total Environ., 2017, 580, 1237–1246 CrossRef CAS PubMed.
- M. Morselli, D. Ghirardello, M. Semplice, G. Raspa and A. Di Guardo, Integration of an atmospheric dispersion model with a dynamic multimedia fate model: Development and illustration, Environ. Pollut., 2012, 164, 182–187 CrossRef CAS PubMed.
- Z. Bao, C. M. Haberer, U. Maier, B. Beckingham, R. T. Amos and P. Grathwohl, Modeling short-term concentration fluctuations of semi-volatile pollutants in the soil–plant–atmosphere system, Sci. Total Environ., 2016, 569–570, 159–167 CrossRef CAS PubMed.
- P. S. Diefenbacher, C. Bogdal, A. C. Gerecke, J. Glüge, P. Schmid, M. Scheringer and K. Hungerbühler, Emissions of polychlorinated biphenyls in Switzerland: a combination of long-term measurements and modeling, Environ. Sci. Technol., 2015, 49, 2199–2206 CrossRef CAS PubMed.
- S. A. Csiszar, M. L. Diamond and L. J. Thibodeaux, Modeling urban films using a dynamic multimedia fugacity model, Chemosphere, 2012, 87, 1024–1031 CrossRef CAS PubMed.
- Q. Zhang, J. C. Crittenden, D. Shonnard and J. R. Mihelcic, Development and evaluation of an environmental multimedia fate model CHEMGL for the Great Lakes region, Chemosphere, 2003, 50, 1377–1397 CrossRef CAS PubMed.
- F. Wegmann, M. Scheringer, M. Möller and K. Hungerbühler, Influence of vegetation on the environmental partitioning of DDT in two global multimedia models, Environ. Sci. Technol., 2004, 38, 1505–1512 CrossRef CAS PubMed.
- J. Komprda, K. Kubošová, A. Dvorská, M. Scheringer, J. Klánová and I. Holoubek, Application of an unsteady state environmental distribution model to a decadal time series of PAH concentrations in Central Europe, J. Environ. Monit., 2009, 11, 269–276 RSC.
- M. A. Batiha, A. A. H. Kadhum, A. B. Mohamad, M. S. Takriff, Z. Fisal, W. R. W. Daud and M. M. Batiha, MAM-An aquivalence-based dynamic mass balance model for the fate of non-volatile organic chemicals in the agricultural environment, Am. J. Eng. Appl. Sci., 2008, 1, 252–259 CrossRef.
- E. Undeman, G. Czub and M. S. McLachlan, Addressing temporal variability when modeling bioaccumulation in plants, Environ. Sci. Technol., 2009, 43, 3751–3756 CrossRef CAS PubMed.
- A. Rein, C. N. Legind and S. Trapp, New concepts for dynamic plant uptake models, SAR QSAR Environ. Res., 2011, 22, 191–215 CrossRef CAS PubMed.
- L. Nizzetto and J. A. Perlinger, Climatic, biological, and land cover controls on the exchange of gas-phase semivolatile chemical pollutants between forest canopies and the atmosphere, Environ. Sci. Technol., 2012, 46, 2699–2707 CrossRef CAS PubMed.
- M. Semplice, D. Ghirardello, M. Morselli and A. Di Guardo, Guidance on the selection of efficient computational methods for multimedia fate models, Environ. Sci. Technol., 2012, 46, 1616–1623 CrossRef CAS PubMed.
- P. I. Adriaanse, Exposure assessment of pesticides in field ditches: the TOXSWA model, Pestic. Sci., 1997, 49, 210–212 CrossRef CAS.
-
W. H. J. Beltman, M. M. S. ter Horst, P. I. Adriaanse, A. de Jong and J. Deneer, FOCUS_TOXSWA manual 4.4.2; User's Guide version 4, Statutory Research Tasks Unit for Nature & the Environment (WOT Natuur & Milieu), WOt-technical report 14, 2014, p. 130 Search PubMed.
- A. Colombo, E. Benfenati, S. G. Bugatti, M. Lodi, A. Mariani, L. Musmeci, G. Rotella, V. Senese, G. Ziemacki and R. Fanelli, PCDD/Fs and PCBs in ambient air in a highly industrialized city in Northern Italy, Chemosphere, 2013, 90, 2352–2357 CrossRef CAS PubMed.
- F. Donato, M. Magoni, R. Bergonzi, C. Scarcella, A. Indelicato, S. Carasi and P. Apostoli, Exposure to polychlorinated biphenyls in residents near a chemical factory in Italy: the food chain as main source of contamination, Chemosphere, 2006, 64, 1562–1572 CrossRef CAS PubMed.
- L. Turrio-Baldassarri, V. Abate, S. Alivernini, C. L. Battistelli, S. Carasi, M. Casella, N. Iacovella, A. L. Iamiceli, A. Indelicato, C. Scarcella and C. La Rocca, A study on PCB, PCDD/PCDF industrial contamination in a mixed urban-agricultural area significantly affecting the food chain and the human exposure. Part I: Soil and feed, Chemosphere, 2007, 67, 1822–1830 CrossRef CAS PubMed.
- A. Di Guardo, E. Terzaghi, G. Raspa, S. Borin, F. Mapelli, B. Chouaia, E. Zanardini, C. Morosini, A. Colombo, E. Fattore, E. Davoli, S. Armiraglio, V. M. Sale, S. Anelli and P. Nastasio, Differentiating current and past PCB and PCDD/F sources: The role of a large contaminated soil site in an industrialized city area, Environ. Pollut., 2017, 223, 367–375 CrossRef CAS PubMed.
- B. Gasic, M. MacLeod, J. Klanova, M. Scheringer, P. Ilic, G. Lammel, A. Pajovic, K. Breivik, I. Holoubek and K. Hungerbühler, Quantification of sources of PCBs to the atmosphere in urban areas: A comparison of cities in North America, Western Europe and former Yugoslavia, Environ. Pollut., 2010, 158, 3230–3235 CrossRef CAS PubMed.
-
ARPA, ARPA Lombardia official website, Last access October 1, 2017, http://www.arpalombardia.it/ Search PubMed.
-
EEA, European Environment Agency Report No 2/2007, Air pollution in Europe 1990–2004, ISBN 987-92-9167-964-5, Copenhagen, 2007 Search PubMed.
- ARPA, 2004, Indagine ARPA – Settore Ecologia del Comune di Brescia, di caratterizzazione del suolo del Campo Calvesi, Parco Passo Gavia, Pista Ciclabile di via Milano, Aiuola di via Nullo, anno 2004. ATS Brescia (Agenzia di Tutela della Salute di Brescia) official web site last accessed October, 26 2017, https://www.ats-brescia.it/.
- D. R. de Figueiredo, A. S. S. P. Reboleira, S. C. Antunes, N. Abrantes, U. Azeiteiro, F. Gonçalves and M. J. Pereira, The effect of environmental parameters and cyanobacterial blooms on phytoplankton dynamics of a Portuguese temperate Lake, Hydrobiologia, 2006, 568, 145–157 CrossRef.
- N. J. S. Desmet, S. Van Belleghem, P. Seuntjens, T. J. Bouma, K. Buis and P. Meire, Quantification of the impact of macrophytes on oxygen dynamics and nitrogen retention in a vegetated lowland river, Phys. Chem. Earth, 2011, 36, 479–489 CrossRef.
- K. Parszuto and E. A. Kaliszewska, The evaluation of the trophy of selected Olsztyn lakes by means of indices of particulate organic carbon (POC) and dissolved organic carbon (DOC), Limnol. Rev., 2007, 7, 87–93 Search PubMed.
- A. Motelay-Massei, T. Harner, M. Shoeib, M. Diamond, G. Stern and B. Rosenberg, Using passive air samplers to assess urban–rural trends for persistent organic pollutants and polycyclic aromatic hydrocarbons. 2. Seasonal trends for PAHs, PCBs, and organochlorine pesticides, Environ. Sci. Technol., 2005, 39, 5763–5773 CrossRef CAS PubMed.
- A. Jamshidi, S. Hunter, S. Hazrati and S. Harrad, Concentrations and chiral signatures of polychlorinated biphenyls in outdoor and indoor air and soil in a major U.K. conurbation, Environ. Sci. Technol., 2007, 41, 2153–2158 CrossRef CAS PubMed.
- M. L. Diamond, L. Melymuk, S. A. Csiszar and M. Robson, Estimation of PCB Stocks, emissions, and urban fate: will our policies reduce concentrations and exposure?, Environ. Sci. Technol., 2010, 44, 2777–2783 CrossRef CAS PubMed.
- M. MacLeod, M. Scheringer, H. Podey, K. C. Jones and K. Hungerbühler, The Origin and significance of short-term variability of semivolatile contaminants in air, Environ. Sci. Technol., 2007, 41, 3249–3253 CrossRef CAS PubMed.
- C. Moeckel, M. MacLeod, K. Hungerbühler and K. C. Jones, Measurement and modeling of diel variability of polybrominated diphenyl ethers and chlordanes in air, Environ. Sci. Technol., 2008, 42, 3219–3225 CrossRef CAS PubMed.
-
T. R. Oke, Boundary Layer Climate, Routledge, London, U.K., 2nd edn, 1987 Search PubMed.
-
R. B. Stull, An Introduction to Boundary Layer Meteorology, Kluwer Academic Publishers, Dordrecht, The Netherlands, 1988 Search PubMed.
- Z. Gu, J. Feng, W. Han, L. Li, M. Wu, J. Fu and G. Sheng, Diurnal variations of polycyclic aromatic hydrocarbons associated with PM2.5 in Shanghai, China, J. Environ. Sci., 2010, 22, 389–396 CrossRef CAS.
- Y. Wang, X. Wu, M. Hou, H. Zhao, R. Chen, C. Luo and G. Zhang, Factors influencing the atmospheric concentrations of PCBs at an abandoned e-waste recycling site in South China, Sci. Total Environ., 2017, 578, 34–39 CrossRef CAS PubMed.
- F. M. Jaward, A. Di Guardo, L. Nizzetto, C. Cassani, F. Raffaele, R. Ferretti and K. C. Jones, PCBs and selected organochlorine compounds in Italian mountain air: the influence of altitude and forest ecosystem type, Environ. Sci. Technol., 2005, 39, 3455–3463 CrossRef CAS PubMed.
- M. S. McLachlan and M. Horstmann, Forests as filters of airborne organic pollutants: a model, Environ. Sci. Technol., 1998, 32, 413–420 CrossRef CAS.
- E. Nfon, J. M. Armitage and I. T. Cousins, Development of a dynamic model for estimating the food web transfer of chemicals in small aquatic ecosystems, Sci. Total Environ., 2011, 409, 5416–5422 CrossRef CAS PubMed.
- A. H. Elliot, Settling of fine sediment in a channel with emergent vegetation, J. Hydraul. Eng., 2000, 126, 570–577 CrossRef.
- T. Pluntke and H.-P. Kozerski, Particle trapping on leaves
and on the bottom in simulated submerged plant stands, Hydrobiologia, 2003, 506, 575–581 CrossRef.
- M. Leistra, A. J. Zweers, J. S. Warinton, S. J. Crum, L. H. Hand, W. H. Beltman and S. J. Maund, Fate of the insecticide lambda-cyhalothrin in ditch enclosures differing in vegetation density, Pest Manage. Sci., 2003, 60, 75–84 CrossRef PubMed.
- R. J. Ozretich, L. M. Smith and F. A. Roberts, Reversed-phase separation of estuarine interstitial water fractions and the consequences of C18 retention of organic matter, Environ. Toxicol. Chem., 1995, 14, 1261–1272 CrossRef CAS.
- J. N. Huckins, M. W. Tubergen and G. K. Manuweera, Semipermeable membrane devices containing model lipid: a new approach to monitoring the bioavailability of lipophilic contaminants and estimating their bioconcentration potential, Chemosphere, 1990, 20, 533–552 CrossRef CAS.
- P. Mayer, W. H. J. Vaes, F. Wijnker, K. C. H. M. Legierse, R. H. Kraaij, J. Tolls and J. L. M. Hermens, Sensing dissolved sediment porewater concentrations of persistent and bioaccumulative pollutants using disposable solid-phase microextraction fibers, Environ. Sci. Technol., 2000, 34, 5177–5183 CrossRef CAS.
- M. B. Heringa, D. Pastor, J. Algra, W. H. J. Vaes and J. L. M. Hermens, Negligible depletion solid-phase microextraction with radiolabeled analytes to study free concentrations and protein binding: an example with [3H]estradiol, Anal. Chem., 2002, 74, 5993–5997 CrossRef CAS PubMed.
- T. L. ter Laak, S. O. Agbo, A. Barendregt and J. L. M. Hermens, Freely dissolved concentrations of PAHs in soil pore water: measurements via solid-phase extraction and consequences for soil tests, Environ. Sci. Technol., 2006, 40, 1307–1313 CrossRef CAS PubMed.
Footnote |
| † Electronic supplementary information (ESI) available. See DOI: 10.1039/c7em00530j |
|
| This journal is © The Royal Society of Chemistry 2018 |
Click here to see how this site uses Cookies. View our privacy policy here. 
 ,
Elisa
Terzaghi
,
Elisa
Terzaghi