 Open Access Article
Creative Commons Attribution 3.0 Unported Licence
Synthesis cost dictates the commercial viability of lead sulfide and perovskite quantum dot photovoltaics†
Joel
Jean
 *a,
Justin
Xiao
 a,
Robert
Nick
a,
Nicole
Moody
a,
Robert
Nick
a,
Nicole
Moody
 b,
Michel
Nasilowski
 b,
Moungi
Bawendi
 b and
Vladimir
Bulović
a
aDepartment of Electrical Engineering and Computer Science, Massachusetts Institute of Technology, Cambridge, MA, USA. E-mail: jjean@alum.mit.edu
bDepartment of Chemistry, Massachusetts Institute of Technology, Cambridge, MA, USA
First published on 23rd July 2018
Abstract
Any new solar photovoltaic (PV) technology must reach low production costs to compete with today's market-leading crystalline silicon and commercial thin-film PV technologies. Colloidal quantum dots (QDs) could open up new applications by enabling lightweight and flexible PV modules. However, the cost of synthesizing nanocrystals at the large scale needed for PV module production has not previously been investigated. Based on our experience with commercial QD scale-up, we develop a Monte Carlo model to analyze the cost of synthesizing lead sulfide and metal halide perovskite QDs using 8 different reported synthetic methods. We also analyze the cost of solution-phase ligand exchange for preparing deposition-ready PbS QD inks, as well as the manufacturing cost for roll-to-roll solution-processed PV modules using these materials. We find that present QD synthesis costs are prohibitively high for PV applications, with median costs of 11 to 59 $ per g for PbS QDs (0.15 to 0.84 $ per W for a 20% efficient cell) and 73 $ per g for CsPbI3 QDs (0.74 $ per W). QD ink preparation adds 6.3 $ per g (0.09 $ per W). In total, QD materials contribute up to 55% of the total module cost, making even roll-to-roll-processed QDPV modules significantly more expensive than silicon PV modules. These results suggest that the development of new low-cost synthetic methods is critically important for the commercial relevance of QD photovoltaics. Using our cost model, we identify strategies for reducing synthetic cost and propose a cost target of 5 $ per g to move QD solar cells closer to commercial viability.
Broader contextColloidal quantum dots (QDs) have been widely investigated as an avenue toward ultra-low-cost solar photovoltaics (PV), alongside organics and metal halide perovskites. It is often implicitly assumed—and explicitly stated—that QD-based PV technologies can reach low cost because they employ low-cost, abundant elements and low-temperature, high-throughput manufacturing processes. However, this argument holds true only if QDs can be synthesized at low cost—materials dictate the module cost floor. Here we report the first detailed analysis of the cost of large-scale QD synthesis for PV applications. Our Monte Carlo approach constitutes a complete cost modeling framework for QD photovoltaics, from raw precursors to finished modules. We find that QD synthesis is prohibitively expensive today, highlighting the importance of synthetic cost for the commercial viability of QD solar technologies and guiding further research toward promising synthetic directions. |
Introduction
Colloidal quantum dots (QDs) of lead chalcogenides and metal halide perovskites are promising tunable absorbers for lightweight and flexible solar photovoltaics (PV).1–6 QDs offer bandgap tunability into the infrared as well as room-temperature film deposition compatible with low-cost, flexible plastic substrates. The remarkably low voltage loss observed in perovskite QD devices makes them a promising top-cell candidate for tandem solar cells.3 Record efficiencies for QD solar cells have improved rapidly to 13.4% for visible (Eg = 1.75–2.13 eV) CsPbI3 perovskite nanocrystals3 and to 12% for near-infrared (Eg = 1.3–1.4 eV) PbS nanocrystals.1,7For any emerging PV technology to compete in mainstream PV markets, however, the module cost per watt must be significantly lower than crystalline silicon (c-Si) PV, for which module prices have dropped below 0.40 $ per W.8 Achieving this target will likely require each layer in the device stack to reach negligible costs (<0.05 $ per W), given the high cost of encapsulants and other balance-of-module components.9 Low material costs can be readily achieved with polycrystalline perovskite thin films. For example, a total cost of 0.07 $ per m2 to 1.15 $ per m2 has been calculated for MAPbI3 precursors9,10—equivalent to <0.01 $ per W for aperture-area efficiencies of over 10%. However, reaching such low costs may be difficult for colloidal QDs, which must be synthesized prior to deposition.
Colloidal PbS QDs can be synthesized using a variety of reported methods. These approaches can be classified by synthesis strategy (e.g., hot injection,11,12 heat-up,13 or continuous flow14) and precursor chemistry (e.g., PbO and bis(trimethylsilyl)sulfide (TMS-S),11,14,15 PbO and substituted thioureas,16 lead acetate (PbAc) and TMS-S,17,18 PbCl2 and elemental sulfur,19,20 PbCl2 and TMS-S,13 or PbCl2 and thioacetamide (TAA)21). The most common approach is the PbO and TMS-S hot injection route pioneered by Hines and Scholes,11,12 although many different methods have produced high-efficiency devices.
Perovskite QD synthesis methods are less well-developed than those for PbS. The leading hot injection synthesis for inorganic cesium lead halide (CsPbX3, X = Cl, Br, I) QDs was developed by Protesescu, Kovalenko, and colleagues in 2015.22 The resulting materials showed promising optical performance, with narrow emission linewidths (12–42 nm) and high photoluminescence quantum yields (50–90%). This method was adapted by Luther and colleagues to achieve record QD solar cell efficiencies using CsPbI3 QDs.3,4
QD ink preparation is critical for high-throughput manufacturing of QD solar cells. Existing synthesis methods do not produce material immediately suitable for solar cell fabrication. As-synthesized QDs are typically capped with long insulating ligands to stabilize the colloidal suspension, which must be exchanged for shorter ligands to enable efficient charge extraction. Conventionally, ligand exchange is carried out in the solid state using time-consuming layer-by-layer methods to build up a device-grade film. New solution-based ligand exchange methods produce QD inks that can be deposited in a single step. Efficient PbS QD devices have been demonstrated with solution-phase ligand treatments using lead halides1,2 and 3-mercaptopropionic acid (MPA).23 In contrast, the few perovskite QD solar cells reported to-date still require a layer-by-layer ligand treatment using a lead nitrate (Pb(NO3)2) solution in methyl acetate (MeOAc).3,4
In this work, we analyze the cost of leading PbS and CsPbI3 perovskite QD synthesis and ink preparation methods, guided by direct commercial experience with high-volume QD production. Our Monte Carlo modeling approach allows us to account for the uncertainty in input parameters and robustly determine the QD contribution to future PV module costs, which we compare to the cost of polycrystalline perovskite PV modules. Using our model, we identify the most promising strategies for further cost reductions in colloidal QD synthesis.
Methods
QD production methods
This analysis compares 7 synthesis methods for PbS QDs and 1 for perovskite QDs, each utilizing a distinct synthesis strategy or precursor chemistry, as summarized below:• PbS QDs
– Hot injection synthesis using PbO and TMS-S (Yarema, 2017)15
– Hot injection synthesis using PbAc and TMS-S (Chang, 2013)17
– Hot injection synthesis using PbO and thiourea (Hendricks, 2015)16
– Hot injection synthesis using PbCl2 and sulfur (Moreels, 2011)20
– Continuous flow synthesis using PbO and TMS-S (Pan, 2013)14
– Heat-up synthesis using PbCl2 and TMS-S (Zhang, 2014)13
– Heat-up synthesis using PbCl2 and TAA (Huang, 2017)21
• CsPbI3 QDs
– Hot injection synthesis using Cs2CO3 and PbI2 (Sanehira, 2017)3
We also evaluate the cost of 2 ink preparation methods for PbS QDs, one using PbX2 and ammonium acetate (AA) (Liu, 2016)1 and another using PbI2 only (Aqoma, 2017).2 All procedures used in this analysis are summarized in Table S1 (ESI†).
Monte Carlo cost modeling
In any cost model, many input parameters are inherently uncertain. A Monte Carlo approach incorporates the known uncertainty in parameter values. Instead of a single most-likely value calculated from a conventional spreadsheet model, a Monte Carlo model produces a cost distribution that encompasses both a central value and the associated uncertainty. This distributional information can identify key areas for improvement and inform decisions that depend in part on the risk tolerance of the decision-maker. Monte Carlo models are thus often used in project planning and cost assessment.We developed a Monte Carlo cost model for QD materials production based on the approach of Chang and colleagues for perovskite PV manufacturing.10 We define a process as one production step and a process sequence as one or more linked processes leading to the finished product (i.e., a QD solution or ink).
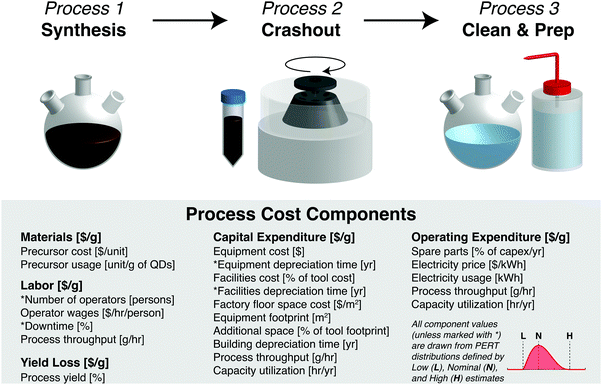
In this work, we analyze two process sequence types—QD synthesis (consisting of synthesis, crashout, and cleaning/preparation steps) and ink preparation (consisting of a single ink formulation step). Each process step incurs costs due to materials, labor, capital expenditure (capex), operating expenditure (opex), and yield loss. These component costs per gram are calculated from the input parameters listed in Fig. 1.
For each Monte Carlo model run, a value for each input parameter is randomly selected from a probability distribution. Here we use the PERT distribution (shown in the inset of Fig. 1), which is often used to model expert estimates because it is intuitively parametrized by minimum (low), most likely (nominal), and maximum (high) guesses. We perform 10![[thin space (1/6-em)]](https://www.rsc.org/images/entities/char_2009.gif) 000 Monte Carlo runs for each process sequence, producing a distribution of 10
000 Monte Carlo runs for each process sequence, producing a distribution of 10![[thin space (1/6-em)]](https://www.rsc.org/images/entities/char_2009.gif) 000 values for each cost component. This output—summarized as 10th, 50th (median), and 90th percentile values—gives a direct measure of the uncertainty in our cost estimates.
000 values for each cost component. This output—summarized as 10th, 50th (median), and 90th percentile values—gives a direct measure of the uncertainty in our cost estimates.
Cost calculations and input parameter choices
In this section, we discuss how each cost component is calculated and how low, nominal, and high values are chosen for key input parameters to model QD synthesis and ink preparation. These choices are informed by protocols and observations from commercial scale-up of QD synthesis at QD Vision, a leading U.S.-based producer of luminescent QDs for display applications from 2004 to 2016. Our model QD factory has an annual production volume ranging from 11.7 kg year−1 to 241 kg year−1—depending on the synthetic protocol—sufficient to support an annual PV module manufacturing capacity of 1.2 MW to 17 MW (see Discussion for calculations). Input parameter spreadsheets are available online as ESI.†Materials
The materials cost M [$ per g] for each process depends on the precursor cost P [$ per unit] and the amount of precursor used per gram of product U [unit per g]: M = U × P.Precursor costs depend on the purity and purchase volume. Our input costs are based on the largest purchase volumes available across leading commercial suppliers including Strem, Sigma Aldrich, EMD Millipore, and Alfa Aesar. Nominal and high cost estimates use the purity level reported in the original protocol, while low estimates use the lowest-cost purity available. We note that there is no straightforward correlation between precursor purity and synthesized material quality—low-purity precursors have been used commercially to produce high-quality QDs—although batch-to-batch consistency is important for process control. When no purity level is reported in the protocol, the lowest-cost purity is used for both the low and nominal estimates. Economies of scale are incorporated by applying a volume pricing discount of 30%, 50%, and 80% for every 10× increase in the purchase volume for the high, nominal, and low precursor costs, respectively. These discount values are estimated from volume pricing data obtained from suppliers for materials used in this analysis (Fig. S1, ESI†). To obtain the fully scaled purchase volume, we assume that 3 months’ worth of precursor materials are purchased at once, corresponding to 274 syntheses for the nominal time per synthesis and capacity utilization values specified below.
To calculate the precursor usage per gram of product, we need both the precursor usage per synthesis and the synthesis yield—or equivalently, the precursor utilization. The precursor usage per synthesis is directly calculated from literature protocols. Reported reaction volumes range from roughly 10 mL to 1 L, with linear scaling of precursor quantities reported over this range. We further scale precursor quantities to a 5 L reaction volume, as discussed below. No uncertainty is included in these estimates—i.e., low, nominal, and high values are the same. The synthesis yield—in grams of product—is based on the reported yield for the low and nominal estimates and the yield assuming 100% utilization of the limiting elemental precursor (sulfur for PbS, cesium for CsPbI3) for the high estimate. For CsPbI3 QDs, the synthesis yield was not reported, so we assume 80%, 90%, and 100% utilization of cesium for the low, nominal, and high estimates.
Crashout protocols are taken from the referenced papers. When crashout details are not specified, we assume a standard protocol used in our labs. Solvent volumes for crashout were calculated assuming a final QD concentration after crashout of 60 mg mL−1—a typical value in our lab. We assume additional hexane equal to 20% of the reactor volume is used for cleaning.
For QD ink preparation, the cost of PbS QDs in octane is assumed to be zero. The total cost of a deposition-ready QD ink starting from raw precursors is then the sum of the synthesis and ink preparation costs. We assume the total volume of octane used in all rinse steps combined is equal to the volume of the PbS QD solution in dimethylformamide (DMF). For the PbX2/AA preparation, we assume a volume ratio of 5![[thin space (1/6-em)]](https://www.rsc.org/images/entities/char_2009.gif) :
:![[thin space (1/6-em)]](https://www.rsc.org/images/entities/char_2009.gif) 2.7 PbS QD solution to toluene used for crashout.1,23
2.7 PbS QD solution to toluene used for crashout.1,23
Labor
The labor cost L [$ per g] depends on the number of operators N [persons], average labor wages W [$ per h per person], and the process throughput τ [g h−1]: . Here we consider labor costs separately from operating expenditures.
All QD synthesis process sequences employ a total of 3 operators—1 each for synthesis, crashout, and cleaning. Ink preparation employs 1 operator. Low, nominal, and high estimates for labor wages are assumed to be 23.1, 46.2, and 69.3 $ per h, respectively. The nominal value is calculated from the weighted average of direct labor rates for 1 senior scientist (46 $ per h) and 2 skilled technicians (27 $ per h) with fringe benefits of 40%, based on wages at a production facility in Massachusetts, U. S. A. No indirect labor costs from general and administrative (G&A) activities are included. Equipment maintenance is assumed to be carried out by the operators, with no additional maintenance labor costs.
The process throughput is the synthesis yield divided by the effective time per synthesis. The low/nominal/high estimates for throughput are determined from the low/nominal/high estimates for yield and the high/nominal/low estimates for synthesis time, respectively. Synthesis yield is defined above. Low, nominal, and high estimates for the effective synthesis time are 2, 4, and 8 hours, respectively. For ink preparation, time estimates are 0.5, 1.5, and 2 hours.
The process throughput—and thus the labor cost per gram of product—depends strongly on the size of the reaction vessel. Here we assume a 5 L reactor volume, a typical volume used at QD Vision for hot-injection synthesis at an annual production volume adequate to supply multiple commercial display and television product lines. Commercial hot-injection reactors are generally no larger than 20 L, due to the dependence of QD polydispersity on the thermal quenching rate. For each synthesis and ink preparation process sequence, the precursor material usage is scaled up linearly from the reported values to a 5 L total solution volume.
Capex
The capital expenditure C [$ per g] is the sum of depreciation costs for the equipment, facilities, and buildings used in a process step. The equipment depreciation cost is the upfront cost [$] divided by the tool-lifetime throughput [g]. The tool-lifetime throughput is the product of the process throughput [g h−1], capacity utilization [h year−1], and depreciation time [year]. Our low, nominal, and high capacity utilization estimates are 20%, 50%, and 80%—equivalent to 1752, 4380, and 7008 h year−1, respectively—to capture a broad range of possible factory operating scenarios, from a single-shift, five-day workweek to a three-shift, seven-day workweek assuming an 80% operating factor. The facility depreciation cost is specified as a fraction of the equipment depreciation cost—10%, 50%, and 100% are used as low, nominal, and high estimates, respectively. The building depreciation cost is the cost of floor space [$] divided by the building-lifetime throughput [g]. The building-lifetime throughput is calculated similarly to the tool-lifetime throughput, except with a longer nominal depreciation time (15 years instead of 7).Opex
The operating expenditure O [$ per g] includes the cost of spare parts and electricity used in a process step divided by the throughput. Spare parts are specified as a fraction of capex. Based on experience at QD Vision, consumables such as centrifuge tubes and pipette tips are not a large fraction of the total cost and thus are not considered individually. We use electricity rates spanning the March 2018 average retail prices for industrial consumption across different U.S. regions—0.05 to 0.13 $ per kW h, with a nominal value equal to the average of 0.07 $ per kW h.24Yield loss
The cost due to yield loss Y [$ per g] is calculated as the effective value of previous process steps lost in the present step. We assume 100% yield for the synthesis, cleaning, and ink preparation steps, noting that incomplete precursor utilization during synthesis is already accounted for in the materials cost calculation. At QD Vision, synthetic yields were nearly quantitative, as is required to avoid re-nucleation and produce high-quality materials. For crashout, we assume low, nominal, and high yields of 80%, 90%, and 95%, based on commercial experience.PV module manufacturing methods
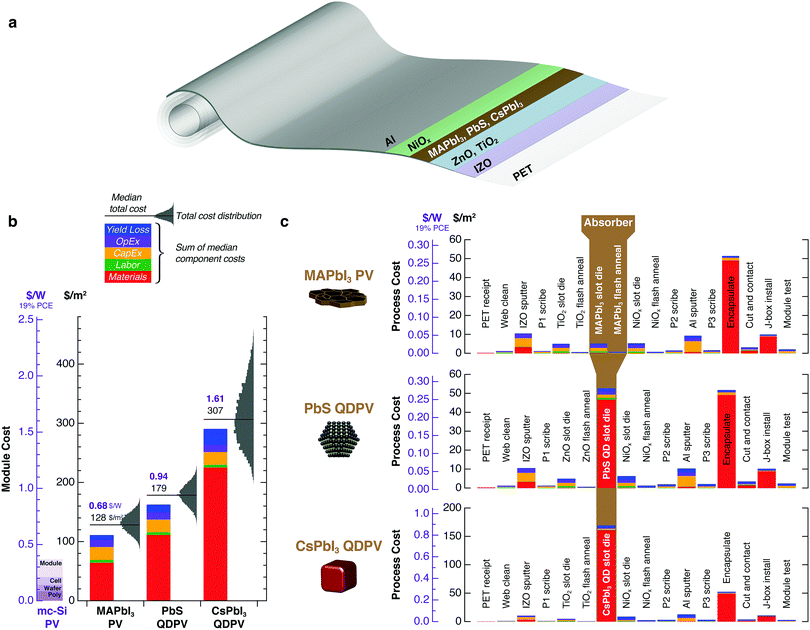
To quantify the impact of QD synthetic costs on the economic viability of QD solar cells, we analyze the cost of manufacturing PV modules based on representative PbS QD, CsPbI3 QD, and polycrystalline methylammonium lead iodide (MAPbI3) perovskite device stacks compatible with roll-to-roll solution processing. Similar process sequences are assumed for all 3 PV technologies to facilitate comparison (Fig. 6c). These sequences are not reported protocols but are representative of low-cost manufacturing sequences envisioned for solution-processed solar cells.9,10,25 Detailed Monte Carlo input parameters are available online as ESI† and described briefly below.Our module cost calculations rely on low, nominal, and high QD material costs (in $ per g) calculated using the methods above. QD materials are assumed to be synthesized in-house, so no mark-up is added. For PbS QDs, the lowest-cost synthesis and ink preparation methods are added together to obtain the cost per milliliter of QD ink, assuming an ink concentration of 150 mg mL−1. Since no ink preparation protocol has been reported for CsPbI3 QDs, the ink preparation cost is assumed to be the same as for PbS QDs.
Volume pricing for all materials is assumed to give a low estimate equal to 10% of the nominal cost, with the high estimate equal to the nominal cost. The materials usage for metal oxide films is calculated from reported sol–gel ink concentrations, assuming 100% utilization of the stoichiometrically limiting element (e.g., Zn for sol–gel ZnO). For MAPbI3 thin films, precursor cost and usage parameters are based on literature values.25
Tool costs and performance parameters are derived from literature reports and manufacturer quotes.9,10,25,26 When uncertainty estimates for tool parameters are not available, low and high values are assumed to be 80% and 120% of the nominal value, respectively. Individual process step yields between 95% and 100% are assumed, corresponding to a nominal full-sequence yield of 83%—a typical yield target for roll-to-roll PV manufacturing companies today.
Results
Modeled costs for all QD synthesis, ink preparation, and PV module manufacturing sequences are presented in Fig. 2 and Tables S2, S4 (ESI†). For direct comparison with reported and modeled PV manufacturing costs, calculated costs are presented in terms of cost per area and per peak watt. All costs are calculated in units of $ per g. To convert from $ per g to $ per m2, we assume a 500 nm thick film consisting of 70% core material—with a density of 7.6 g cm−3 for PbS and 5.36 g cm−3 for CsPbI3—and 30% excess ligands and free space—with an average density of 0.3 g cm−3. To convert $ per m2 to $ per W, we optimistically assume a 20% cell power conversion efficiency (PCE) with a 95% geometric fill factor (achievable with laser scribing), yielding a 19% aperture-area or module PCE.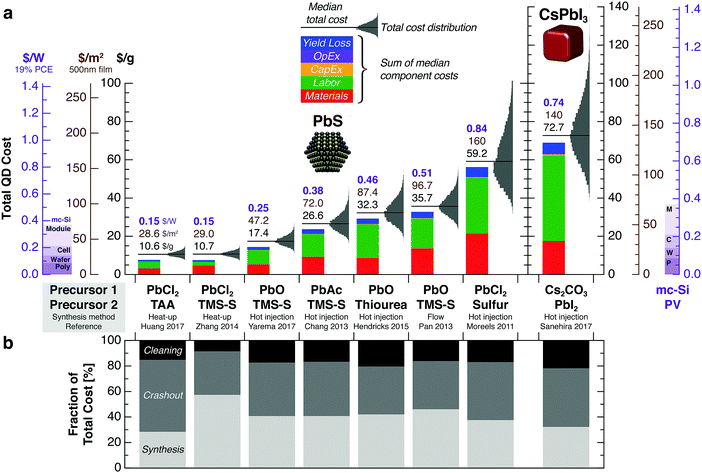 | ||
| Fig. 2 Synthetic costs for PbS and CsPbI3 QDs. Synthesis procedures are denoted by the method and primary precursors. Detailed Monte Carlo model assumptions are discussed in the main text. (a) The total cost is the sum of the component costs for materials, labor, capex, opex, and crashout yield loss. For each procedure, the total cost probability distribution is shown in gray, with median $ per g, $ per m2, and $ per W values labeled above each bar. This median value is larger than the sum of individual median values due to the right skew of many of the component distributions. The low end of each distribution represents the most optimistic assumptions—e.g., low-purity precursors, high throughput, and high yield. The $ per m2 and $ per W axes are different for PbS and CsPbI3 QDs due to the lower density of CsPbI3. For reference, the $ per W price breakdown for a commercial multicrystalline silicon (mc-Si) PV module in 2017—consisting of polysilicon, wafer, cell, and module—is shown at the far left and right.27 (b) Relative cost breakdown by process step. Typically the synthesis cost is dominated by precursors, crashout cost by labor and solvents (e.g., acetone and methyl acetate), and cleaning cost by labor. | ||
Different synthetic methods have vastly different costs per gram of QDs produced (Fig. 2a). For PbS QDs, the median of the total cost distribution ranges from 11 $ per g to 59 $ per g, corresponding to 29 $ per m2 to 160 $ per m2 for a 500 nm film and 0.15 $ per W to 0.84 $ per W for a 20% efficient cell with 19% aperture-area PCE. The lowest cost is achieved with the diffusion-controlled heat-up method employing PbCl2 and TAA precursors,21 with a median cost of 11 $ per g and 10th and 90th percentile values of 9 $ per g and 12 $ per g. Under the most optimistic assumptions—corresponding to the low end of the cost distribution—this method gives a minimum production cost of 7.4 $ per g, 20 $ per m2, or 0.11 $ per W. For CsPbI3 QDs, the median modeled cost is substantially higher—73 $ per g, 140 $ per m2, or 0.74 $ per W. Even using the lowest-cost synthetic method, the cost per watt for PbS QDs is a significant fraction of the production cost per watt of silicon PV modules, and both are far exceeded by the modeled cost for CsPbI3 QDs.
Labor costs dominate for most of the synthesis procedures, although precursor materials also contribute substantially. Hot-injection procedures employ lower precursor concentrations than other methods and thus require more labor per gram of product, since the duration of each synthesis is fixed. Capex and opex are negligible in all cases.
For most of the PbS syntheses, both the synthesis and crashout steps contribute substantially to the total cost (Fig. 2b). The high precursor concentration employed in the heat-up method of Zhang et al.13 reduces the labor cost and crashout solvent usage per gram; as a result, the total cost is dominated by the synthesis step. For CsPbI3, crashout costs dominate due to high labor and antisolvent costs, as discussed below. Cost breakdowns by process step are presented in Table S3 (ESI†).
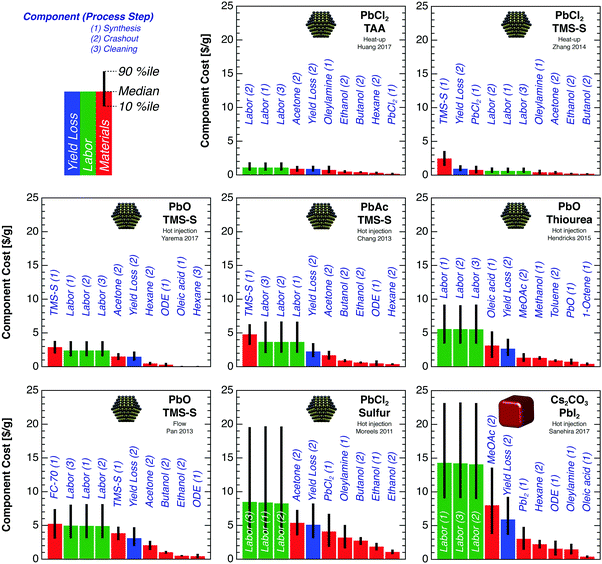
Breaking down the total synthetic cost into granular components helps identify potential avenues for cost reduction. Fig. 3 shows the 10 largest cost components for each PbS and CsPbI3 QD synthesis method. Labor costs dominate the total synthesis cost for most methods. Precursors (e.g., TMS-S, oleylamine, oleic acid, and PbI2) and crashout solvents (e.g., methyl acetate and acetone) also contribute substantially to the total cost.
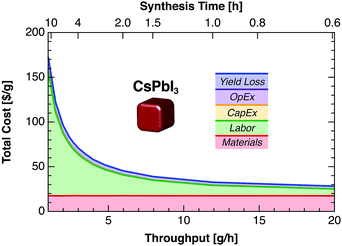
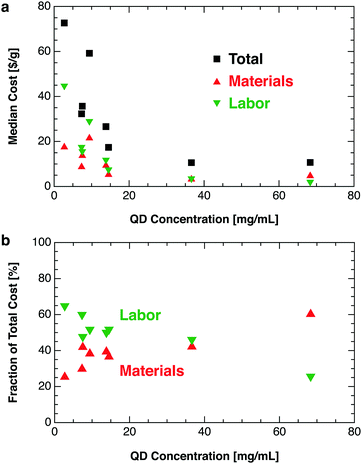
All cost components except raw material and yield loss-related costs can be reduced by reducing the synthesis time and thus increasing throughput (Fig. 4), assuming fixed total material costs, capex, and opex. Our 4 h nominal synthesis time corresponds to a throughput of 3 g h−1 for CsPbI3 QDs, with labor costs accounting for 65% of the total cost. Doubling the throughput to 6 g h−1 (2 h synthesis time) reduces labor costs to 50% of the total.
Modeled costs for two PbS QD ink preparation methods based on solution-phase ligand exchange with lead halides are shown in Fig. 5. These methods yield similar median costs for ligand-exchanged QDs—6.3 $ per g, 17 $ per m2, or 0.09 $ per W for PbI2 only and 8.7 $ per g, 23.6 $ per m2, or 0.12 $ per W for PbI2/PbBr2/AA. Materials costs—primarily from octane, PbI2, and DMF—dominate the cost of ink preparation. These costs can be added to the synthesis costs above to obtain the total production cost for a device-ready QD ink—16.9 $ per g, 45.6 $ per m2, or 0.24 $ per W for the lowest-cost combination.
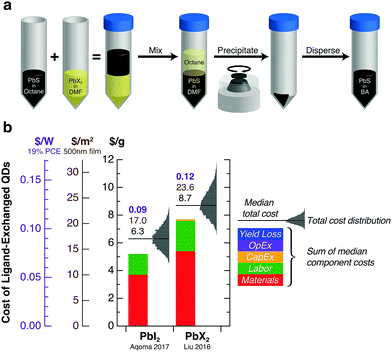 | ||
| Fig. 5 Cost modeling of PbS QD ink preparation. (a) General strategy for solution-phase ligand exchange using lead halide (PbX2) precursors. Oleic-acid-capped PbS QDs are transferred from a nonpolar solvent (octane) to a polar solvent (DMF) upon mixing. The resulting halide-capped QDs are separated by centrifugation and redispersed in an organic solvent (butylamine, BA) to produce a QD ink suitable for single-step film deposition. (b) Modeled costs per gram of ligand-exchanged PbS QDs for two leading ink preparation methods.1,2 Monte Carlo model assumptions are discussed in the main text. Probability distributions for the total cost are shown in gray. The $ per g, $ per m2, and $ per W labels above each bar refer to the median of the total cost distribution. | ||
High QD synthesis and ink preparation costs translate to high module costs. Fig. 6 shows roll-to-roll manufacturing costs for solution-processed PV modules employing PbS QDs, CsPbI3 QDs, and polycrystalline MAPbI3 films. For a representative process sequence based on sputtered electrodes and slot-die-coated absorbers and metal oxide transport layers, we calculate module costs of 128 $ per m2 (0.68 $ per W for a 19% efficient module) for MAPbI3, 179 $ per m2 (0.94 $ per W) for PbS QDs, and 307 $ per m2 (1.61 $ per W) for CsPbI3 QDs. QDPV module costs are dominated by the QD absorber, which contributes 29% of the total cost for PbS QD modules and 55% for CsPbI3 QD modules. In contrast, MAPbI3 precursors contribute only 0.2% of the total perovskite thin-film module cost.
Discussion
Our results suggest that the most promising synthesis strategy for low-cost PbS QDs today is the diffusion-controlled heat-up method—particularly when using thioacetamide as the sulfur precursor as demonstrated by Huang et al.21 This method allows high precursor concentrations to be used, leading to high yields for a given reactor volume and thus lower costs (Fig. 7). Further cost reductions could be achieved by reducing labor needs (43% of total cost), reducing crashout solvent usage (29%), and using lower-purity oleylamine (10%). To our knowledge, however, high-efficiency PbS QD devices have not yet been demonstrated using the heat-up synthesis with TAA precursor.For perovskite QDs, we observe surprisingly high costs given the low materials costs reported for polycrystalline perovskite films. The cost of CsPbI3 QDs is dominated by labor (62% of total), methyl acetate (12%), and high-purity PbI2 (4%). Unfortunately, alternatives to methyl acetate for purification may be limited. Initial reports found that methyl acetate was the only antisolvent compatible with the desired cubic-phase CsPbI3 QDs.4 Although only a few demonstrations of perovskite QD solar cells have been reported thus far—all at small scale—dramatic reductions in labor cost will be required to make CsPbI3 QDs cost-competitive for PV applications.
Because our Monte Carlo approach captures uncertainty in all major cost parameters, the true QD production cost for U.S.-based manufacturing is likely to fall within the distributions shown in Fig. 2 and 5. However, several assumptions in our model may be overly optimistic or pessimistic, potentially making the median value an underestimate or overestimate of the true cost, respectively. Optimistic assumptions include the use of the lowest-cost purity as the nominal precursor cost when no purity was reported, the high estimate of 100% precursor utilization for calculating synthesis yield, omission of indirect labor costs, and high cell and module aperture-area efficiencies of 20% and 19%, respectively, used for calculating $ per W values. Pessimistic assumptions include the relatively high hourly labor rates—stemming from a need for skilled operators—and the 5 L reactor volume. Although hot-injection synthesis volumes may be limited by thermal quenching rates—especially for small nanocrystals—heat-up methods could enable much larger batch volumes.
The assumptions on economies of scale in material purchasing strongly affect the modeled costs. The nominal annual QD production from our model factory ranges from 11.7 kg year−1 (11.92 g nominal yield per 5 L synthesis × 90% crashout yield × 1095 syntheses per year) for the CsPbI3 hot-injection synthesis to 241 kg year−1 (245 g nominal yield per synthesis) for the PbCl2/TMS-S heat-up synthesis. This production rate is sufficient to support an annual PV module manufacturing capacity of 1.2 MW year−1 (11.7 kg year−1 ÷ 1.921 g m−2 × 190 W m−2) to 17 MW year−1 (241 kg year−1 ÷ 2.705 g m−2 × 190 W m−2), similar to the expected capacity for a pilot manufacturing line. At this scale, the monthly usage of key precursors ranges up to 740 times the nominal unit purchase volume, as specified in the input parameter spreadsheets (ESI†). Increasing the purchase volume reduces costs both by giving the purchaser more leverage to drive down supplier margins and by increasing economies of scale in raw material production. It is difficult to determine the actual profit margins in our price data. Furthermore, savings from economies of scale are likely to plateau at high production volumes. For the range of production volumes analyzed here, however, the true material cost savings per decade increase in purchase volume should fall well within the modeled 30% to 80% range for most precursors (Fig. S1, ESI†).
Our Monte Carlo model makes two minor simplifications that should not significantly affect the calculated results. First, the same labor requirement and throughput is assumed for synthesis, crashout, and cleaning. In practice, these steps may proceed at different rates and incur different labor requirements. For example, at QD Vision, more labor was required for crashout than for synthesis, as many labor-intensive synthetic steps such as equipment set-up and precursor preparation were eliminated with permanent installations and standard automation. However, any systematic differences can be alleviated by shifting labor between processes. An operator can generally perform multiple roles in the process sequence, depending on the timing of individual steps. Second, the model assumes that all input parameters are statistically independent. This assumption is unlikely to hold strictly—for example, the factory location would similarly affect rent and labor costs. Such correlations between parameters may lead to an underestimation of the total uncertainty.28 Even so, no strong dependencies are expected between the key input parameters (precursor materials usage and cost), so errors associated with correlated costs should be minimal.
Several general strategies for reducing QD production costs can be inferred from our modeled results. One obvious strategy is to reduce material costs by avoiding expensive precursors (e.g., TMS-S, PbCl2, and methyl acetate), using lower-purity precursors, synthesizing key precursors in-house, or recycling solvents by distillation or similar methods. Implementation of a solvent recycling system could reduce material costs substantially at the cost of increased capex. Labor costs could be reduced by developing a more robust process to mitigate the need for skilled labor, manufacturing in countries with lower wages (e.g., India), or increasing automation. Automation substitutes capex for labor—a worthwhile trade-off given the present labor-dominated cost structure (25% to 65% of total). Labor costs per gram could be reduced further by increasing throughput with larger reactors and continuous flow-based synthesis and crashout methods.14,29 For perovskite QDs, intrinsic defect tolerance could enable new high-throughput synthesis pathways such as wet ball milling, which generates structural defects in conventional materials.30 New synthetic procedures should target higher precursor concentrations (Fig. 7). For a given reactor volume, increasing precursor concentration reduces the material cost per gram—due to the lower solvent volume required for synthesis and crashout—as well as the labor cost per gram.
Conclusions
Our Monte Carlo analysis of QD synthesis costs suggests that today's leading synthetic procedures are not yet compatible with ultra-low-cost photovoltaics at the 1 MW year−1 to 20 MW year−1 production scale. Even if 20% efficient, stable QD solar cells were available today, the QD absorber would likely be too expensive to compete with silicon PV.One potential implication of this study is that emerging PV absorbers—i.e., pre-synthesized QDs and organic materials31—enable simple, high-throughput, low-cost film deposition at the expense of increased material complexity and cost.32 From a total module cost perspective, this trade-off may be too steep: QD-based PV modules will have difficulty achieving extremely low production costs (e.g., <0.20 $ per W). Polycrystalline perovskites may well hit the sweet spot between material complexity and process complexity, enabling in situ synthesis at relatively low temperatures.32
With further development, however, QD solar cells could still provide a low-cost, lightweight alternative to conventional PV technologies. There is no fundamental reason why colloidal QDs must be expensive. Although some precursors are expensive, the elements used in PbS and CsPbI3 nanocrystals are relatively cheap, abundant, and produced globally in high volumes.32,33 New QD synthesis methods following the strategies outlined above could dramatically reduce costs. Future work should target total synthetic costs below 5 $ per g, or roughly 0.05 $ per W for 20% efficient perovskite and lead chalcogenide QD solar cells—still significant but likely acceptable for most PV applications. Ultimately, the development of new low-cost synthetic methods will be critically important for the commercial relevance of QD photovoltaics.
Conflicts of interest
There are no conflicts of interest to declare.Acknowledgements
The authors thank Patrick Brown, Dane deQuilettes, and other members of the Tata-MIT GridEdge Solar team for valuable feedback. Funding for this work was provided by the Tata Trusts.References
- M. Liu, O. Voznyy, R. Sabatini, F. P. García de Arquer, R. Munir, A. H. Balawi, X. Lan, F. Fan, G. Walters, A. R. Kirmani, S. Hoogland, F. Laquai, A. Amassian and E. H. Sargent, Hybrid organic–inorganic inks flatten the energy landscape in colloidal quantum dot solids, Nat. Mater., 2017, 16, 258–263 CrossRef PubMed.
- H. Aqoma, M. Al Mubarok, W. T. Hadmojo, E.-H. Lee, T.-W. Kim, T. K. Ahn, S.-H. Oh and S.-Y. Jang, High-Efficiency Photovoltaic Devices using Trap-Controlled Quantum-Dot Ink prepared via Phase-Transfer Exchange, Adv. Mater., 2017, 29, 1605756 CrossRef PubMed.
- E. M. Sanehira, A. R. Marshall, J. A. Christians, S. P. Harvey, P. N. Ciesielski, L. M. Wheeler, P. Schulz, L. Y. Lin, M. C. Beard and J. M. Luther, Enhanced mobility CsPbI3 quantum dot arrays for record-efficiency, high-voltage photovoltaic cells, Sci. Adv., 2017, 3, eaao4204 CrossRef PubMed.
- A. Swarnkar, A. R. Marshall, E. M. Sanehira, B. D. Chernomordik, D. T. Moore, J. A. Christians, T. Chakrabarti and J. M. Luther, Quantum dot-induced phase stabilization of α-CsPbI3 perovskite for high-efficiency photovoltaics, Science, 2016, 354, 92–95 CrossRef PubMed.
- X. Zhang, V. A. Öberg, J. Du, J. Liu and E. M. J. Johansson, Extremely lightweight and ultra-flexible infrared light-converting quantum dot solar cells with high power-per-weight output using a solution-processed bending durable silver nanowire-based electrode, Energy Environ. Sci., 2018, 11, 354–364 RSC.
- J. Jean, T. S. Mahony, D. Bozyigit, M. Sponseller, J. Holovský, M. G. Bawendi and V. Bulović, Radiative Efficiency Limit with Band Tailing Exceeds 30% for Quantum Dot Solar Cells, ACS Energy Lett., 2017, 2616–2624 CrossRef.
- NREL. Best Research-Cell Efficiencies, 2017.
- Price Index. pvXchange, Feb 31, 2018 at http://www.pvxchange.com/priceindex/Default.aspx?langTag=en-GB.
- Z. Song, C. L. McElvany, A. B. Phillips, I. Celik, P. W. Krantz, S. C. Watthage, G. K. Liyanage, D. Apul and M. J. Heben, A technoeconomic analysis of perovskite solar module manufacturing with low-cost materials and techniques, Energy Environ. Sci., 2017, 10, 1297–1305 RSC.
- N. L. Chang, A. W. Yi Ho-Baillie, P. A. Basore, T. L. Young, R. Evans and R. J. Egan, A manufacturing cost estimation method with uncertainty analysis and its application to perovskite on glass photovoltaic modules, Prog. Photovoltaics Res. Appl., 2017, 25, 390–405 CrossRef.
- M. A. Hines and G. D. Scholes, Colloidal PbS Nanocrystals with Size-Tunable Near-Infrared Emission: Observation of Post-Synthesis Self-Narrowing of the Particle Size Distribution, Adv. Mater., 2003, 15, 1844–1849 CrossRef.
- C. B. Murray, D. J. Norris and M. G. Bawendi, Synthesis and characterization of nearly monodisperse CdE (E = sulfur, selenium, tellurium) semiconductor nanocrystallites, J. Am. Chem. Soc., 1993, 115, 8706–8715 CrossRef.
- J. Zhang, J. Gao, E. M. Miller, J. M. Luther and M. C. Beard, Diffusion-controlled synthesis of PbS and PbSe quantum dots with in situ halide passivation for quantum dot solar cells, ACS Nano, 2014, 8, 614–622 CrossRef PubMed.
- J. Pan, A. O. El-Ballouli, L. Rollny, O. Voznyy, V. M. Burlakov, A. Goriely, E. H. Sargent and O. M. Bakr, Automated synthesis of photovoltaic-quality colloidal quantum dots using separate nucleation and growth stages, ACS Nano, 2013, 7, 10158–10166 CrossRef PubMed.
- M. Yarema, O. Yarema, W. M. M. Lin, S. Volk, N. Yazdani, D. Bozyigit and V. Wood, Upscaling Colloidal Nanocrystal Hot-Injection Syntheses via Reactor Underpressure, Chem. Mater., 2017, 29, 796–803 CrossRef.
- M. P. Hendricks, M. P. Campos, G. T. Cleveland, I. Jen-La Plante and J. S. Owen, A tunable library of substituted thiourea precursors to metal sulfide nanocrystals, Science, 2015, 348, 1226–1230 CrossRef PubMed.
- L.-Y. Chang, R. R. Lunt, P. R. Brown, V. Bulović and M. G. Bawendi, Low-temperature solution-processed solar cells based on PbS colloidal quantum dot/CdS heterojunctions, Nano Lett., 2013, 13, 994–999 CrossRef PubMed.
- N. Zhao, T. P. Osedach, L.-Y. Chang, S. M. Geyer, D. Wanger, M. T. Binda, A. C. Arango, M. G. Bawendi and V. Bulovic, Colloidal PbS quantum dot solar cells with high fill factor, ACS Nano, 2010, 4, 3743–3752 CrossRef PubMed.
- L. Cademartiri, J. Bertolotti, R. Sapienza, D. S. Wiersma, G. von Freymann and G. A. Ozin, Multigram scale, solventless, and diffusion-controlled route to highly monodisperse PbS nanocrystals, J. Phys. Chem. B, 2006, 110, 671–673 CrossRef PubMed.
- I. Moreels, Y. Justo, B. De Geyter, K. Haustraete, J. C. Martins and Z. Hens, Size-tunable, bright, and stable PbS quantum dots: a surface chemistry study, ACS Nano, 2011, 5, 2004–2012 CrossRef PubMed.
- Z. Huang, G. Zhai, Z. Zhang, C. Zhang, Y. Xia, L. Lian, X. Fu, D. Zhang and J. Zhang, Low cost and large scale synthesis of PbS quantum dots with hybrid surface passivation, CrystEngComm, 2017, 19, 946–951 RSC.
- L. Protesescu, S. Yakunin, M. I. Bodnarchuk, F. Krieg, R. Caputo, C. H. Hendon, R. X. Yang, A. Walsh and M. V. Kovalenko, Nanocrystals of Cesium Lead Halide Perovskites (CsPbX, X = Cl, Br, and I): Novel Optoelectronic Materials Showing Bright Emission with Wide Color Gamut, Nano Lett., 2015, 15, 3692–3696 CrossRef PubMed.
- H. Aqoma and S.-Y. Jang, Solid-state-ligand-exchange free quantum dot ink-based solar cells with an efficiency of 10.9%, Energy Environ. Sci., 2018, 11, 1603–1609 RSC.
- EIA. Electric Power Monthly with Data for March 2018, U.S. Energy Information Administration, 2018 at https://www.eia.gov/electricity/monthly/.
- N. L. Chang, A. W. Y. Ho-Baillie, D. Vak, M. Gao, M. A. Green and R. J. Egan, Manufacturing cost and market potential analysis of demonstrated roll-to-roll perovskite photovoltaic cell processes, Sol. Energy Mater. Sol. Cells, 2018, 174, 314–324 CrossRef.
- S. E. Sofia, J. P. Mailoa, D. N. Weiss, B. J. Stanbery, T. Buonassisi and I. Marius Peters, Economic viability of thin-film tandem solar modules in the United States, Nat. Energy, 2018, 3, 387–394 CrossRef.
- ITRPV. International Technology Roadmap for Photovoltaic, 2016 Results, 2017.
- J. R. van Dorp and M. R. Duffey, Statistical dependence in risk analysis for project networks using Monte Carlo methods, Int. J. Prod. Econ., 1999, 58, 17–29 CrossRef.
- H. Lim, J. Y. Woo, D. C. Lee, J. Lee, S. Jeong and D. Kim, Continuous Purification of Colloidal Quantum Dots in Large-Scale Using Porous Electrodes in Flow Channel, Sci. Rep., 2017, 7, 43581 CrossRef PubMed.
- L. Protesescu, S. Yakunin, O. Nazarenko, D. N. Dirin and M. V. Kovalenko, Low-Cost Synthesis of Highly Luminescent Colloidal Lead Halide Perovskite Nanocrystals by Wet Ball Milling, ACS Appl. Nano Mater., 2018, 1, 1300–1308 CrossRef PubMed.
- T. P. Osedach, T. L. Andrew and V. Bulović, Effect of synthetic accessibility on the commercial viability of organic photovoltaics, Energy Environ. Sci., 2013, 6, 711–718 RSC.
- J. Jean, P. R. Brown, R. L. Jaffe, T. Buonassisi and V. Bulović, Pathways for solar photovoltaics, Energy Environ. Sci., 2015, 8, 1200–1219 RSC.
- C. Wadia, A. P. Alivisatos and D. M. Kammen, Materials availability expands the opportunity for large-scale photovoltaics deployment, Environ. Sci. Technol., 2009, 43, 2072–2077 CrossRef PubMed.
Footnote |
| † Electronic supplementary information (ESI) available. See DOI: 10.1039/c8ee01348a |
| This journal is © The Royal Society of Chemistry 2018 |

