 Open Access Article
Creative Commons Attribution 3.0 Unported Licence
Thermoelectric properties of (Ba,K)Cd2As2 crystallized in the CaAl2Si2-type structure†
H.
Kunioka
 a,
K.
Kihou
 a,
H.
Nishiate
a,
A.
Yamamoto
a,
H.
Nishiate
a,
A.
Yamamoto
 a,
H.
Usui
b,
K.
Kuroki
b and
C. H.
Lee
 *a
*a
aNational Institute of Advanced Industrial Science and Technology (AIST), Tsukuba, Ibaraki 305-8568, Japan. E-mail: c.lee@aist.go.jp
bDepartment of Physics, Osaka University, Toyonaka, Osaka 560-0043, Japan
First published on 2nd November 2018
Abstract
As-Based Zintl compounds Ba1−xKxCd2As2 crystallized in the CaAl2Si2-type structure (space group P![[3 with combining macron]](https://www.rsc.org/images/entities/char_0033_0304.gif) m1) were prepared using solid-state reactions followed by hot-pressing. We have successfully substituted K for Ba up to x = 0.08, producing hole-carrier doping with concentrations up to 1.60 × 1020 cm−3. We have determined the band-gap value of non-doped BaCd2As2 to be 0.40 eV from the temperature dependence of the electrical resistivity. Both the electrical resistivity and the Seebeck coefficient decrease with hole doping, leading to a power factor value of 1.28 mW m−1 K−2 at 762 K for x = 0.04. A first-principles band calculation shows that the relatively large power factor mainly originates from the two-fold degeneracy of the bands comprising As px,y orbitals and from the anisotropic band structure at the valence-band maximum. The lattice thermal conductivity is suppressed by the K doping to 0.46 W m−1 K−1 at 773 K for x = 0.08, presumably due to randomness. The effect of randomness is compensated by an increase in the electronic thermal conductivity, which keeps the total thermal conductivity approximately constant. In consequence, the dimensionless figure-of-merit ZT reaches a maximum value of 0.81 at 762 K for x = 0.04.
m1) were prepared using solid-state reactions followed by hot-pressing. We have successfully substituted K for Ba up to x = 0.08, producing hole-carrier doping with concentrations up to 1.60 × 1020 cm−3. We have determined the band-gap value of non-doped BaCd2As2 to be 0.40 eV from the temperature dependence of the electrical resistivity. Both the electrical resistivity and the Seebeck coefficient decrease with hole doping, leading to a power factor value of 1.28 mW m−1 K−2 at 762 K for x = 0.04. A first-principles band calculation shows that the relatively large power factor mainly originates from the two-fold degeneracy of the bands comprising As px,y orbitals and from the anisotropic band structure at the valence-band maximum. The lattice thermal conductivity is suppressed by the K doping to 0.46 W m−1 K−1 at 773 K for x = 0.08, presumably due to randomness. The effect of randomness is compensated by an increase in the electronic thermal conductivity, which keeps the total thermal conductivity approximately constant. In consequence, the dimensionless figure-of-merit ZT reaches a maximum value of 0.81 at 762 K for x = 0.04.
1 Introduction
High-performance thermoelectric materials are desirable for energy conservation, as they can generate electrical power from waste heat. Intense efforts have been devoted to improving the performance of such materials, but it is still not high enough for practical applications. Thermoelectric performance is characterized by the dimensionless figure-of-merit ZT = S2T/ρκ, where S is the Seebeck coefficient, ρ is the electrical resistivity, and κ is the total thermal conductivity. The difficulty in improving material performance comes from the conflicting requirements to exhibit high electrical conductivity while keeping the thermal conductivity as low as possible.Many new thermoelectric materials have been discovered in recent decades. Among them, the 122 Zintl compounds are a promising system.1–23 In particular, Mg3Sb2 exhibits a ZT value of 1.65 at 725 K, with n-type electronic conductivity, where the Mg atoms are located at two atomic sites in the ratio of 1![[thin space (1/6-em)]](https://www.rsc.org/images/entities/char_2009.gif) :
:![[thin space (1/6-em)]](https://www.rsc.org/images/entities/char_2009.gif) 2 so that it is categorized as 122 system.17,18 As for the p-type materials, Yb(Zn,Cd)2Sb2 and (Ca,Yb,Eu)Mg2Bi2 exhibit ZT values of 1.2 at 700 K and 1.3 at 873 K, respectively.19–23 Those compounds crystallize in the CaAl2Si2-type structure24,25 with the space group P
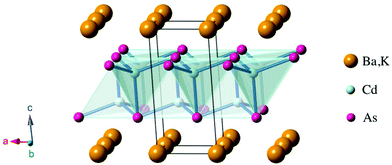
2 so that it is categorized as 122 system.17,18 As for the p-type materials, Yb(Zn,Cd)2Sb2 and (Ca,Yb,Eu)Mg2Bi2 exhibit ZT values of 1.2 at 700 K and 1.3 at 873 K, respectively.19–23 Those compounds crystallize in the CaAl2Si2-type structure24,25 with the space group P![[3 with combining macron]](https://www.rsc.org/images/entities/char_0033_0304.gif) m1 (Fig. 1). Characteristically, they consist of alternately stacked anionic layers and cation sheets. The anionic layers form two-dimensional networks of edge-sharing tetrahedrons with covalent bonding.
m1 (Fig. 1). Characteristically, they consist of alternately stacked anionic layers and cation sheets. The anionic layers form two-dimensional networks of edge-sharing tetrahedrons with covalent bonding.
The 122 Zintl compounds typically exhibit quite low lattice thermal conductivities (κL) less than 1 W m−1 K−1 at high temperatures, although their crystal structure is relatively simple. The origin of the low κL is still controversial. One hypothesis attributes it to the existence of lone pairs around the pnictogen atoms.20 Actually, lone pairs are present in various thermoelectric materials. For example, it has been proposed that lone pairs are responsible for the extremely low κL in SnSe.26 On the other hand, the high power factors (S2/ρ) of the 122 Zintl compounds can originate from multi-valley band structures in n-type,17,18 or from orbital degeneracy at valence-band edges in p-type.27 The wide variety of 122 Zintl compounds offer the advantage of allowing the design of ideal band structures.
To date, the 122 Zintl compounds have been intensively explored for Sb-based compounds. In contrast, compounds with lighter pnictogen atoms such as As and P have been less studied, because thermal conductivity generally increases with lighter atoms.28,29 Recently, we have found that (Ba,K)Zn2As2 exhibits quite a low value of κL = 0.8 W m−1 K−1 at 773 K. This is comparable with Sb-based compounds, leading to a ZT value of 0.67.30 Although the crystal structure of (Ba,K)Zn2As2 is the α-BaCu2S2-type31 different from the CaAl2Si2-type, this suggests that As-based compounds can also be promising thermoelectric materials. However, there have been few studies of As-based 122 Zintl compounds. In particular, there are no reports of As-based compounds with the CaAl2Si2-type structure as high-performance thermoelectric materials, even though they are promising candidates. In this study, we have thus explored the thermoelectric properties of (Ba,K)Cd2As2 crystallized in the CaAl2Si2-type structure.
2 Experimental
Polycrystalline samples of Ba1−xKxCd2As2 were synthesized using solid-state reactions. First, BaAs, Cd3As2 and BaCd2 were synthesized as precursors using Ba (3N, chunks), K (3N, chunks), As (6N, 1–5 mm chunks), and Cd (6N, shot) as starting materials. They were mixed at stoichiometric compositions, loaded them into alumina crucibles to produce Cd3As2, BaCd2, and KAs, and into a silica tube to create BaAs. The silica tube was heated at 750 °C for 24 h in a box furnace. The alumina crucibles were encapsulated in a screw-top stainless-steel container,32 heated at 800 °C to produce Cd3As2 and BaCd2 and at 650 °C to produce KAs, maintaining those temperatures for 24 h. These precursors were then mixed with As at stoichiometric ratios, ground, and pressed into pellets at room temperature to synthesize Ba1−xKxCd2As2. The pellets were placed in an alumina crucible and encapsulated in a screw-top stainless-steel container in an Ar atmosphere. Then, they were heated at 900 °C for 24 h, followed by water quenching. All the sample treatments described above were conducted in a glovebox filled with dried Ar gas. To obtain dense pellets, hot pressing were performed. The pellets were ground, wrapped in expanded graphite sheets, and put into graphite dies. The graphite dies were heated at 850 °C for 1 h while applying a uniaxial pressure of 70 MPa under an Ar gas flow. Finally, the dense pellets were annealed at 530 °C for 3 h.Powder X-ray diffraction was conducted at room temperature using a SmartLab (RIGAKU) diffractometer. Cu Kα1 radiation was used at 40 kV and 45 mA. The scattering angles (2θ) ranged between 5 and 140 deg and the scan speed for the 2θ was 0.2 deg min−1. The obtained dense pellets were pulverized for these measurements. The diffraction patterns were analyzed by the Rietveld method using RIETAN-FP.33 The obtained parameters are given in the ESI.† The densities of the hot-pressed samples were determined by the Archimedes method. The relative density of all of them was over 96%.
The electrical resistivity and the Seebeck coefficient were measured using the four-probe method with a ZEM3 (ADVANCE RIKO) instrument. Ag paste was used to secure contacts for the x = 0.00 and 0.01 samples. The temperature ranged from room temperature to 762 K. Sample space was filled with 0.5 atm He gas. The dense pellets were cut into rectangular parallelepipeds with dimensions of approximately 2 × 2 × 8 mm3. The measurements were conducted along the direction parallel to the uniaxial pressure axis which had been applied in the hot press.
The thermal diffusivity (D) and the specific heat (Cp) were measured by the laser-flash method using a LFA457 (Netzsch) instrument in an Ar gas flow. The size of used samples was 10 mm in diameter and 2 mm in thickness. The measurements were conducted along the direction parallel to the pressure axis applied in the hot press. The total thermal conductivity was calculated using the equation κ = DCpds, where ds is the sample density. The specific heat of one of the samples was also measured by means of differential scanning calorimetry using a DSC404 F3 (Netzsch) instrument in an Ar gas flow to ensure the accuracy of the results measured with the laser-flash method.
The Hall coefficient (RH) was measured at room temperature using the van der Pauw method in magnetic fields of 0.3 to 2 T. The shape of samples was a flat plate with typical dimensions of 6 × 6 × 0.7 mm3. The magnetic field was applied in direction normal to the plane surface of the sample. The Hall carrier concentration (nH) was calculated from the equation RH = 1/nHe where e is the elementary charge.
A first-principles band-structure calculation for BaCd2As2 was performed using the WIEN2k package34 with the modified Becke–Johnson exchange–correlation functional35,36 including spin orbit coupling. The value of RKmax was set to 7, and we took 2000 k-points for the self-consistent calculation and 10![[thin space (1/6-em)]](https://www.rsc.org/images/entities/char_2009.gif) 000 k-points to calculate the density of states. The Seebeck coefficient was obtained from Boltzmann transport theory implemented in the BoltzTraP code37 with 100
000 k-points to calculate the density of states. The Seebeck coefficient was obtained from Boltzmann transport theory implemented in the BoltzTraP code37 with 100![[thin space (1/6-em)]](https://www.rsc.org/images/entities/char_2009.gif) 000 k-points. The relaxation time was taken to be an undetermined constant in the present study, and it cancels out in the calculation of the Seebeck coefficient. The final result for the Seebeck coefficient was obtained by averaging over the xx, yy, and zz components of the Seebeck coefficient tensor, which corresponds to a calculation for a polycrystalline sample.
000 k-points. The relaxation time was taken to be an undetermined constant in the present study, and it cancels out in the calculation of the Seebeck coefficient. The final result for the Seebeck coefficient was obtained by averaging over the xx, yy, and zz components of the Seebeck coefficient tensor, which corresponds to a calculation for a polycrystalline sample.
3 Results and discussion
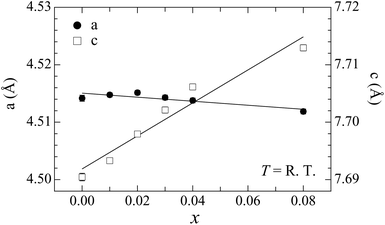
We have succeeded in synthesizing single-phase Ba1−xKxCd2As2 samples over the concentration range x ≤ 0.08 (Fig. 2). The observed diffraction peaks measured by powder X-ray diffraction can all be indexed using the CaAl2Si2-type structure. We also tried to synthesize samples for higher K content, but an impurity phase of KCd4As3 appears for x ≥ 0.12, demonstrating the solid solubility limit (see the ESI†). The lattice constant c evaluated by the Rietveld method varied linearly with the doping level, indicating that K atoms are successfully doped up to x = 0.08 (Fig. 3). The increase with doping is attributed to the larger ionic size of K compared to Ba and to the decrease of valency difference between the (Ba,K) ions and the CdAs layers. The lattice constant a tends to decrease with doping, indicating that holes are doped into the CdAs covalent bonds.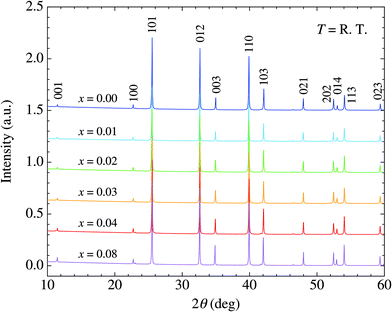 | ||
| Fig. 2 X-ray diffraction patterns for Ba1−xKxCd2As2 (x ≤ 0.08) at room temperature. Typical indices of the reflections are described. | ||
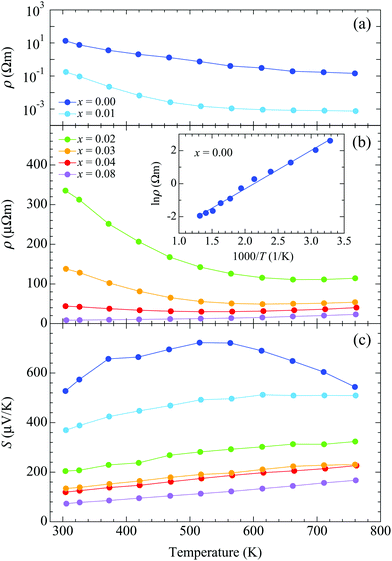
A non-doped BaCd2As2 sample exhibits semiconducting behavior with the relatively high electrical resistivity of 13.4 Ω m around room temperature, which decreases with heating [Fig. 4(a)]. The high resistivity ensures the high purity with low amount of lattice defect of the sample. The electrical resistivity decreases rapidly with doping, exhibiting metallic-like behavior at x = 0.08, where ρ = 8.5 μΩ m around room temperature [Fig. 4(b)]. We fitted the electrical resistivity for x = 0.00 using the following function to evaluate the band-gap energy (Eg): ρ = ρ0![[thin space (1/6-em)]](https://www.rsc.org/images/entities/char_2009.gif) exp(Eg/2kBT), where ρ0 is a constant and kB is the Boltzmann constant. The resulting value is Eg = 0.40 eV [inset of Fig. 4(b)]. A positive value of the Seebeck coefficient indicates a p-type semiconductor [Fig. 4(c)]. Non-doped BaCd2As2 exhibits the high Seebeck coefficient S = 527 μV K−1 around room temperature and reaches a maximum value of 723 μV K−1 at 515 K. The Seebeck coefficient decreases rapidly with doping to 73 μV K−1 around room temperature for x = 0.08. The temperature dependence shows a linear increase with heating over the whole temperature range for x ≥ 0.02, typical of heavily doped semiconductors.
exp(Eg/2kBT), where ρ0 is a constant and kB is the Boltzmann constant. The resulting value is Eg = 0.40 eV [inset of Fig. 4(b)]. A positive value of the Seebeck coefficient indicates a p-type semiconductor [Fig. 4(c)]. Non-doped BaCd2As2 exhibits the high Seebeck coefficient S = 527 μV K−1 around room temperature and reaches a maximum value of 723 μV K−1 at 515 K. The Seebeck coefficient decreases rapidly with doping to 73 μV K−1 around room temperature for x = 0.08. The temperature dependence shows a linear increase with heating over the whole temperature range for x ≥ 0.02, typical of heavily doped semiconductors.
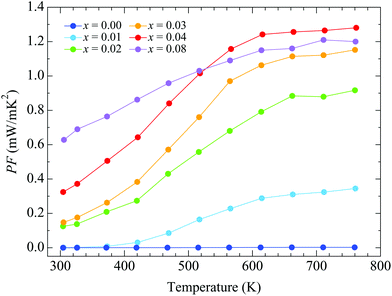
Fig. 5 shows the temperature dependence of the power factor (S2/ρ). Around room temperature, the power factor increases with doping, reaching the value 0.63 mW m−1 K−2 for x = 0.08. The enhancement is due to the rapid decrease of the electrical resistivity with doping around room temperature. The power factor for x = 0.08, however, is lower than that for x = 0.04 at high temperatures, due to a smaller decrease of the resistivity with doping. The highest value is obtained for x = 0.04, where it increases rapidly with heating up to T ∼ 600 K, after which it remains almost constant, reaching a maximum value of 1.28 mW m−1 K−2 at 762 K.
The total thermal conductivity is almost independent of doping [Fig. 6(a)]. The value is κ = 2.83 W m−1 K−1 around room temperature for x = 0.00, which decreases with heating to κ = 1.17 W m−1 K−1 at 773 K. The lattice thermal conductivity was determined by subtracting the electronic thermal conductivity (κe) from κ [Fig. 6(b)]. The Wiedemann–Franz law was applied to calculate κe using κe = LT/ρ, where L = 2.44 × 10⁻⁸ W Ω K−2 is the Lorenz number. More highly doped samples exhibit larger values of κe due to their lower electrical resistivity, resulting in lower values of κL. The lowest value is achieved for x = 0.08: κL = 1.46 W m−1 K−1 around room temperature and 0.46 W m−1 K−1 at 773 K. The lower values of κL for the more highly doped samples suggest that the randomness induced by K doping effectively scatters the thermal flow. The decreases of κL with heating could be due to an increase in Umklapp scattering of the thermal-transporting acoustic phonons. The suppression of κL due to randomness induced by substitution of ionic atoms was also observed in Sb-based 122 Zintl compounds, where Ca or Eu atoms are substituted by Yb atoms.4,6,10,11 For example, κL is about 40% suppressed by 25% Yb doping at room temperature in (Yb,Ca)Zn2Sb2.6 The suppression is, however, milder than that of the present samples. This can come from the difference in valency of doped ions. In contrast that Ca or Eu divalent ions are substituted by the divalent Yb ions, divalent Ba ions are substituted by monovalent K ions in the present samples, which can vary the interatomic force constants around ions. Thus, the effect of randomness can be larger in the present samples.
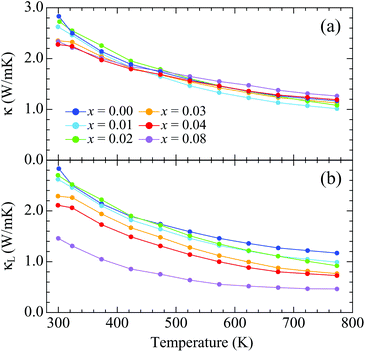 | ||
| Fig. 6 Temperature dependences of (a) the total thermal conductivity and (b) the lattice thermal conductivity for Ba1−xKxCd2As2. | ||
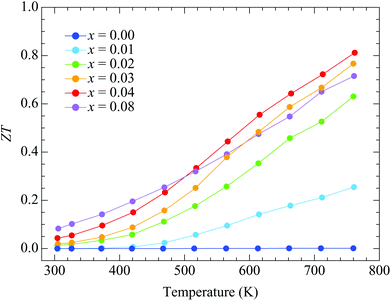
Fig. 7 shows the temperature dependences of ZT. The ZT values for x = 0.00 are quite low because of the high electrical resistivity. They increase with doping up to x = 0.08 around room temperature. The doping dependences are similar to those for the power factor because the total thermal conductivity is independent of doping. The highest ZT value is obtained with x = 0.04 sample, where it increases with heating to a maximum value of 0.81 at 762 K.
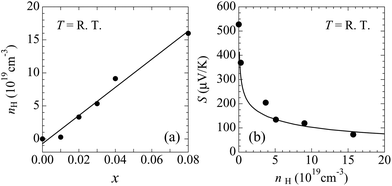
The hall carrier concentration (nH) at room temperature increases linearly with x, indicating the successive hole doping in the CdAs covalent bonding layers results from the substitution of K for Ba [Fig. 8(a)]. The value of nH for x = 0.00 is quite low, which is 3.15 × 1016 cm−3, demonstrating the low impurity and deficiency levels in the prepared samples. The value of nH reaches 1.60 × 1020 cm−3 for x = 0.08, covering the range of carrier concentrations suitable for thermoelectric properties. The Hall mobility, given by μH = 1/(nHeρ), exhibits the relatively low values of 0.15 and 46 cm2 V−1 s−1 at room temperature for x = 0.00 and 0.08, respectively. The increase of μH with doping can be attributed to the variation of conduction mechanism from hopping to metallic like conduction.
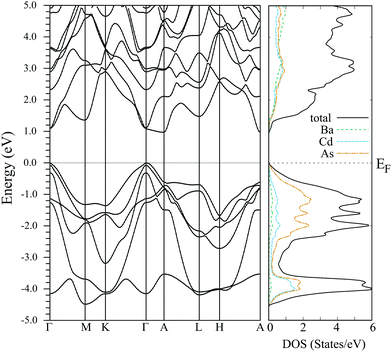
The band structure and the density of states for BaCd2As2 obtained by using the experimentally determined crystal structure at x = 0.00 are shown in Fig. 9. The valence bands are mainly constructed from the As p orbitals, and the highest and second highest valence bands at the Γ point near the Fermi level originate from the As px and py orbitals. The two bands constructed from the As px and py orbitals are split due to the spin orbit coupling. The energy difference between the two bands is about 0.07 eV, which is similar to those of other As- and Sb-based 122 Zintl phase compounds.27,38,39 The band structure originating from the As pz orbital lies below the Fermi level and the energy difference Δp between the top of the valence band and pz bands is about 0.36 eV. This is relatively large compared to those of other 122 Zintl compounds discussed in ref. 27.
The calculated Seebeck coefficient as a function of the carrier concentration is in accordance with the experimental result around room temperature [Fig. 8(b)], which suggests that the calculated electronic structure basically reproduces that of the actual material. The bands lying within an energy range of several kBT from the Fermi level contribute to transport coefficients such as the electrical conductivity and the Seebeck coefficient. Because Δp is about 14kBT at 300 K, we conclude that the px,y bands provide the main contributions to the observed transport properties, while the pz band makes only a small contribution.
As discussed in ref. 27, smaller values of Δp, namely enhanced band degeneracy, are preferable for producing larger maximum power factors in this series of materials. The maximum of the experimentally determined power factor for the present materials (1.28 mW m−1 K−2 at 762 K) is relatively large; it is larger than that of other 122 Zintl compounds having similar values of Δp. To investigate the origin of the large power factor for BaCd2As2, we have evaluated the effective masses in the x, y, and z axis directions, mxx, myy, and mzz, respectively. The anisotropy of the effective masses reflects the dimensionality of the band structure, which is known to strongly affect the maximum power factor, as discussed in, e.g., ref. 39–42. The calculated effective masses at the top of the valence band are mxx = 0.49me, myy = 0.83me, and mzz = 0.65me, where me is the electron rest mass. For the purpose of comparison, we have also calculated the effective mass and the power factor for CaZn2As2 using a theoretically optimized lattice structure with the PBEsol exchange–correlation functional,43 where the energy splitting between the px and py bands is almost the same (0.06 eV) and the pz orbital similarly makes a small contribution to the Seebeck effect (Δp = 0.31 eV). It is found that the effective masses for CaZn2As2 are mxx = 0.42me, myy = 0.58me, and mzz = 0.60me, and the calculated power factor for BaCd2As2 at around nH = 1 × 1020 cm−3 is about 1.4 times larger than that of CaZn2As2 at 300 K assuming the same relaxation times for these materials. The difference in the effective mass of the second-highest valence band is negligible between the two materials in comparison with that of the highest valence band. Considering the large difference in myy between the two materials, we conclude that the relatively large power factor of BaCd2As2 originates from the anisotropy of the band structure, in addition to the approximate two-fold degeneracy (px and py) of the bands. As the present material has a relatively large value of Δp, we anticipate that there is more room left for further enhancement of the power factor by enhancing the band degeneracy around the Fermi energy, which may be accomplished by element substitution.
4 Conclusions
Single-phase samples of Ba1−xKxCd2As2 (0.00 ≤ x ≤ 0.08) were successfully synthesized using solid-state reactions. The band-gap energy for x = 0.00 was determined to be 0.40 eV from electrical resistivity measurements. The maximum power factor is 1.28 mW m−1 K−2 at 762 K for x = 0.04. This relatively large power factor can be due to the anisotropic band structure and the two-fold degeneracy at the valence-band maximum. The total thermal conductivity is almost independent of doping, taking the value 1.17 W m−1 K−1 at 773 K for x = 0.00. The highest value of ZT obtained is 0.81 at 762 K for x = 0.04.Conflicts of interest
There are no conflicts to declare.Acknowledgements
We would like to thank K. Suekuni for valuable discussions and M. Ohta for supporting Hall coefficient measurements. This work was supported by CREST (No. JPMJCR16Q6) from the Japan Science and Technology Agency and by the New Energy and Industrial Technology Development Organization through the Thermal Management Materials and Technology Research Association.References
- S. M. Kauzlarich, S. R. Brown and G. J. Snyder, Dalton Trans., 2007, 2099 RSC.
- G. Kai, C. Qigao and Z. Jingtai, J. Rare Earths, 2013, 31, 1029 CrossRef.
- J. Shuai, J. Mao, S. Song, Q. Zhang, G. Chen and Z. Ren, Mater. Today Phys., 2017, 1, 74 CrossRef.
- F. Gascoin, S. Ottensmann, D. Stark, S. M. Haile and G. J. Snyder, Adv. Funct. Mater., 2005, 15, 1860 CrossRef CAS.
- A. F. May, M. A. McGuire, J. Ma, O. Delaire, A. Huq and R. Custelcean, J. Appl. Phys., 2012, 111, 033708 CrossRef.
- J. Shuai, Y. Wang, Z. Liu, H. S. Kim, J. Mao, J. Sui and Z. Ren, Nano Energy, 2016, 25, 136 CrossRef CAS.
- M. Wood, U. Aydemir, S. Ohno and G. J. Snyder, J. Mater. Chem. A, 2018, 6, 9437 RSC.
- H. Zhang, M. Baitinger, M.-B. Tang, Z.-Y. Man, H.-H. Chen, X.-X. Yang, Y. Liu, L. Chen, Yu. Grin and J.-T. Zhao, Dalton Trans., 2010, 39, 1101 RSC.
- H. Zhang, J.-T. Zhao, Yu. Grin, X.-J. Wang, M.-B. Tang, Z.-Y. Man, H.-H. Chen and X.-X. Yang, J. Chem. Phys., 2008, 129, 164713 CrossRef PubMed.
- H. Zhang, L. Fang, M.-B. Tang, Z. Y. Man, H. H. Chen, X. X. Yang, M. Baitinger, Y. Grin and J.-T. Zhao, J. Chem. Phys., 2010, 133, 194701 CrossRef CAS PubMed.
- Q.-G. Cao, H. Zhang, M.-B. Tang, H.-H. Chen, X.-X. Yang, Y. Grin and J.-T. Zhao, J. Appl. Phys., 2010, 107, 053714 CrossRef.
- C. Yu, T. J. Zhu, S. N. Zhang, X. B. Zhao, J. He, Z. Su and T. M. Tritt, J. Appl. Phys., 2008, 104, 013705 CrossRef.
- K. Guo, Q.-G. Cao, X.-J. Feng, M.-B. Tang, H.-H. Chen, X. Guo, L. Chen, Y. Grin and J.-T. Zhao, Eur. J. Inorg. Chem., 2011, 4043 CrossRef CAS.
- L. Song, J. Zhang and B. B. Iversen, J. Mater. Chem. A, 2017, 5, 4932 RSC.
- U. Aydemir, A. Zevalkink, A. Ormeci, Z. M. Gibbs, S. Bux and G. J. Snyder, Chem. Mater., 2015, 27, 1622 CrossRef CAS.
- U. Aydemir, A. Zevalkink, A. Ormeci, S. Bux and G. J. Snyder, J. Mater. Chem. A, 2016, 4, 1867 RSC.
- H. Tamaki, H. K. Sato and T. Kanno, Adv. Mater., 2016, 28, 10182 CrossRef CAS PubMed.
- J. Zhang, L. Song, S. H. Pedersen, H. Yin, L. T. Hung and B. B. Iversen, Nat. Commun., 2017, 8, 13901 CrossRef CAS PubMed.
- X. J. Wang, M. B. Tang, H. H. Chen, X. X. Yang, J. T. Zhao, U. Burkhardt and Y. Grin, Appl. Phys. Lett., 2009, 94, 092106 CrossRef.
- E. S. Toberer, A. F. May, B. C. Melot, E. F. Larsen and G. J. Snyder, Dalton Trans., 2010, 39, 1046 RSC.
- J. Shuai, H. Geng, Y. Lan, Z. Zhu, C. Wang, Z. Liu, J. Bao, C.-W. Chu, J. Sui and Z. Ren, Proc. Natl. Acad. Sci. U. S. A., 2016, 113, E4125 CrossRef CAS PubMed.
- J. Shuai, Z. Liu, H. S. Kim, Y. Wang, J. Mao, R. He, J. Sui and Z. Ren, J. Mater. Chem. A, 2016, 4, 4312 RSC.
- A. F. May, M. A. McGuire, D. J. Singh, J. Ma, O. Delaire, A. Huq, W. Cai and H. Wang, Phys. Rev. B: Condens. Matter Mater. Phys., 2012, 85, 035202 CrossRef.
- E. Brechtel, G. Cordier and H. Schäfer, Z. Naturforsch., B: Anorg. Chem., Org. Chem., 1979, 34, 921 Search PubMed.
- P. Klüfers and H. Neumann, Z. Naturforsch., B: Anorg. Chem., Org. Chem., 1980, 35, 1317 Search PubMed.
- C. W. Li, J. Hong, A. F. May, D. Bansal, S. Chi, T. Hong, G. Ehlers and O. Delaire, Nat. Phys., 2015, 11, 1063 Search PubMed.
- J. Zhang, L. Song, G. K. H. Madsen, K. F. F. Fischer, W. Zhang, X. Shi and B. B. Iversen, Nat. Commun., 2016, 7, 10892 Search PubMed.
- V. Ponnambalam and D. T. Morelli, J. Electron. Mater., 2014, 43, 1875 CrossRef CAS.
- V. Ponnambalam, S. Lindsey, W. Xie, D. Thompson, F. Drymiotis and T. M. Tritt, J. Phys. D: Appl. Phys., 2011, 44, 155406 CrossRef.
- K. Kihou, H. Nishiate, A. Yamamoto and C. H. Lee, Inorg. Chem., 2017, 56, 3709 CrossRef CAS PubMed.
- P. Klüfers and A. Mewis, Z. Naturforsch., B: Anorg. Chem., Org. Chem., 1978, 33, 151 Search PubMed.
- K. Kihou, T. Saito, S. Ishida, M. Nakajima, Y. Tomioka, H. Fukazawa, Y. Kohori, T. Ito, S. Uchida, A. Iyo, C. H. Lee and H. Eisaki, J. Phys. Soc. Jpn., 2010, 79, 124713 CrossRef.
- F. Izumi and K. Momma, Solid State Phenom., 2007, 15–20, 130 Search PubMed.
- P. Blaha, K. Schwarz, G. Madsen, D. Kvasnicka and J. Luitz, WIEN2k: An Augmented PlaneWave Plus Local Orbitals Program for Calculating Crystal Properties, Vienna University of Technology, 2001 Search PubMed.
- A. D. Becke and E. R. Johnson, J. Chem. Phys., 2006, 124, 221101 CrossRef PubMed.
- F. Tran and P. Blaha, Phys. Rev. Lett., 2009, 102, 226401 CrossRef PubMed.
- G. Madsen and D. Singh, Comput. Phys. Commun., 2006, 175, 67 CrossRef CAS.
- D. J. Singh and D. Parker, J. Appl. Phys., 2013, 114, 143703 CrossRef.
- J. Sun and D. J. Singh, J. Mater. Chem. A, 2017, 5, 8499 RSC.
- L. Hicks and M. Dresselhaus, Phys. Rev. B: Condens. Matter Mater. Phys., 1993, 47, 12727 CrossRef CAS.
- D. S. Parker, A. F. May and D. J. Singh, Phys. Rev. Appl., 2015, 3, 064003 CrossRef.
- Z. M. Gibbs, F. Ricci, G. Li, H. Zhu, K. Persson, G. Ceder, G. Hautier, A. Jain and G. J. Snyder, npj Comput. Mater., 2017, 3, 8 CrossRef.
- J. P. Perdew, A. Ruzsinszky, G. I. Csonka, O. A. Vydrov, G. E. Scuseria, L. A. Constantin, X. Zhou and K. Burke, Phys. Rev. Lett., 2008, 100, 136406 CrossRef PubMed.
Footnote |
| † Electronic supplementary information (ESI) available. See DOI: 10.1039/c8dt02955e |
| This journal is © The Royal Society of Chemistry 2018 |

