 Open Access Article
Creative Commons Attribution 3.0 Unported Licence
On verdigris, part II: synthesis of the 2-1-5 phase, Cu3(CH3COO)4(OH)2·5H2O, by long-term crystallisation from aqueous solution at room temperature†‡
Sebastian
Bette
 *a,
Reinhard K.
Kremer
 a,
Gerhard
Eggert
 b and
Robert E.
Dinnebier
 a
a
aMax Planck Institute for Solid State Research, Heisenbergstr. 1, 70569 Stuttgart, Germany. E-mail: S.Bette@fkf.mpg.de
bState Academy of Art and Design, Am Weißenhof 1, 70191 Stuttgart, Germany
First published on 22nd May 2018
Abstract
Long-term crystallisation from aqueous copper(II)–acetate solution after the addition of ammonia at 25 °C led to the formation of a hitherto poorly characterised phase in the verdigris pigment system Cu(CH3COO)2–Cu(OH)2–H2O. Laboratory X-ray powder diffraction (XRPD) was successfully employed to solve the crystal structure. The structure solution reveals a phase composition of the Cu3(CH3COO)4(OH)2·5H2O ≡ 2-1-5 phase, which was also confirmed by thermal analysis. The 2-1-5 phase crystallises in space group P21/c (14) with lattice parameters of a = 12.4835(2) Å, b = 14.4246(2) Å, c = 10.7333(1) Å and β = 102.871(1)°. The crystal structure consists of Cu2(CH3COO)2(CH3COO)1/2(OH)4/3H2O1/6+ dimers that are interconnected by Cu(CH3COO)(CH3COO)1/2(OH)2/31/6− squares forming chains running in the c-direction. Non-coordinating hydrate water molecules are intercalated inbetween the chains and mediate the inter-chain interaction. IR and Raman spectroscopy techniques were also employed to confirm selected aspects of the determined crystal structure. The magnetic properties of the 2-1-5 phase decompose into two independent subsystems: a strongly antiferromagnetically spin exchange coupled magnetic Cu–Cu dimer and a significantly weaker coupled Cu monomer. The light blue colour of the sample originates from a reflectance maximum at 488 nm and significantly differs from the known verdigris phases. An investigation of several historic verdigris pigment samples revealed that this phase occurs both as a minor and a major component. Hence, our reference data for the title compound will help to improve the understanding of the multiphase mixtures occurring in historic verdigris samples.
Introduction
Pigments have been used by mankind since the early Stone Age. At the beginning, only naturally occurring pigments, i.e. minerals, were used. Much later, pigments were also produced artificially. One of the oldest synthetic pigments is “verdigris”, which is a collective term for green and blue copper based painting pigments. Until the 19th century, verdigris pigments were frequently used for the artistic scope (Fig. 1) and often produced by intentional corrosion of copper using carboxylic acids, mainly acetic acid (from vinegar).1 The pigment production also included purification and recrystallisation procedures. Numerous “recipes” for all production steps have been reported using different ingredients and applying different conditions in terms of temperature, time, etc. Hence, a great variety of verdigris pigments differing in colour, resistivity against degradation and chemical composition exist. In addition to their use as pigments, verdigris phases were used for other applications, e.g. medical purposes, as well.2 | ||
| Fig. 1 “The Magdalen Reading” painted by Rogier van der Weyden ca. 1438. Verdigris pigments were used in this picture together with lead-tin yellow for painting the green robe of the Magdalen24 © The National Gallery London. | ||
Verdigris is classified into two categories: neutral or sometimes distilled verdigris referring to Cu(CH3COO)2·H2O or Cu(CH3COO)2 and basic verdigris. The latter category refers to a group of copper(II)–acetate hydroxide salts, also known as “basic copper(II)–acetates”, which are distinguished and denoted according to their chemical composition: xCu(CH3COO)2·yCu(OH)2·zH2O ≡ x − y − z phase. Numerous synthesis attempts1,3–6 based on ancient recipes for verdigris revealed the existence of at least five distinct phases: 2-1-5, 1-1-5, 1-4-3, 1-2-0 and 1-3-2. Only the 1-3-2 phase1,4,5,7–14 and very recently the 1-2-0 phase15 were characterised in detail, as the purity of the obtained basic copper acetates could not be proved unambiguously because the phase characterisation led to contradictory results. In addition, ancient recipes, in particular the intentional corrosion of copper, were proved to lead to complex multiphase mixtures14,16,17 comprising components which could not be identified due to a lack of reliable reference data. Historic verdigris samples are even more complex as most of them are multiphase mixtures, as well as they are usually already affected by degradation processes.18 This emphasis the need for reliable reference data for the pure x − y − z phases which can serve as a basis for phase identification, e.g. by vibrational spectroscopy or quantification by X-ray powder diffraction (XRPD).
Besides their relevance as pigments, copper carboxylates attract broad scientific interest as materials for anion exchangers,10,11,19,20 for heterogeneous catalysis11 and due to their tuneable magnetic properties.12,13,21–23 These investigations however were focused mainly on the 1-3-2 phase. The crystal structure of the 1-3-2 phase was solved both from powder7 and single crystal8 X-ray diffraction. Crystalline powders of the 1-3-2 phase were obtained by adding NaOH7 or NH3(aq)4,5 to concentrated Cu(CH3COO)2 solution8 at 60 °C. Single crystals were grown by refluxing a 0.1 M Cu(CH3COO)2 solution at 60 °C for 60 h without stirring8 or by crystallisation from gel.25 The 1-3-2 phase can be converted into the 1-2-0 phase by ageing in concentrated Cu(CH3COO)2 solution at 60 °C.4,15 Reported synthesis routes that lead to the direct formation of the 1-2-0 phase,5,6 as well as the synthesis procedures for the 2-1-5, 1-1-5 and 1-4-3 phases, were found to be irreproducible.15
In order to extend the knowledge of the formation, stability, properties, and crystal structures of verdigris phases, we performed long-term crystallisation experiments. These were carried out at room temperature since lower temperatures usually lead to phases with higher water contents although the formation, transformation and crystallisation of hydroxide salts can take years.26,27 This procedure led to the successful synthesis of the 2-1-5 phase. The thermal behaviour, as well as the spectral and magnetic properties of this phase, was investigated and the crystal structure was solved from laboratory XRPD data.
Experimental section
Long-term crystallisation approaches
The investigations of the long term crystallisation of verdigris phases were carried out by using 3 approaches. The synthesis approaches are summarised in a scheme in Fig. S1 in the ESI.‡Approach I
In approach I, 5.9 g (0.030 mol) Cu(CH3COO)2·H2O (Merck, p.A.) were dissolved in 51.9 g of deionised water that had been boiled several minutes before in order to remove dissolved carbonate, at 70 °C yielding a 0.57 m (≡ moles Cu(CH3COO)2 per kg of H2O) solution. During stirring, 1.5 mL of 24 wt% NH3(aq) (≡ 0.019 mol NH3) were added at 70 °C. After 4 minutes, the addition was completed and the turquoise precipitate that was formed immediately was filtered off after two additional minutes of stirring. The filtrate was slowly cooled down to room temperature. After 4 months, the formation of a light blue precipitate was observed. The precipitate was finally filtered off after 14 months. In order to remove the adhered mother liquor, the solid was suspended in cold (T < 4 °C), deionised water, twice, and once in cold (T < 4 °C) ethanol. Drying was carried out for 48 h at room temperature. Only a small amount of the solid, approximately 20 mg, was obtained.Approach II + III
In approach II and III, 11.8 g (0.060 mol) Cu(CH3COO)2·H2O were dissolved in 88.3 g of deionised water at 70 °C yielding a 0.67 m copper(II)–acetate solution. During stirring, 3.0 mL of 24 wt% NH3(aq) (≡ 0.039 mol NH3) were added at 70 °C. After 6 minutes, the addition was completed and stirring was continued for 2 minutes. A turquoise precipitate formed immediately. The suspensions were stored for 7 days at 60 °C. During this time, the turquoise solid changed its colour into a deep blue. In approach II, the solid was filtered off and the filtrate was aged further for 12 months at room temperature. In approach III, the suspension was cooled down to room temperature and aged for 12 months, as well. During ageing, a light blue solid was formed in approach II and the solid in approach III turned slowly into a light blue. After ageing, the solids were filtered off and the removal of the mother liquor and drying was conducted as described above.Phase characterisation
SEM images of the purified and dried solids were obtained with a MERLIN scanning electron microscope (Zeiss) (5.0 kV accelerating voltage, SE-detector), after coating the sample with iridium. μ-Raman spectroscopy was carried out using a Renishaw inVia Raman spectrometer with a Leica DMLM microscope and a RenCam CCD detector. The spectrometer was equipped with a He–Ne laser operating at 632.8 nm, with power maintained below 400 μW on the sample surface. Thermal analysis was carried out using a STA 449 F5-Jupiter (Netzsch) device for TG-measurements. 12.6 mg of the sample were placed in an Al2O3 crucible and heated up from 30 °C to 500 °C with a heating rate of 2 K min−1 in a 50 mL min−1 Ar-stream. The magnetic measurement of a powder sample enclosed in a gel capsule was carried out in the temperature range from 1.8 K to 300 K in a DC mode using a SQUID magnetometer (MPMS XL, Quantum Design) at 0.1 T, 1.0 T and 7.0 T. XRPD patterns for phase identification were recorded at room temperature on a laboratory powder diffractometer in Debye–Scherrer geometry (Stadi P-Diffraktometer (Stoe), Cu-Kα1 radiation from a primary Ge(111)-Johann-type monochromator, and a Mythen 1 K detector (Dectris)). The samples were sealed in 0.5 mm diameter borosilicate glass capillaries (Hilgenberg glass no. 0140), which were spun during the measurements. Each pattern was measured in a 2θ range from 5.0° to 70° applying a total scan time of 5 h. The XRPD pattern for the crystal structure solution was recorded using the same device applying a scan range from 5.0° to 100° 2θ and a total scan time of 20 h. Temperature dependent in situ X-ray diffraction experiments were performed on a D8-Advance diffractometer (Bruker, Cu-Kα1 radiation from a primary Ge(220)-Johannson-type monochromator and a Lynx Eye position sensitive detector (Bruker)) in Debye–Scherrer geometry using a water cooled furnace (mri capillary heater, (25–1000) °C) for heating the capillary. The sample was sealed in a 0.5 mm diameter quartz glass capillary (Hilgenberg), which was spun during the measurement. The patterns were measured with a scan range of 5.0 to 40.0° 2θ, employing a step size of 0.005 and a total scan time of 4 h. A delay time of 30 min was applied before each measurement to ensure thermal equilibration.Crystal structure solution
The programme TOPAS 6.028 was used to determine and refine the crystal structure of the 2-1-5 phase. The indexing of the pattern was carried out by an iterative use of singular value decomposition (LSI)29 leading to a primitive monoclinic unit cell with lattice parameters given in the ESI (Table S1‡). The observed systematic reflection extinction pointed to P21/c (14) as the most probable space group. The peak profile and the precise lattice parameters were determined by LeBail30 fits applying the fundamental parameter approach of TOPAS.31 The background was modeled by employing Chebychev polynomials of the 6th order. The refinement converged quickly.Considering the unit cell volume, the site multiplicities in space group P21/c (14) and the packing densities of the related copper(II)–acetate–hydroxide hydrates,7,8,15 the number of formula units per unit cell, Z, was estimated as 4. The method of Charge Flipping32 with histogram matching33 supported by inclusion of the tangent formula34 was used to determine the positions of the copper ions. By applying the global optimisation method of simulated annealing (SA) in the real space as it is implemented in TOPAS,35 the positions of the acetate and hydroxide ions and water molecules were determined. Rigid bodies for the acetate ions were defined in z-matrix notation and translated and rotated freely through the unit cell. Atoms located on identical positions were identified by using a merging radius of 0.7 Å.36 After a few hours, the positions of all atoms were found. The procedure was carried out several times and as a result the simulated annealing process always yielded identical structural models that were independent from the starting parameters, i.e. the number of atoms that were initially put into the unit cell. For the final Rietveld refinement,37 all profile and lattice parameters were released iteratively and positions of the copper and oxygen (hydroxide ions and water molecules) atoms were subjected to free unconstrained refinement. The bond lengths and angles of the rigid bodies of the acetate ions were refined, restraining them to chemically reasonable values. Hydrogen sites were omitted due to the limits of the powder diffraction method. The final agreement factors are listed in Table S1,‡ the atomic coordinates and selected bond distances are given in Tables S2 and S3,‡ the fit of the whole powder pattern is shown in Fig. S2 in the ESI.‡ The crystallographic data are deposited at the CCDC, deposit number: 1840957.‡
Results and discussion
Phase identification and morphology
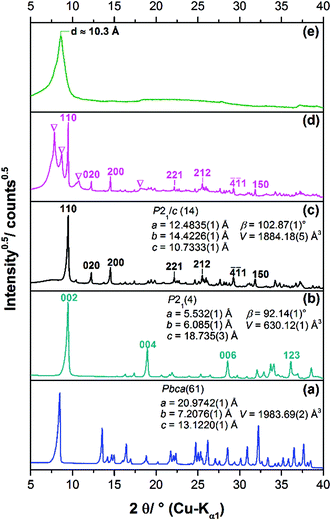
Long term crystallisation experiments were performed from clear solution after the filtration of the initially formed 1-3-2 phase (approach I), the subsequently formed 1-2-0 phase (approach II) and from a suspension of the 1-2-0 phase (approach III) at room temperature for at least one year (ESI Fig. S1‡). All long-term crystallisation approaches led to the formation of light blue powders (ESI, Fig. S1‡). Approach I results in the formation of a very small amount of solid (approx. 20 mg), whereas approach II and III yielded more materials (100 mg–200 mg). The diffraction patterns of the obtained solids differ (Fig. 2c–e).The diffraction pattern of the solid obtained by approach I (Fig. 2c) which was identified to be the 2-1-5 phase by the crystal structure solution (see below) can be clearly distinguished from the pattern of the 1-2-0 phase (a). Due to the identical position of the basal reflections of the 1-3-2 and 2-1-5 phases at ca. 9.6° 2θ (≡ d = 9.3 Å), the diffraction patterns of these verdigris phases (Fig. 2b and c) exhibit strong similarities. The indexing of the latter phase, however, leads to a different space group and different lattice parameters (inset). The broad hump in the background of the XRPD pattern indicates some amount of an amorphous phase. The diffraction pattern of the solid obtained by approach II (Fig. 2d) exhibits both broad and sharp reflections, indicating a polyphase mixture. The sharp reflections can be assigned to the 2-1-5 phase (indices) and the broad reflections (indicated by ∇) cannot be assigned to any known phase. Hence, a further unknown verdigris phase is apparent as a by-product. This indicates that the phase transformation is still ongoing in approach II. It cannot be concluded whether the 2-1-5 phase or the unknown poorly crystalline phase is metastable. In the diffraction pattern of the solid obtained by approach III, only one reflection corresponding to a d value of 10.3 Å is clearly visible (Fig. 2e). All other reflections are vastly broadened and exhibit a characteristic triangular peak shape that indicates a stacking fault disorder. The position of the basal reflection is identical to the corresponding reflection of the 1-2-0 phase (Fig. 2a) but also to the first two reflections of the crystalline by-product of approach II. This indicates that the latter phase is transformed into another copper(II)–acetate–hydroxide hydrate via a structurally disordered intermediate state. The process of phase transformation does not seem to be completed after more than one year.
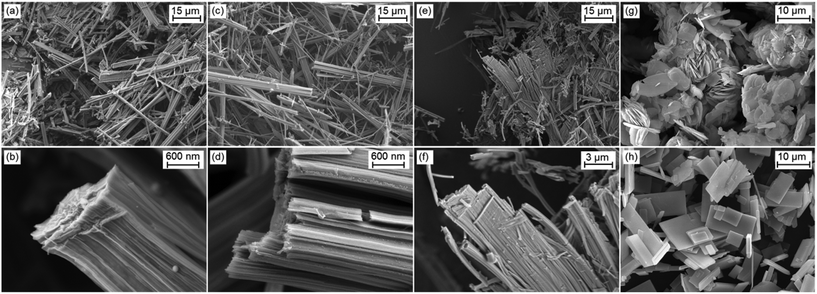
The crystallites of the 2-1-5 phase exhibit a needle-like morphology (Fig. 3a). They can be clearly distinguished from plate-like crystals of the 1-3-2 phase (g) and the 1-2-0 phase (h). Higher magnification reveals that the needles of the 2-1-5 phase are polycrystalline aggregates of fibre-like crystals (b). Despite the XRPD analysis clearly showed that the solid obtained by approach II consists of two phases, the well crystalline 2-1-5 phase and the poor crystalline unknown phase, the SEM images show polycrystalline needle-like aggregates of fibre-like crystals, exclusively c and d. Therefore, the additional unknown phase exhibits a needle-like morphology, as well. The SEM image of the heavily disordered solid obtained by approach III shows aggregates of needle-like crystallites, as well (e and f). Compared to the solids obtained by approaches I and II, these aggregates are much broader and they exhibit some similarity to the rectangular plate-like crystals of the 1-2-0 phase that was intermediarily apparent in approach III.
Investigation of historic pigment samples
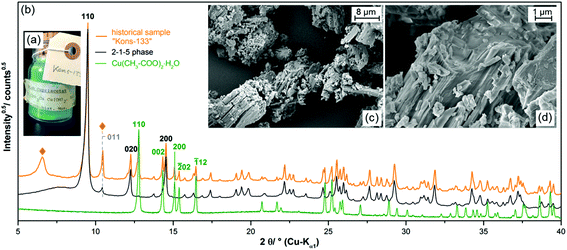
Due to the small yield and the long crystallisation time, it appears unlikely that the 2-1-5 phase is relevant for the understanding of historic verdigris samples. Surprisingly by an investigation on three historic pigment samples of the Medicinsk Historisk Museum obtained from the School of Conservation in Copenhagen, however, the presence of the 2-1-5 phase was confirmed.In two of the historic samples which were labelled as “copper acetate”, the 2-1-5 phase was identified as a minor impurity (3.2 wt% and 6.0 wt%) (ESI, Fig. S3a and b‡). One sample labelled as “basic copper acetate” with a 1-1-5 phase composition (Fig. 4a) was revealed to be a polyphase mixture (b). In the XRPD, most reflections could be assigned to copper(II)–acetate monohydrate (Fig. 4b, green pattern) and to the 2-1-5 phase (black pattern), the measured intensity at the position of the 011 reflection, however, is too high in relation to the 110 basal reflection. Hence, at this position, a second reflection attributed to another phase is apparent. In addition, at ca. 6.5° 2θ, a broad reflection (indicated by ◆) is present that is neither attributed to the 2-1-5 phase nor to copper(II)–acetate monohydrate and to any other known verdigris phases or their degradation products. Hence, a third phase is apparent which can neither be identified nor be indexed due to a lack of unambiguously assignable reflections, yet. In the SEM images (Fig. 4c and d), elongated structures are visible but everything is covered by a solid of an indefinite shape. Copper(II)–acetate monohydrate is most likely crystallised from adherent solution during the drying process and therefore covers the verdigris particles.
As the 2-1-5 phase was identified to be a component of historic pigments, a more efficient synthesis route in terms of time and yield most likely exists.
Crystal structure description
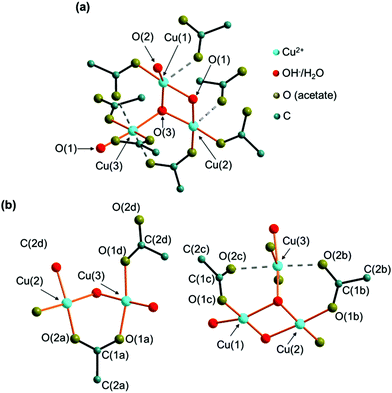
In the crystal structure of the 2-1-5 phase, three crystallographically independent copper sites are apparent (Fig. 5a). Each cation site is coordinated by 4 oxygen atoms from hydroxide, water and acetate forming distorted squared planar coordination spheres (orange bonds) with Cu–O distances between 1.83 Å and 2.07 Å (ESI, Table S3‡), which is in the expected range for this class of compounds.7,8,15 In addition, carboxylate related oxygen atoms are located in the extended coordination sphere (Fig. 5a, grey, dashed bonds) with Cu–O distances ranging from 2.29 Å to 2.41 Å resulting in squared pyramidal extended coordination spheres of Cu(1) and Cu(2) and in a Jahn–Teller-like distorted octahedra extended coordination sphere of Cu(3). The coordination polyhedra of Cu(1) and Cu(2) form corner-sharing dimers that are linked to an edge-sharing Cu(3) unit. Bridging occurs via the O(1) and O(3) sites that are coordinated by 3 copper ions. Hence, these sites are most likely occupied by hydroxide ions. The O(2) site is apical and therefore most likely occupied by water.There are also 4 independent acetate sites in the crystal structure of the 2-1-5 phase (Fig. 5b). The carboxylate oxygen atoms are always at apical positions in the coordination spheres of copper. Acetate (a) bridges Cu(2) and Cu(3) and therefore it acts as a bidentate and bridging ligand. In contrast, acetate (d) is a pure monodentate ligand in the coordination sphere of Cu(3). The oxygen site (1) of acetates (b) and (c) is part of the coordination sphere of Cu(2) and Cu(3), respectively. As the second carboxylate, oxygen (O(2b), O(2c)) are situated within the extended coordination sphere of Cu(3), these acetates obtain a pseudo bidentate and pseudo bridging character.
The Cu2(CH3COO)2(CH3COO)1/2(OH)4/3H2O1/6+ dimers are connected by edge-sharing Cu(CH3COO)(CH3COO)1/2(OH)2/31/6− squares resulting in chains running in the c-direction with an alternating orientation of the dimers and the Cu(3)O4 units as the most prominent structural motif of the 2-1-5 phase (Fig. 6a). Interactions between the chains are mediated by non-coordinated water molecules that occupy the O(4–7) sites (Fig. 7, grey dashed lines). The O–O distances range from 2.68 Å to 2.97 Å which indicate strong interactions between non-coordinated water molecules and hydroxide or acetate ions. Some of these interactions are most likely H-bonds but due to the limits of the XRPD method, no hydrogen positions could be determined. The thermal behaviour (see below) of the phase, however, shows that the non-coordinated water molecules are loosely bound.
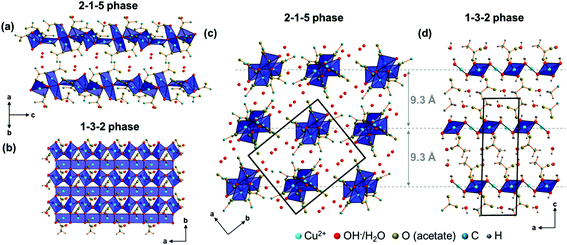 | ||
| Fig. 6 Comparison of main motifs of the crystal structures of the 2-1-5 (a, c) and the 1-3-2 phase (b, d). | ||
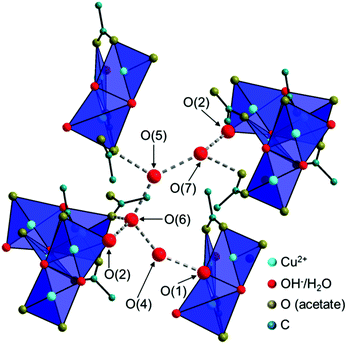 | ||
| Fig. 7 Illustration of the interaction of the chains in the crystal structure of the 2-1-5 phase, mediated by non-coordinated water molecules. | ||
The chains in the crystal structure of the 2-1-5 phase are arranged in a layered-like motif, perpendicular to [110] with an interlayer distance of 9.3 Å (Fig. 6c), which is associated with the characteristic 110 basal reflection (Fig. 2c). Although the crystal structure of the 1-3-2 phase with its layered motif (Fig. 6b) completely differs, the strong 002 basal reflection is located at an identical position (Fig. 2b) which is attributed to an identical interlayer distance of 9.3 Å (Fig. 6d). This can lead to serious problems for the phase identification using XRPD only. Usually this process is carried out with flat plate devices, i.e. samples may exhibit preferred orientation. In addition, the second most intense reflection of the 2-1-5 phase (200) exhibits a relative intensity of 12.4% and the relating reflection of the 1-3-2 phase (004) has a relative intensity of 18.2%. Therefore, phases are often assigned to the appearance of the characteristic strongest reflection. This can be misleading when dealing with mixtures containing the 2-1-5 phase or the 1-3-2 phase, which is a possible explanation for contradictory data given in the literature. Accordingly, complementary methods like vibrational spectroscopy are essential for unambiguous phase identification.
Spectral properties
The 2-1-5 phase exhibits a characteristic light blue colour (Fig. 8a) that can be clearly distinguished from the turquoise 1-3-2 phase (b) and the deep blue 1-2-0 phase (c). This is reflected by the diffuse UV/VIS reflectance spectra, as well (Fig. 8d). The 1-2-0 phase shows a sharp reflectance maximum at 472 nm, the maximum of the 2-1-5 phase is slightly broader and located at 488 nm and the reflectance maximum of the 1-3-2 phase at 517 nm is very broad and shifted further towards higher wavelengths, i.e. towards greenish. Historic verdigris pigments, which are often the multiphase mixture, usually exhibit a broad reflection maximum at approx. 500 nm,38 this can be explained by a superposition of the UV/VIS spectra presented in Fig. 8d.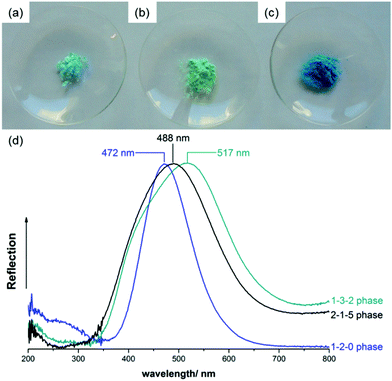 | ||
| Fig. 8 Photographs of powder samples of the (a) 2-1-5 phase, (b) 1-3-2 phase and (c) 1-2-0 phase and comparison of normalised the UV/VIS reflectance spectra (d). | ||
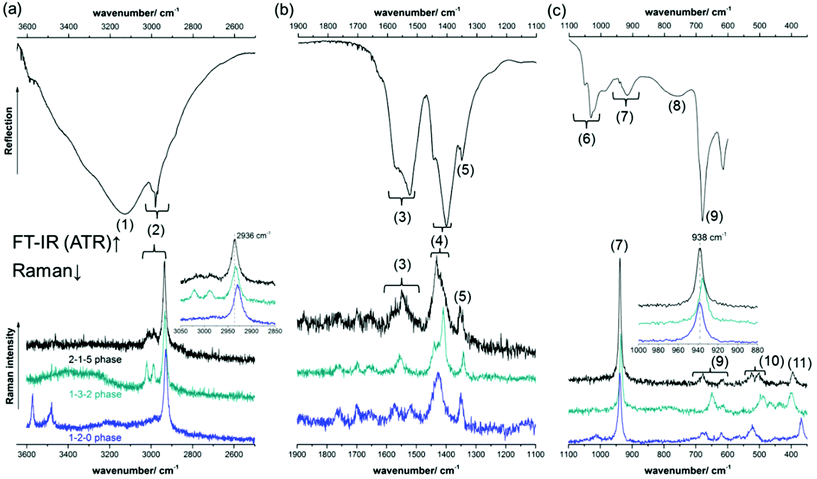
The FT-IR and Raman spectra of the 2-1-5 phase are given in Fig. 9. For the band assignment, the spectroscopic data of the 1-3-2 phase,7,8,10,13 the 1-2-015 phase, Cu(CH3COO)2·H2O39,40 and Cu(OH)241 as well as the fundamental vibrations of the acetate ion42 were used. By band assignment and interpretation of the FT-IR-spectrum, several features of the crystal structure can be confirmed. The Raman spectrum was recorded to obtain reference data for substance identification.
In the high wavenumber region of the FT-IR-spectrum (Fig. 9a, top), a superposition of very broad and intense bands (1) with a maximum at 3127 cm−1 is visible, which can be assigned to water related OH-stretching modes. Due to the low sensitivity of ATR units in the high wavenumber region and the high intensity of water related OH-stretching modes, hydroxide related OH-stretching modes that usually materialise as sharp bands cannot be identified. The acetate related C–H stretching modes (2) are rather broad, which indicates that the orientation of the methyl groups is not fixed by strong C–H⋯O bonds. The mid wavenumber region (Fig. 9b, top) contains symmetric and asymmetric acetate related C–O stretching modes ((3), (4)), as well as C–H bending modes (5). From the C–O stretching modes, valuable information on the crystal structure can be drawn. Both the symmetric and the asymmetric C–O stretching modes are split into several bands which are attributed to the different coordination spheres of the 4 distinct acetate sides in the crystal structure of the 2-1-5 phase (Fig. 5b). The splitting of the strongest symmetric (1402 cm−1) and the strongest asymmetric C–O stretching mode (1526 cm−1) in the IR-spectrum is unusually small, Δν = 124 cm−1 (Fig. 9b, top, Table 1). For ionic acetate, usually a splitting of ≈160 cm−1 can be expected.43 A smaller splitting indicates bidentate or bridging coordination. Therefore, these bands are most likely assigned to the pseudo bidentate and pseudo bridging acetates (b) and (c) (Fig. 5b). A small band related to a symmetric C–O stretching mode is apparent at 1445 cm−1. The splitting between this band and the strongest asymmetric C–O stretching mode (1526 cm−1) is extremely small (Δν = 81 cm−1), and therefore it can be assigned to the acetate (a) which has a bidentate and bridging characteristic. The splitting (Δν = 167 cm−1) between the broad asymmetric C–O stretching mode at 1569 cm−1 and the strongest symmetric C–O stretching mode (1402 cm−1) is slightly greater than that expected for ionic acetates. Hence, it can be assigned to monodentate coordinating acetate (d). In the low IR-region (Fig. 9c, top), various acetate related C–C-stretching modes (7), carboxylate related bending modes (9), and Cu–O related bands (10) are apparent. In addition, broad hydrate water related OH-bending modes are present.
| Band no. | Position/cm−1, shape | Assignment | |
|---|---|---|---|
| IR | Raman | ||
| vs: very strong, s: strong, m: medium, br broad, sh: shoulder. | |||
| (1) | 3127, br | — | ν(OH)–H2O |
| (2) | ≈2996, br | ≈3017, br | ν(CH)–CH3 |
| 2981, s | ≈2987, br | ||
| 2933, sh | 2936, vs | ||
| (3) | ≈1569, br | ≈1571, sh | ν as(CO)–COO− |
| 1526, vs | 1550, m | ||
| (4) | 1445, sh | 1432, s | ν s(CO)–COO− |
| 1402, s | 1416, sh | ||
| (5) | 1351, s | 1354, m | δ(CH)–CH3 |
| (6) | 1050, m | — | ρ(CH)–CH3 |
| 1031, s | — | ||
| 991, br | — | ||
| (7) | 917, br | 938, vs | ν(CC)–CH3—COO |
| (8) | 760, br | — | δ(OH)–H2O |
| (9) | 680, s | 677, m | δ(OCO)–COO− |
| 615, m | ≈617, br | ||
| (10) | — | 524, m | ν, ρ, ω(Cu–O), lattice modes |
| — | 502, m | ||
| — | 394, m | ||
A comparison of a part of the Raman spectra of the known verdigris phases is presented in Fig. 9, bottom. Due to the presence of strong hydroxide related OH-stretching modes, the 1-2-0 phase (blue) line can be clearly distinguished from other verdigris phases. The Raman-spectra of the 2-1-5 (black line) and the 1-3-2 phase (turquoise line), however, are very similar, and hence distinguishing between these two phases is not trivial. Small differences are visible in the mid (4) and low wavenumber (9 and 10) regions. Using conventional Raman-devices, these bands, however, are very broad and have only a little intensity. The sharp methyl related CH-stretching (2) and the bending mode (7) are more favourable for phase identification. In the 1-3-2 phase, these modes are slightly shifted towards lower wavenumbers than in the 2-1-5 phase (Fig. 9, bottom, inserts).
The complete Raman and FT-IR spectra of the 2-1-5 phase are presented in the ESI, Fig. S4.‡
Thermal behaviour
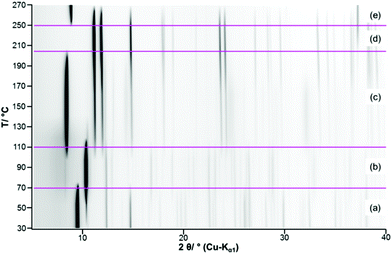
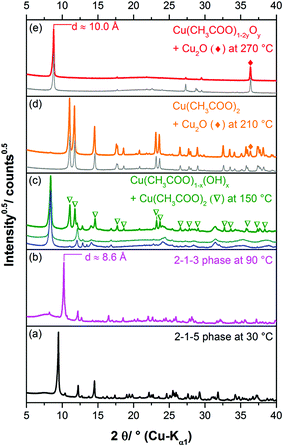
The complex thermal behaviour of the 2-1-5 phase was investigated by thermogravimetric (TG) analysis, as well, as by ex situ and in situ XRPD.The TG-curve (Fig. 10, black line) of the 2-1-5 phase exhibits several overlapping steps and the step size can only be estimated by using the DTG-curve (green line), i.e. the first derivative of the TG-curve. The thermal decomposition of the 2-1-5 phase starts at 50 °C. The first decomposition step is associated with a mass loss of ≈6.2 wt%, which corresponds to a release of 2 molecules of hydrate water (calculated mass loss: 6.5 wt%). In the in situ XRPD patterns (Fig. 11a and b), the intensity of the reflections of the 2-1-5 phase starts to decrease at 50 °C and additional reflections appear. This process is completed at 70–90 °C. According to the measured mass loss, the additional reflections can be assigned to a phase having a 2-1-3 composition. The XRPD pattern of this phase (Fig. 12b) exhibits a very strong basal reflection corresponding to a lattice plane distance of 8.6 Å that points to a layered-like structure motif of this phase. In the TG-curve (Fig. 10, black line), there is no pronounced plateau between the first and the second decomposition step, accordingly the DTG-curve (green line) does not drop down to 0 (grey line). The mass loss starts quickly in the second decomposition step but decelerates in course of the decomposition process. Finally, there is an overlap with the subsequent third decomposition step. With respect to the minimum in the DTG-curve, the second decomposition step is completed at a total mass loss of ≈15.8 wt%, which corresponds to the complete release of hydrate water (calculated mass loss 16.4 wt%). According to the in situ XRPD analysis (Fig. 11b and c), the decomposition of the intermediarily formed 2-1-3 phase starts at 110 °C and yields two solid phases: anhydrous copper(II)–acetate (Fig. 12c, reflections indicated by ∇) and a solid with a characteristic basal reflection associated with a lattice plane distance of approx. 10.5 Å. The latter phase also occurs during the thermal decomposition of the 1-3-2 (Fig. 12c, turquoise pattern) and the 1-2-0 phases (blue pattern). In the case of the 1-2-0 phase, the intermediate was identified as Cu3(CH3COO)2(OH)4−2xOx15 and in the case of the 1-3-2 phase as Cu2(CH3COO)(OH)3 (≡ 1-3-0 phase).7 Hence, the intermediate formed during the thermal decomposition of the 2-1-5 phase is most likely an acetate–hydroxide (Cu(CH3COO)x(OH)1−x) with a variable acetate![[thin space (1/6-em)]](https://www.rsc.org/images/entities/char_2009.gif) :
:![[thin space (1/6-em)]](https://www.rsc.org/images/entities/char_2009.gif) hydroxide ratio. At 190 °C, the intensity of the Cu(CH3COO)x(OH)1−x related reflections starts to decrease, the reflections attributed to anhydrous copper(II)–acetate increase in intensity and additional reflections attributed to Cu2O appear (Fig. 11c, d and 12d). The course of the TG- (Fig. 10, black line) and DTG-curve (green line) indicates that this process runs slowly. At 250 °C, the final decomposition step starts. The DTG-curve reveals that this is a two-step process (Fig. 10, (4) and (5)), which is also confirmed by the in situ XRPD analysis (Fig. 11d and e). Anhydrous copper(II)–acetate is decomposed to a strongly stacking faulted oxy-acetate, Cu(CH3COO)1−2yOy, that is characterised by a strong basal reflection corresponding to a lattice plane distance of 10.0 Å (Fig. 12e). As the complete decomposition of the acetate ion under a nitrogen atmosphere leads to several redox processes, copper(II) is reduced to copper(I) and copper(0). An ex situ XRPD analysis of the brownish-red residue of the thermal decomposition shows that it consists of Cu2O and Cu (ESI, Fig. S5‡); this is in accordance with the literature data of the thermal decomposition of copper(II)–acetate.40,44
hydroxide ratio. At 190 °C, the intensity of the Cu(CH3COO)x(OH)1−x related reflections starts to decrease, the reflections attributed to anhydrous copper(II)–acetate increase in intensity and additional reflections attributed to Cu2O appear (Fig. 11c, d and 12d). The course of the TG- (Fig. 10, black line) and DTG-curve (green line) indicates that this process runs slowly. At 250 °C, the final decomposition step starts. The DTG-curve reveals that this is a two-step process (Fig. 10, (4) and (5)), which is also confirmed by the in situ XRPD analysis (Fig. 11d and e). Anhydrous copper(II)–acetate is decomposed to a strongly stacking faulted oxy-acetate, Cu(CH3COO)1−2yOy, that is characterised by a strong basal reflection corresponding to a lattice plane distance of 10.0 Å (Fig. 12e). As the complete decomposition of the acetate ion under a nitrogen atmosphere leads to several redox processes, copper(II) is reduced to copper(I) and copper(0). An ex situ XRPD analysis of the brownish-red residue of the thermal decomposition shows that it consists of Cu2O and Cu (ESI, Fig. S5‡); this is in accordance with the literature data of the thermal decomposition of copper(II)–acetate.40,44
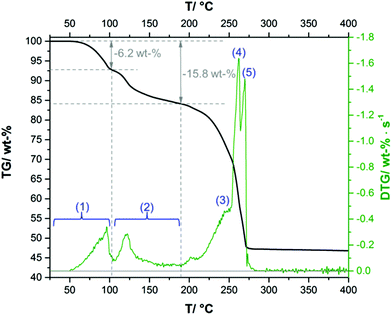 | ||
| Fig. 10 Thermogravimetric (TG, black line) and differential thermogravimetric (DTG, green line) curves of the 2-1-5 phase applying a heating rate of 2 K min−1. | ||
Magnetic properties
Fig. 13 displays the inverse magnetic susceptibilities of a 2-1-5 polycrystalline sample versus the temperature measured by applying an external magnetic field of 0.1, 1 and 7 Tesla. One observes a field dependence leading to slight growth of the inverse susceptibilities with higher magnetic fields. This effect can be understood as due to a minute ferromagnetic impurity which becomes gradually more saturated with larger external fields. Saturation effects are also observed at a very low temperature where especially the 7 T data exhibit a levelling-off at a finite value whereas the 0.1 and 1 T inverse susceptibilities to a good approximation exhibit a linear temperature dependence for T → 0 indicating Curie–Weiss behaviour, χ = C/(T − θ), with a vanishing Curie–Weiss temperature, θ, whereas above ∼100 K, the susceptibilities follow the Curie–Weiss law at a Curie–Weiss temperature of −64(2) K considering the 7 T data. What is also immediately obvious is the marked change of the slopes (1/χ ∝ 1/C) of the Curie–Weiss laws at high and at low temperatures by a factor of ∼2.7. Since the Curie–Weiss constant C is proportional to the number of active magnetic species, the slope change indicates a marked reduction of the contributing Cu moments by a ratio of approximately three. The Curie–Weiss temperature reflects the predominant spin exchange coupling between magnetic moments. Apparently, the magnetic species left at low temperatures remain almost uncoupled whereas at high temperatures, significant spin exchange coupling prevails. In view of the crystal structure of the 2-1-5 phase, this finding is suggestive of a scenario where a rather strongly antiferromagnetically spin exchange the coupled magnetic Cu–Cu dimer and a significantly weaker coupled Cu monomer contribute to the magnetism. The Curie contribution of the latter diverges (i.e. θ → 0) at low temperatures whereas the former condense into non-magnetic singlets with vanishing magnetic response at temperatures below the singlet–triplet splitting energy of the spin S = 1/2 Cu2+ dimers. At temperatures sufficiently high compared to the spin exchange coupling energy of the spin dimers, both sub-systems contribute to the magnetisation. Accordingly, we have fitted the magnetic susceptibility of the 2-1-5 phases to the sum of the susceptibility of a S = 1/2 dimer given by the Bleaney–Bowers equation45 and a Curie-law contribution from the monomer according to | (1) |
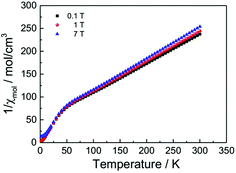 | ||
| Fig. 13 Magnetic susceptibilities of a powder sample of the 2-1-5 phase (per three Cu atoms) measured by heating the sample from 2 K to 300 K in an external field of 0.1, 1 and 7 Tesla as indicated. | ||
Fig. 14 displays a fit of the susceptibility data (7 T) to eqn (1) with parameters summarised in Table 2.
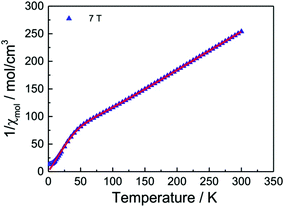 | ||
| Fig. 14 Fit of eqn (1) to the magnetic susceptibility of a powder sample of the 2-1-5 phase (per three Cu atoms) measured in an external field of 7 Tesla. | ||
| g dim | 2.19(1) |
| g mono | 2.390(5) |
| J dim | −182(1) K |
| χ 0 | 297(12) × 10−6 cm3 mol−1 |
The agreement of the fit with the experimental data is very satisfactory thus giving strong support for our model assumptions that the magnetic properties of the 2-1-5 phase decompose into two independent subsystems. The fit parameters (Table 2) indicate an antiferromagnetic spin exchange coupling of −182 K in the Cu dimer. This value is about 50% of that what is typically found e.g. in hydrated copper acetate [Cu(OAc)2·H2O]2 where values of ∼−400 K or somewhat more have been observed.48
The g factor for the dimer is close to what is expected for a powder average of the Cu2+g factors, ∼2.13–2.15.49 The g factor of the monomer is somewhat enlarged. A reason could be that an impurity phase containing Cu2+S = ½ entities contribute in the same way to the susceptibility as the Cu monomer of the 2-1-5 phase.
Conclusions
Copper(II)–acetate hydroxides (xCu(CH3COO)2·yCu(OH)2·zH2O ≡ x − y − z phase) are known as the main components of historic verdigris pigments. Incomplete precipitation from aqueous copper(II)–acetate solution at elevated temperatures using ammonia solution as a precipitating agent leads to the formation of the well characterised 1-3-2 and 1-2-0 phases. By further ageing of the mother liquors at 25 °C for one year, additional verdigris phases can be obtained. From the mother liquor from the production of the 1-3-2 phase, the hitherto poorly characterised 2-1-5 phase was crystallised. The phase composition was confirmed by crystal structure determination from laboratory XRPD data and thermal analysis. In the crystal structure of the 2-1-5 phase, copper ions are coordinated by acetate and hydroxide ions, as well as by water molecules forming distorted square planar coordination spheres. The acetate ions act as bidentate and bridging, monodentate and apical and as pseudo bidentate and pseudo bridging (i.e. there is still some interaction between the non-coordinating carboxylate oxygen and a copper ion) ligands. This is also reflected by splitting and degeneration of the symmetric and asymmetric carboxylate related C–O stretching modes in the IR-spectrum. Cu2(CH3COO)2(CH3COO)1/2(OH)4/3H2O1/6+ dimers that are interconnected by Cu(CH3COO)(CH3COO)1/2(OH)2/31/6− squares forming chains running in the c-direction are the main motif of the crystal structure of the 2-1-5 phase. This motif is reflected by the magnetic properties that show a rather strongly antiferromagnetically spin exchange coupled magnetic Cu–Cu dimer and a significantly weaker coupled Cu monomer contributing to the magnetism. In the crystal structure, additional molecules of hydrate water are situated inbetween the sheets and mediate the inter–chain interaction. These loosely bound water molecules can be easily released by heating up to temperatures >50 °C. The light blue colour of the solid originates from a reflectance maximum at 488 nm and significantly differs from known verdigris phases. An investigation of several historic verdigris pigment samples reveals that the 2-1-5 phase occurs both as minor and major components. Hence, reliable reference data for the identification of the 2-1-5 phase by XRPD or vibrational spectroscopy are now available that can be used by museums and collections worldwide to identify this verdigris phase in historic artwork and pigment samples.Conflicts of interest
There are no conflicts to declare.Acknowledgements
David A. Scott's1 enthusiasm for historic pigments and their synthesis greatly inspired our work. Julia Kröger from the Max Planck Institute for Solid State Research is acknowledged for measuring the UV/VIS spectrum, Eva Brücher from the Max Planck Institute for Solid State Research for performing the SQUID measurements, Jörg Stelzner from the State Academy of Art and Design Stuttgart for taking the Raman-spectrum and Michael X. Müller from the University of Stuttgart is acknowledged for taking the IR spectrum. Funding by DFG for the project “In search of structure” (grant EG 137/9-1) is gratefully acknowledged. Open Access funding provided by the Max Planck Society.References
- D. A. Scott, Y. Taniguchi and E. Koseto, Rev. Conserv., 2001, 2, 73–91 Search PubMed.
- H. H. A. Dollwet and J. R. J. Sorenson, Trace Elem. Med., 1985, 2, 80–87 Search PubMed.
- J. Gauthier, Rev. Gen. Sci. Pures Appl. Bull. Assoc. Fr. Av. Sci., 1959, 66, 67–78 Search PubMed.
- F. Schweizer and B. Muehlethaler, Farbe Lack, 1968, 74, 1159–1173 Search PubMed.
- G. Rahn-Koltermann, D. H. Buss, R. Fuchs and O. Glemser, Z. Naturforsch., B: Chem. Sci., 1991, 46, 1020–1024 CrossRef.
- T. D. Chaplin, R. J. H. Clark and D. A. Scott, J. Raman Spectrosc., 2006, 37, 223–229 CrossRef.
- N. Masciocchi, E. Corradi, A. Sironi, G. Moretti, G. Minelli and P. Porta, J. Solid State Chem., 1997, 131, 252–262 CrossRef.
- S. Švarcová, M. Klementová, P. Bezdička, W. Łasocha, M. Dušek and D. Hradil, Cryst. Res. Technol., 2011, 46, 1051–1057 CrossRef.
- N. Kozai, H. Mitamura, H. Fukuyama, F. Esaka and S. Komarneni, J. Mater. Res., 2005, 20, 2997–3003 CrossRef.
- A. Jiménez-López, E. Rodríguez-Castellón, P. Olivera-Pastor, P. Maireles-Torres, A. A. G. Tomlinson, D. J. Jones and J. Rozière, J. Mater. Chem., 1993, 3, 303–307 RSC.
- S. Yamanaka, Solid State Ionics, 1992, 53–56, 527–533 CrossRef.
- K. Suzuki, J. Haines, P. Rabu, K. Inoue and M. Drillon, J. Phys. Chem. C, 2008, 112, 19147–19150 Search PubMed.
- P. Rabu, M. Drillon and C. Hornick, Analusis, 2000, 28, 103–108 CrossRef.
- M. San Andrés, J. M. de la Roja, V. G. Baonza and N. Sancho, J. Raman Spectrosc., 2010, 41, 1468–1476 CrossRef.
- S. Bette, R. K. Kremer, G. Eggert, C. C. Tang and R. E. Dinnebier, Dalton Trans., 2017, 46, 14847–14858 RSC.
- S. Prati, I. Bonacini, G. Sciutto, A. Genty-Vincent, M. Cotte, M. Eveno, M. Menu and R. Mazzeo, Appl. Phys. A, 2015, 122, 1–16 Search PubMed.
- J. M. de la Roja, V. G. Baonza and M. San Andrés, Spectrochim. Acta, Part A, 2007, 68, 1120–1125 CrossRef PubMed.
- C. Santoro, K. Zarkout, A.-S. Le Hô, F. Mirambet, D. Gourier, L. Binet, S. Pagès-Camagna, S. Reguer, S. Mirabaud, Y. Du, P. Griesmar, N. Lubin-Germain and M. Menu, Appl. Phys. A, 2014, 114, 637–645 CrossRef.
- S. Yamanaka, Stud. Surf. Sci. Catal., 1994, 83, 147–153 CrossRef.
- S. Yamanaka, T. Sako and M. Hattori, Chem. Lett., 1989, 18, 1869–1872 CrossRef.
- G. Rogez, C. Massobrio, P. Rabu and M. Drillon, Chem. Soc. Rev., 2011, 40, 1031–1058 RSC.
- W. Fujita, K. Awaga and T. Yokoyama, Inorg. Chem., 1997, 36, 196–199 CrossRef.
- V. Laget, C. Hornick, P. Rabu and M. Drillon, J. Mater. Chem., 1999, 9, 169–174 RSC.
- R. Billinge, L. Campbell, J. Dunkerton, S. Foister, J. Kirby, J. Pilc, A. Roy, M. Spring and R. White, National Gallery Technical Bulletin, 1997, 18, 68–86 Search PubMed.
- S. Haseloff, PhD-thesis, Albert-Ludwigs-Universität, Freiburg im Breisgau, 2011.
- S. Bette, M. Pannach, R. E. Dinnebier and D. Freyer, Eur. J. Inorg. Chem., 2017, 2017, 1488–1497 CrossRef.
- M. Pannach, S. Bette and D. Freyer, J. Chem. Eng. Data, 2017, 62, 1384–1396 CrossRef.
- Bruker-AXS, TOPAS 6.0, 2017, Karlsruhe Search PubMed.
- A. A. Coelho, J. Appl. Crystallogr., 2003, 36, 86–95 Search PubMed.
- A. Le Bail, H. Duroy and J. L. Fourquet, Mater. Res. Bull., 1988, 23, 447–452 CrossRef.
- R. W. Cheary, A. A. Coelho and J. P. Cline, J. Res. Natl. Inst. Stand. Technol., 2004, 109, 1–25 CrossRef PubMed.
- G. Oszlanyi and A. Sueto, Acta Crystallogr., Sect. A: Found. Crystallogr., 2004, 60, 134–141 CrossRef PubMed.
- C. Baerlocher, L. B. McCusker and L. Palatinus, Z. Kristallogr., 2007, 222, 47–53 CrossRef.
- A. A. Coelho, Acta Crystallogr., Sect. A: Found. Crystallogr., 2007, 63, 400–406 CrossRef PubMed.
- A. A. Coelho, J. Appl. Crystallogr., 2000, 33, 899–908 CrossRef.
- V. Favre-Nicolin and R. Černý, Mater. Sci. Forum, 2004, 443–444, 35–38 CrossRef.
- H. M. Rietveld, J. Appl. Crystallogr., 1969, 2, 65–71 CrossRef.
- M. Aceto, A. Agostino, G. Fenoglio, A. Idone, M. Gulmini, M. Picollo, P. Ricciardi and J. K. Delaney, Anal. Methods, 2014, 6, 1488 RSC.
- P. Baraldi and G. Fabbri, Spectrochim. Acta, Part A, 1981, 37, 89–92 CrossRef.
- Z. Lin, D. Han and S. Li, J. Therm. Anal. Calorim., 2011, 107, 471–475 CrossRef.
- H. D. Lutz and M. Schmidt, Eur. J. Solid State Inorg. Chem., 1995, 32, 937–945 Search PubMed.
- E. Spinner, J. Chem. Soc., 1964, 4217–4226, 10.1039/jr9640004217.
- G. Deacon, Coord. Chem. Rev., 1980, 33, 227–250 CrossRef.
- S. A. A. Mansour, J. Therm. Anal., 1996, 46, 263–274 CrossRef.
- H. Lueken, Magnetochemie, Teubner Studienbücher, Stuttgart, Leipzig, 1999 Search PubMed.
- P. W. Selwood, Magnetochemistry, Interscience Publishers, Inc., New York, 1956 Search PubMed.
- M. G. Banks, R. K. Kremer, C. Hoch, A. Simon, B. Ouladdiaf, J. M. Broto, H. Rakoto, C. Lee and M. H. Whangbo, Phys. Rev. B: Condens. Matter, 2009, 80, 024404 CrossRef.
- B. Bleaney and K. D. Bowers, Proc. R. Soc. A, 1952, 214, 451–465 CrossRef.
- A. Abragam and B. Bleaney, Electron Paramagnetic Resonance of Transition Ions, Oxford University Press, New York, 1970 Search PubMed.
Footnotes |
| † Dedicated to Professor David A. Scott on the occasion of his 70th birthday. |
| ‡ Electronic supplementary information (ESI) available. CCDC 1840957. For ESI and crystallographic data in CIF or other electronic format see DOI: 10.1039/c8dt01758a |
| This journal is © The Royal Society of Chemistry 2018 |

